Abstract
Shear stress is an important parameter in estimating the slope stability and flow dynamics in mass movements. The ring shear test can often be employed to determine the residual shear stress because of its suitability for large deformations for assumed in situ stress and drainage conditions. Determination of the residual shear stress of weathered landslide materials composed of coarse-grained sediments was examined with respect to the shear displacement and drainage condition. Based on the experimental results, the shear stress of landslide materials has typical maximum and minimum values (i.e., peak and residual shear stress). The measured shear stress generally increases with an increase in shear speed regardless of drainage condition. In general, the residual shear stress can be measured when a relatively long shearing time is applied. The residual shear stress, which is known as the minimum shear resistance at the initiation of landslide occurrence along the pre-existing slip surface of the landslide body, is also measurable even though limited shear displacement (0.1–100 mm) and shear speed (0.1–100 mm/s) are applied. The minimum range of residual shear stress of weathered soils obtained from the ring shear tests is roughly half of the value obtained from the direct shear tests. The residual shear stress can be used to estimate the reactivation of slope movement.
1. Introduction
Rainfall-induced shallow landslides are common natural hazards in the Republic of Korea [1,2,3,4]. They often occur during heavy rainfall events, especially during the summer season (June to October). Many shallow landslides that occurred in weathered granitic and gneissic soils in mountainous region source areas have a typical soil thickness of 1–2 m. Landslide materials encountered in weathered soil deposits typically consist of sandy and gravelly grain sizes. Owing to its grain size distribution, many slope failures result in a catastrophic landslide. When a landslide occurs, it is mostly accompanied by large-scale collapse and high spreads due to the disintegration of agglomerates. In particular, they belong to debris avalanches and flows by landslide classification [5,6]. To prevent these kinds of landslide risks, deterministic and probabilistic analyses of landslide occurrences are often carried out. The mechanical properties of landslide materials are of importance for both analyses to determine the slope stability. To examine the shear characteristics of geomaterials, numerous laboratory experiments have been used, e.g., direct shear tests, triaxial compression tests, simple shear tests, and ring shear tests [7,8].
Ring shear testing is by far a very common method used to determine the residual shear resistance of landslide materials. Residual shear stress is defined as the minimum shear resistance of landslide materials to resist slope deformation. Compared with the others, the greatest advantage of this apparatus is that it is not limited by the shear displacement. A typical ring shear apparatus was used for fine-grained sediments [9,10,11], but in recent years, it can be applicable for coarse-grained sediments by using a relatively large-sized ring shear box [12,13,14,15]. The latter may cover sand- and gravel-sized particles. In addition, a ring shear apparatus was also used to examine the mechanical characteristics of landslide materials with respect to high mobilization, e.g., long runout distance and large spreads [16,17,18,19]. In the actual test program, the shear strength of soils depends on the variation in normal stress and saturation [20,21]. Saturation (or water content) may affect the shear stress development during shearing. Lower water content may cause higher shear stress for carbonaceous silty mudstone and lime mudstone [21]; dry conditions may cause higher shear stress for silty clay soil from the landslide source area [20]. Saturated cases cause higher shear stress for weathered serpentinite soil samples [22]. Interestingly, the shear thickness has almost no difference under drained and undrained conditions for a relatively high shear speed of 100 cm/s, but it is affected by imposed shear speed.
Earthquake-induced landslides can also be demonstrated by the undrained cyclic loading applied: the strength parameters, e.g., the friction angles, determined from the relation between shear stress in response to pore water pressure and displacement, can be investigated. It is well known as a phenomenon called sliding-surface liquefaction, which occurs when a landslide has rapid motion due to pore water pressure development related to the creation of particle crushing in the shear zone [23]. Compared with the typical phenomenon of liquefaction, the pore water pressure in sliding-surface liquefaction can be generated after slope failure and resulting from significant particle crushing along the shear surface at a high shear speed. This phenomenon implies that it has the potential for high landslide mobilization. It should also be noted that understanding the transitional mechanism from sliding to flow is very important to mitigate landslide hazards. However, it is still complicated to examine the development of shear stress against strain at the onset of mass movements. In this context, the shear resistance of landslide materials at the initiation stage of landslide occurrence should be determined to examine reliable slope stability.
In this paper, drainage-controlled ring shear tests were performed for landslide materials. The ring shear characteristics of landslide materials containing many sand-size particles are examined concerning different shear displacements and shearing times. The coupling of the generation of pore water pressure and the corresponding shear stress response is not a goal of this study, but the shear resistance obtained from direct shear tests and ring shear tests are compared to estimate the shear strength of landslides. First, the shear stress measurements against shear displacement and shear speed are examined. Second, particle crushing characteristics at a relatively small displacement are discussed. Finally, a brief summary and conclusions are provided.
2. Materials and Methods
2.1. Materials
The landslide materials were taken from a landslide source area that developed during ancient landside events. The soil sample passing through the No. 4 (4.75 mm) sieve is used for the ring shear tests to minimize the grain size effect. The grain sizes are mainly composed of sands and gravels, i.e., 70% sands, 20% gravels, and 10% fine particles (silts and clays). The geotechnical properties of landslide materials used for ring shear tests are summarized in Table 1. The basic properties of the materials follow: effective diameter D10 = 0.05 mm; mean diameter D50 = 0.4 mm; and uniformity coefficient Cu = 12, which indicates well-graded soil; and specific gravity Gs = 2.63. The coefficient of permeability is 1 × 10⁻³ cm/s, which is typically found in sandy soils.

Table 1.
Physical properties of landslide materials used.
2.2. Methods
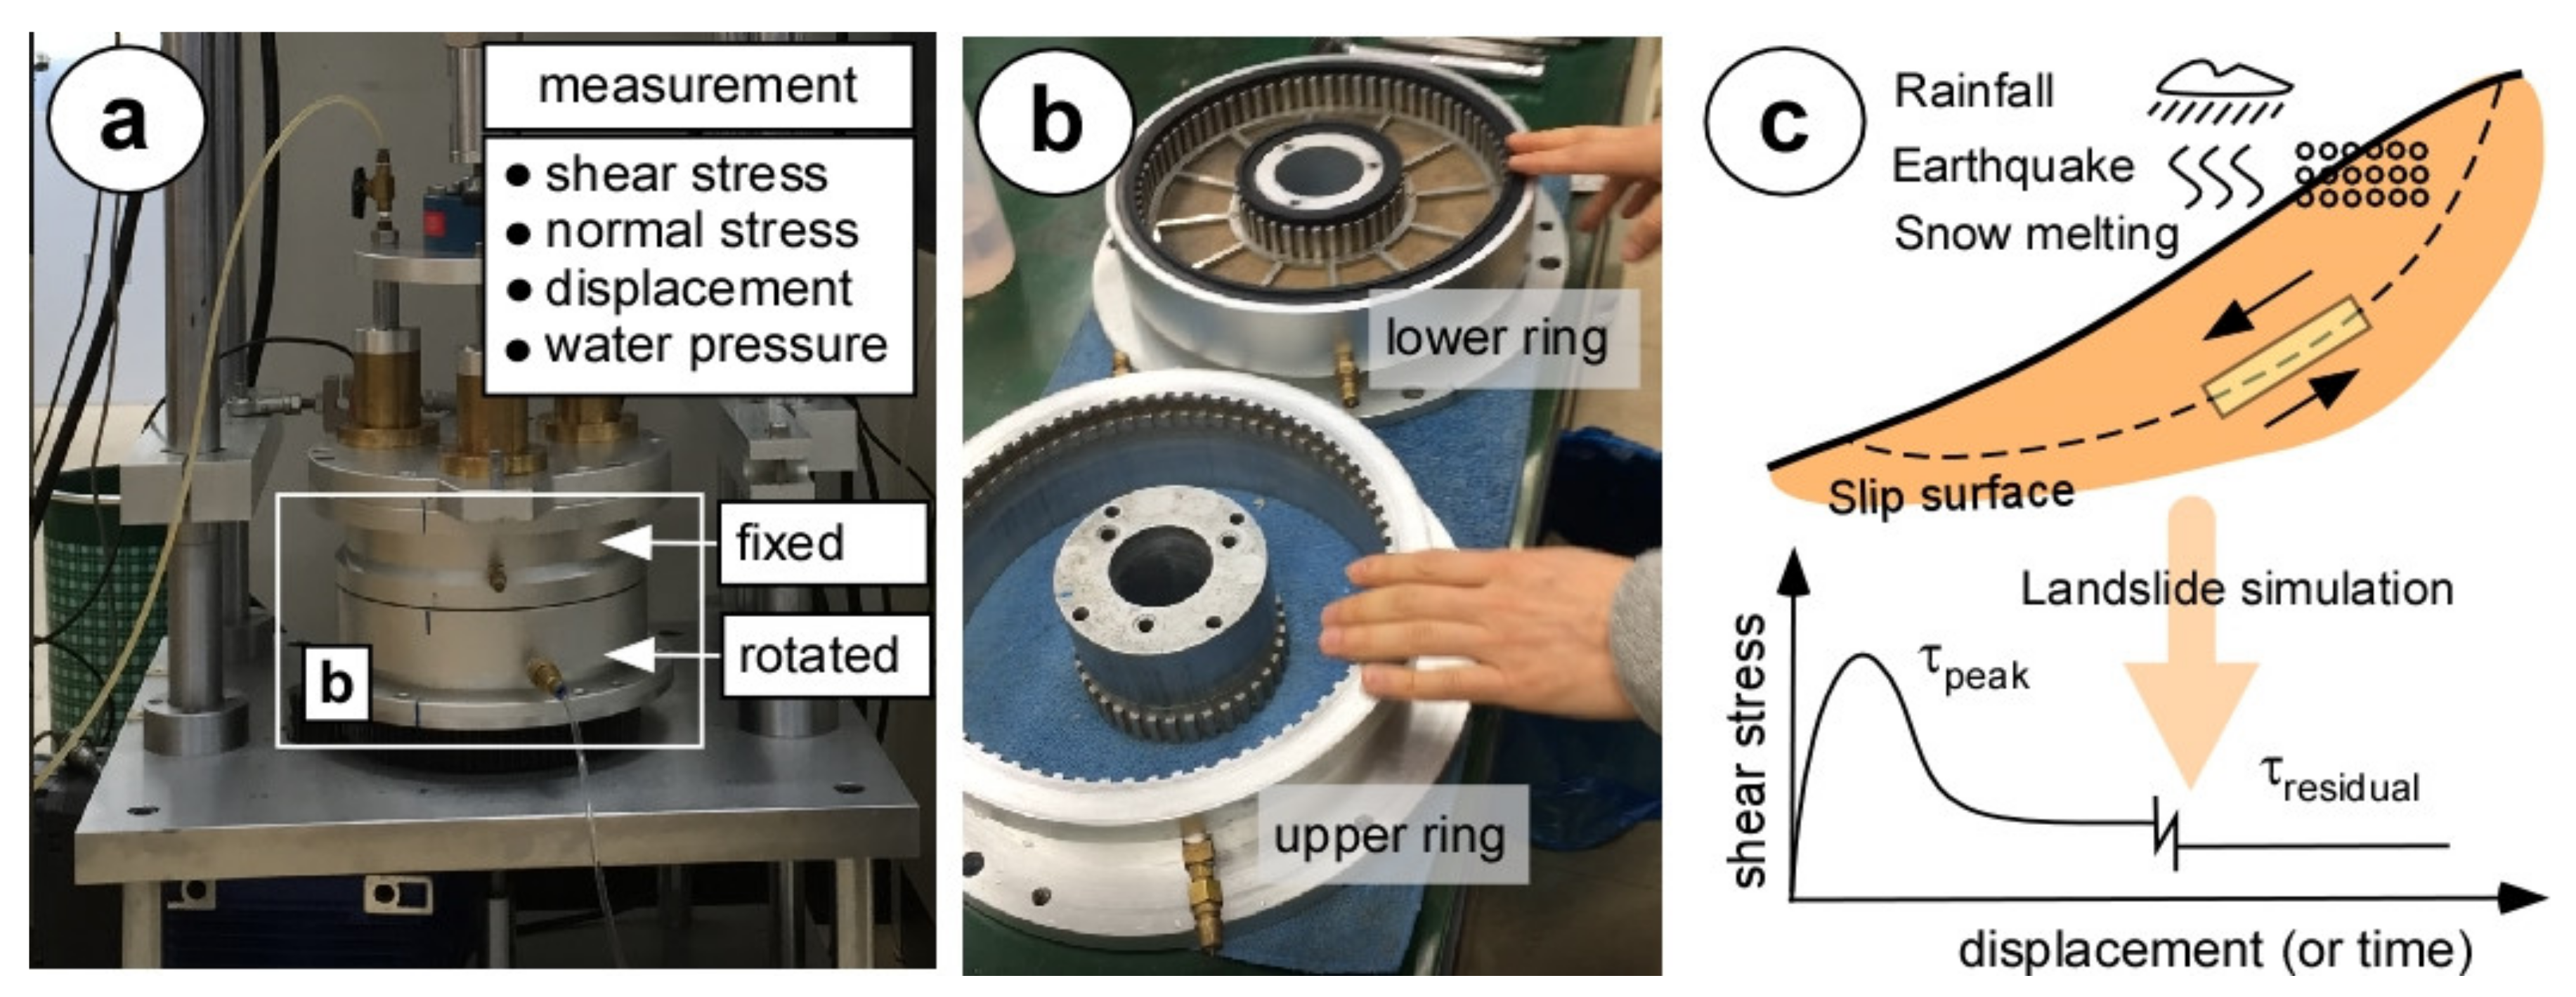
Figure 1 shows the ring shear apparatus used, a schematic illustration of the slide simulation, and the shear stress–strain relation to determine the peak and residual shear stress. The drainage-controlled ring shear apparatus has an annular-like shape of a sample box with an inner diameter of 110 mm and an outer diameter of 250 mm. Sample height is generally set for 65 to 75 mm. Owing to the dimensions of the ring shear box, it is possible to test a sample containing a large amount of coarse particles (e.g., 4500 g of sediments placed in the container). There is a rough (serrated) surface in both the upper and lower rings with 32 and 72 blades for inner and outer rough surfaces [24], respectively, to minimize slippage during shearing. The test procedure follows: sample setting, sample saturation, checking degree of saturation, consolidation, loading, and monitoring of shearing [25,26,27,28]. First, the soil sample is placed into the ring shear box. Then, water is slowly infiltrated from the bottom of the ring shear box to saturate the soil sample and to remove the air in the ring shear box. To expel the air trapped in the ring shear box, a relatively long period of time is required for clayey soils (i.e., more than 7 days) and sandy soils (i.e., more than 1 h). For landslide materials that typically have coarse-grained sediments composed of sands and gravels, saturation time is generally set to less than 24 h. After soil saturation, the targeted normal stress is loaded slowly depending on the drainage condition selected. Drainage is selected to keep the open or closed drainage valve, which is located in the ring shear box. The shear speed is selected as 0.01, 0.1, 1, 10, or 100 mm/s. During shearing, the shear speed is continuously applied for all tests. In general, the shear speed is applied for 300–3000 s. After testing, soil samples were taken from the upper, middle (shear zone), and lower ring shear box to analyze the grain size distribution. The monitoring of shear stress, normal stress, displacement, and pore water pressure is optional. In this study, shear-displacement-dependent and shear-speed-dependent shear characteristics are examined. The shear resistance is measured for rotational lengths of 10, 30, 50, 100, and 110 mm at a shear speed of 0.1 mm/s. For a given shear speed, different shearing times are also applied for approximately 1–1000 s. The shear resistance obtained is compared with that obtained from the direct shear test. Detailed test results are discussed in the next section.

Figure 1.
Ring shear apparatus: ring shear box with rough surfaces for minimizing slippage and a schematic illustration of the development of shear stress at the landslide occurrence.
3. Ring Shear Tests
3.1. Sample Consolidation, Saturation, and Drainage Condition
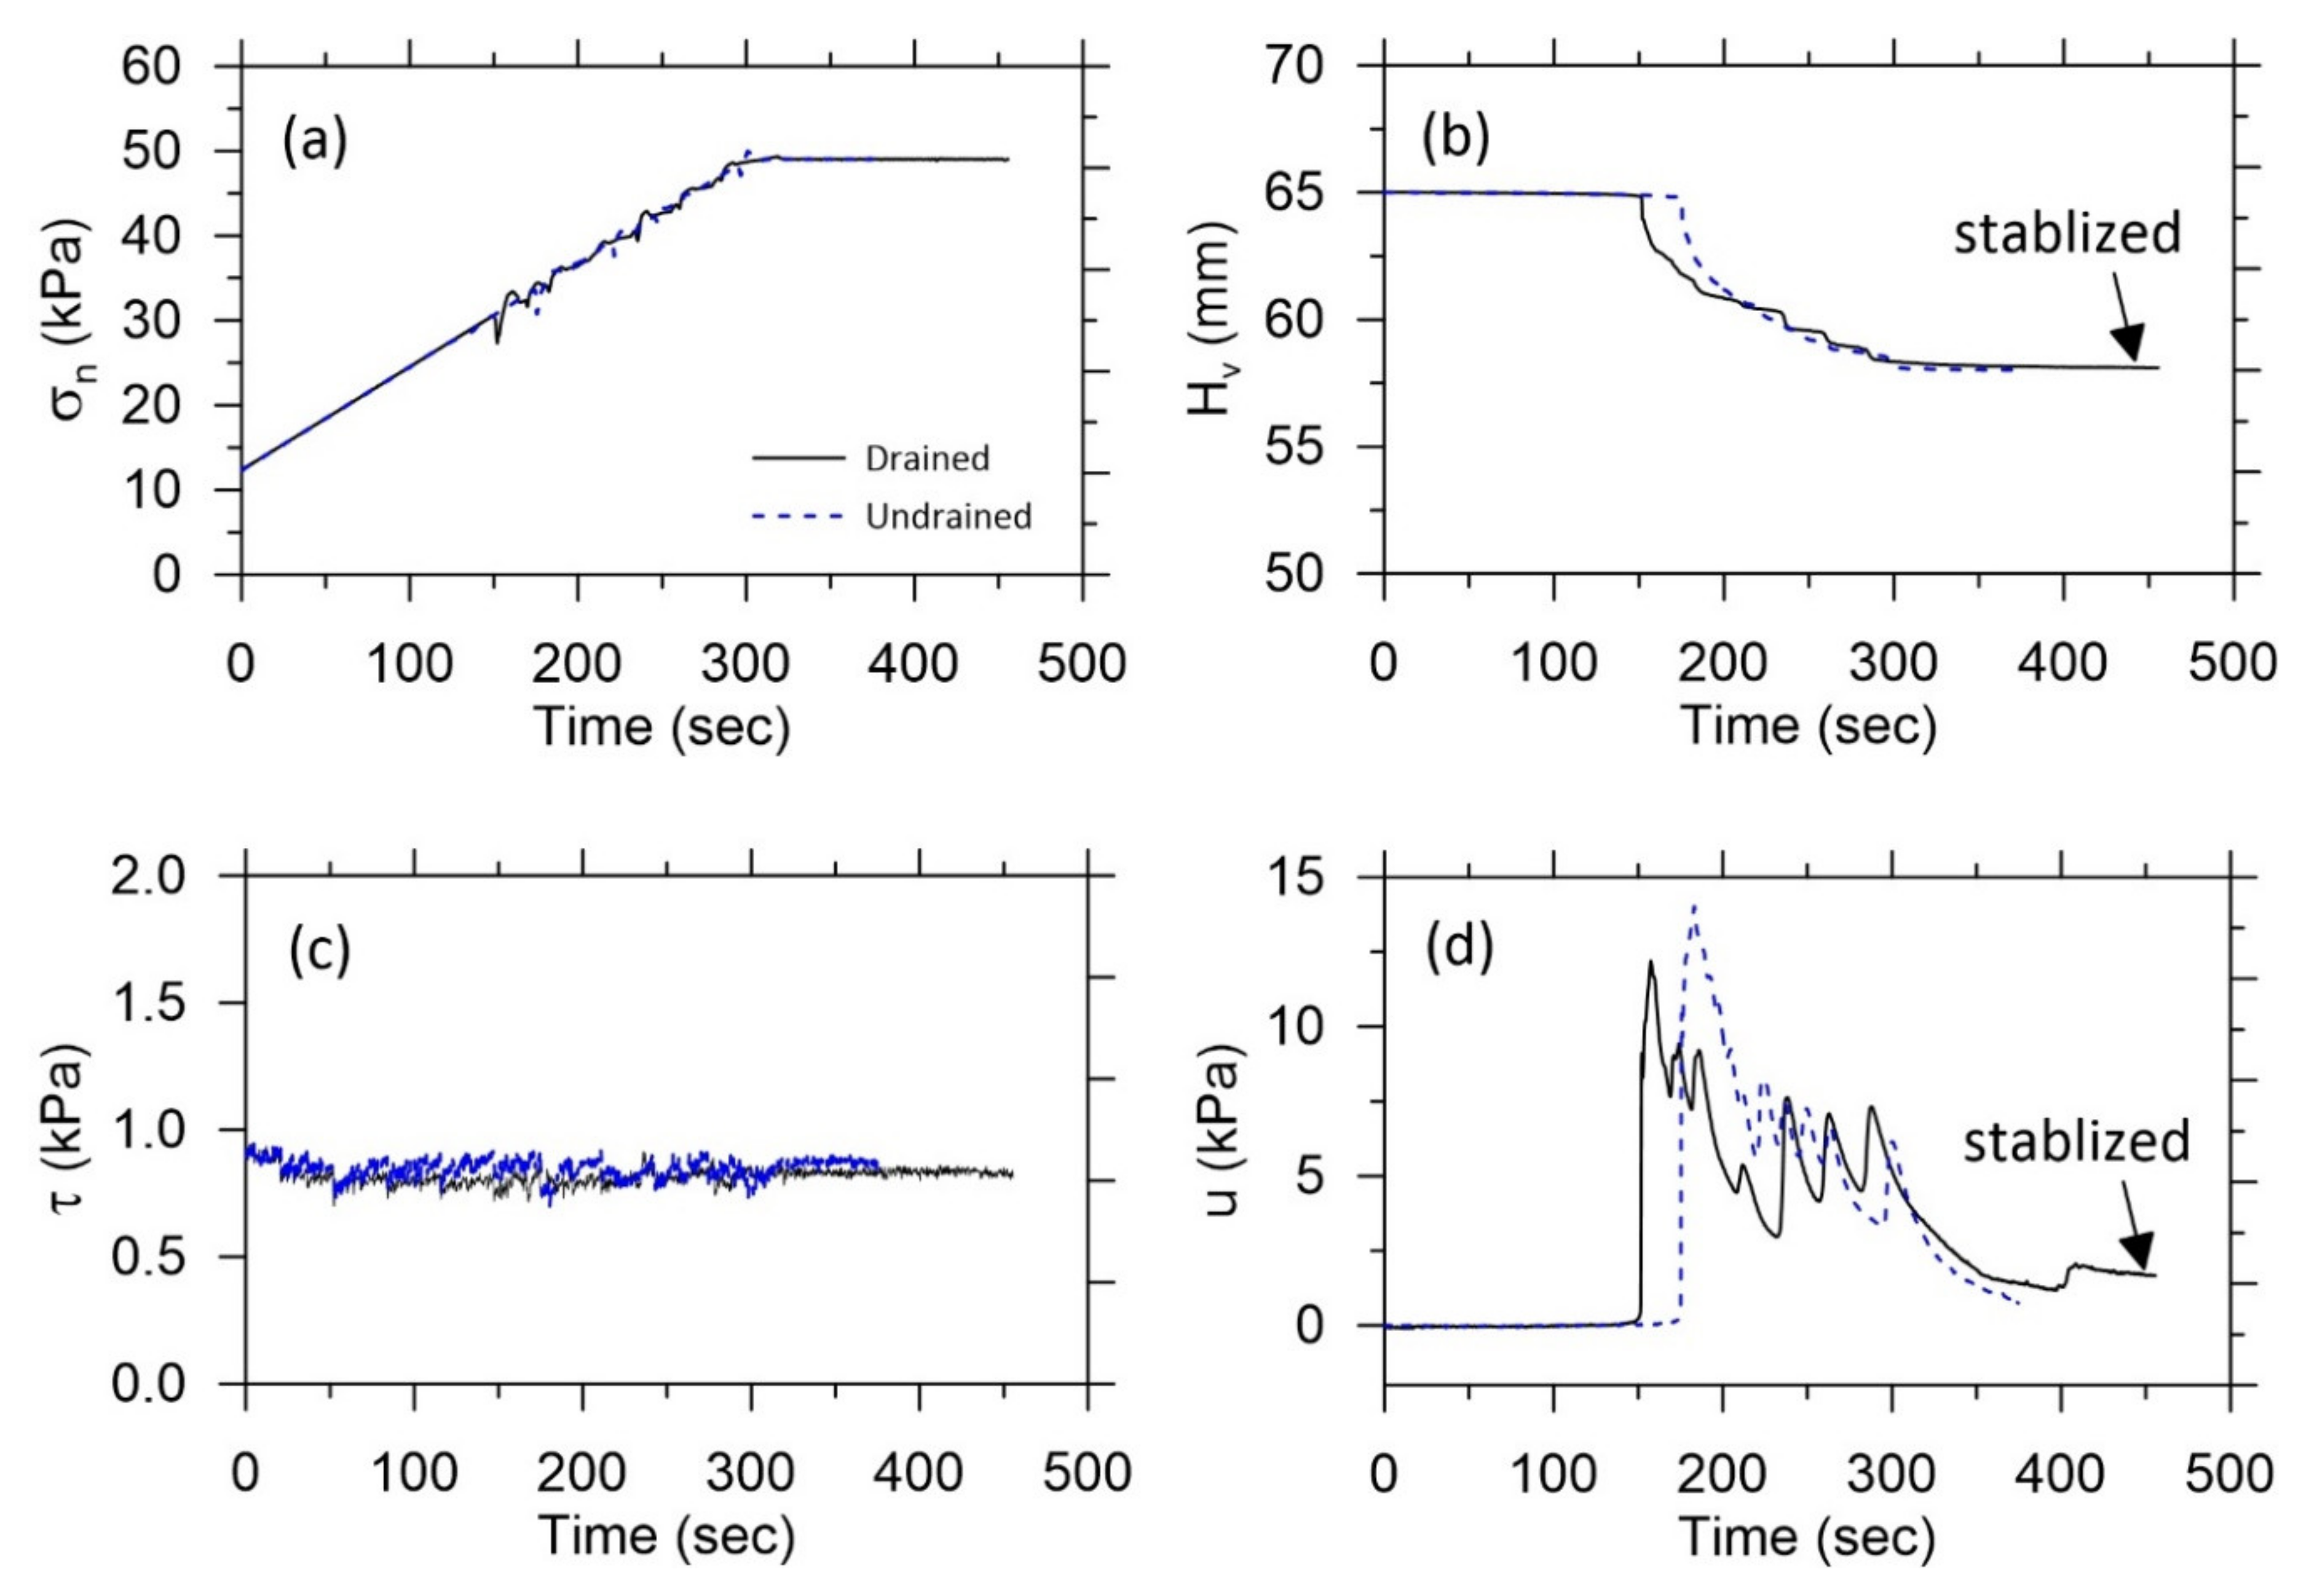
To reproduce the in situ stress conditions encountered in landslide reactivation, the normal stress and drainage should be selected. In general, normal stress is related to the soil thickness where the slip surface exists. Figure 2 shows the first order of controlling initial condition before shearing when the soil samples are mounted in the ring shear box. The soil sample is saturated slowly by injecting water into the ring shear box. It takes approximately 1 h for weathered soils composed of coarse-grained sediments. When saturation is greater than 90%, the soil sample is generally compressed without any change in internal soil conditions: it is compressed up to 50 kPa per 300 s, and then the normal stress remains constant during all tests. The section in which compression is applied affects the change in sample height and pore water pressure. As shown in Figure 2a,b, the compression is very similar in both drainage conditions. For a given case, the sample height is reduced to 7 mm at the end of compression. In most cases of granitic and gneissic weathered soils, the compressible thickness by compression is less than 10 mm [29,30]. Through the compression process, the minimum shear stress and pore pressure where the sensor is located in the middle of the ring shear box react directly at the point when compression begins on the soil sample (Figure 2c,d). An immediate response occurs in 150 s due to momentary compression and reaches 12–15 kPa, and then the measured values gradually decrease and stabilize (Figure 2b,d).
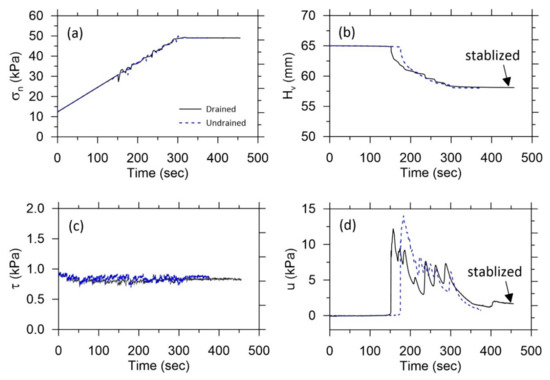
Figure 2.
Initial condition for shearing controls in ring shear tests.
3.2. Shear Stress Measurements
When the initial setup desired by the analyst is completed before the start of the experiment, all values are set to zero before preparing the next step for conducting the experiment, i.e., selection of normal stress, shearing speed, and drainage condition. For a given test condition, the normal stress and sample height remain constant during shearing. The drainage condition is selected to reproduce the drained (opened valve) or undrained condition (closed valve in the ring shear box). Finally, the desired shear speed is selected. In this study, the shear speed is limited to the range 0.1 to 100 mm/s. At a shear speed higher than 100 mm/s, the rubber edge in the ring shear box may break and result in water leakage; thus, tests were performed at a limited shear speed. Therefore, the test results may correspond to a landslide moving at a very slow or moderate rate. Figure 3 shows the test results in which the samples are subjected to a normal stress of 50 kPa and a shearing speed of 0.1 mm/s for both drained and undrained conditions. The shear stress and pore water pressure are measured for 500 s. Both typically exhibit strain-softening behavior, i.e., they have peak and residual value. The maximum value (i.e., peak stress) was observed in the shear stress–shearing time curve. The shear stress showed an immediate reaction in approximately 10 s in the drained condition, while it reacted in approximately 40 s in the undrained condition. The difference may be due to the existence of ambient water in the shear zone in the ring shear box because strong contact between particles and particles can occur in the drained condition rather than the undrained condition. In this case, the shear stress measured in the undrained condition is slightly larger than that in the drained case. The differences at the peak and residual states are approximately 10 and 2–3 kPa, respectively. It should be noted, however, that the difference in shear stress is generally very small when the shear speed is given by a relatively low value (e.g., ≤0.1 mm/s), regardless of the drainage condition. The pore water pressure is not significant in the drained condition, but it is gradually increased and stabilized in approximately 300 s in the undrained condition. The maximum pore pressure in the undrained condition is approximately 1 kPa. In this case, it is actually not a sufficiently high value to affect the determination of shear stress. However, the value of pore water pressure generally depends on the shearing speed [26]. Most of the experimental results showed a similar trend. In this study, the shear strength depending on the shear displacement and speed according to the drainage condition is investigated.
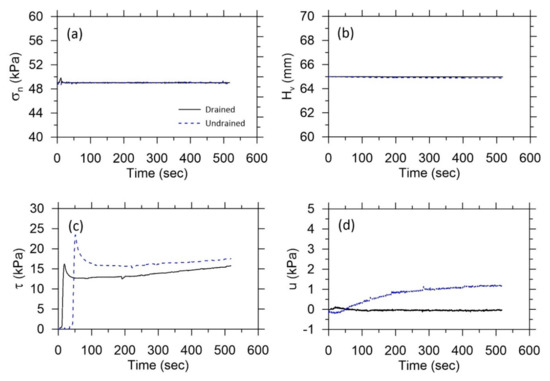
Figure 3.
Drained and undrained shear stress measured in ring shear tests: displacement = 50 mm.
4. Results and Discussions
A series of ring shear tests were conducted for the landslide materials with respect to the shear displacement and shearing time in drainage-control ring shear tests. The following are discussed: (a) shear stress and shear displacement, (b) particle crushing and shear displacement, (c) determination of peak and residual shear stress depending on drainage conditions, and (d) determination of shear strength of landslide materials with respect to the initiation of landslides in weathered soils.
4.1. Shear Stress and Shear Displacement
To examine the effect of shear displacement on the shear stress, the shear stress–displacement curves were plotted at the same normal stress of 50 kPa and shearing speed of 0.1 mm/s. A shear speed of 0.1 mm/s can be considered a moderate landslide rate [31]. Figure 4 presents the results of shear stress–displacement curves obtained from the drained and undrained conditions at different shear displacements, i.e., shearing lengths equal to 10, 30, 50, 100, 110 mm in ring shear tests, corresponding to strains of 2, 5, 9, 18, and 20%. Comparing the test results obtained from the commercial direct shear tests (less than 10 mm), it can be seen that the shear displacement is relatively large. For both drainage conditions, the peak shear stresses range between 25 and 30 kPa at the initial shearing condition. The peak value can be obtained before a displacement of 5 mm. The residual shear stresses range between 10 and 15 kPa in the drained condition and 15–20 kPa in the undrained conditions. Some dilatancy, which is explained as the volume change phenomenon in granular materials, can be observed when the materials are shearing longer, especially for shear displacements greater than 50 mm. This may be because the loading, abrasion, and crushing are distinct; thus, fine particles are produced by the crushing effect. Because of continued shearing, the potential of the shear zone begins to develop even though a relatively low shearing speed is applied (i.e., 0.1 mm/s). Sassa and others [23] presented the shear zone and grain crushing effect due to the shearing time in ring shear tests at a relatively high shearing time (i.e., 3000 mm/s, which corresponds to extremely high landslide movement). According to Fukuoka and colleagues [28], the shear zone may be created due to the mixing of grain sizes in the container. Fine particles move downward and large particles move upward. After the mixing and rearrangement of soil particles themselves, large particles concentrate in the vicinity of the shear zone. This process is repeated continuously, and the shear strength decreases when the particles in the ring shear box are fully fragmented at a large deformation.
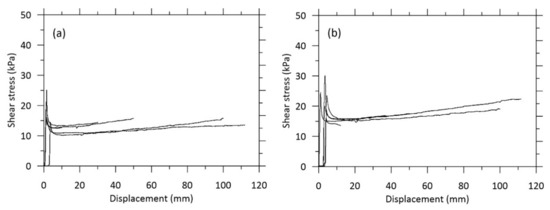
Figure 4.
Shear stress and displacement as a function of rotation at 10, 30, 50, 100, and 110 mm. Shear characteristics and determination of residual shear stress with shear displacement for (a) drained and (b) undrained conditions.
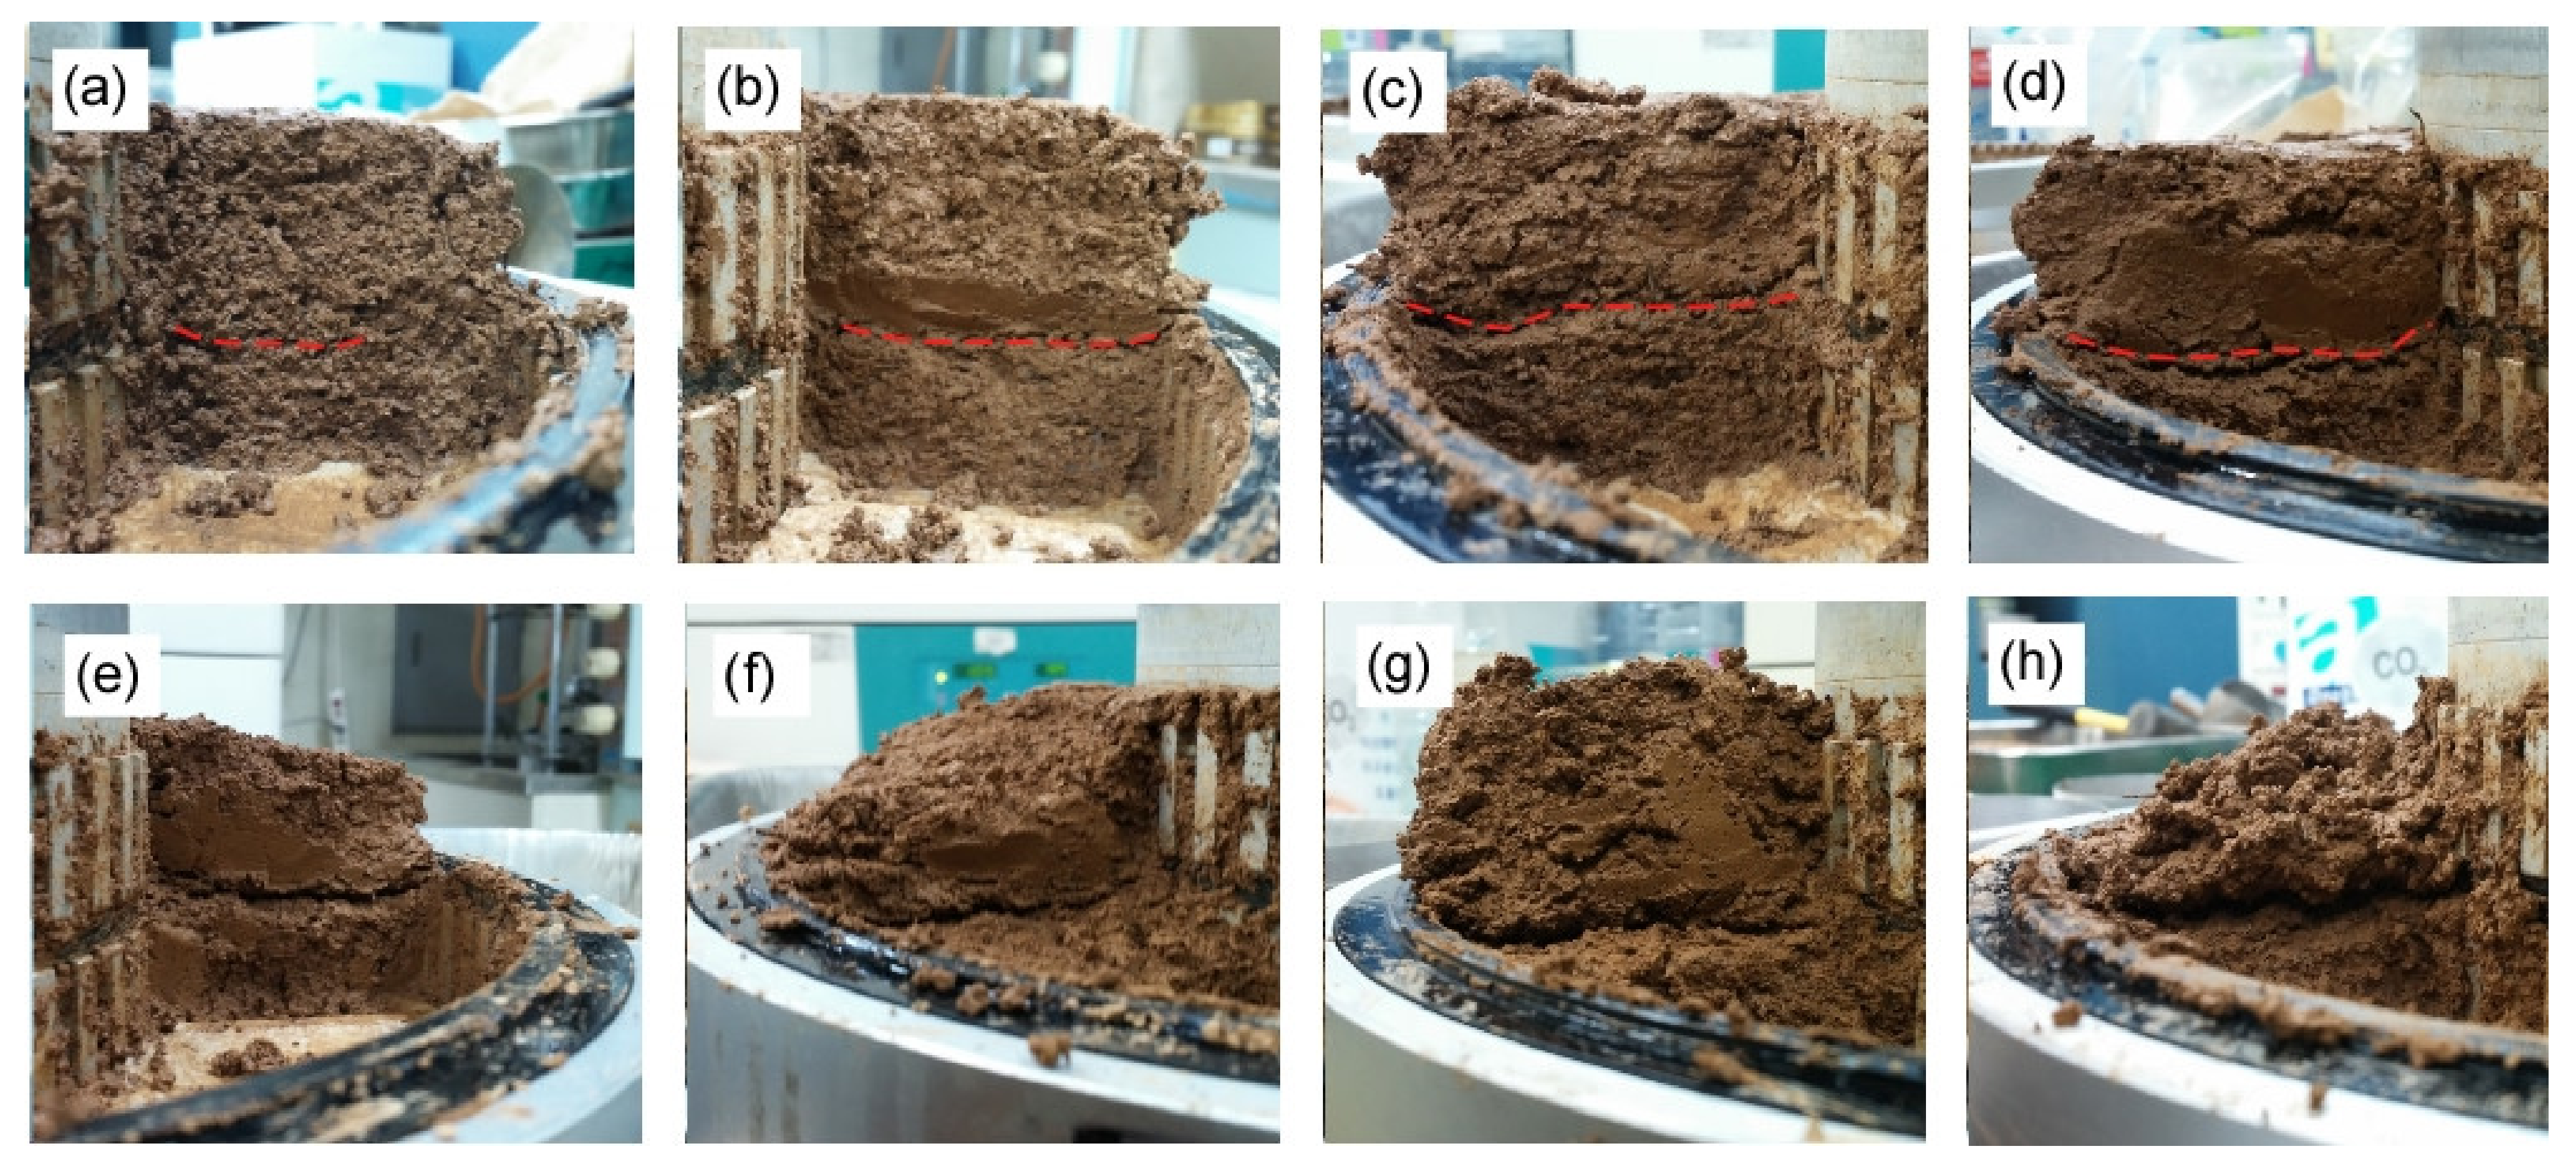
4.2. Shear Surface and Grain Crushing before and after Testing
In landslide movements, the larger the particle is, the greater the shear resistance [30]. This means that strong interactions between soil particles are unavoidable during mass movement. In the post-failure stage, spreading and high mobilization of debris flow transformed from the initial slope failure may be influenced by mixing with broken landslide sediments of pre-existing deposition in the flow channel. It should be noted that the landslide materials on natural slopes have various grain sizes. They typically consist of very fine particles, sand, and gravel (pebbles and cobbles) to boulder sizes. Landslide mobilization, e.g., runout distance and velocity, is also strongly affected by the grain size distribution. One of the greatest advantages of this experiment is that the shear surface in the soil sample can be actually observed.
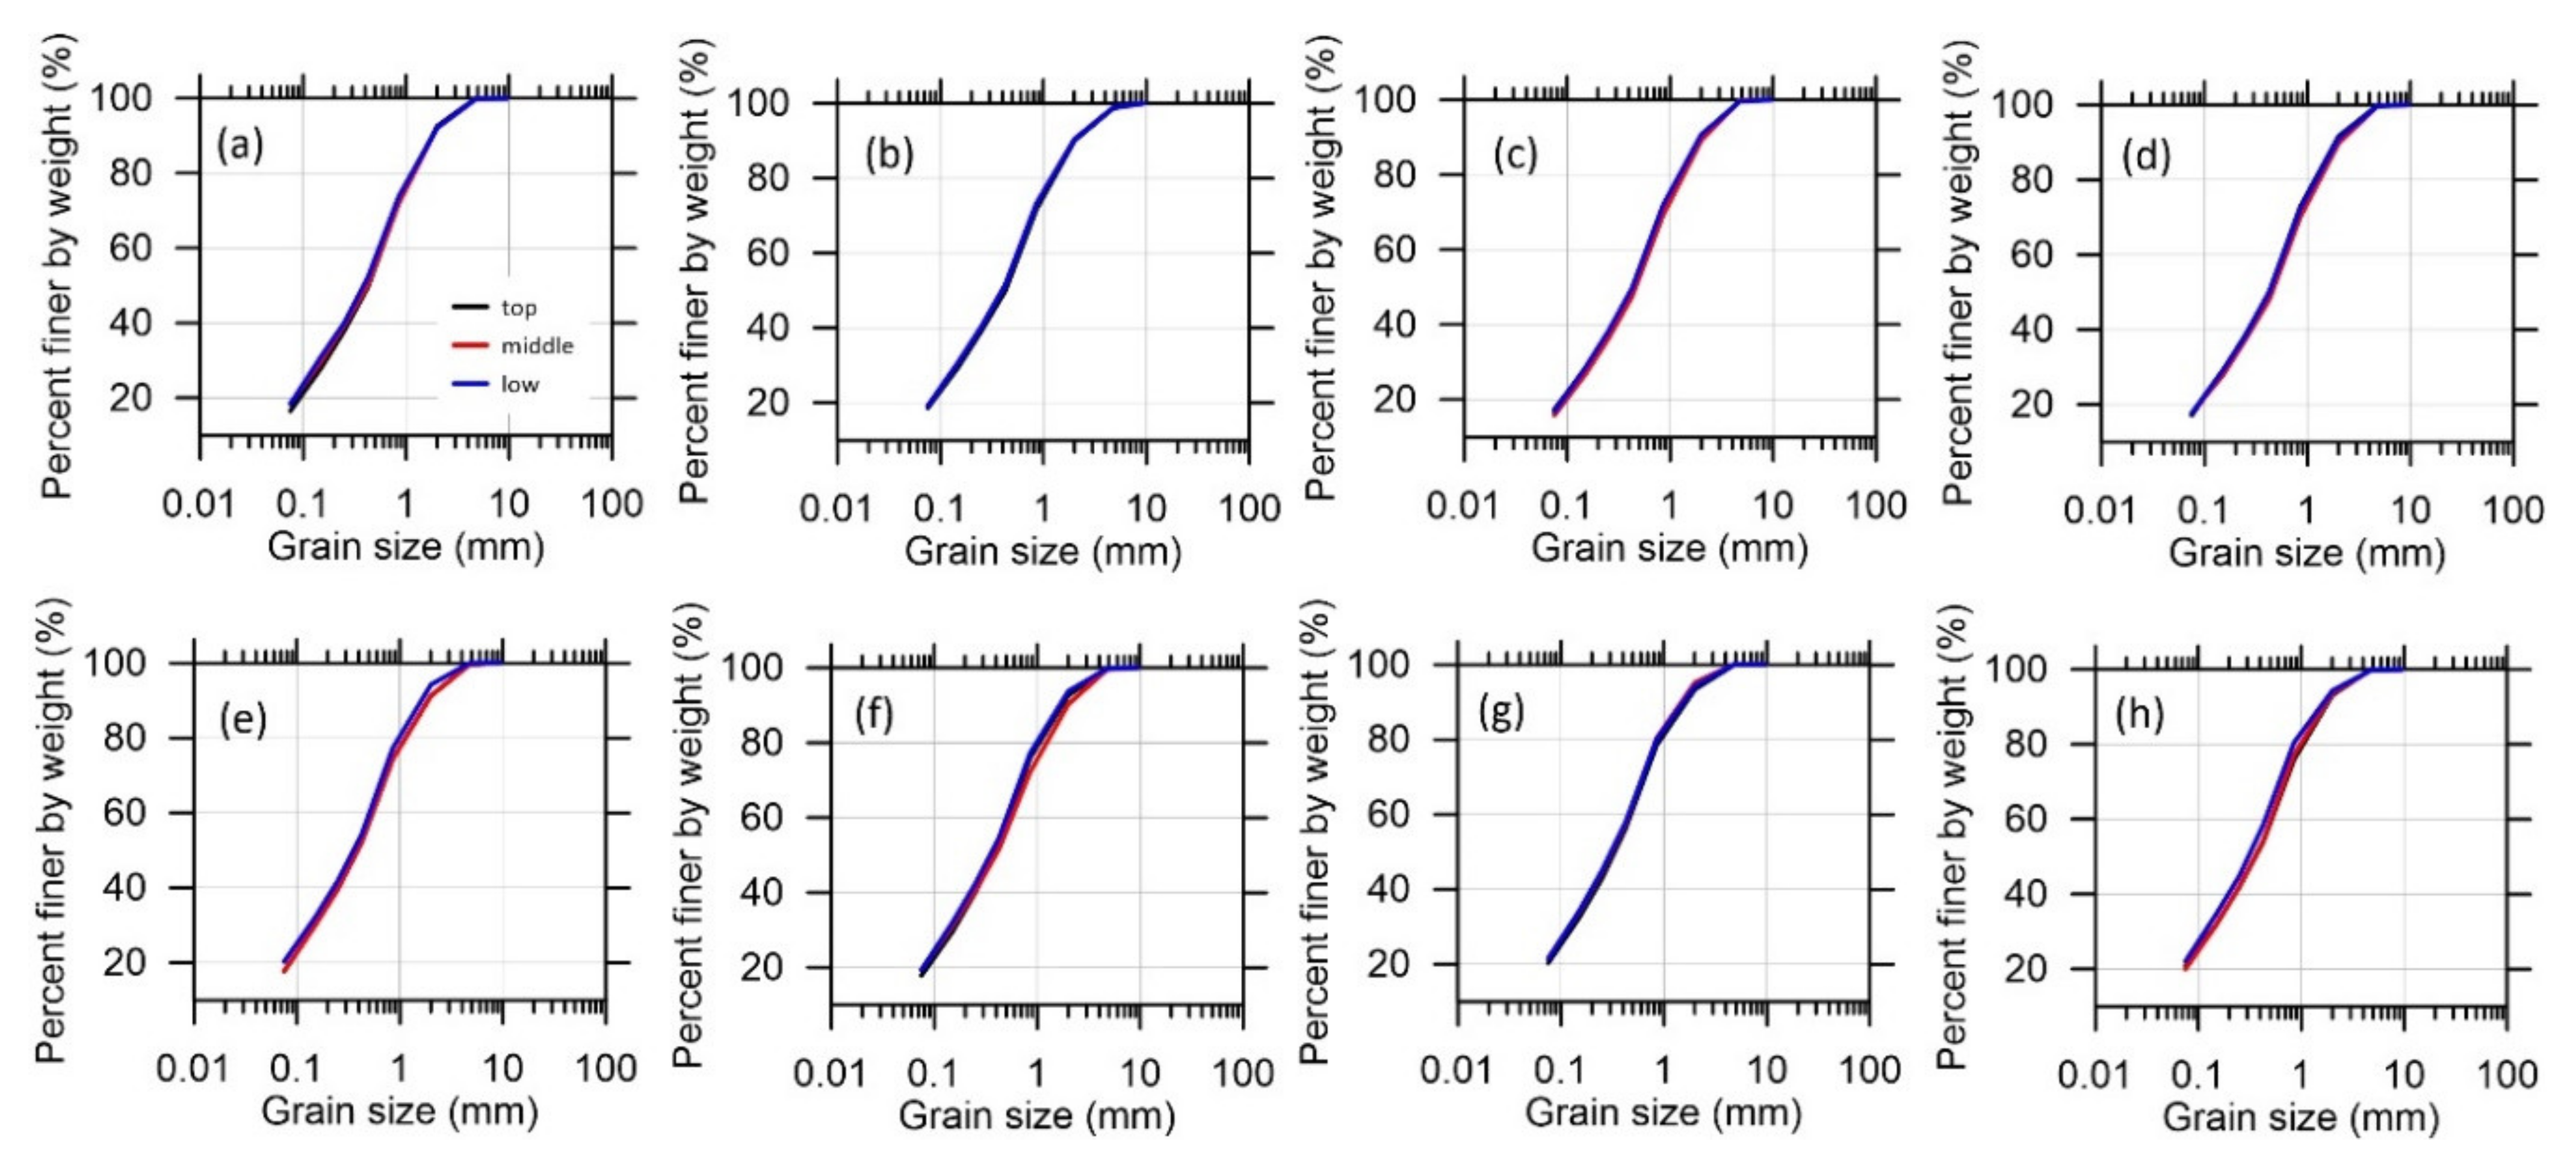
Figure 5 shows the shear surface that is observed for a given shear displacement of 10, 30, 50, and 100 mm. It is sufficiently long to observe the shear surface even though part of the sample was damaged in the process of removing the upper ring (Figure 5f,h). In general, the longer the shear displacement, the more fractural and fragmentation phenomena appeared. In Figure 5, the difference in the grain size distribution indicates the particle crushing effect [32,33]. However, it is difficult to examine the degree of crushing effect in laboratory experiments. For a given shear displacement, the difference in grain size distribution is very small, regardless of drainage condition, because the soil samples are typical weathered soils subjected to limited shearing time. Interestingly, the area of the shear surface is clearly visible and observed for all tests. The sample was divided into three parts, i.e., upper, middle, and lower parts, to perform the grain size distribution experiments. Figure 6 shows the results of grain size distribution by sieving analysis. As observed by Fukuoka et al. [27], the grain crushing effect is significant for sandy and gravelly soils subjected to high shearing speeds (i.e., maximum 1000–3000 mm/s) in the confined container. Compared with this study, it differs by one order of magnitude. The main difference lies in the rotational distance (i.e., shear displacement) applied to the test. According to previous research performed by Fukuoka and colleagues [26,27], the shear displacement can reach approximately 3000 cm. In this study, the rotation was limited to 100 mm owing to the prevention of water leakage and destruction of the rubber edge in the ring shear box. This can lead to a large difference in the results. There are limitations in this study to overcome in the future.

Figure 5.
Shear surface observed after testing: (a,b) 10 mm, (c,d) 30 mm, (e,f) 50 mm, and (g,h) 100 mm rotation; (a,c,e,g) = drained; (b,d,f,h) = undrained condition.
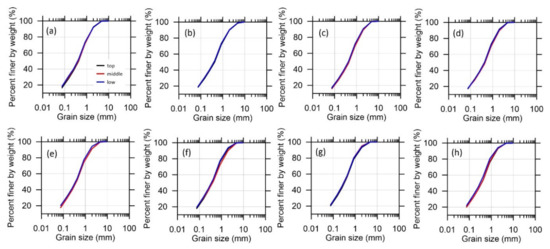
Figure 6.
Grain size distribution obtained from the top, middle, and lower parts of the ring shear cylinder after shearing. The order is the same as shown in Figure 5.
4.3. Peak and Residual Shear Stress as a Function of Shearing Time
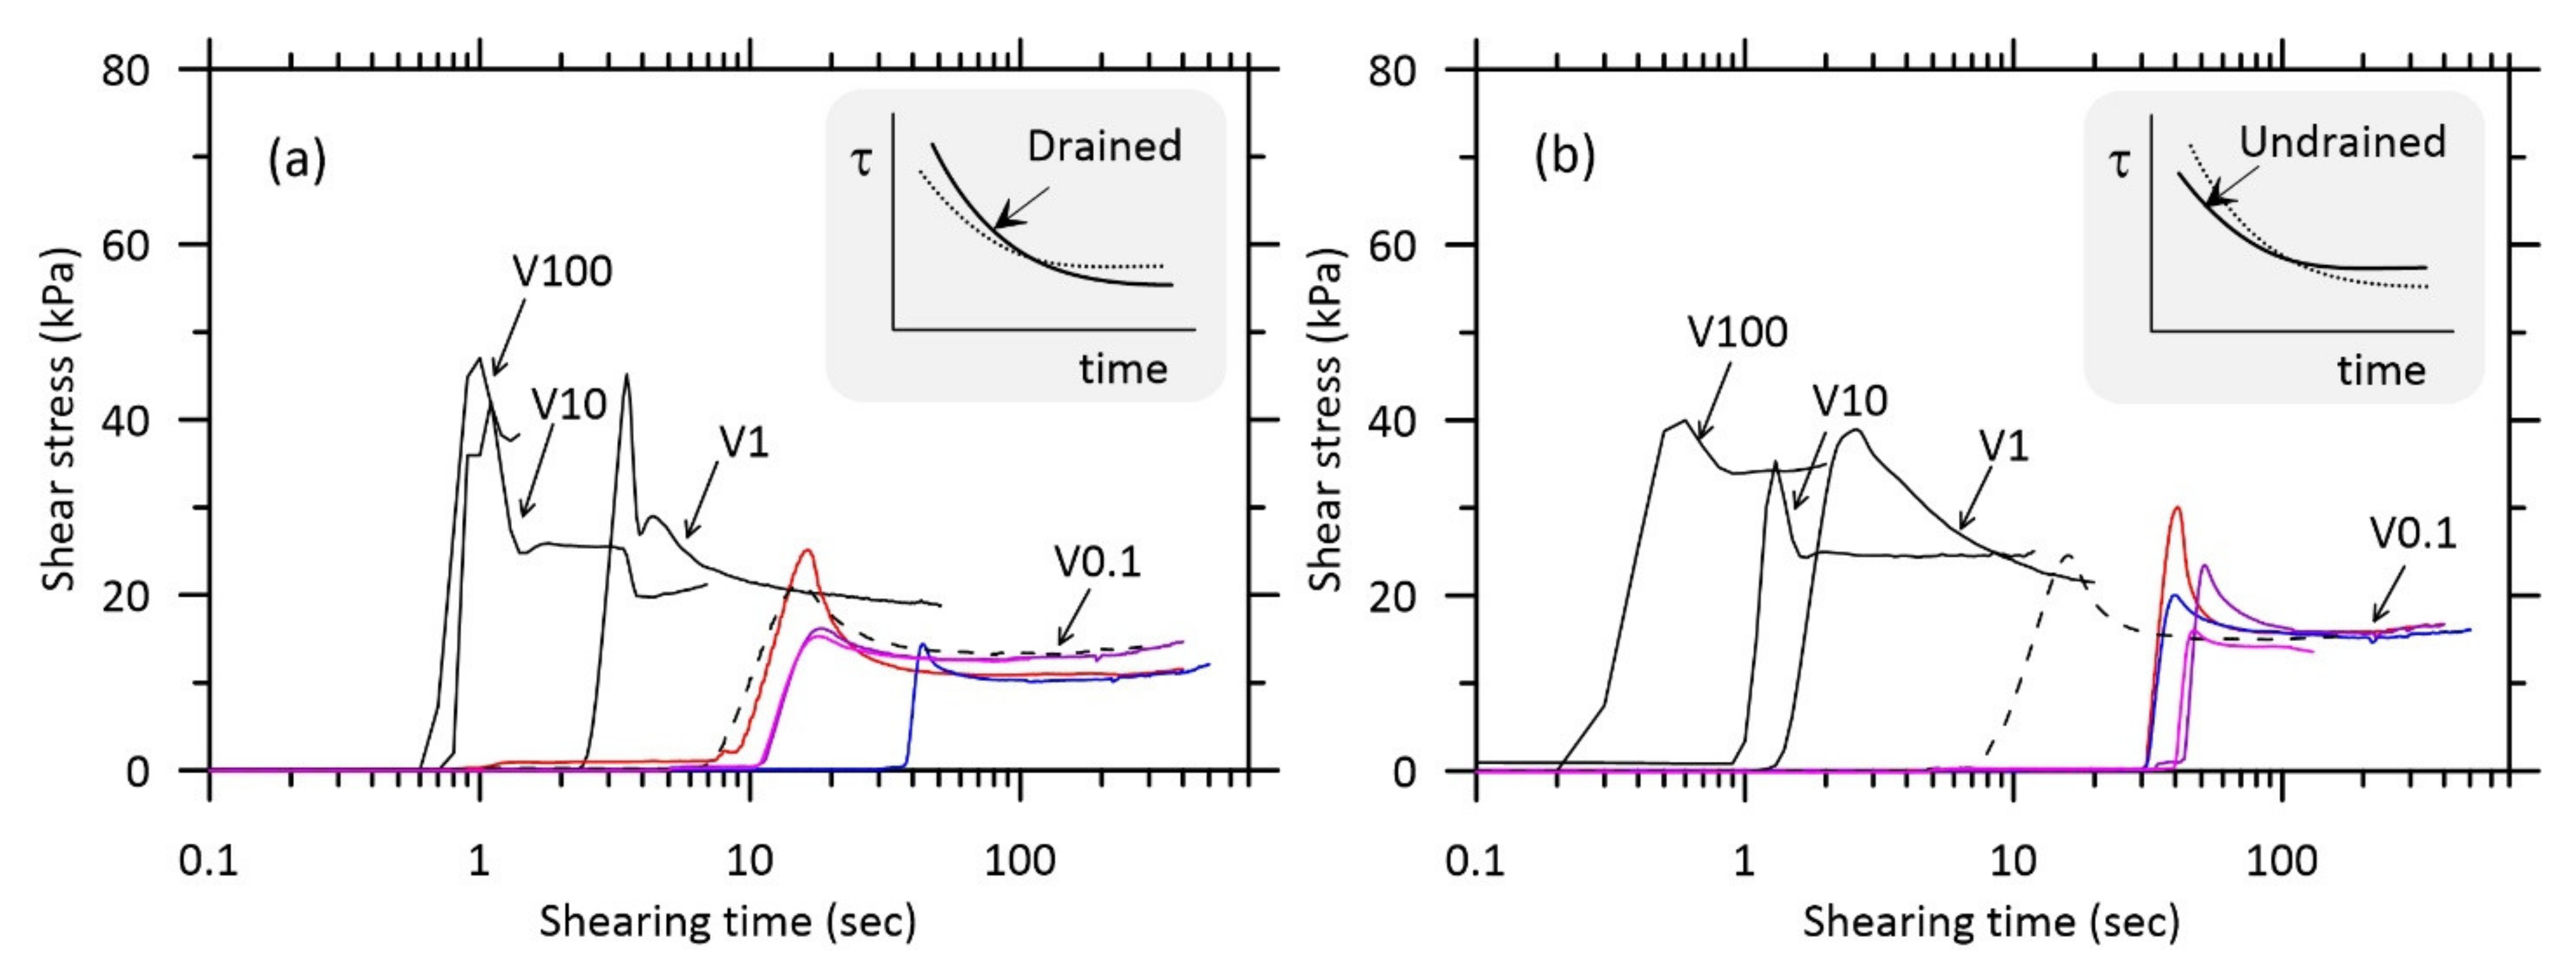
Figure 7 presents the shear stress curves dependent on the shearing speed under different drainage conditions. The shearing speeds applied were 0.1, 1, 10, and 100 mm/s. The main purpose of the selected shear speed is to examine the shear stress at the initiation of landslide movement. To ensure the reliability of the measurements, the lowest speed (i.e., 0.1 mm/s) was applied repeatedly five times. It is generally believed that the shear stress decreases with a decrease in shearing speed. Compared with the highest speed (i.e., 100 mm/s), the peak value is similar with speeds of 1 and 10 mm/s (e.g., the peak value is approximately 40 kPa in both drainage conditions), but the lowest value is relatively small; for example, the peak value is approximately 40 kPa, and the residual shear stress is 10–15 kPa in both drainage conditions. It is also interesting that the shear stress seems to decrease from high to low shear stress and stabilize when the speed has the lowest value. In addition, the difference in shear stresses dependent on the shear speed applied in the drained condition is higher than that in the undrained condition; the difference is approximately 30 kPa in the drained condition and 20 kPa in the undrained condition. This means that the interaction and rolling and the fracture effect between particles in the drained condition are more significant actions than those in the undrained condition.
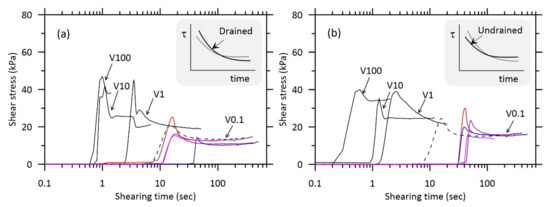
Figure 7.
Shear stress and shearing time: (a) drained and (b) undrained conditions.
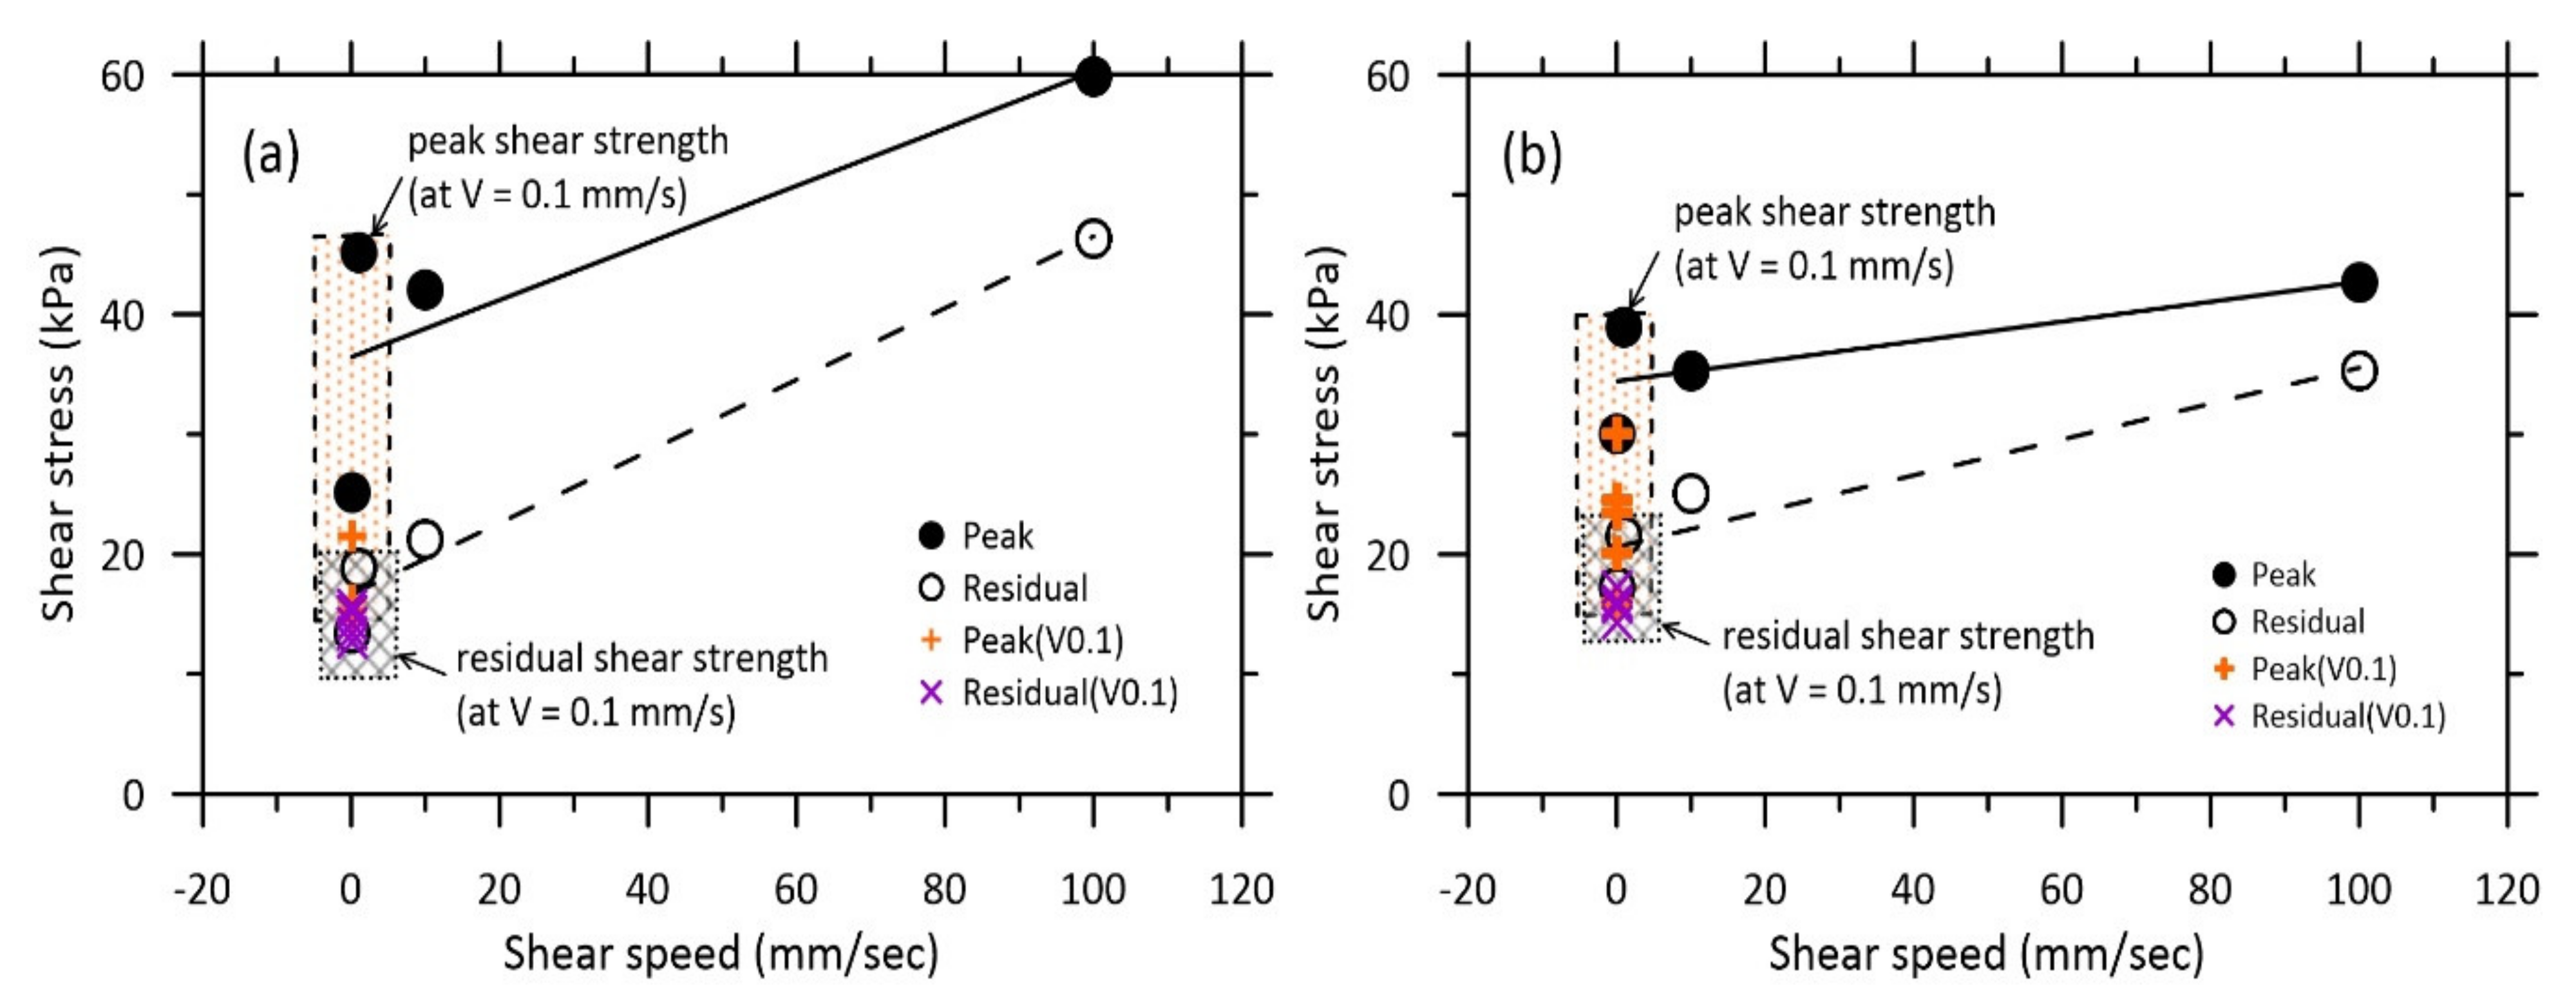
Figure 8 presents the influence of shear speed on shear stress in the drained and undrained conditions. As previously discussed, the shear stress is dependent on the shear speed, regardless of the drainage condition. The increase in shear stress in the drained condition is much higher than that in the undrained condition (i.e., the slopes obtained are 0.24 and 0.08 in the drained and undrained conditions, respectively). The shaded box zones are the range observed for peak and residual shear stress obtained at the shear speed of 0.1 mm/s. The range obtained from the peak shear stress is much larger than that from the residual shear stress. This may be because the shear resistance can be influenced by the development of the slip surface. The maximum range of peak and residual values was approximately 25–35 and 10 kPa, respectively, under both drainage conditions. The difference is very small in the residual state; as expected, the shear resistance in the residual state is measured along the existing slip surface. For a given normal stress and shear speed, it seems that the residual shear stress is not strongly dependent on the drainage condition.
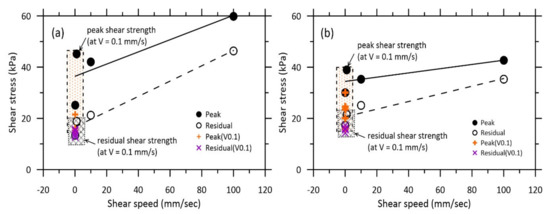
Figure 8.
Shear stress as a function of shearing speed: (a) drained and (b) undrained conditions.
4.4. Determination of Shear Strength of Landslide Materials
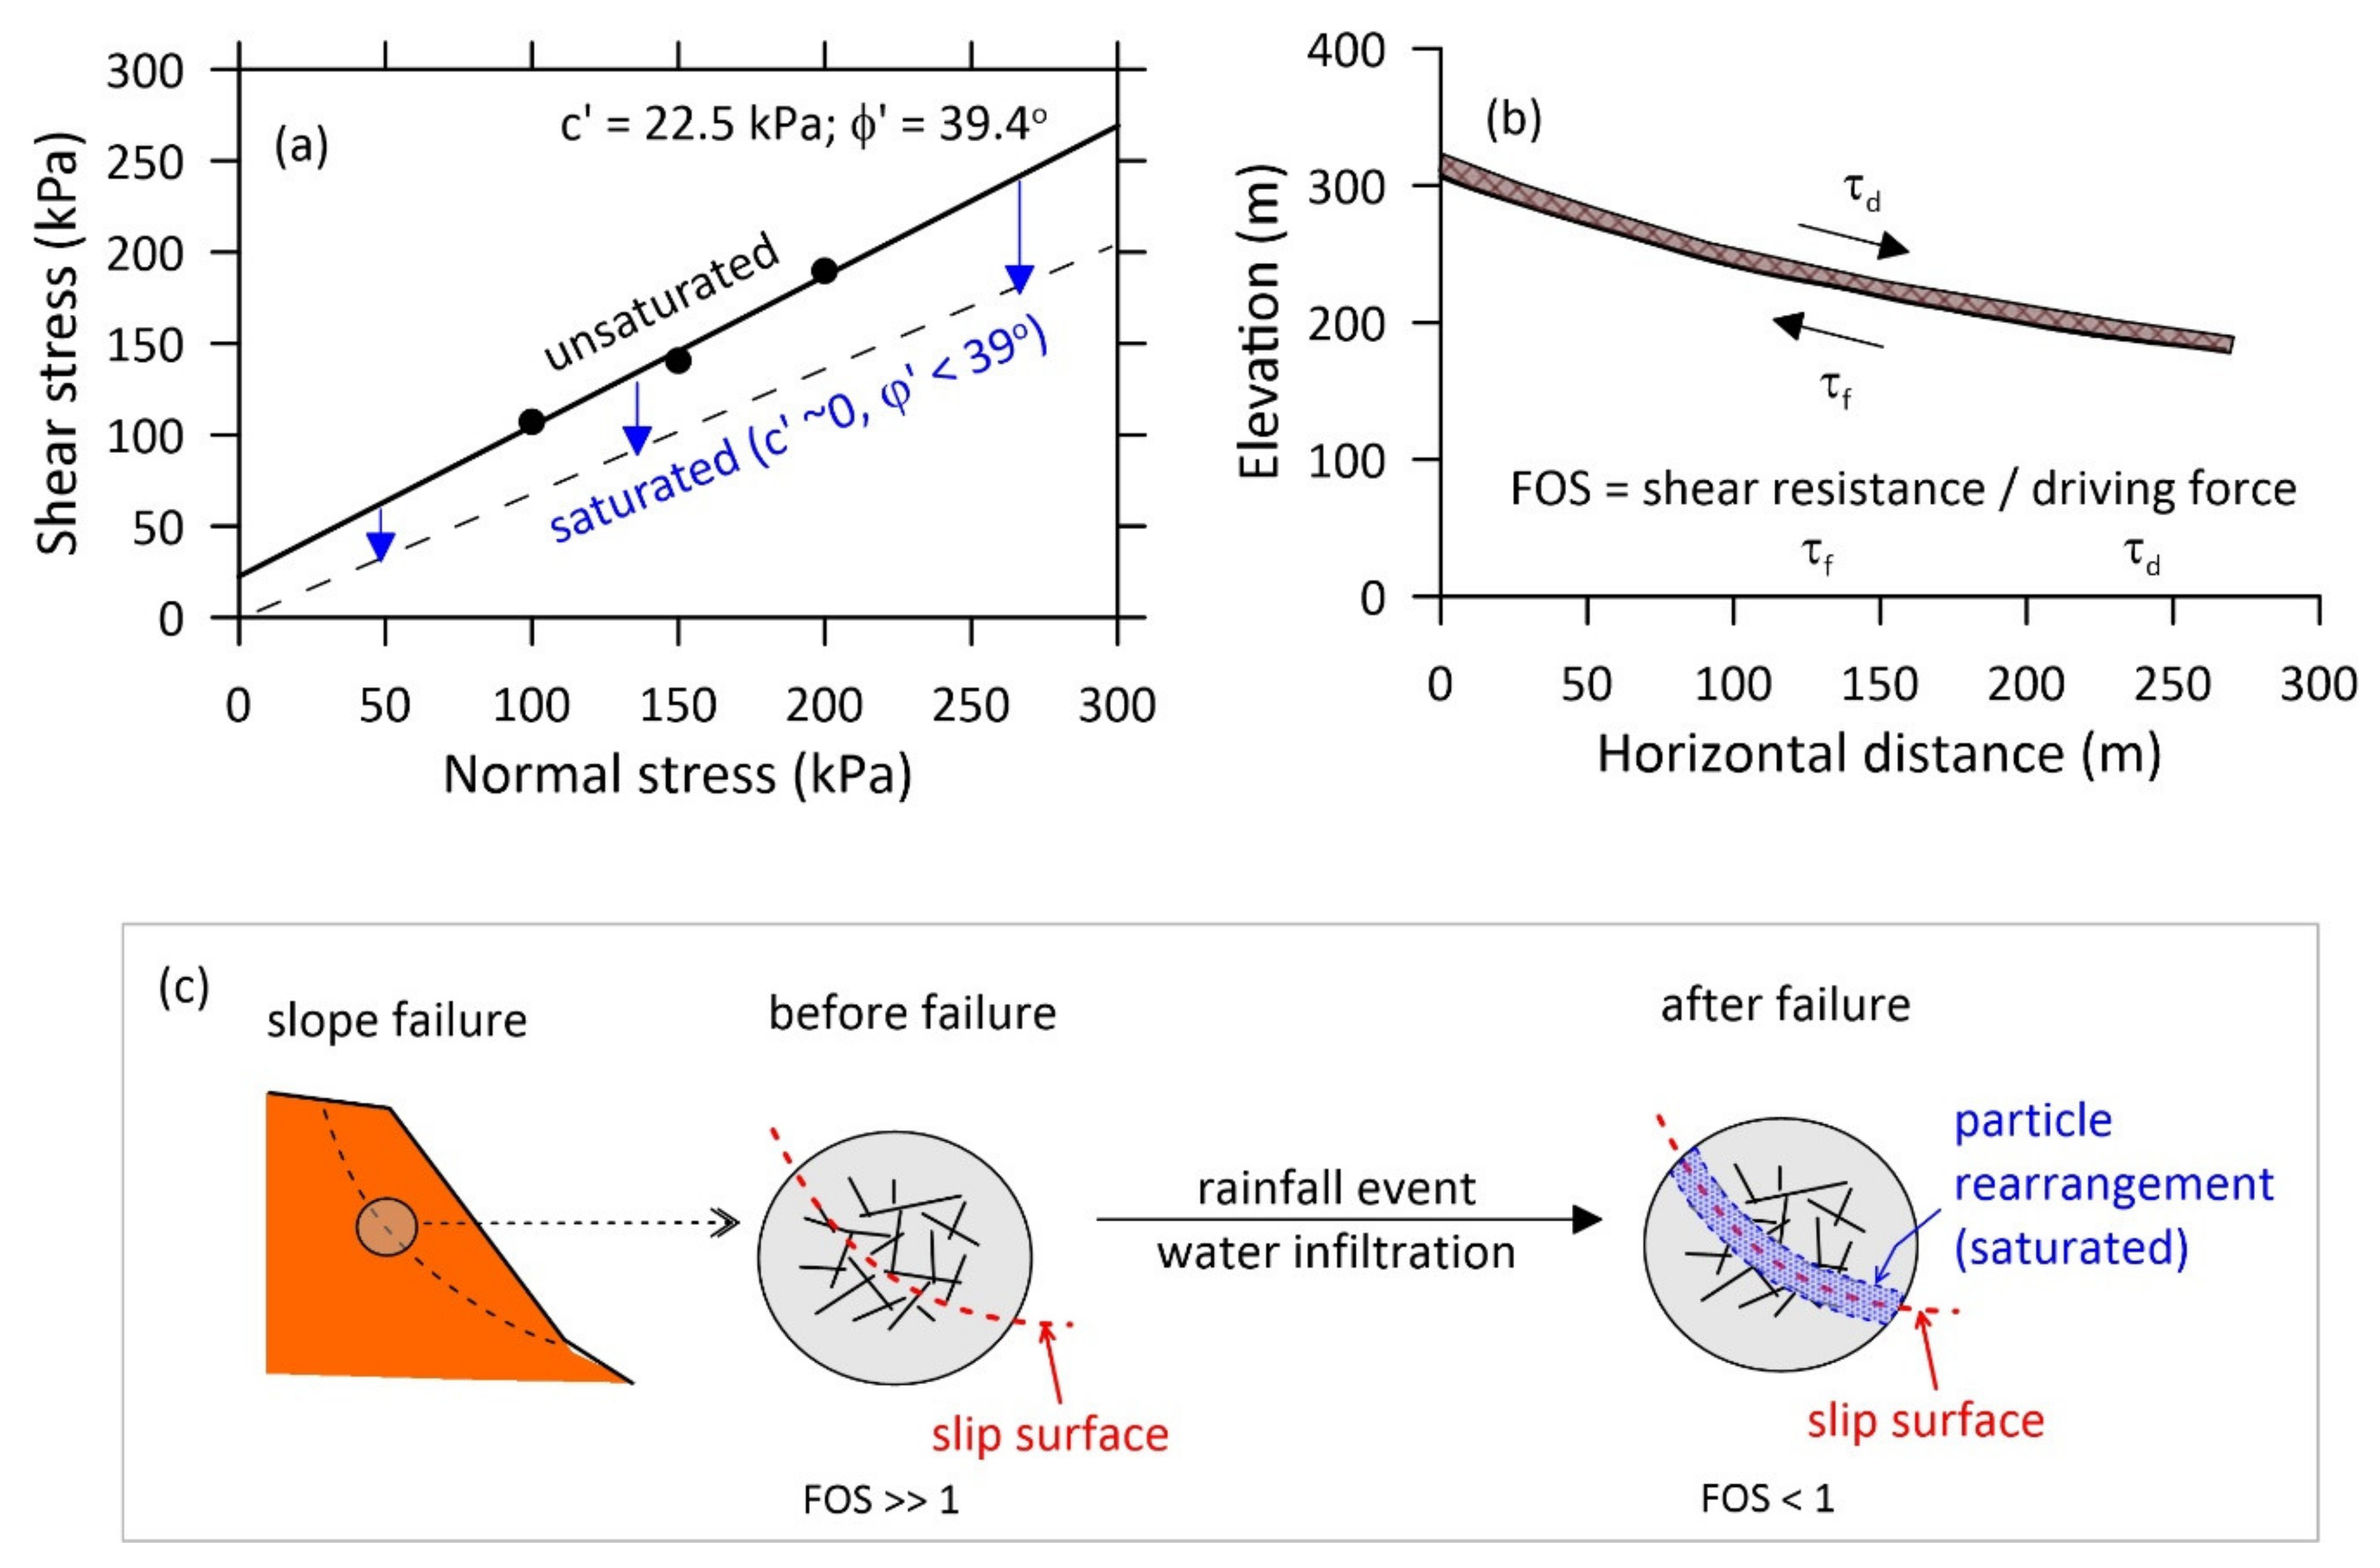
Shear strengths obtained from direct shear tests and ring shear tests can be useful to determine slope stability. The intact undisturbed soil sample taken from the landslide source area is applied for the direct shear test, but a reconstituted soil sample is applied for the ring shear test. For an infinite slope failure analysis, the shear resistance (i.e., combination of cohesion and internal friction angle) can be determined using a direct shear test. Figure 9 presents the determination of cohesion and internal friction angle of landslide materials in shallow landslides. The shear stress obtained from the in situ undisturbed soil condition (i.e., unsaturated condition) is approximately 23 kPa. This value may decrease with an increase in the degree of saturation. For example, the shear stress can reach much less than 10 kPa when the soil samples are fully saturated. Consequently, the cohesion will be very small (~0 kPa), and the internal friction angle is similar to the angle of repose, such as that observed for coarse-grained sediments (Figure 9a). The solid line is the experimental result, and the dashed line is the estimate.

Figure 9.
Determination of soil resistance for estimating the factor of safety for infinite slopes: (a) direct shear testing, (b) geomorphological profiles in shallow landslides, and (c) change in soil structure in slope failure.
In slope stability, the factor of safety (FOS), the ratio of shear resistance (τf) to the driving force (τd), is crucial to estimate whether the slope is stable. For an infinite slope failure assumption (Figure 9b), the factor of safety is simply determined using the ratio of the internal friction angle to the slope angle for the drained condition (i.e., dry condition and c = 0 kPa); otherwise, the factor of safety is half of the factor of safety obtained from the undrained condition (i.e., wet condition and c = 0 kPa). The FOS is in the range 1.2–2.2 for c = 0 kPa when the drained condition is considered for a slope angle of α = 20–35°. For the same slopes, FOS is in the range 0.6–1.1 for c = 0 kPa when wet and seepage conditions are considered.
In reality, the slope is usually in an unsaturated state. They have a specific value of cohesion and internal friction angle. According to Godt et al. [34], the factor of safety can be determined by considering the cohesion, internal friction angle, and suction stress function. Occasionally, the matric suction and volumetric water content cannot be easily measured under in situ conditions. In this case, the residual shear stress may be one of the good alternatives. The residual shear strength is defined as the shear stress mobilized along the pre-existing shear surface, and the soil particles are rearranged parallel to the slip surface (Figure 9c). Therefore, the slope can be easily reactivated along the slip surface. It can be naturally solidified over time. Therefore, the slope returns to the unsaturated cemented condition, which has strong bonding between the particles just before reaching the failure stage. These results can be repeated again depending on the rainfall event, until the slope completely fails.
As shown in Figure 8, the residual shear stresses of landslide materials are in the range 10–40 kPa for all shear speeds under the normal stress of 50 kPa in the drained and undrained conditions. The residual shear stress at a relatively low shear speed (i.e., 0.1 mm/s) is in the range 10–20 kPa for both drainage conditions. It should be noted that the degree of saturation and shear speed used in the direct shear test are different from those in the ring shear tests. However, it can be comparable with the shear resistance obtained from the direct shear tests. A shear speed of 0.1 mm/min (i.e., 0.002 mm/s) is often applied for sandy soils and is employed in the direct shear test. Actually, they differ by two orders of magnitude in terms of the shear speed applied. Compared to the lowest value of residual shear stress (i.e., approximately 10 kPa), which is considered a soil resistance against slope failure, the factor of safety will be stable or just slightly higher than unity when the slope angle and soil thickness of the in situ field condition are 35° and 1.2 m, respectively. This means that there are additional trigger factors that are not considered in this study, such as water infiltration and seepage effects. In addition, acceleration of the slide body and development of excess pore water pressure during shearing should also be considered in future studies.
5. Conclusions
The shear-displacement-dependent and shearing-speed-dependent shear stress under different drainage conditions are examined using a ring shear apparatus. The main research findings follow:
- (1)
- The shear stress of weathered soils encountered in landslides is generally dependent on the shear speed and drainage condition. For a given test condition, i.e., controlled drainage and shear speed, the soil behavior has almost the same strain-softening characteristics: there are distinct peak and residual values. At a shear speed of 0.1 mm/s (such as a moderate landslide rate), however, the peak shear stress has an extensive range, while the residual shear stress has a relatively small range. Both increase with an increase in shear speed for a given range 0.1 to 100 mm/s.
- (2)
- The shear zone in the ring shear box was observed after testing. The shear surface is identified by the naked eye when a relatively large displacement is applied (approximately 30 mm corresponding to a strain of 5% in shearing). The grain sizes are examined by sieve analysis for the soil samples taken from the upper, middle, and lower parts in the ring shear box. The minimum shear resistance, i.e., residual shear stress, can be determined, even though it is very difficult to identify the thickness of shear banding and particle crushing because of a limited shear displacement and speed. This shear resistance may indicate the critical value against deformation at the initiation of landslide movement.
- (3)
- The slope is distinctly stable under unsaturated soil conditions; in other words, it is stable if there is no rainfall event. However, the slope will be unstable when the slope is fully saturated after heavy rainfall; in this case, the cohesion goes to almost zero, and the internal friction angle goes to the angle of repose in the slope. Direct shear tests and ring shear tests are applicable to determine the shear resistance along the slip surface. In design practice, the determination of residual shear stress is crucial for estimating the reactivation of slope movement. The minimum residual shear stress is approximately 10 kPa for weathered soils at a shear speed of 0.1 mm/s, regardless of drainage conditions. The safety factor can be determined for the different slopes and soil thicknesses based on the test results. In conclusion, the use of residual shear stress obtained from this study can be applied at the beginning of landslide occurrence when we can take into account the reactivation of the slope.
Funding
This work was supported by the Korea Institute of Geoscience and Mineral Resources (KIGAM) research project No. 21-3412-1; 22-3412-1.
Institutional Review Board Statement
Not applicable.
Informed Consent Statement
Not applicable.
Data Availability Statement
Not applicable.
Conflicts of Interest
The author declares no conflict of interest.
References
- Jeong, S.; Kim, Y.; Lee, J.K.; Kim, J. The 27 July 2011 debris flows at Umyeonsan, Seoul, Korea. Landslides 2015, 12, 799–813. [Google Scholar] [CrossRef]
- Hong, M.; Kim, J.; Jeong, S. Rainfall intensity-duration thresholds for landslide prediction in South Korea by considering the effects of antecedent rainfall. Landslides 2018, 15, 523–534. [Google Scholar] [CrossRef]
- Lee, S.; Winter, M.G. The effects of debris flow in the Republic of Korea and some issues for successful risk reduction. Eng. Geol. 2019, 251, 172–189. [Google Scholar] [CrossRef]
- Kim, K.S.; Kim, M.I.; Lee, M.S.; Hwang, E.S. Regression equations for estimating landslide-triggering factors using soil characteristics. Appl. Sci. 2020, 10, 3560. [Google Scholar] [CrossRef]
- Varnes, D.J. Slope movement types and processes. In Landslides, Analysis and Control; Transportation Research Board, Special Report No. 176; National Academy of Sciences: Washington, DC, USA, 1976; pp. 11–33. [Google Scholar]
- Hungr, O.; Evans, S.G.; Bovis, M.J.; Hutchinson, J.N. A review of the classification of landlides of the flow type. Environ. Eng. Geosci. 2001, 7, 221–238. [Google Scholar] [CrossRef]
- Terzaghi, K.; Peck, R.B.; Mesri, G. Soil Mechanics in Engineering Practice, 3rd ed.; John Wiley and Sons, Inc.: New York, NY, USA, 1996. [Google Scholar]
- Sebari, M.; Annan, C.D.; Konrad, J.M. On the mechanics and modeling of interfaces between granular soils and structural materials. Arch. Civ. Mech. Eng. 2018, 18, 1562–1579. [Google Scholar] [CrossRef]
- Tika, T.E.; Vaughan, P.R.; Lemos, L.J. Fast shearing of pre-existing shear zones in soil. Géotechnique 1996, 2, 197–233. [Google Scholar] [CrossRef]
- Kamai, T. Monitoring the process of ground failure in repeated landslides and associated stability assessments. Eng. Geol. 1998, 50, 71–84. [Google Scholar] [CrossRef]
- Toyota, H.; Nakamura, K.; Sugimoto, M.; Sakai, N. Ring shear tests to evaluate strength parameters in various remoulded soils. Geotechnique 2009, 59, 649–659. [Google Scholar] [CrossRef]
- Okada, Y.; Sassa, K.; Fukuoka, H. Excess pore pressure and grain crushing of sands by means of undrained and naturally drained ring-shear tests. Eng. Geol. 2004, 75, 325–343. [Google Scholar] [CrossRef]
- Okada, Y.; Sassa, K.; Fukuoka, H. Undrained shear behavior of sands subjected to large shear displacement and estimation of excess pore-pressure generation from drained ring shear tests. Can. Geotech. J. 2005, 42, 787–803. [Google Scholar] [CrossRef]
- Sadrekarimi, A.; Olson, S.M. A new ring shear device to measure the large displacement shearing behavior of sands. Geotech. Test. J. 2009, 12, 197–208. [Google Scholar]
- Sadrekarimi, A.; Olson, S.M. Shear band formation observed in ring shear tests on sandy soils. J. Geotech. Geoenviron. Eng. 2010, 136, 366–375. [Google Scholar] [CrossRef]
- Hungr, O.; Morgenstern, N.R. High velocity ring shear tests on sand. Geotechnique 1984, 34, 415–421. [Google Scholar] [CrossRef]
- Wang, F.W.; Sassa, K.; Wang, G. Mechanism of a long-runout landslide triggered by the August 1998 heavy rainfall in Fukushima Prefecture, Japan. Eng. Geol. 2002, 63, 169–185. [Google Scholar] [CrossRef]
- Zhang, M.; Yin, Y.; Hu, R.; Wu, S.; Zhang, Y. Ring shear test for transform mechanism of slide-debris flow. Eng. Geol. 2011, 118, 55–62. [Google Scholar] [CrossRef]
- Jiang, Y.; Wang, G.; Kamai, T. Fast shear behavior of granular materials in ring-shear tests and implications for rapid landslides. Acta Geotech. 2017, 12, 645–655. [Google Scholar] [CrossRef]
- Yu, M.; Huang, Y.; Deng, W.; Cheng, H. Forecasting landslide mobility using an SPH model and ring shear strength tests: A case study. Nat. Hazards Earth Syst. Sci. 2018, 18, 3343–3353. [Google Scholar] [CrossRef] [Green Version]
- Ma, C.; Zhan, H.; Zhang, T.; Yao, W. Investigation on shear behavior of soft interlayers by ring shear tests. Eng. Geol. 2019, 254, 34–42. [Google Scholar] [CrossRef]
- Wang, G.; Suemine, A.; Schulz, W.H. Shear-rate-dependent strength control on the dynamics of rainfall-triggered landslides, Tokushima Prefecture, Japan. Earth Surf. Process. Landf. 2010, 35, 407–416. [Google Scholar] [CrossRef]
- Sassa, K.; Fukuoka, H.; Scarascia-Mugnozza, G.; Evans, S. Earthquake-induced-landslides: Distribution, motion and mechanisms. Soils Found. 1996, 36, 53–64. [Google Scholar] [CrossRef] [Green Version]
- Jeong, S.W.; Park, S.S. Effect of the surface roughness on the shear strength of granular materials in ring shear tests. Appl. Sci. 2019, 9, 2977. [Google Scholar] [CrossRef] [Green Version]
- Sassa, K.; Wang, G.; Fukuoka, H. Performing Undrained shear tests on saturated sands in a new intelligent type of ring shear apparatus. Geotech. Test. J. 2003, 26, 1–9. [Google Scholar]
- Sassa, K.; Fukuoka, H.; Wang, G.; Ishikawa, N. Undrained dynamic-loading ring-shear apparatus and its application to landslide dynamics. Landslides 2004, 1, 7–19. [Google Scholar] [CrossRef]
- Fukuoka, H.; Sassa, K.; Wang, G.; Sasaki, R. Observation of shear zone development in ring-shear apparatus with a transparent shear box. Landslides 2006, 3, 239–251. [Google Scholar] [CrossRef]
- Fukuoka, H.; Sassa, K.; Wang, G. Influence of shear speed and normal stress on the shear behavior and shear zone structure of granular materials in naturally drained ring shear tests. Landslides 2007, 4, 63–74. [Google Scholar] [CrossRef]
- Jeong, S.W.; Park, S.S.; Fukuoka, H. Shear behavior of waste materials in drained and undrained ring shear tests. Geosci. J. 2014, 18, 459–468. [Google Scholar] [CrossRef]
- Jeong, S.W.; Park, S.S.; Fukuoka, H. Shear and viscous characteristics of gravels in ring shear tests. Geosci. J. 2018, 22, 11–17. [Google Scholar] [CrossRef]
- IUGS/WGL. A suggested method for describing the rate of movement of a landslide. IAEG Bull. 1995, 52, 75–78. [Google Scholar]
- Feda, J. Notes on the effect of grain crushing on the granular soil behavior. Eng. Geol. 2002, 63, 93–98. [Google Scholar] [CrossRef]
- Torabi, A.; Braathen, A.; Cuisiat, F.; Fossen, H. Shear zones in porous sand: Insights from ring-shear experiments and naturally deformed sandstones. Tectonophysics 2007, 437, 37–50. [Google Scholar] [CrossRef] [Green Version]
- Godt, J.W.; Baum, R.L.; Lu, N. Landsliding in partially saturated materials. Geophys. Res. Lett. 2009, 36, L02403. [Google Scholar] [CrossRef]


Publisher’s Note: MDPI stays neutral with regard to jurisdictional claims in published maps and institutional affiliations. |
© 2022 by the author. Licensee MDPI, Basel, Switzerland. This article is an open access article distributed under the terms and conditions of the Creative Commons Attribution (CC BY) license (https://creativecommons.org/licenses/by/4.0/).