Article

Effect of Chitosan Solution on Low-Cohesive Soil’s Shear Modulus G Determined through Resonant Column and Torsional Shearing Tests

1
Faculty of Geoengineering, University of Warmia and Mazury, 10-957 Olsztyn, Poland
2
Faculty of Civil and Environmental Engineering, Gdansk University of Technology, 80-233 Gdansk, Poland
*
Author to whom correspondence should be addressed.
Appl. Sci. 2022, 12(11), 5332; https://doi.org/10.3390/app12115332
Submission received: 30 April 2022 / Revised: 20 May 2022 / Accepted: 23 May 2022 / Published: 25 May 2022
(This article belongs to the Special Issue New Frontiers in Sustainable Geotechnics)

Abstract

:
In this study the effect of using a biopolymer soil stabilizer on soil stiffness characteristics was investigated. Chitosan is a bio-waste material that is obtained by chemical treatment of chitin (a chemical component of fungi or crustaceans’ shells). Using chitosan solution as a soil stabilizer is based on the assumption that the biopolymer forms temporary bonds with soil particles. What is important is that these bonds are biodegradable, so the product does not leave any harmful waste and has high eco-compatibility. The biopolymer itself is a by-product of many industrial chemical processes, so its application is compliant with the goals of sustainable geotechnical engineering. The effect of chitosan on soil shear strength, permeability or surface erosion has already been investigated in several different studies. In this study specimens of low-cohesive soil stabilized with two different chitosan solutions were subject to cyclic loading (torsional shearing test) and dynamic loading (resonant column) to obtain soil shear modulus G as a function of strain values. It has been shown that chitosan solution added to medium-grained materials improves their shear modulus G substantially (up to 3 times) even for relatively low chitosan concentration solutions (1.5 g of chitosan per 1 kg of dry silica sand). The results obtained in this study and the known chitosan properties suggest that chitosan solutions can be a very effective and eco-friendly short-term stabilizer for temporary geotechnical structures, e.g., working platforms.

1. Introduction

Geotechnical engineering is a branch of civil engineering that focuses on the behavior of soil and rock materials near the surface of the earth [1]. It is unquestionable that civil engineering has a significant impact on the natural environment as it rapidly consumes natural resources and usually interferes with the local ecosystem functioning. Therefore, it is of vital importance to promote sustainable development in this branch of industry.
Development of geotechnical engineering is stimulated, in a large part, by advancement of technology and new material solutions that enable realization of construction projects in difficult geotechnical conditions. One of the main aspects of sustainable geotechnical engineering is safe and effective use of soil stabilizers. Soil stabilization is a process of enhancing mechanical properties of soil. It can alter soil physical and chemical characteristics like strength, compressibility and permeability. It can also include actions aimed at limiting soil surface erosion or preventing air pollution by fine-dispersed dust [2].
Ground improvement methods include deep or surface soil stabilization. Surface soil stabilization usually consists of applying an admixture to the surface layer of soil and compacting the resulting mixture. It can be used not only for increasing performance of in situ subsoils but also for, e.g., soils used in road embankments.
Soil can be stabilized mechanically, chemically, thermally or electrically. Mechanical methods (compacting) are used most often as they do not alter the soil composition.
For chemical stabilization the following materials can be used
  • cement,
  • calcium-based stabilizers,
  • fly ash,
  • bitumen,
  • non-standard stabilizers.
Desired performance characteristics and economic aspects often call for using (and studying) non-traditional additives. Due to ecological reasons, non-standard soil additives are becoming more and more popular. Especially for forest road construction, bike lanes, pedestrian ways on protected sites, weak soil protection from excessive water absorption or working platform construction on weak ground.
Traditional soil stabilizers have been thoroughly studied and their properties and stabilizing mechanisms are mostly identified. Various non-traditional soil additives are currently intensively developed and there is still a great need for research in this subject. Most non-traditional additives can be classified as ionic, enzymes, lignosulfonates, salts, petroleum resins, polymers or tree resins. Many products contain additional substances, e.g., surfactants. However, due to commercial confidentiality the exact composition of a given product is not available to the public.
In [3,4,5] non-traditional additives were tested. Series of laboratory tests were performer on stabilized coarse- and fine-grained soils and the increase in soil strength was evaluated. The stabilization mechanisms were broadly divided into two types, mechanical and chemical bonding. However, the experiments were mainly focused on stabilization effect evaluation and not on the underlying mechanisms.
Tingle et al. [6] conducted research that was specifically aimed at identifying the chemical and physical bonding mechanisms of non-traditional additives. Series of laboratory experiments included macroscopic analysis, physical characterization and chemical analysis of mineral, soil, stabilizer and soil-stabilizer composites.
The research suggests that stabilization mechanisms that occur in soil-stabilizer mixtures cannot be considered separately. The final effect results from a complex interplay of many different factors. Many chemical stabilizers (ionic, lignosulfonates, salts and enzymes) can react with soil mineral particles, so the stabilization effect depends on a particular soil’s mineral composition.
Synthetic stabilizers are mostly vinyl acetates and acrylic copolymers [6]. A polymer stabilizer covers soil particles, and the bonding effect is created when the water is evaporated from the emulsion, leaving a solidified soil-polymer structure. Therefore, the increase in soil strength depend mainly on how well are soil particles covered in emulsion.
A similar mechanism is observed in natural polymer (lignosulfonates or natural resins) stabilization. Laboratory experiments [4,5,7] confirm a clearly physical mechanism of solidification. For fine-grained soils the stabilization effect is less pronounced as the coverage of the smallest particles insufficient. Stabilization with polymer emulsions is more appropriate for coarse-grained soils, also because of the larger specific surface area that allows for more efficient mixing.
Synthetic polymers have a very high tension and bending strength, and create strong physical bonding in the soil-polymer composites. Depending on the specific chemical composition of the stabilizer, an ionic exchange between polymer and soil minerals can also occur and affect the stabilizing effect. The polymer stabilization mechanisms are comprehensively described in literature (see [8]).
Due to rapid global climate changes, a strong emphasis is placed on carbon neutral material production processes. The material research is more and more focused on environmentally neutral materials and possible applications of waste materials that can be used as alternatives for traditional solutions (e.g., eggshell-derived lime as an alternative pozzolanic material for sandy soil stabilization [9] or clayey soil stabilization [10]). In addition, biopolymers (synthetically or naturally obtained) are getting more and more attention. In recent years many review articles concerning the use of biopolymers for soil stabilization were published [11,12,13,14,15,16]. Biopolymers are typically produced from gum trees, shrimp shell, milk, fermentation of glucose, algae, fungi or bacteria that consist of polysaccharides [17]. Chang et al. [18] presented a broad analysis of applications and potential benefits of using various biopolymers in geotechnical engineering. The review is focused on the results of the latest studies on biopolymers like agar gum, guar gum, gellan gum, dextran, β-glucan, xanthan gum, chitosan, starch and casein. The main benefits of using those materials are increase in soil strength, modification of consistency through increase of water absorption, erosion reduction, etc. (see Table 1). All of these ground improvement effects are obtained in accordance with the principles of sustainable development, as the biopolymers are mostly microbial hydrocarbons with low CO2 footprints compared to conventional soil binders and promote seed germination and the growth of vegetation in soils [18]. Another aspect of sustainable development is effective and safe waste management and reuse of waste materials [19].
Most of the published studies that concern mechanisms and effects of biopolymer soil stabilization focus mainly on the composite’s strength parameters, like internal friction angle, cohesion and compression strength [17,20,21,22,23,24]. There are few studies that focus on deformation characteristics, stiffness or damping.
Chitosan is a waste product of the sea food processing industry. This cationic polymer is obtained by deacetylation of chitin, found abundantly in crustacean, insect, arthropod exoskeletons, and molluscs [25]. Despite its numerous applications in water treatment [26], pharmaceutics [27], agriculture [28], winemaking [29] or energy storage [30,31] this natural resource hasn’t been fully utilized. The biggest advantages of this polymer include availability, low cost, high biodegradability and ease of chemical modification [32,33,34,35]. Polymer blending can also be performed to improve the mechanical properties of the bioproduct [25,32].
Application of biopolymers in geotechnical and geo-environmental engineering is relatively new. There are limited studies on the application of biopolymers for soil improvement. These studies were generally related with permeability [36], erosion control [37] and shear strength of the soils [21,38]. Experimental studies have shown CU Triaxial tests performed on compacted silt mixed with 1% chitosan solution indicate shear strength improvement of up to 30 percent within a week [39]. In another study [40], fine silica sand containing dextran showed 20 times increased critical shear stress (τc) compared to the untreated condition. Chang and Cho [41] proved, the presence of biopolymers in soil might enhance shear stiffness (Kirchhoff modulus G).
Various applications of chitosan are still studied. In geotechnical research there are still few results available that specifically concern soil–chitosan mixtures. Recent studies focus mainly on soil–chitosan composites shear strength or soil surface erosion prevention. To the authors’ best knowledge there are yet no studies that focus on soil–chitosan mixtures’ stiffness and dynamic properties.
In this study the effect of chitosan on stiffness and dynamic properties of medium-grained low-cohesive soil was investigated. Soil–chitosan composited were subjected to cyclic slow-changing loading (torsional shearing test) and dynamic loading (resonant column). The specimens were prepared using two different chitosan solution concentrations. The obtained properties of soil–chitosan composites were compared with the properties of non-enhanced soil specimens with the same water content.

2. Materials and Methods

2.1. Materials

2.1.1. Silica Sand

Non-cohesive materials have proven to be suitable for soil stabilization with polymer emulsions (increased mixing efficiency resulting from their large specific surface area) [7]. Therefore, silica sand was chosen for the experiments in this study. Silica sand was originally used by Wichtmann [42] to perform experiments in resonant column. Numerous tests on this type of soil are presented in Wichtmann’s dissertation [42] and other studies [43,44]. “Silica sand 1” is classified as a poorly graded sand with a uniformity coefficient CU value of 1.6 (see Figure 1). Sand with high uniformity of soil particles is appropriate to observe influence of additives on specimen mechanical properties [45]. Geometrical and physical parameters of tested soil are presented in Table 2.
The maximum dry density and the optimum moisture content of “silica sand 1” were determined through the Standard Proctor Compaction Test and the results are presented in Figure 2. All the specimens were prepared with the optimum moisture content (3.0–3.5%) to maximize the contact surface between the soil particles, and therefore provide a better interaction between the soil and the chitosan solution.

2.1.2. Chitosan

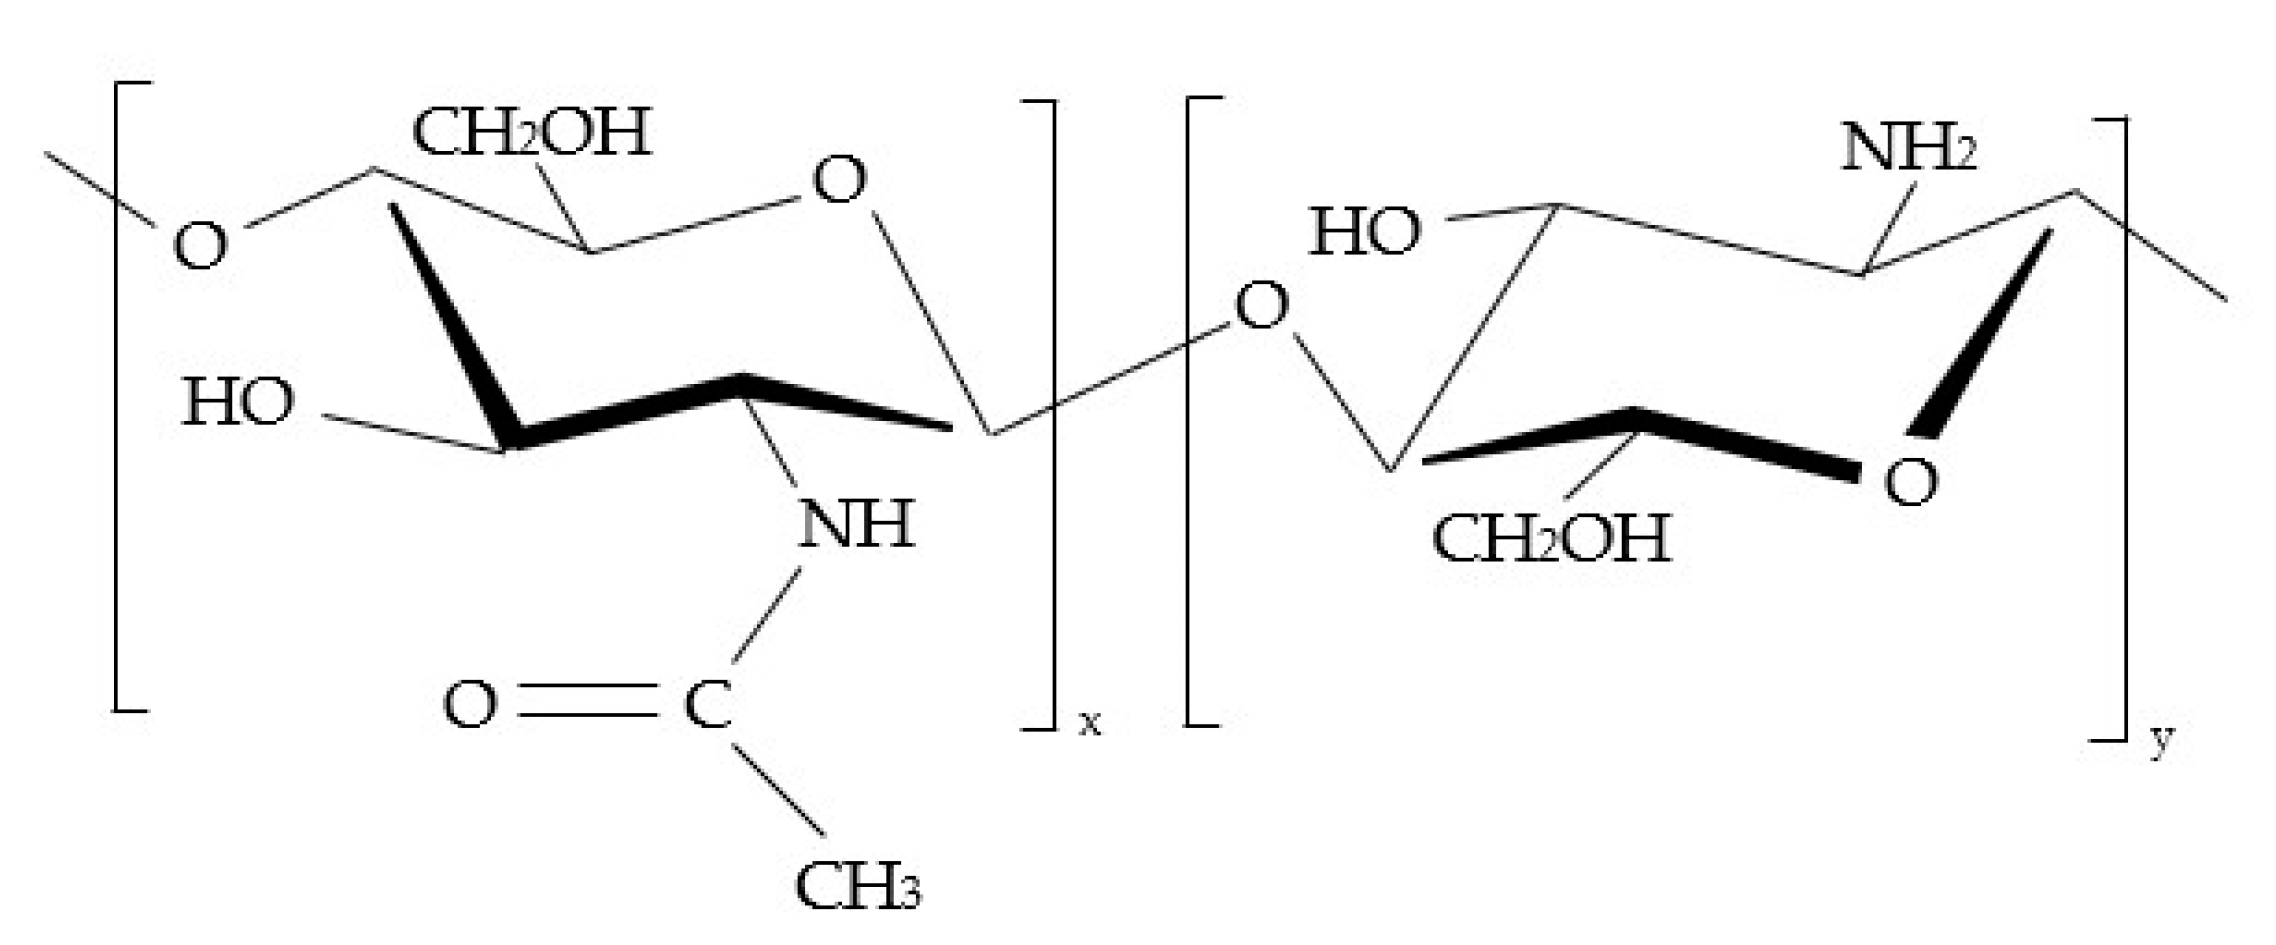
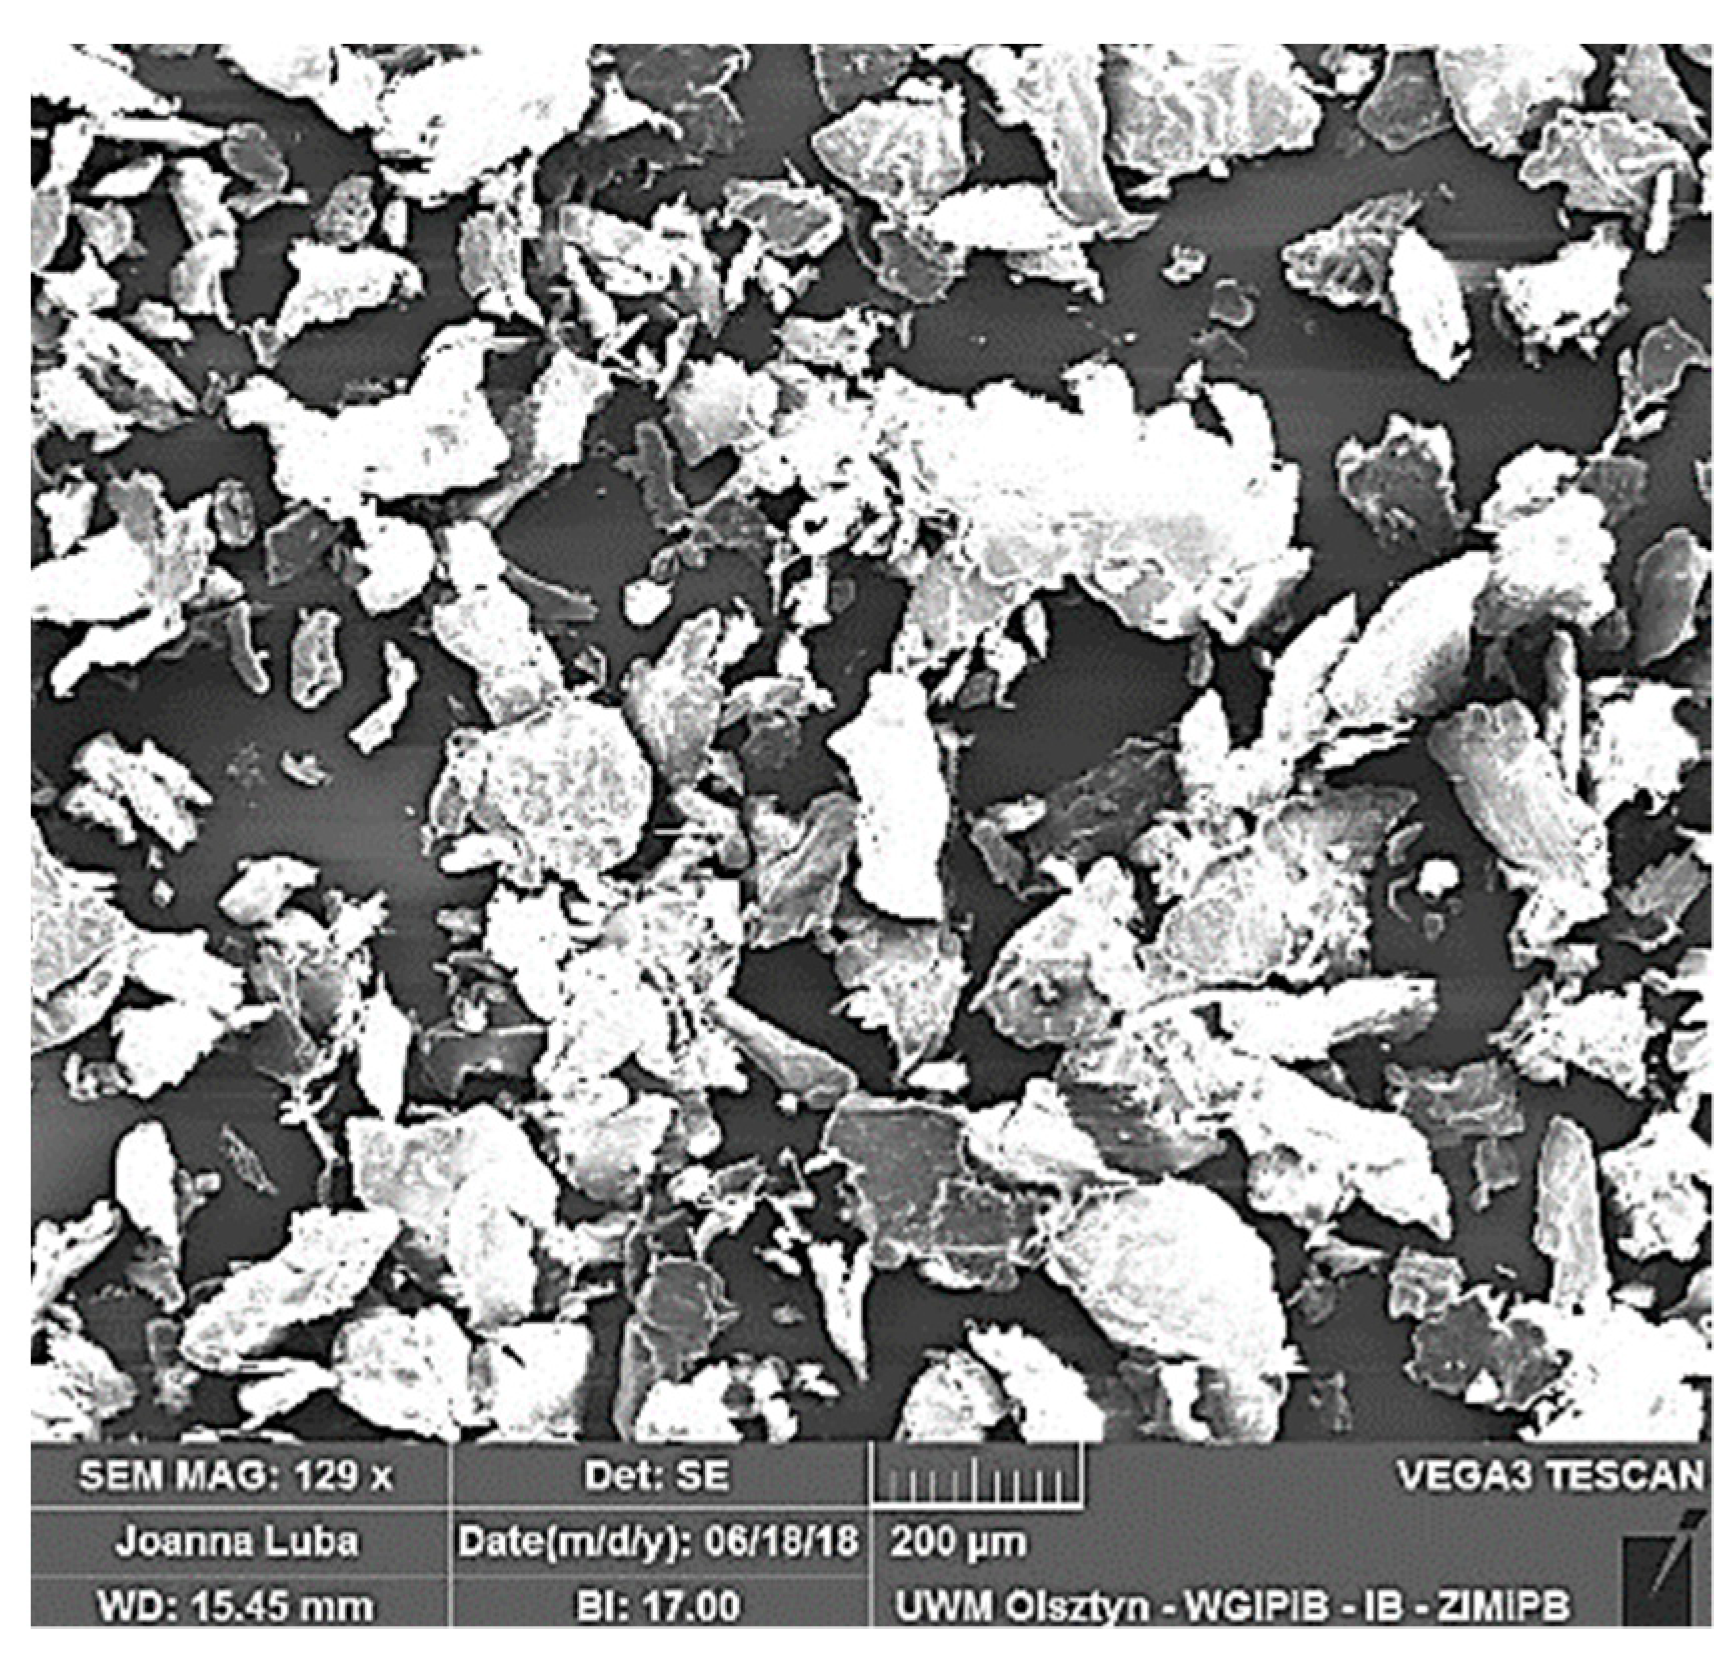
Chitosan is biocompatible, biodegradable and non-toxic cationic polymer obtained by deacetylation of chitin [46]. Chemical structure of chitin is made up of 1–4 linked 2-acetamido-2-deoxy-β-D-glucopyranose. Chitosan, a deacetylated form of chitin to at least 50% of the free amine form, has a heterogeneous chemical structure made up of both 1–4 linked 2-acetamido-2-deoxy-β-D-glucopyranose as well as 2-amino-2-deoxy-β-D-glucopyranose [47]. Chemical structure of chitosan is presented in Figure 3, and chitosan powder particles are shown in magnification in Figure 4.
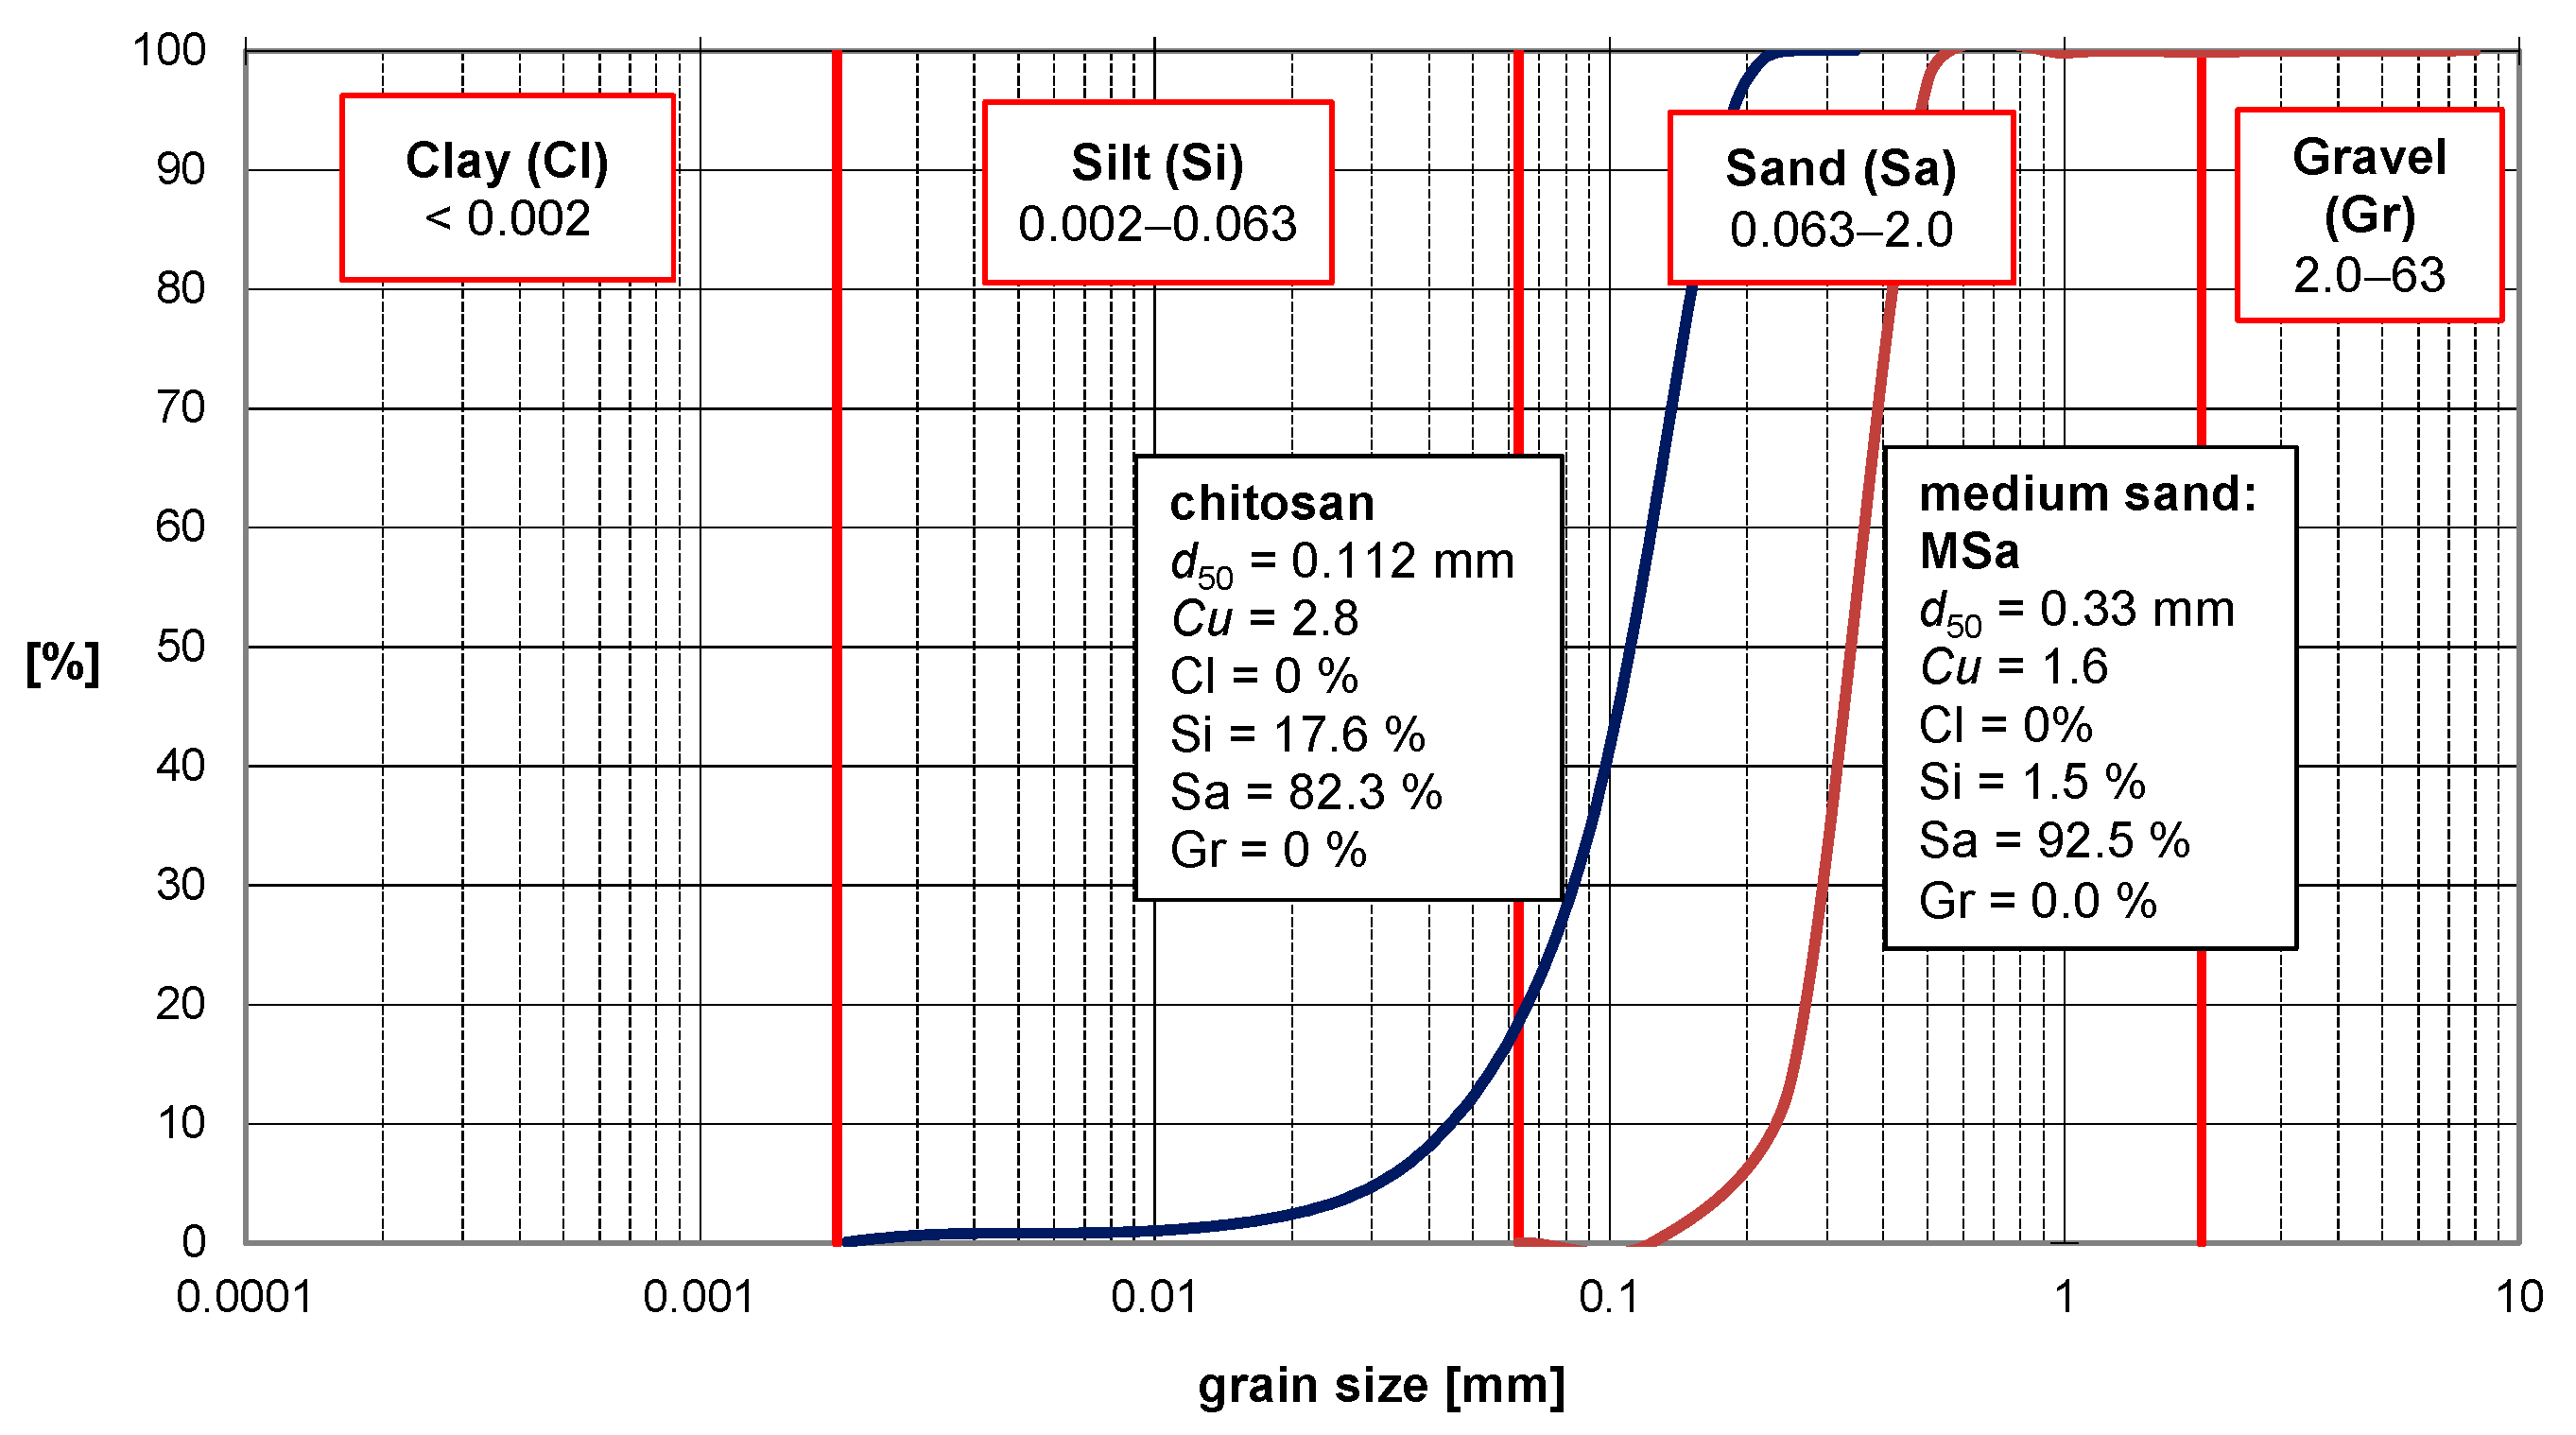
The physical parameters of the chitosan powder that was used in this study are presented in Table 3. Additionally, in Figure 5 particle size distribution of both materials (sand and chitosan) is compared.
It can be noted (Figure 5) that the particle size distributions make it possible to create a uniform particle mixture of both materials even when mixing dry ingredients. This aspect can be beneficial for further physical-chemical processing.
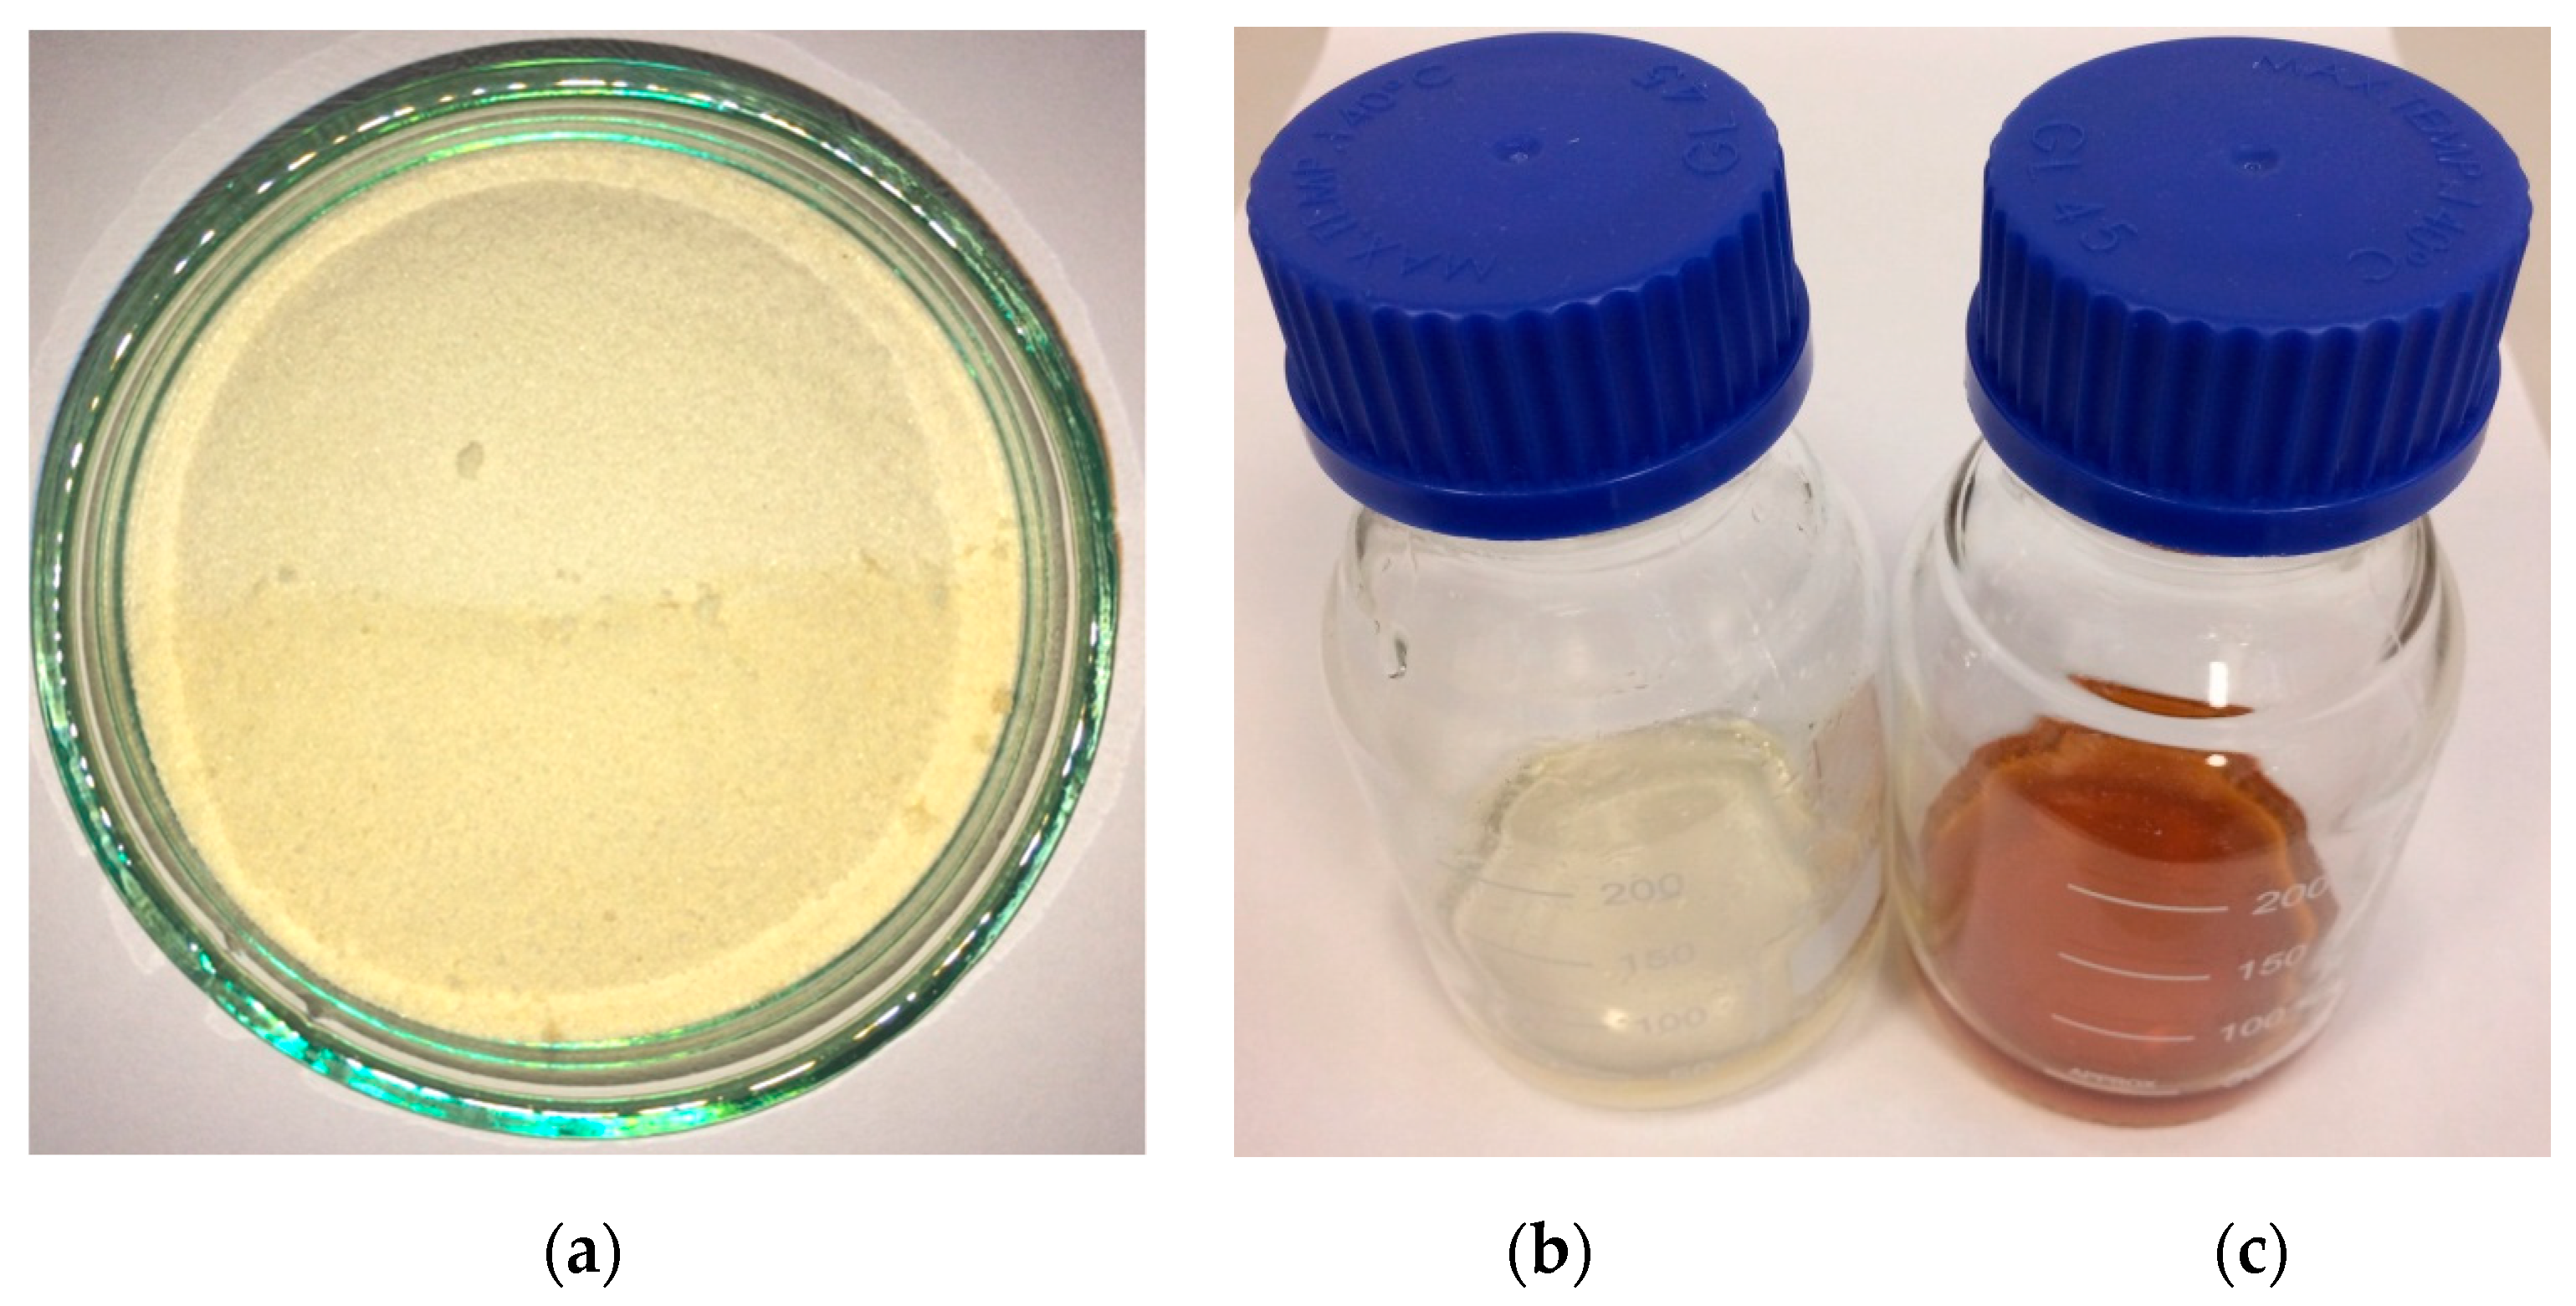
Commercial chitosan is usually a fine powder of white to slightly yellow color (Figure 6a). It is insoluble in water, but it is easy to dissolve in solutions of weak acids, e.g., in 10% acetic acid CH3COOH (Figure 6b,c). Chitosan solutions in acetic acid are viscous fluids. The viscosity increases with the increase in chitosan concentration (in this study 4% solution in 10% acetic acid and 7% solution in 10% acetic acid were used. The increase in the liquid’s viscosity was easily noticeable but has not been quantitatively measured).
Laboratory tests were performed on cylindrical specimens of oven-dry “silica sand 1” and two types of mixtures of “silica sand 1” and chitosan-water-acetic acid solutions. Specimens were compacted with respect to the ASTM standard [48]. In Table 4 the composition of prepared specimens is presented.

2.2. Methods

2.2.1. Resonant Column/Torsional Shearing Device

The laboratory tests were performed using modified Stokoe’s fixed-free type Resonant Column apparatus with Torsional Shear mode (Wykeham Farrance RC/TS, model WF8500). The modified version of the device and new procedure of interpretation of results were presented in recent publication [49]. Standard WF8500 measurement method is based on the external measurement system of deformation in one plane of the specimen’s cross-section—at its upper end. In resonant column mode (RC), the device enables dynamic loading with torque causing shear strain in the tested soil specimen. During a test, torque frequency increases abruptly or smoothly in the range of 0–300 Hz. In torsional shear mode (TS), the device generates cyclic, slowly changing torque with a constant frequency in the range of 0.01–50 Hz. The device is equipped with an aluminum base with a steel plinth equipped with a porous stone and pipes for water supply and drainage from triaxial compression cell together with valves. This allows for performing a controlled saturation process and isotropic consolidation. Pressure control is provided by sensors for cell pressure, pore pressure and backpressure. The size of plinth allows for the installation of a cylindrical soil specimen with a base diameter of 70 mm and a height of 140–150 mm. The loading is generated by an electromagnetic system consisting of four coils and neodymium magnets. The magnets are the moving part of the device and can generate a maximum torque of 1.2 Nm and maximum angle of 10 degrees. The control of the electromagnetic drive system is correlated with the automatic acquisition of measurement data from all sensors installed in the device. The device is powered by an external unit and controlled with a dedicated software “DYNATOR”. Main control parameters in the RC mode are initial and final frequency, time and amplitude of the voltage that produces torsional loading (moment of electrodynamic force). In the TS mode, the control parameters are frequency, voltage amplitude and number of torsion cycles. Static values, characterizing the mechanical properties of the drive head, are altered due to changes of conditions in the laboratory and change with time (equipment components’ wear). For these reasons, before each series of tests, the device is calibrated. Figure 7 presents a schematic drawing of the RC/TS device.

2.2.2. Specimen Preparation and Experimental Procedure

Dry chitosan powder was dissolved in the 10% acetic acid solution at 20 °C. Chitosan was added in small portions and mixed until completely dissolved. Two different chitosan solutions were used in this study, 4% and 7% (to obtain 1.5 g and 2.5 g of chitosan per 1 kg of dry sand respectively for soil specimens with optimum water content). The prepared solutions were stored in hermetically sealed laboratory glassware at 20 °C. The “silica sand 1” was dried to a constant weight at 105 °C, then cooled down and stored in a hermetically sealed container. The chitosan solutions were gradually added to soil portions of a known mass and mixed with the soil to a homogenous mixture. The prepared mixtures were stored in hermetically sealed containers for about 1 h.
The specimens were formed using a hollow metal cylinder, weighted and prepared for installation in the RC/TS device.
The specimen installation includes placing the specimen on the bottom porous stone and placing the drive head on the top surface of the specimen. The specimen is then covered with a latex membrane that separates the material from pressurized water in the testing chamber. For specimens of height 140–150 mm, 235 mm long membranes were used to create an additional overlap on the drive head and the bottom base. The membrane placement was secured with rubber O-rings at the top and bottom.
The prepared specimen is placed inside a polycarbonate internal cylinder filled out with water just before starting the testing procedure. The final step of specimen installation is covering the entire setup with an external cylinder that separates the specimen, drive and measuring equipment from the external environment. The RC and TS tests were performed according to the ASTM standard [50]. All of the tests were performed in drained conditions (the pore water can easily drain out from the soil matrix and the liquefaction is not expected to occur).
After the tests were conducted, the fresh soil–chitosan mixtures were cured. The thermal curing was done at 60 °C for 24 h. After the curing process the same experiments were carried out on the cured soil–chitosan composite specimens.
After the tests the specimens were left at 20 °C (relative humidity 50%) and subjected to observation for 28 days. The last phase of the experiment was the observation of the composite degradation in water.

2.2.3. Method of Results Interpretation

Standard RC test is performed to measure the propagation speed VS of a transverse (shearing) wave in a soil specimen.
For material with bulk density ρ, the shear modulus is given by the following formula
G = ρ ·VS2.
And the propagation speed VS of a transverse wave is
V S = 2 π f r L β ,
where fr—resonant frequency of the system (specimen + drive system), L—specimen’s height. The parameter β [rad] is obtained using the formula
I I 0 = β tan ( β ) ,
where I—mass moment of inertia of the specimen, I0—mass moment of inertia of the drive system, determined during the device calibration process.
To find the resonant frequency fr the specimen is subjected to torsional vibrations of gradually increasing frequency. The resonant frequency would be the frequency value corresponding to the maximum twist angle that was measured during the test.
Equation (1) takes the following form
G = ρ 4 π 2 f r 2 L 2 β 2 .
The amplitude of applied torque and the measured corresponding twist angle can be converted to shear stress τ and shear strain γ. The shear modulus can then be calculated using the formula
G = τ ( γ m a x ) γ m a x
considering the fact that the graph of the τ(γ) function forms a characteristic hysteresis loop.
Alternatively, the shear modulus of the specimen can be found using back analysis and numerically simulated TS test results.
The goal of back analysis is to find a function that accurately describes relationship between the observed (known) effects and unknown causes. To avoid problems with solution ambiguity (there may be many sets of causes that lead to the same final result), the optimization approach is often used
L = M i n X ( | Γ ( X ) Y | ) ,
where Γ()—cause-and-effect relationship, X—set of unknown causes, Y—set of observed effects, L—objective function (or error function).
The optimal X parameters for the Γ(·) problem are found through minimization of the L function, which measures the difference between observed effects Y and the effects predicted by the Γ(X) model. The following objective function was used in the performed back analyses
L = n w ( τ γ e τ γ c ) 2 ,
where τ γ e —measured (experimentally, during the TS test) τ for specific values of γ, τ γ c —numerically calculated τ for specific values of γ, w—weights of the computational nodes (set to 1), n—number of nodes.
It is assumed that Hooke’s law applies, therefore
τ ( γ ) = G γ ,
where τ—average shear stress, γ—average shear strain, G—shear modulus. This ensures that the problem solution is stable and unambiguous. However, considering the soil stiffness degradation in small strain range the following nonlinear relation is used
τ ( γ ) = G ( γ ) γ .
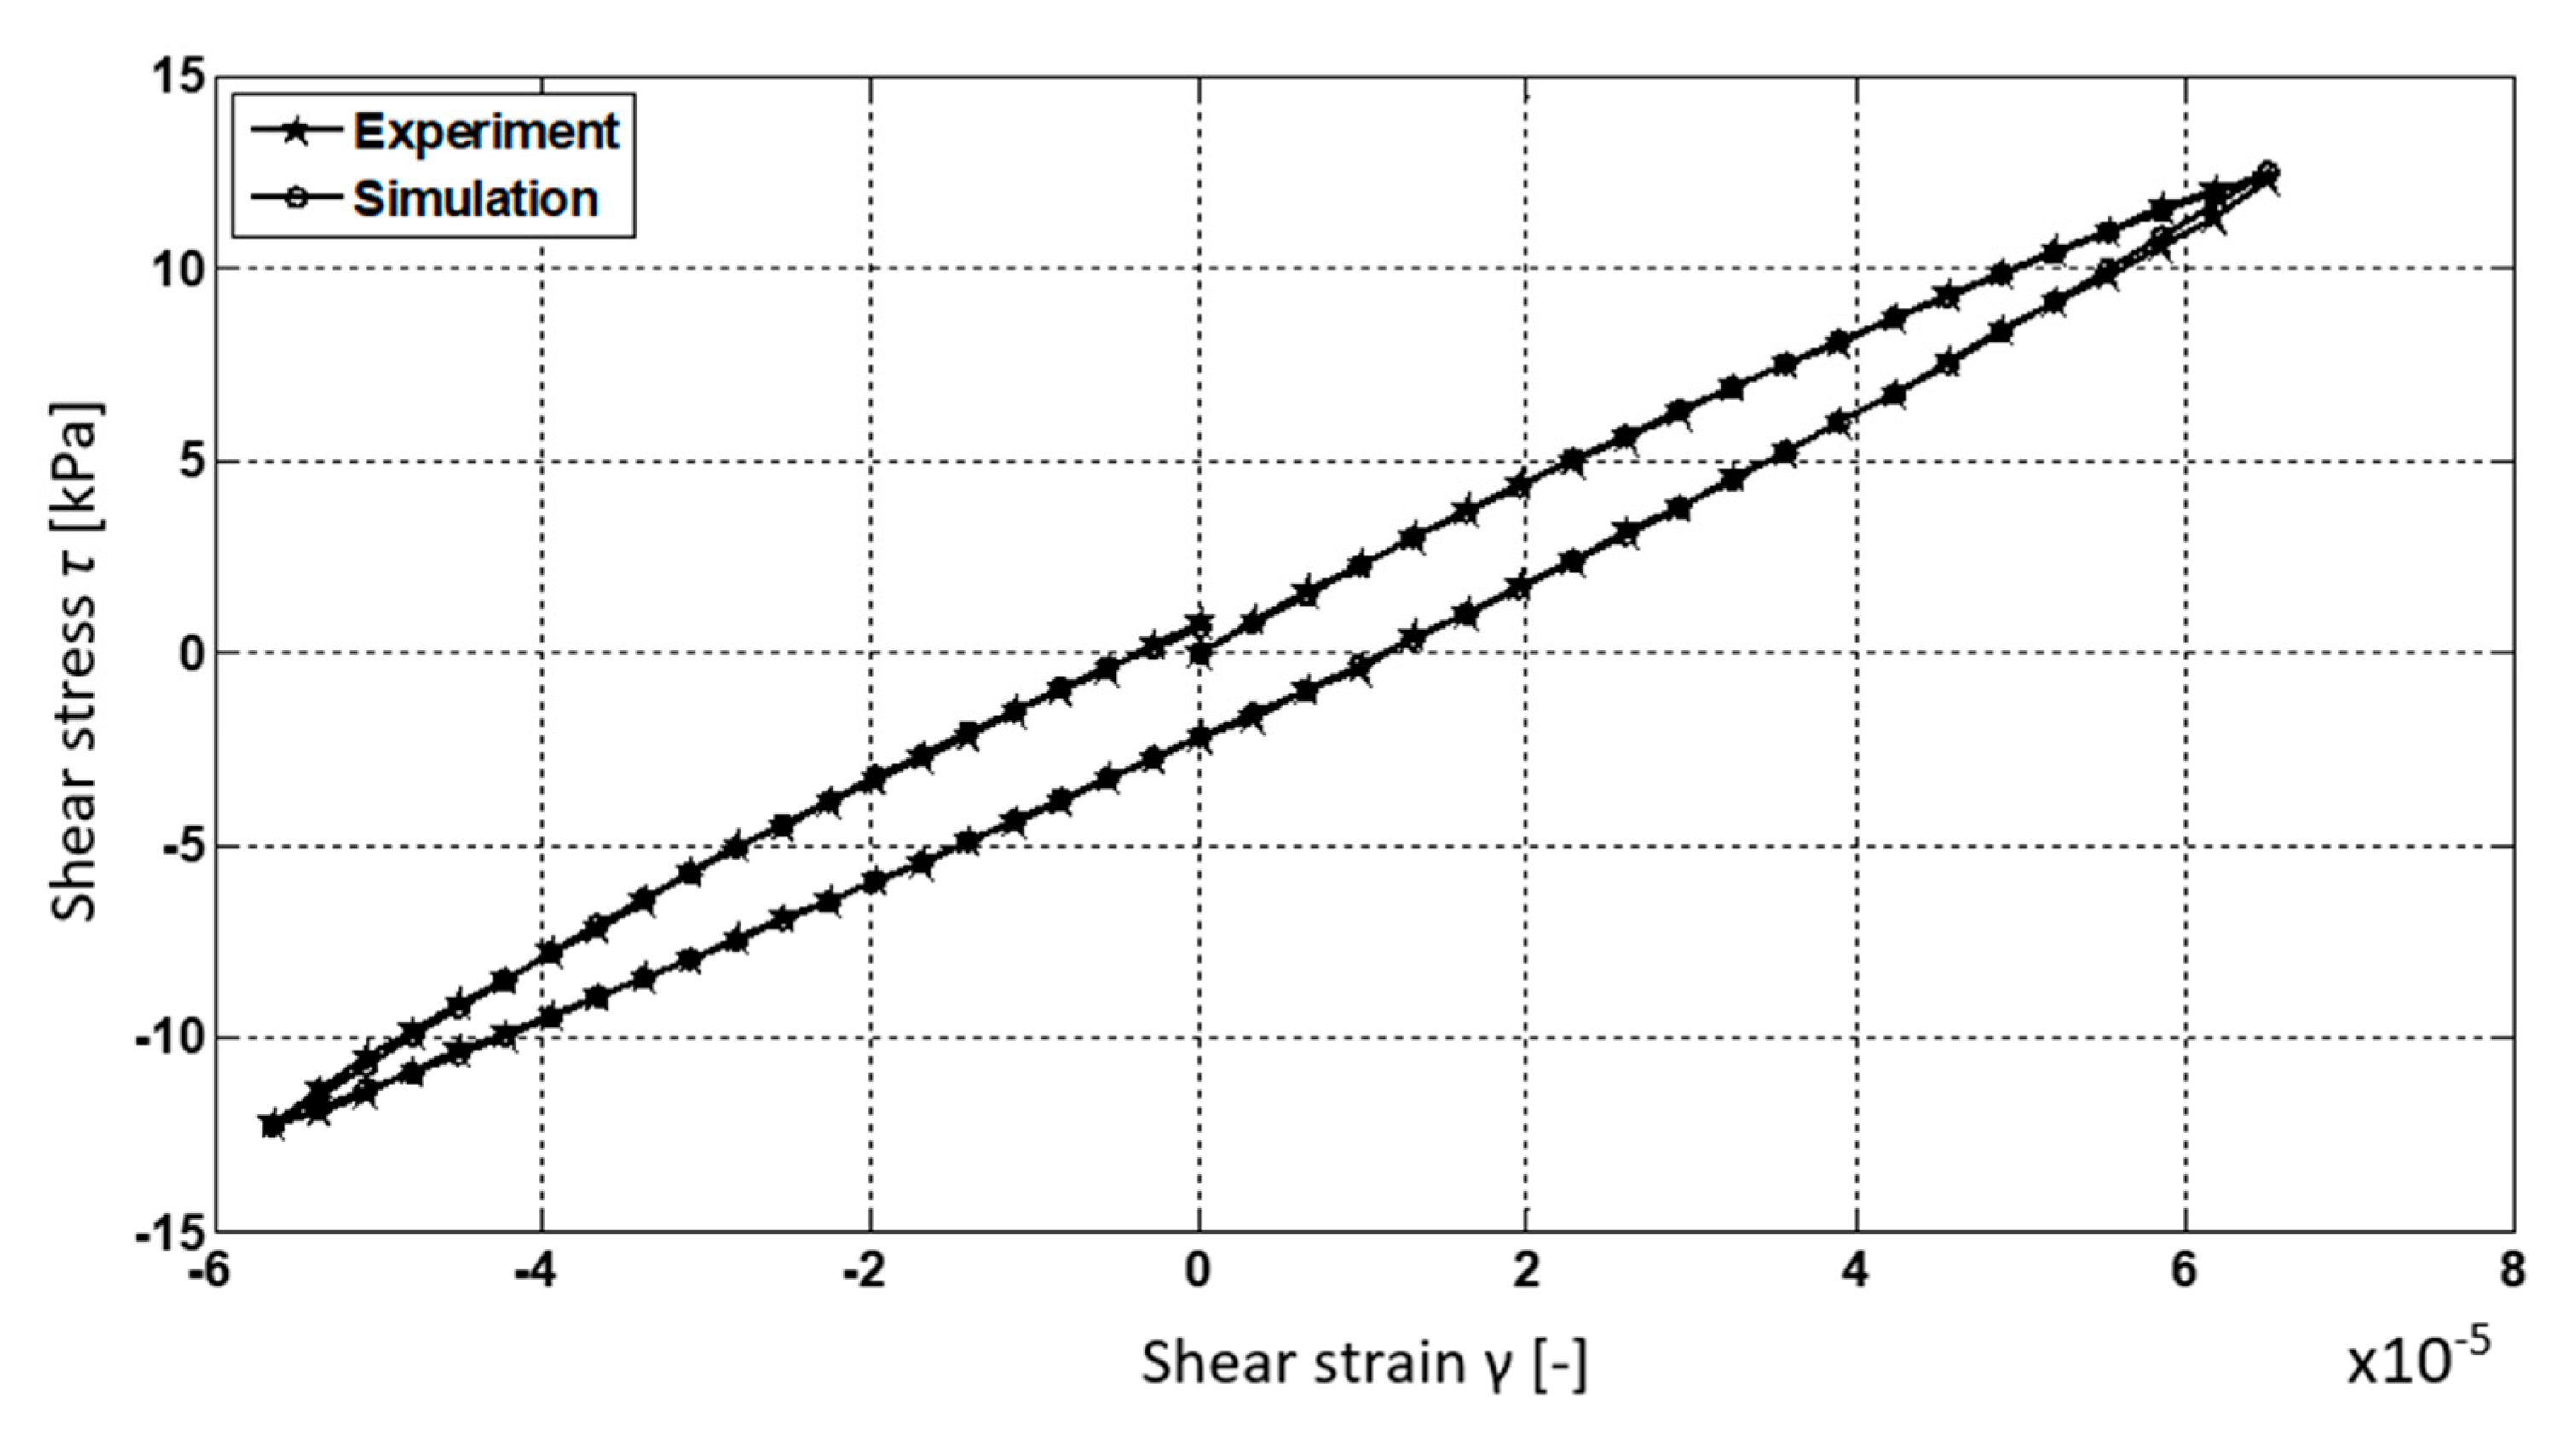
The degree of nonlinearity can only be determined through repetitive G evaluation for different γ values. Therefore G(γ) can be obtained with iterative back analysis of a dataset from a single TS test. The τ(γ) relation in numerical simulation is successively fitted to the τ(γ) from the laboratory experiment. The numerical simulations were performed using the finite element method (FEM). Particular attention was paid to appropriate modeling of boundary conditions.
It should be noted that the soil stiffness degradation function is not always monotonic, although it is usually a nonincreasing function. Therefore, a complete model of soil behavior under cyclic loading requires numerical recreation of the full loading path that includes incremental stiffness changes.
This nonlinearity problem is typically addressed using, e.g., tangential stiffness method, Newton–Raphson method, modified Newton–Raphson method, aided by numerical integration techniques (Euler or Runge–Kutta method).
To perform back analysis of results obtained in this study, a concept of hysteresis loop modeling based on the Masing’s rules was programed in C language (program TS.exe developed by the authors). A detailed description of the algorithm can be found in [51].
Determination of the non-linear G(γ) relationship is done through iterative fitting of FEM-simulated τ(γ) to the τ(γ) from TS tests. The goal is to minimize the value of the objective function L(), which measures fitness of the solution. In order to do that some initial form of the G(γ) function is assumed and modified in a way that minimizes the value of the objective function L(). This interpretation method can only be used when the most probable shape of the G degradation function is known. The optimization process can be limited to finding the coordinates of data points that are corresponding to the experimental dataset (computational nodes).
To minimize L() function a non-gradient optimization method was used, specifically, the Nelder–Mead algorithm [52]. The algorithm sequentially generates simplices. For an n-argument objective function the simplices are defined by n + 1 vertices. The Nelder–Mead algorithm is implemented in Matlab in the fminsearch(·) function. It is based on concept of sequential searching of minimum [53]. To find the solution of a back analysis problem a program developed by the authors (TS.exe) was integrated with Matlab.
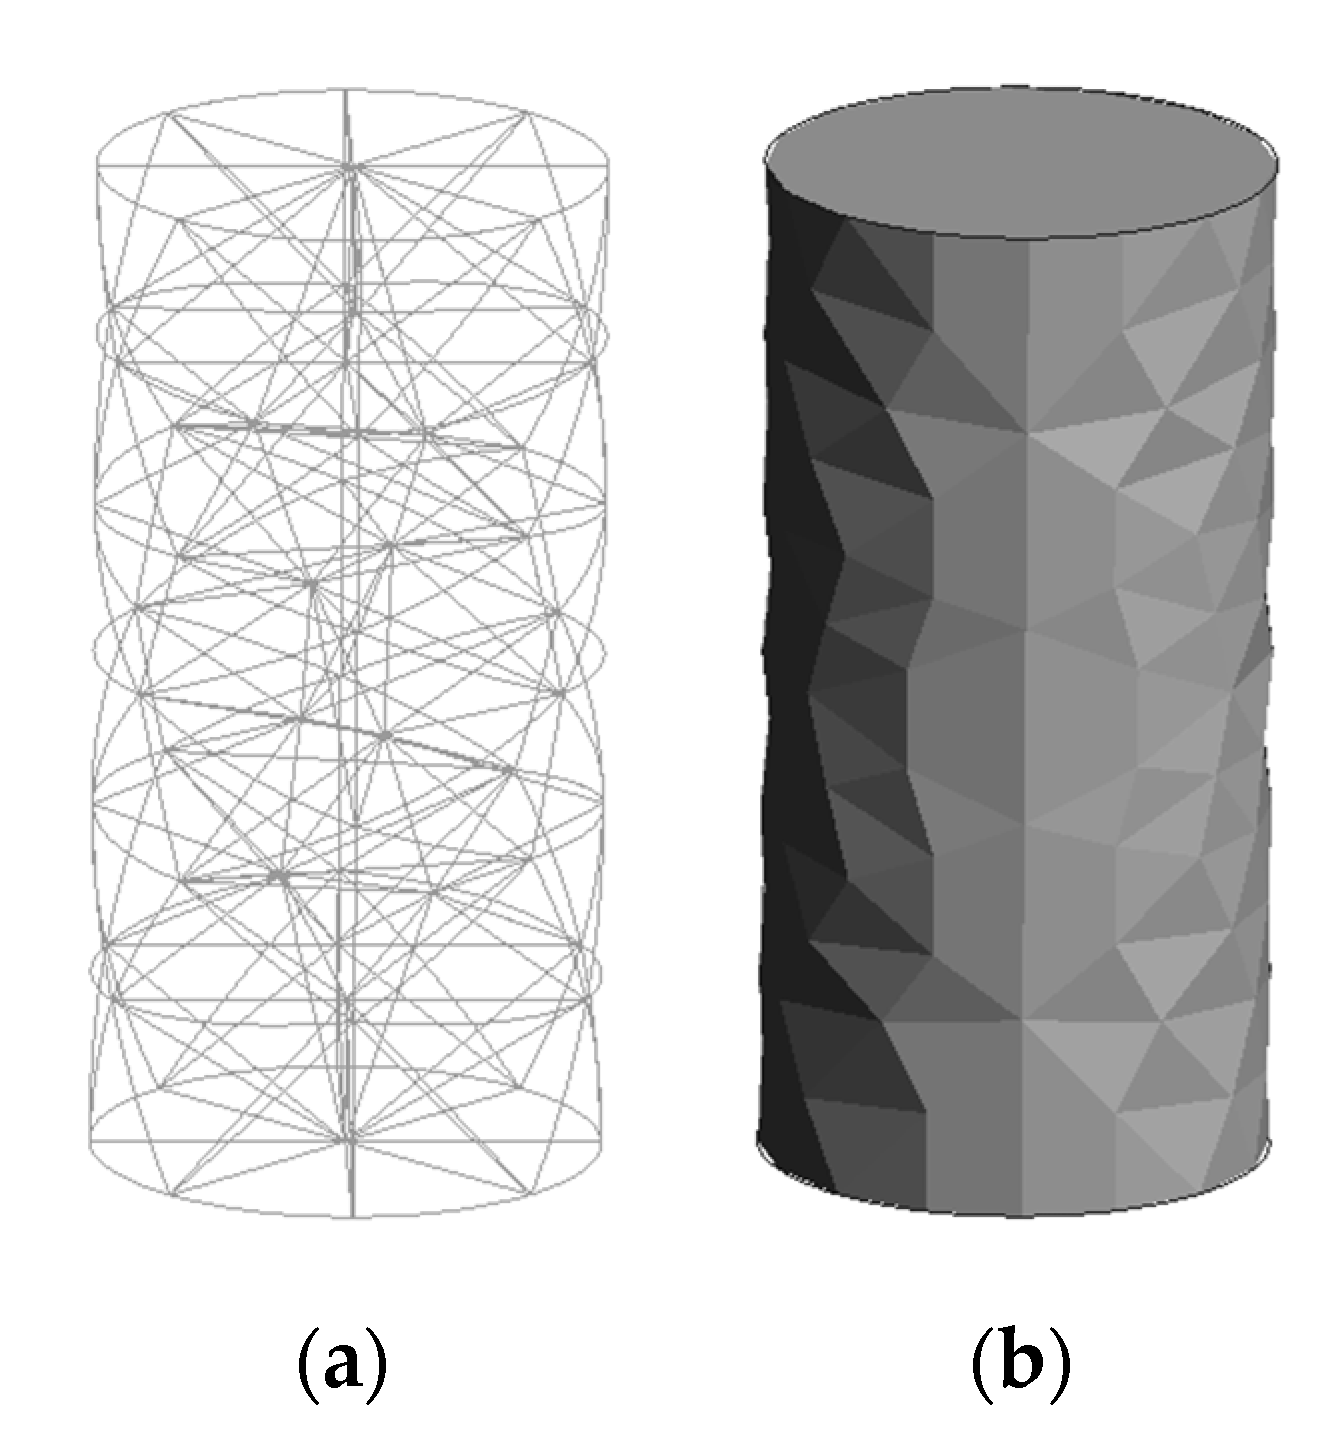
Numerical model of the specimen was discretized using 167 TH 10 15 elements (tetrahedral elements with 10 nodes and 15 Gauss points), 338 nodes in total (Figure 8). Geometrical parameters and boundary conditions for the numerical model were set to match the physical parameters of real specimens tested in laboratory experiments (Table 5).
A numerical simulation of one full cycle took about 14 s (Intel Core i7 [email protected] GHz, RAM 32 GB@1600 MHz). Time of the complete back analysis of one experiment did not exceed 3 h.

3. Results

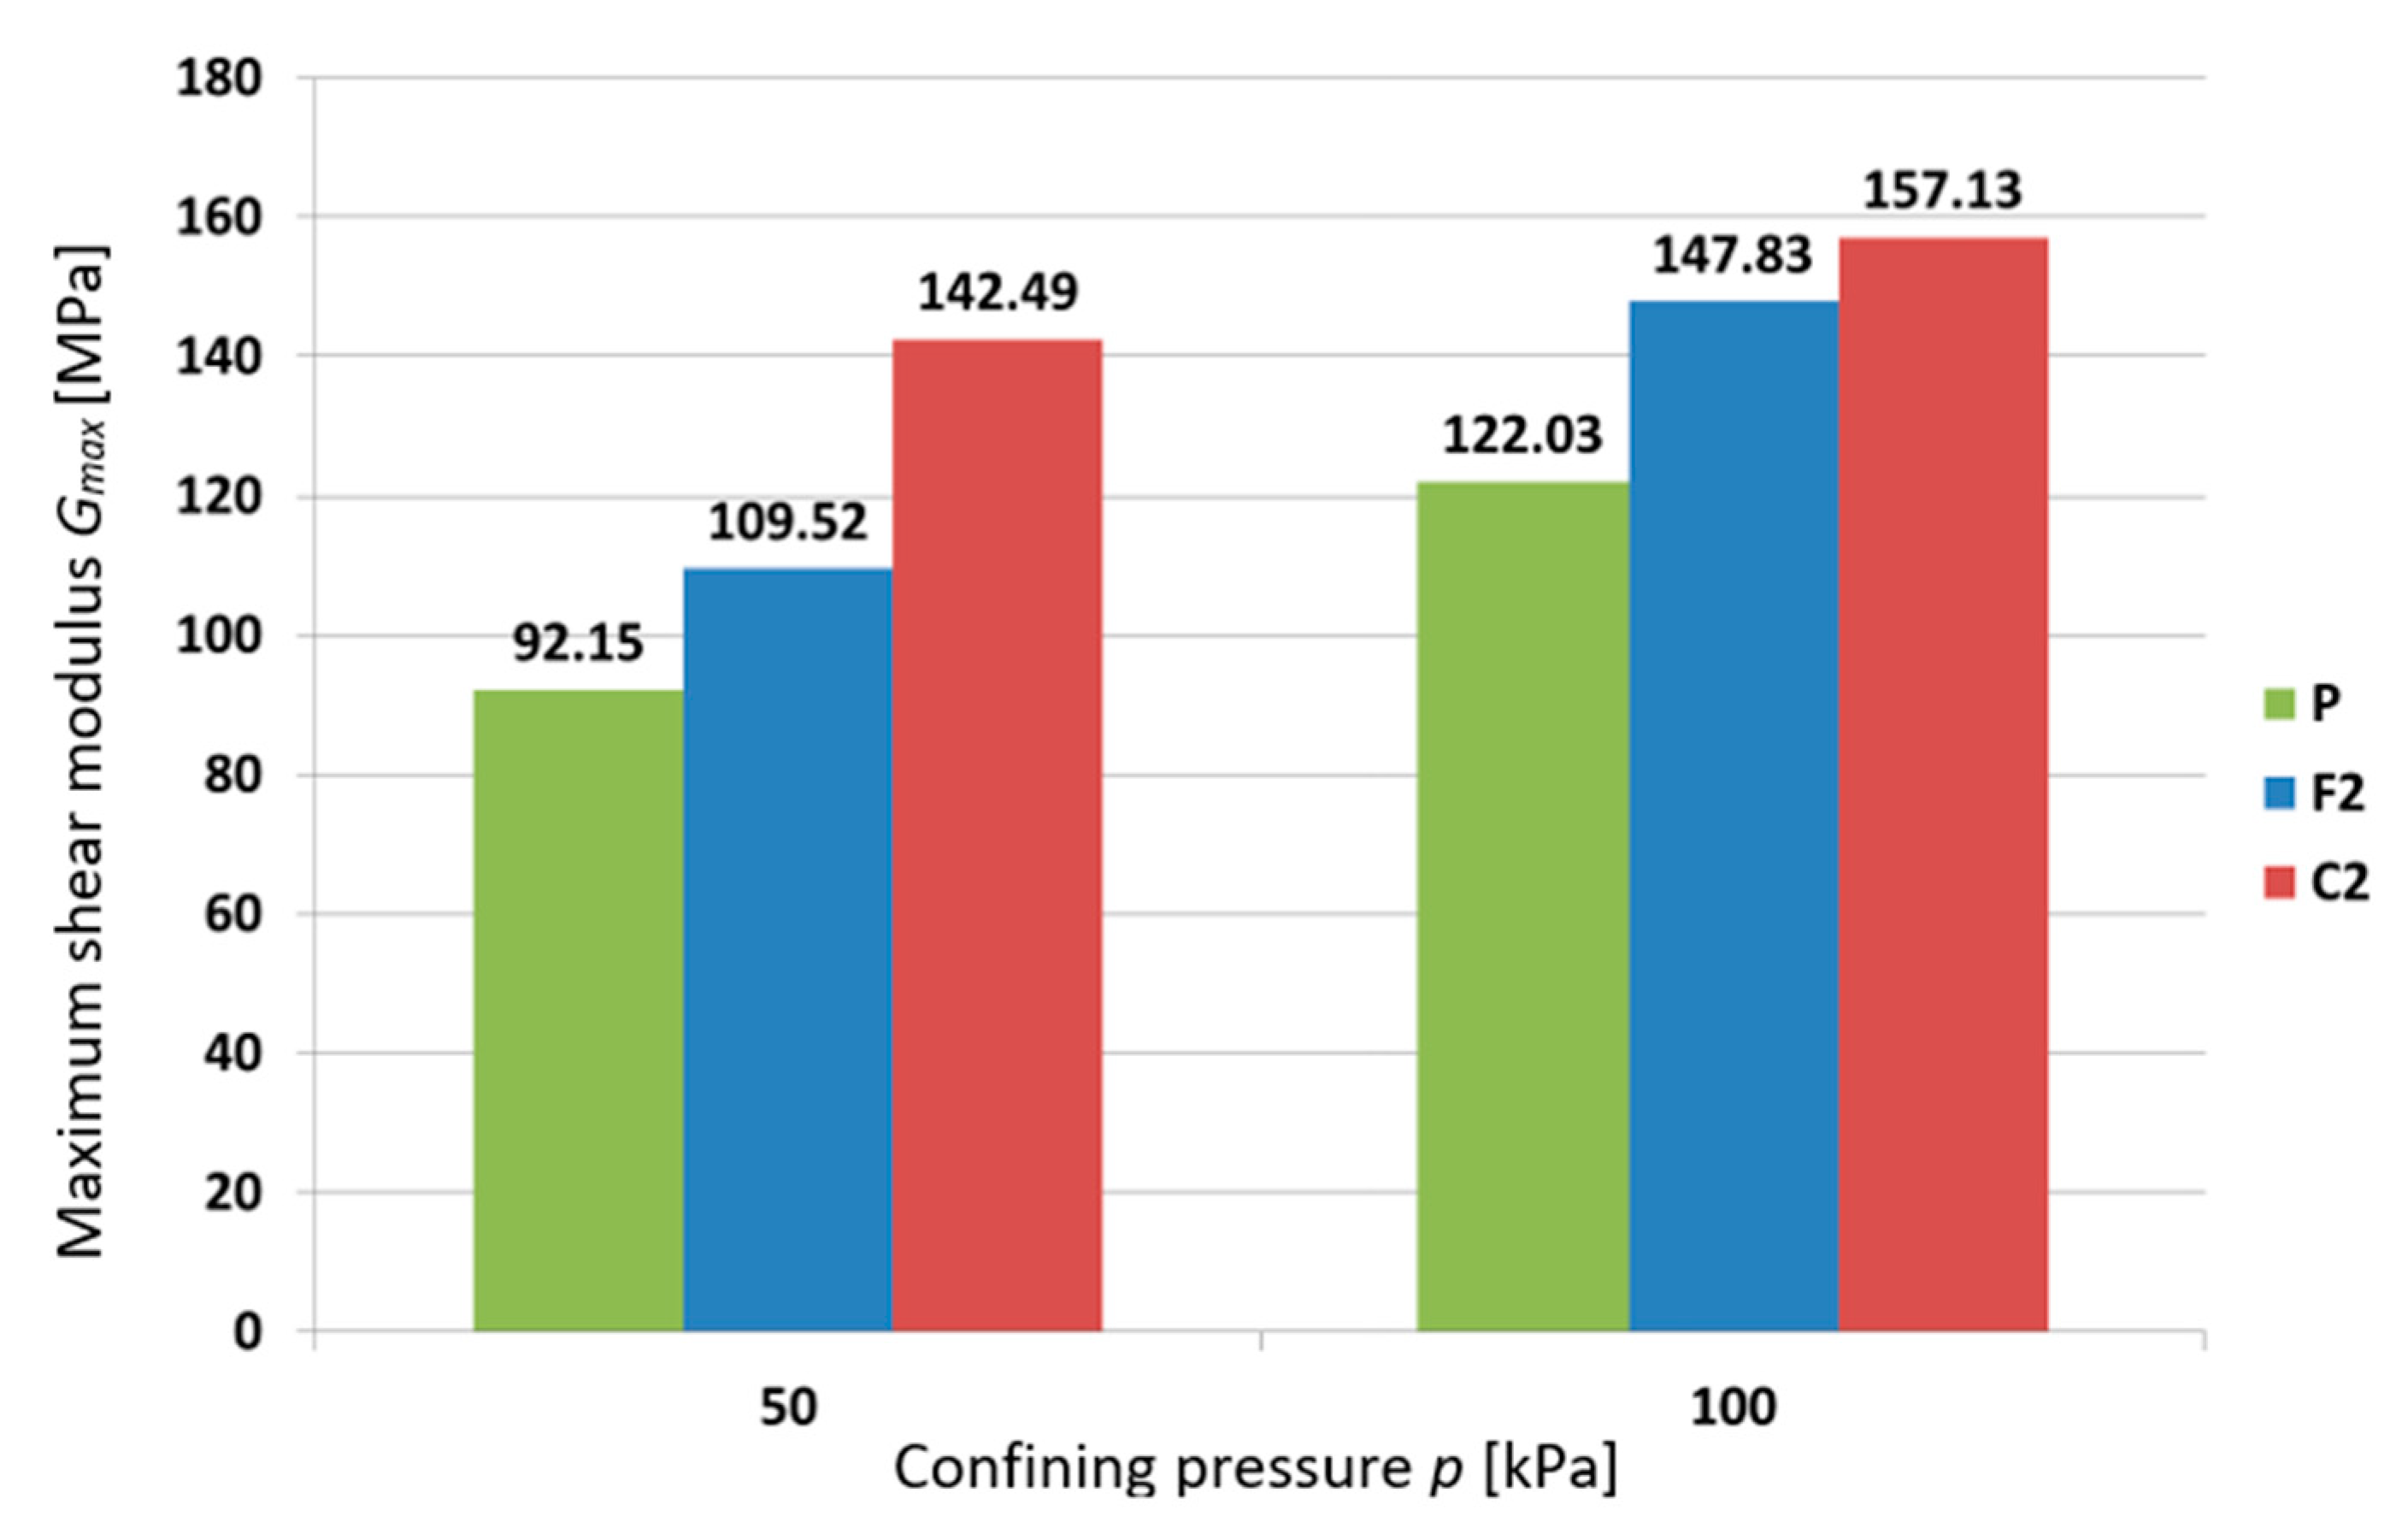
The confining pressure p, applied in the RC/TS cell on the sample was equal to 50, and 100 kPa. After applying confining pressure, RC tests were performed. Specimens 1 and 2 were tested directly three times: before mixing with chitosan (pure silica sand, specimen P), after specimen preparation mixing (fresh specimens, F1 and F2) and after 7 days of chitosan solution binding (cured specimens, C1 and C2). Figure 9 and Figure 10 present the maximum shear modulus values for each type of specimen for different confining pressure values.
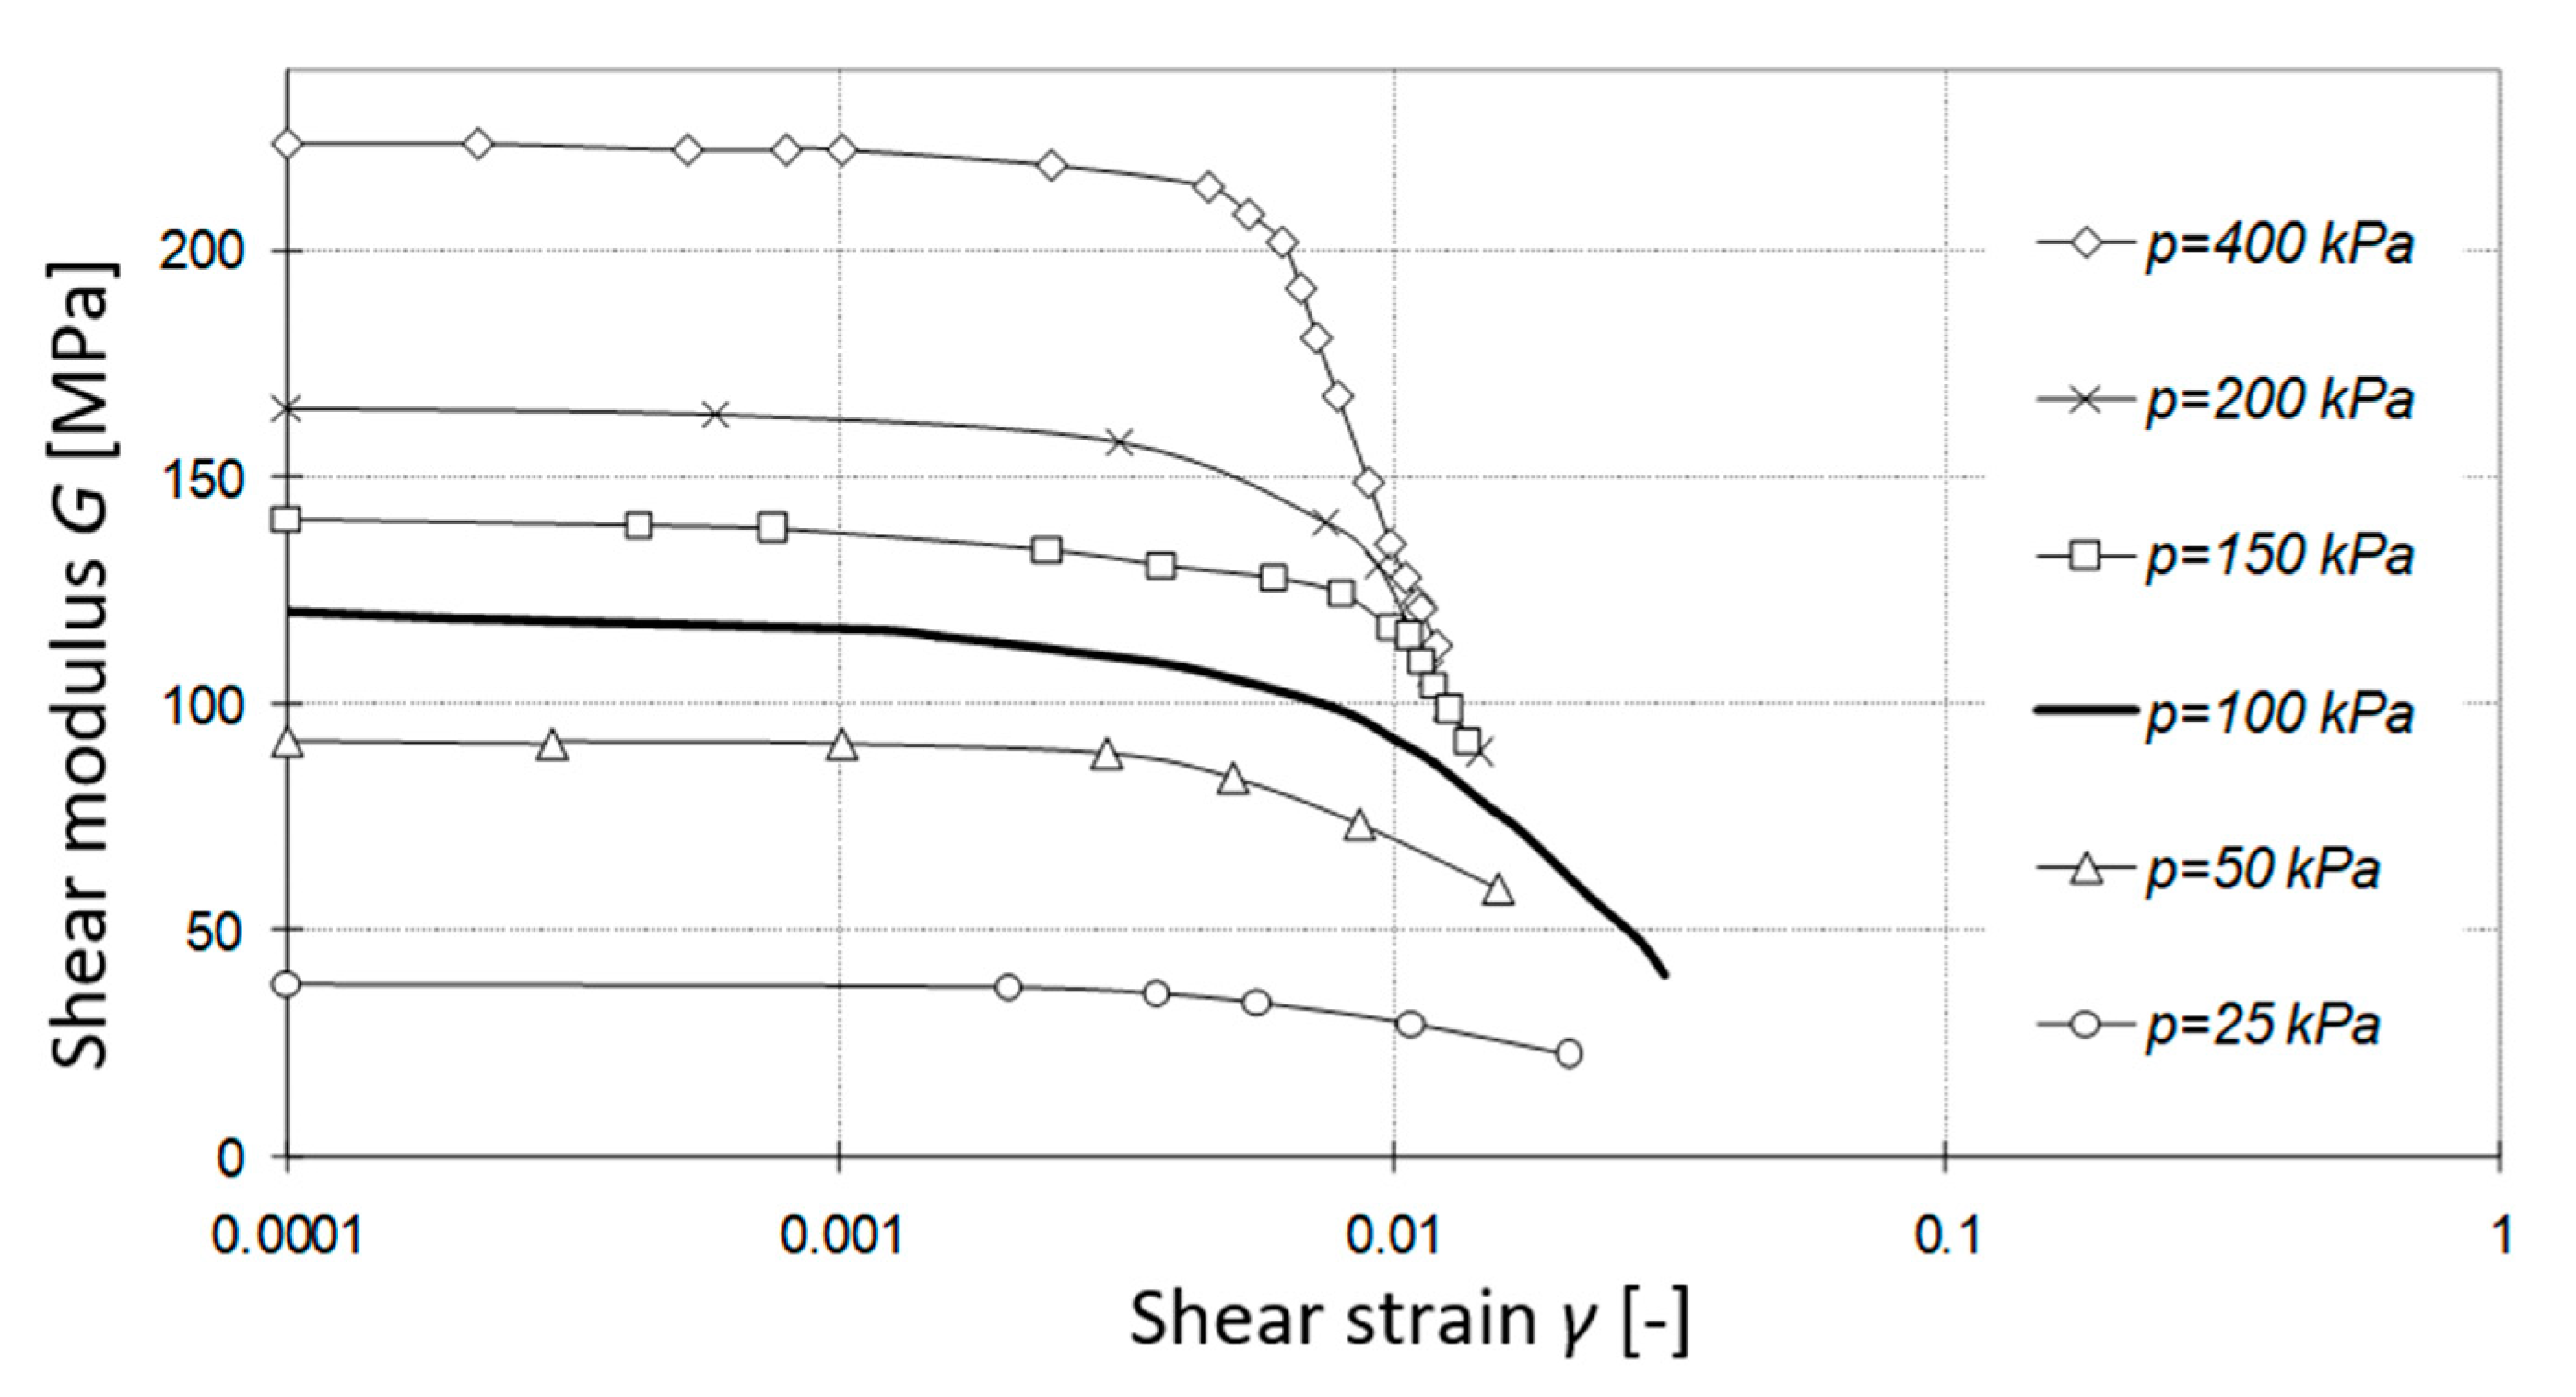
Figure 11 and Figure 12 present comparison of RC test results performed on pure silica sand specimen (P) at different values of confining pressure p.
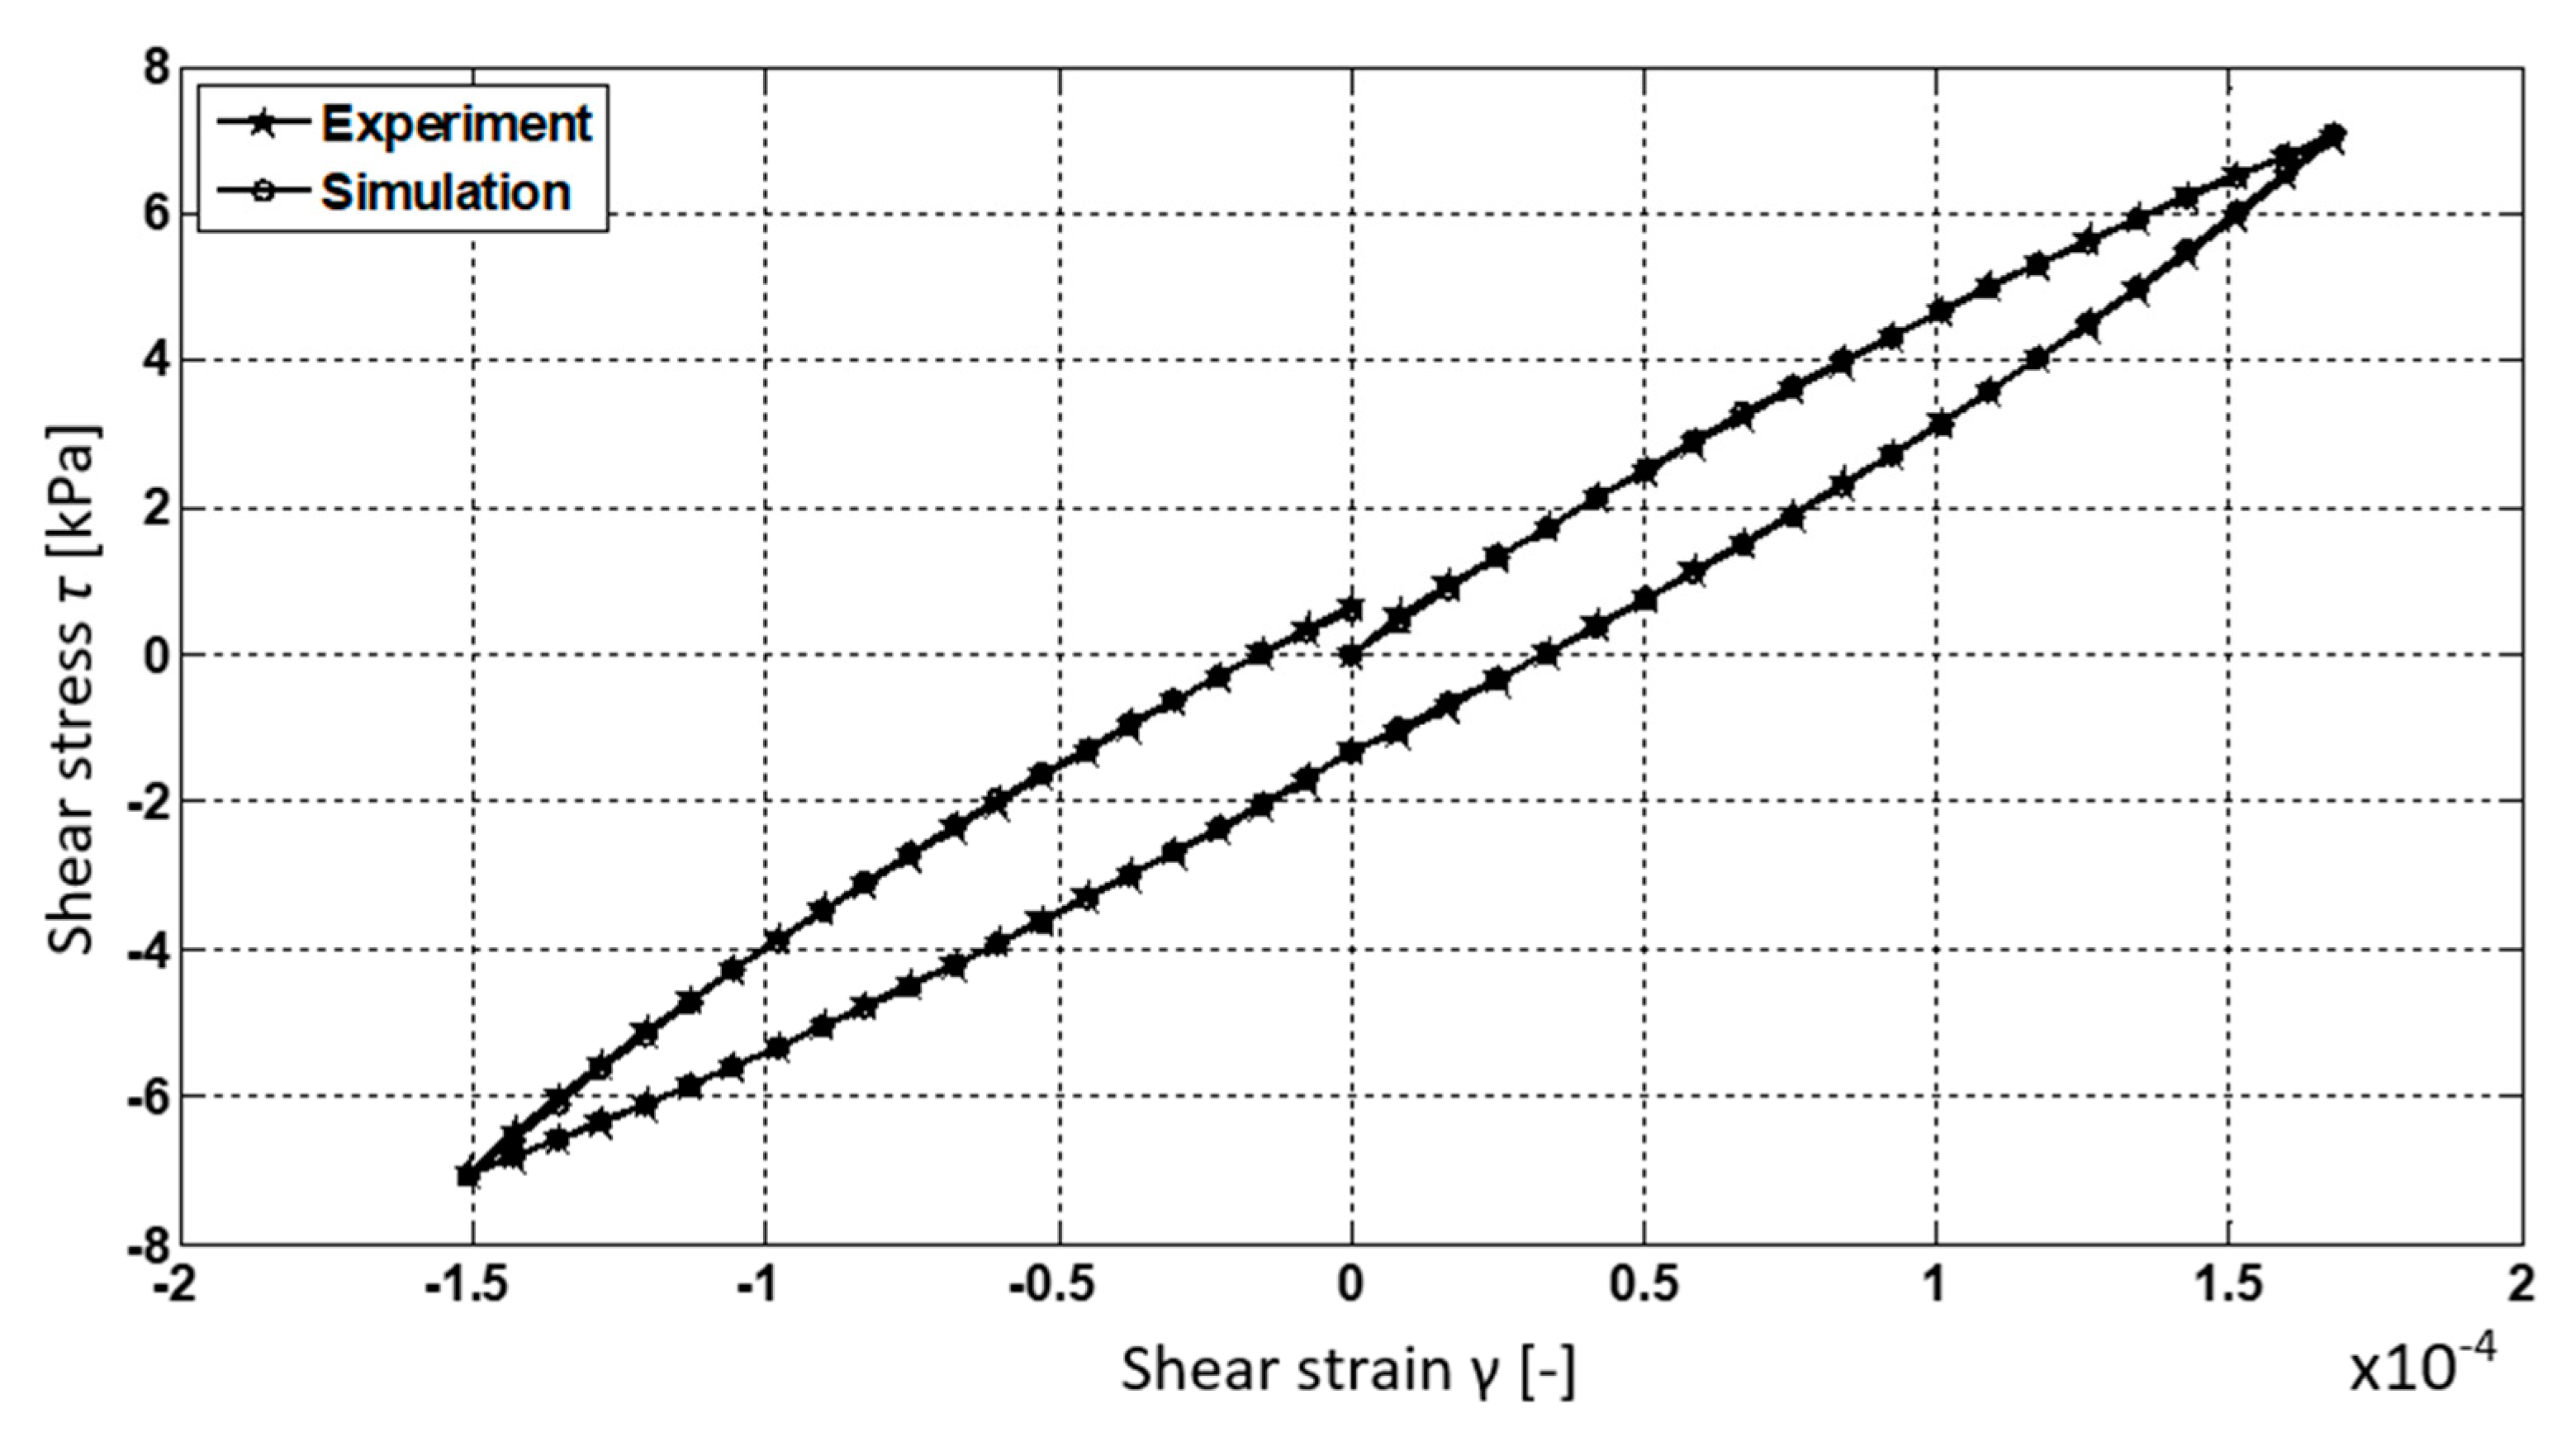
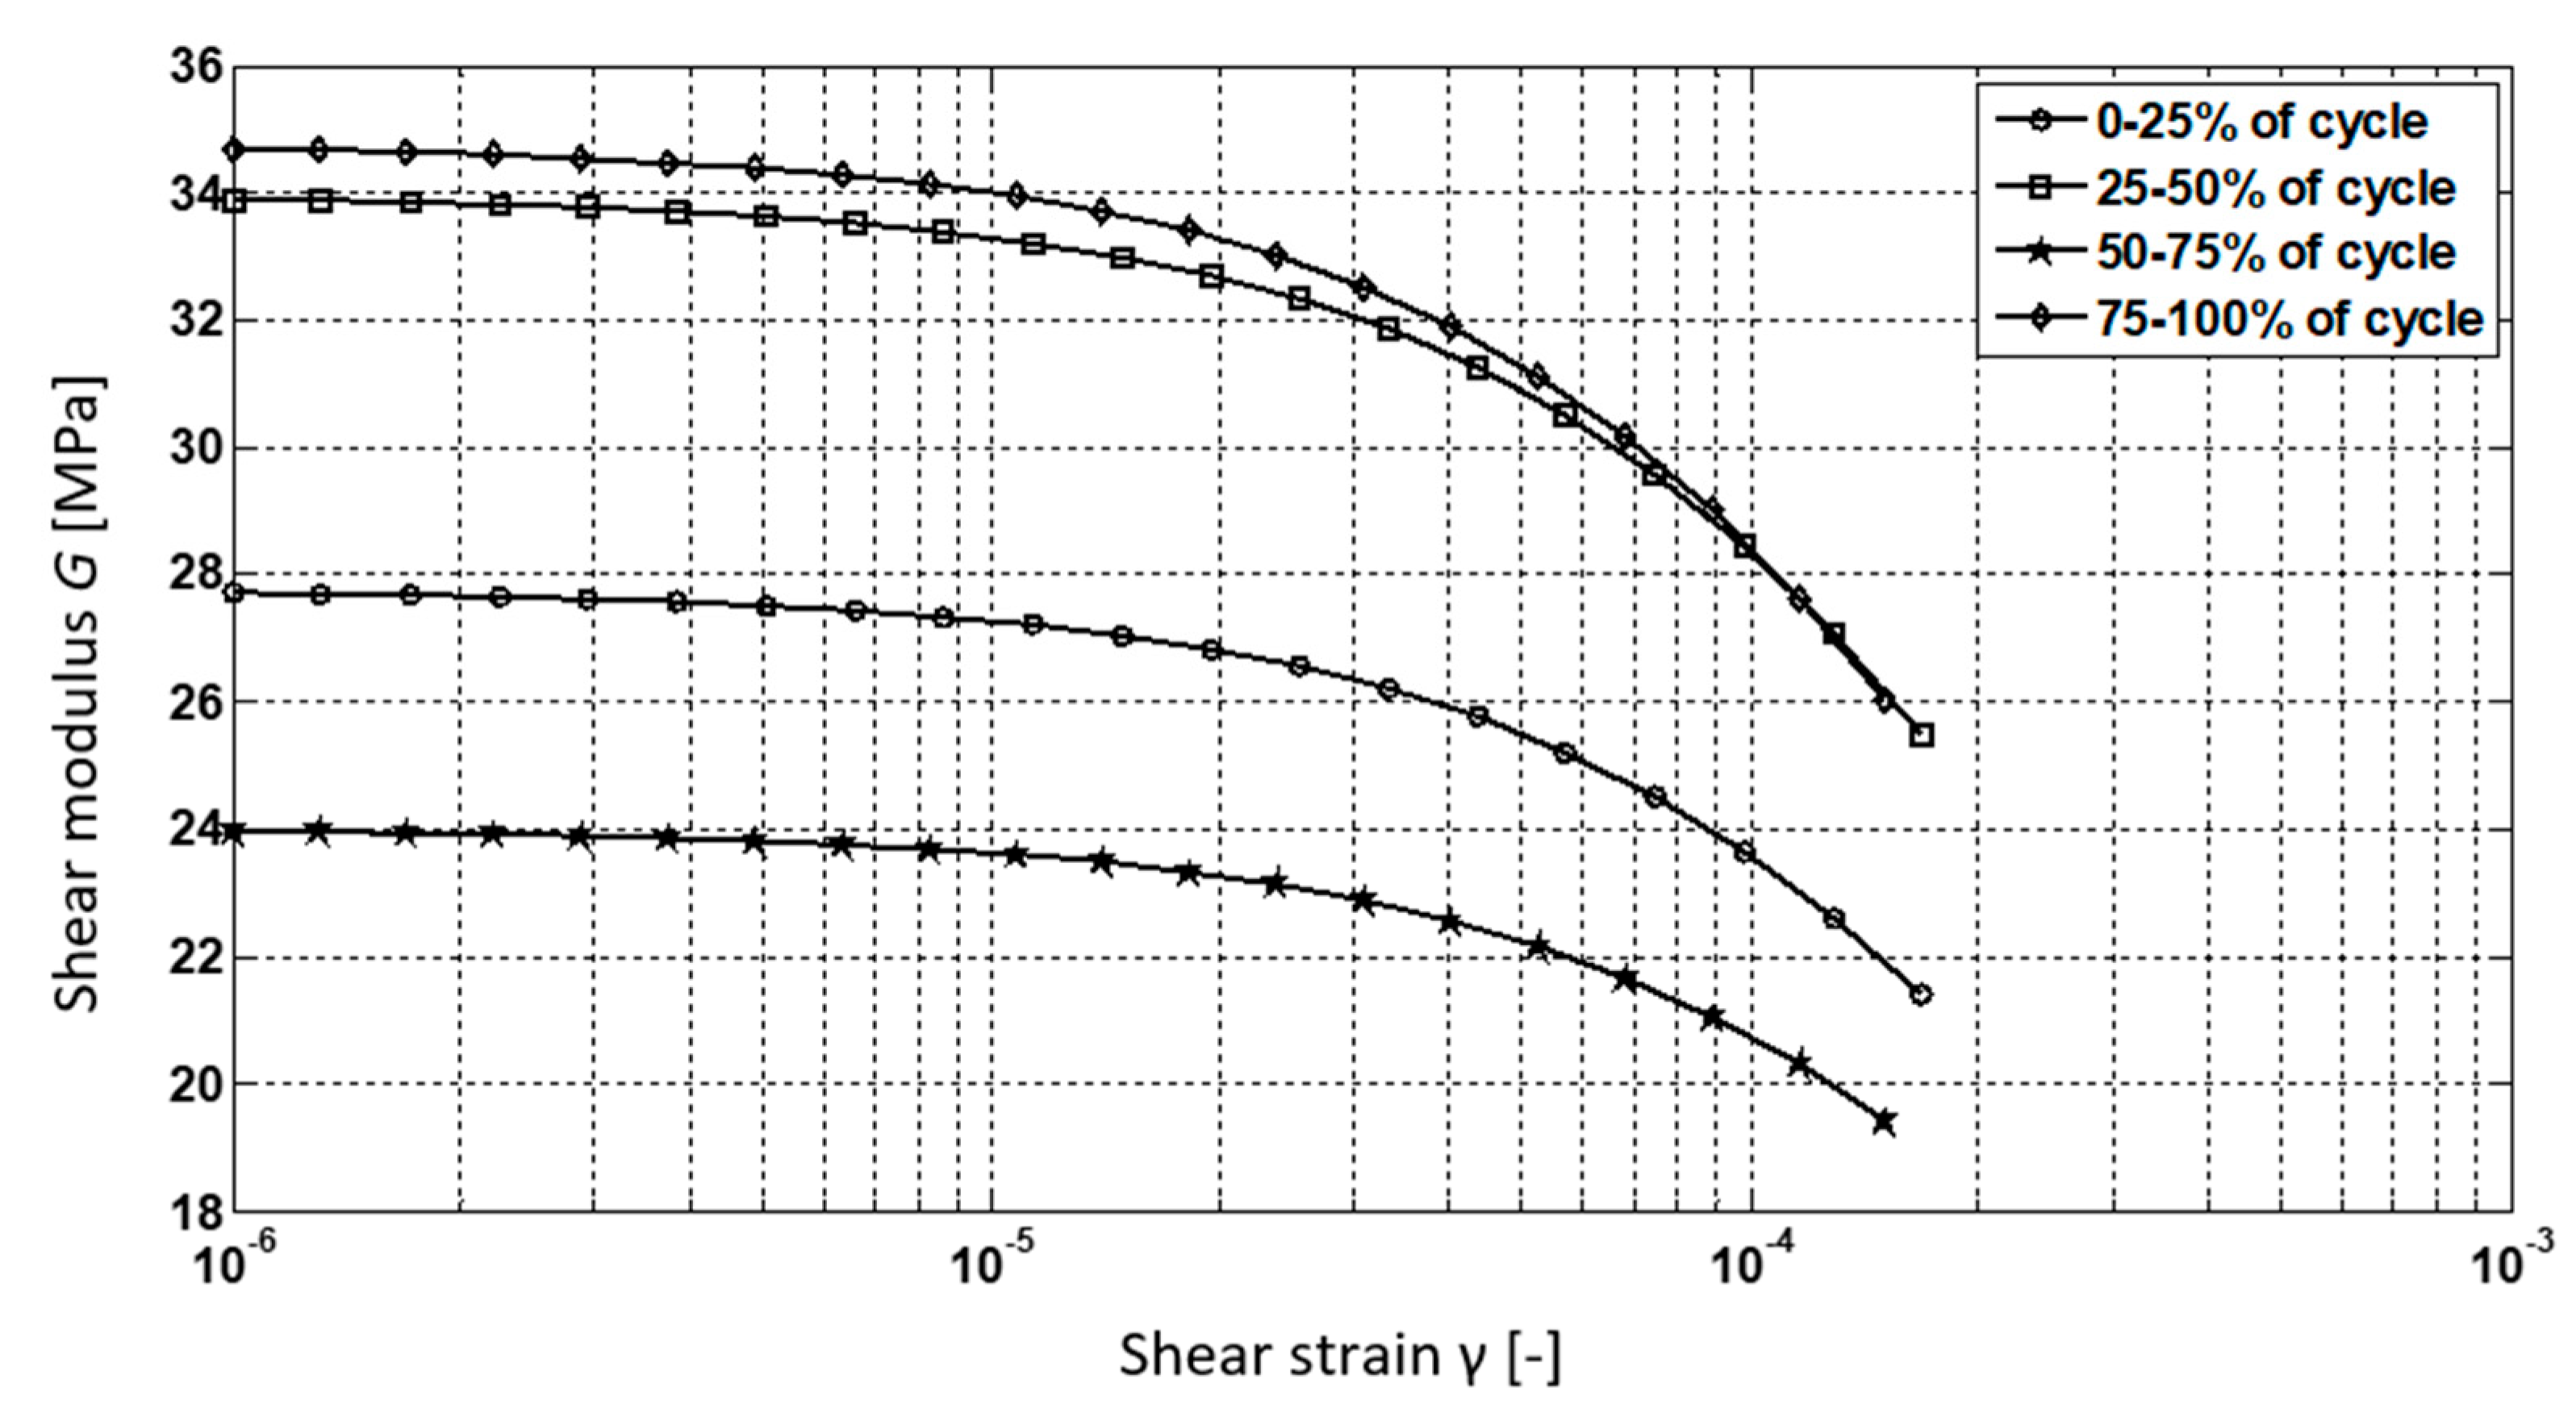
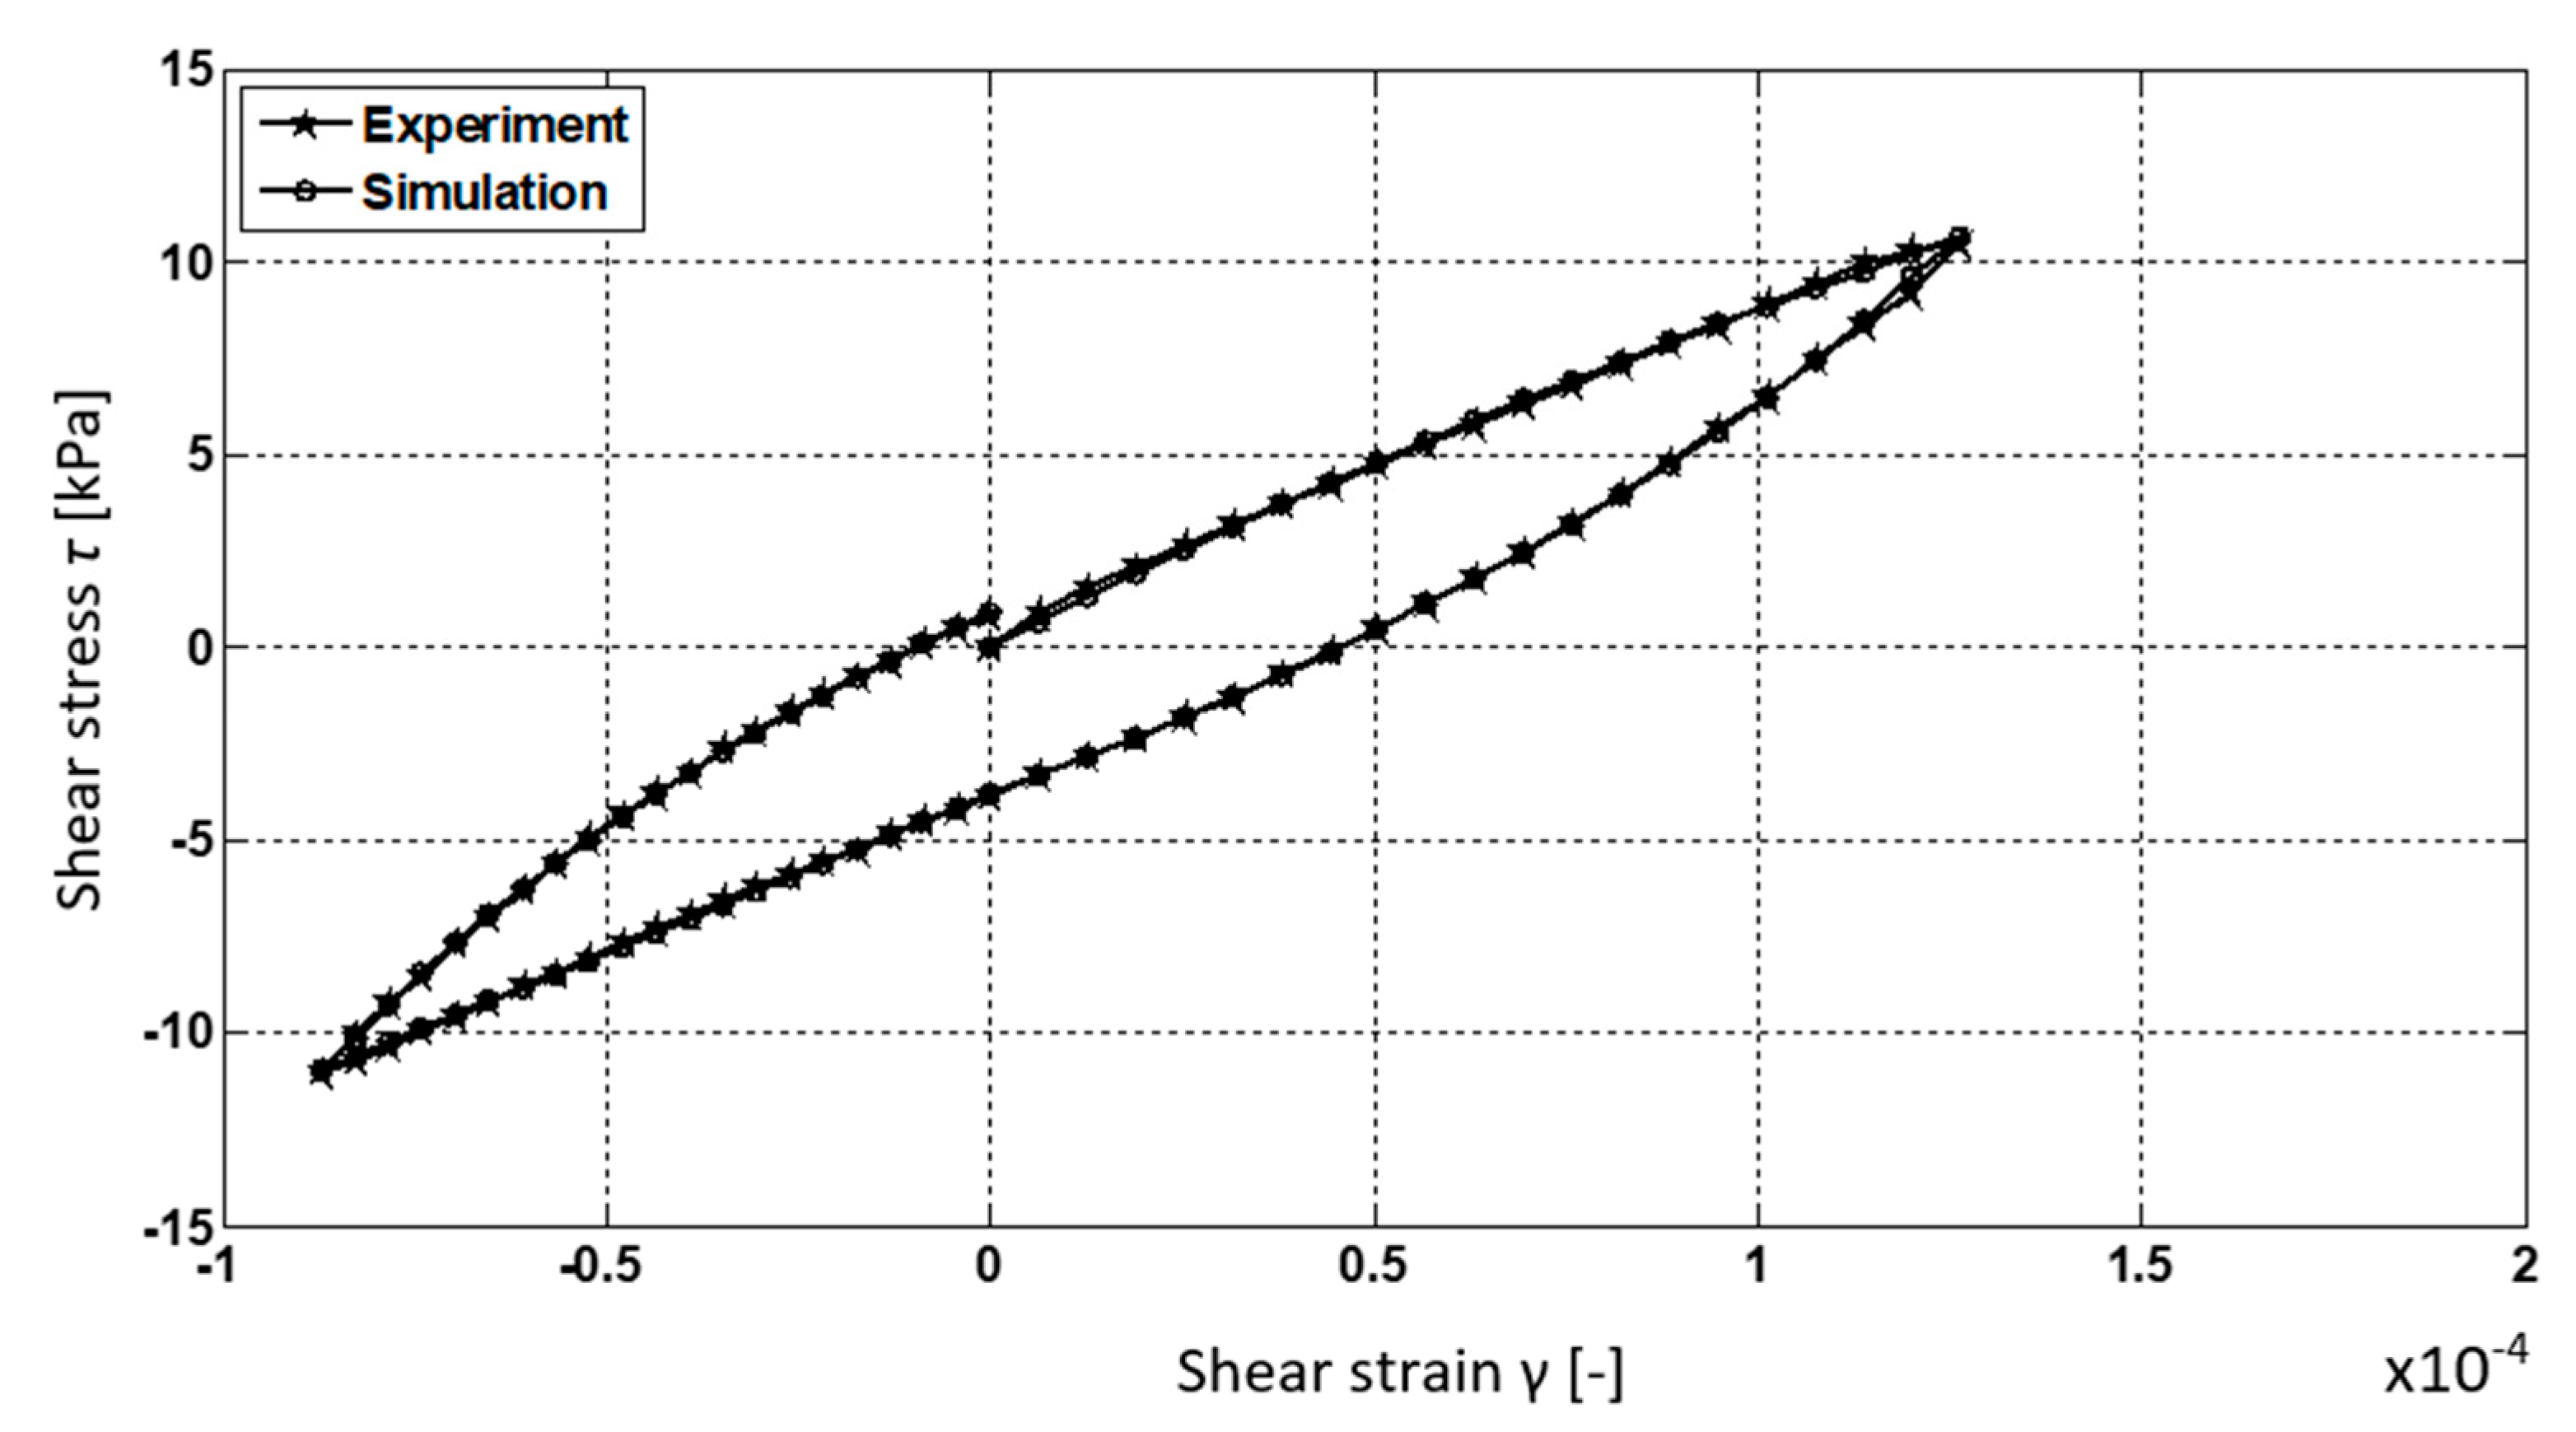
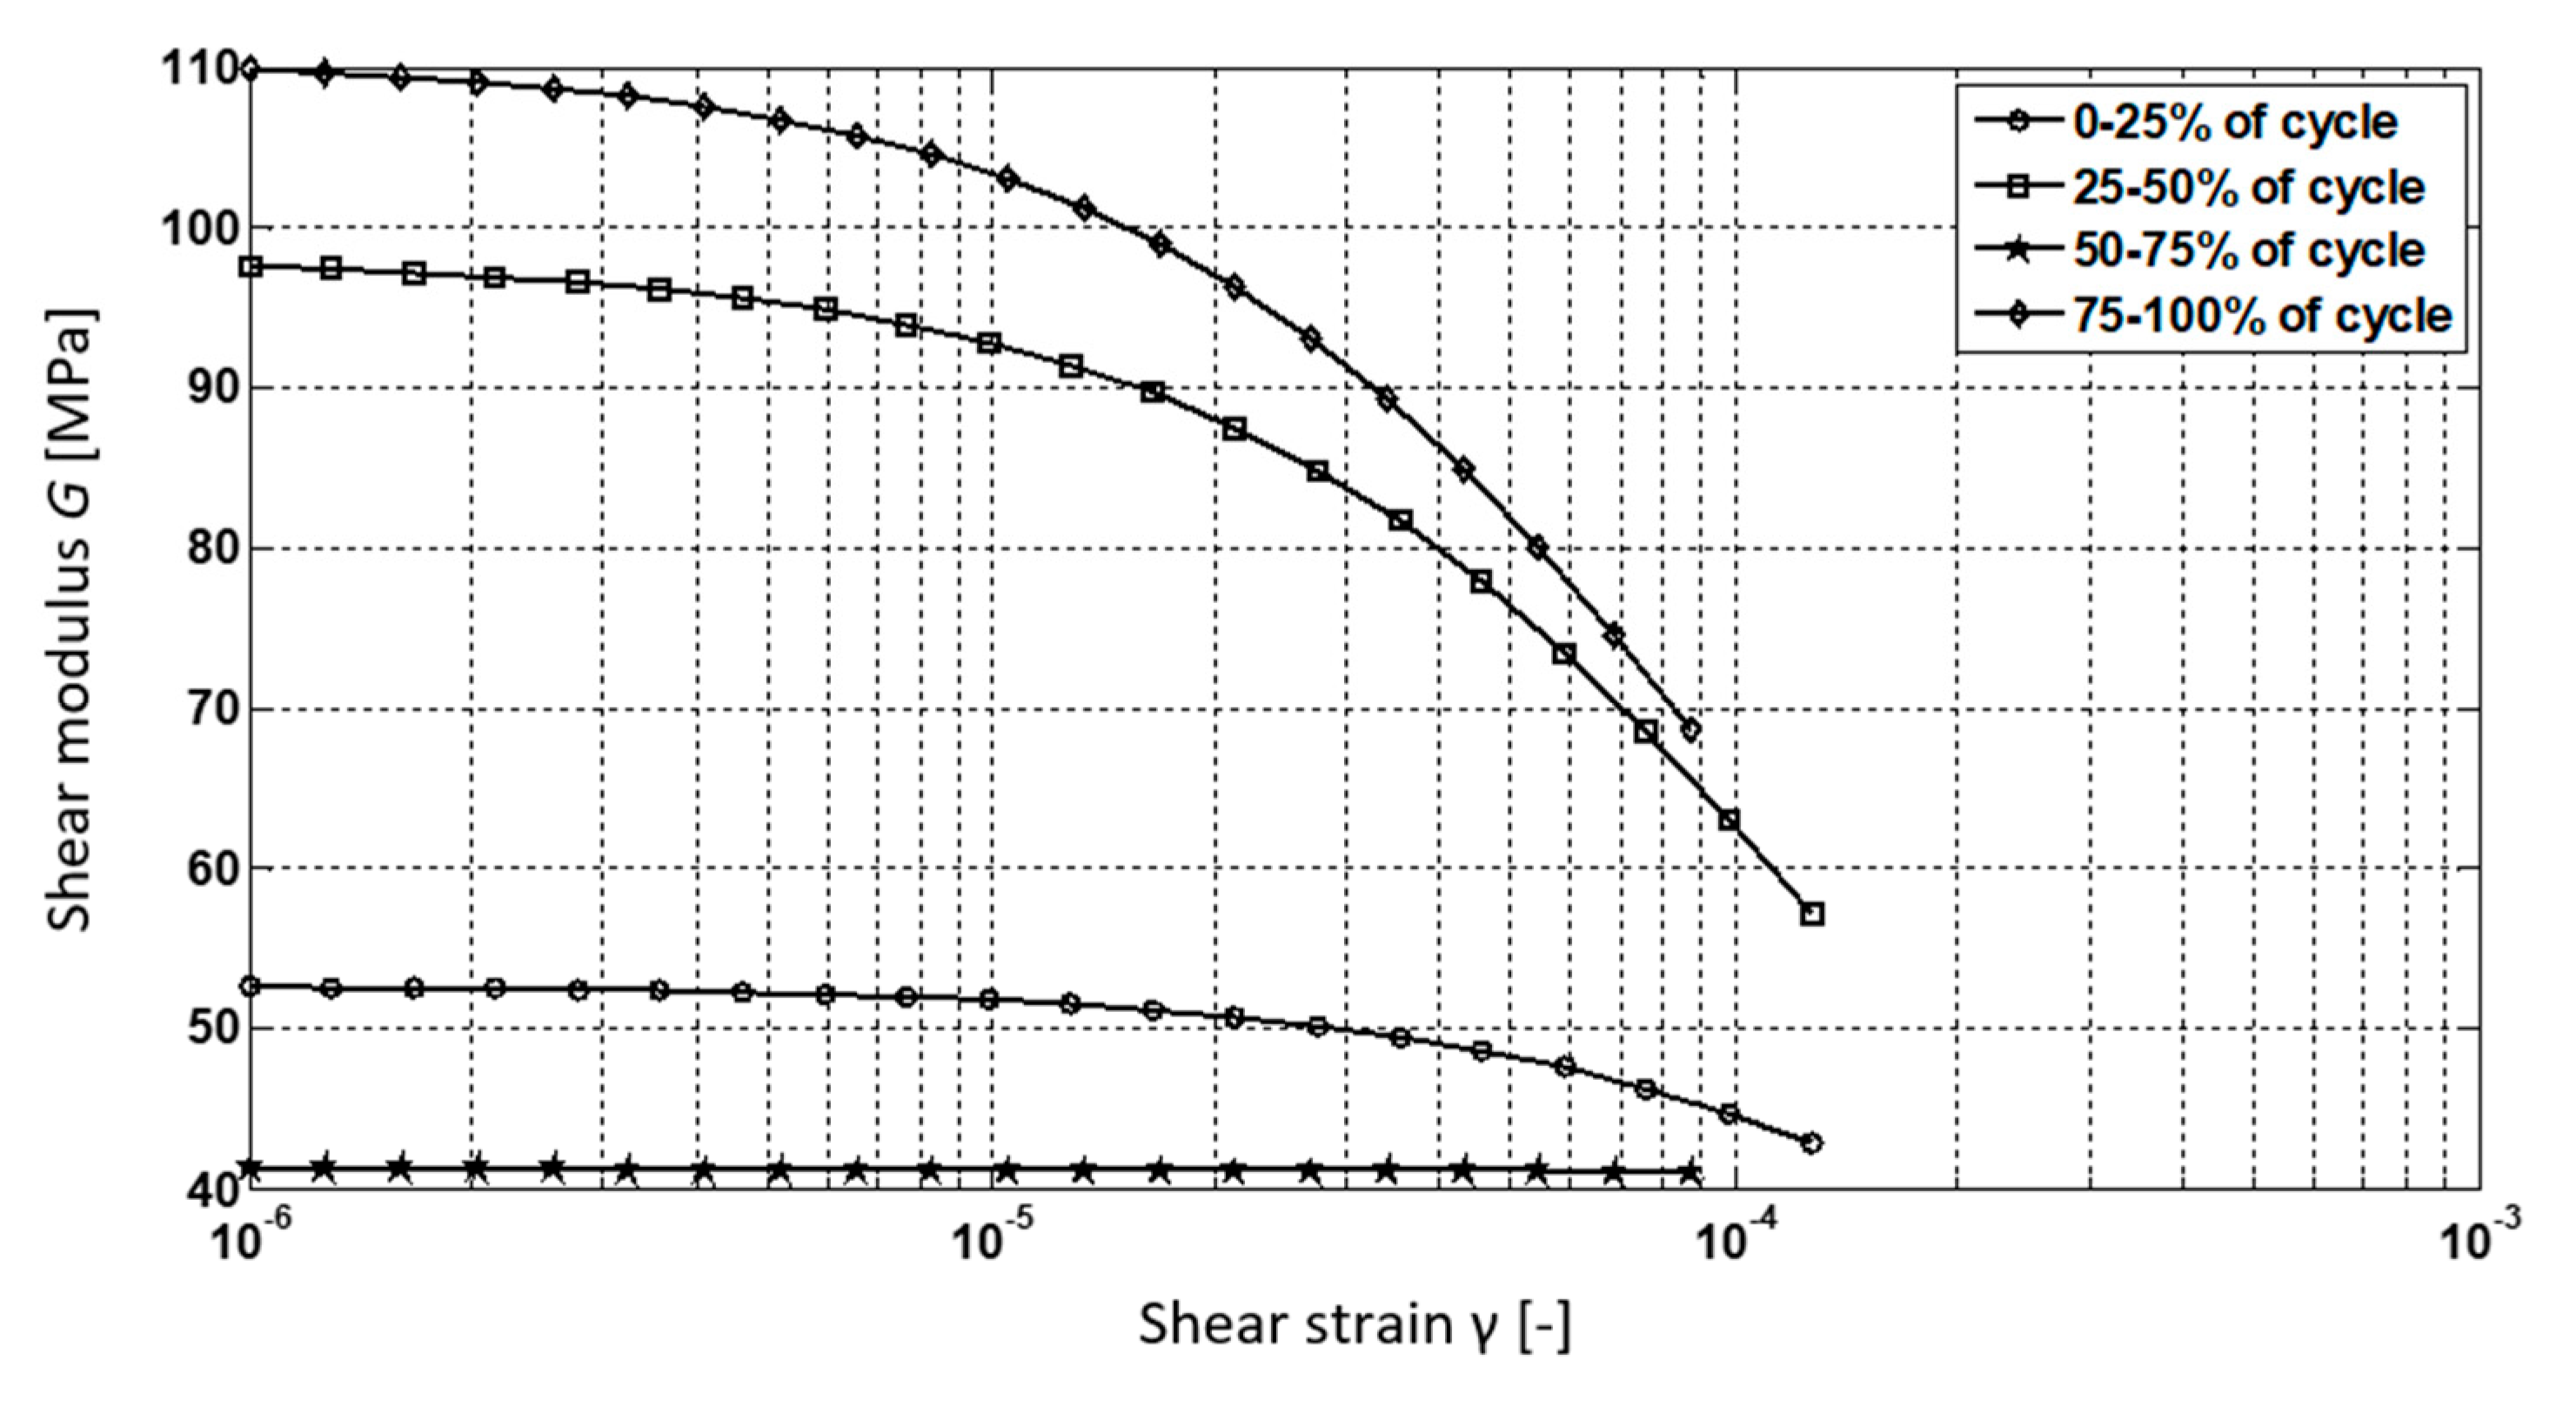
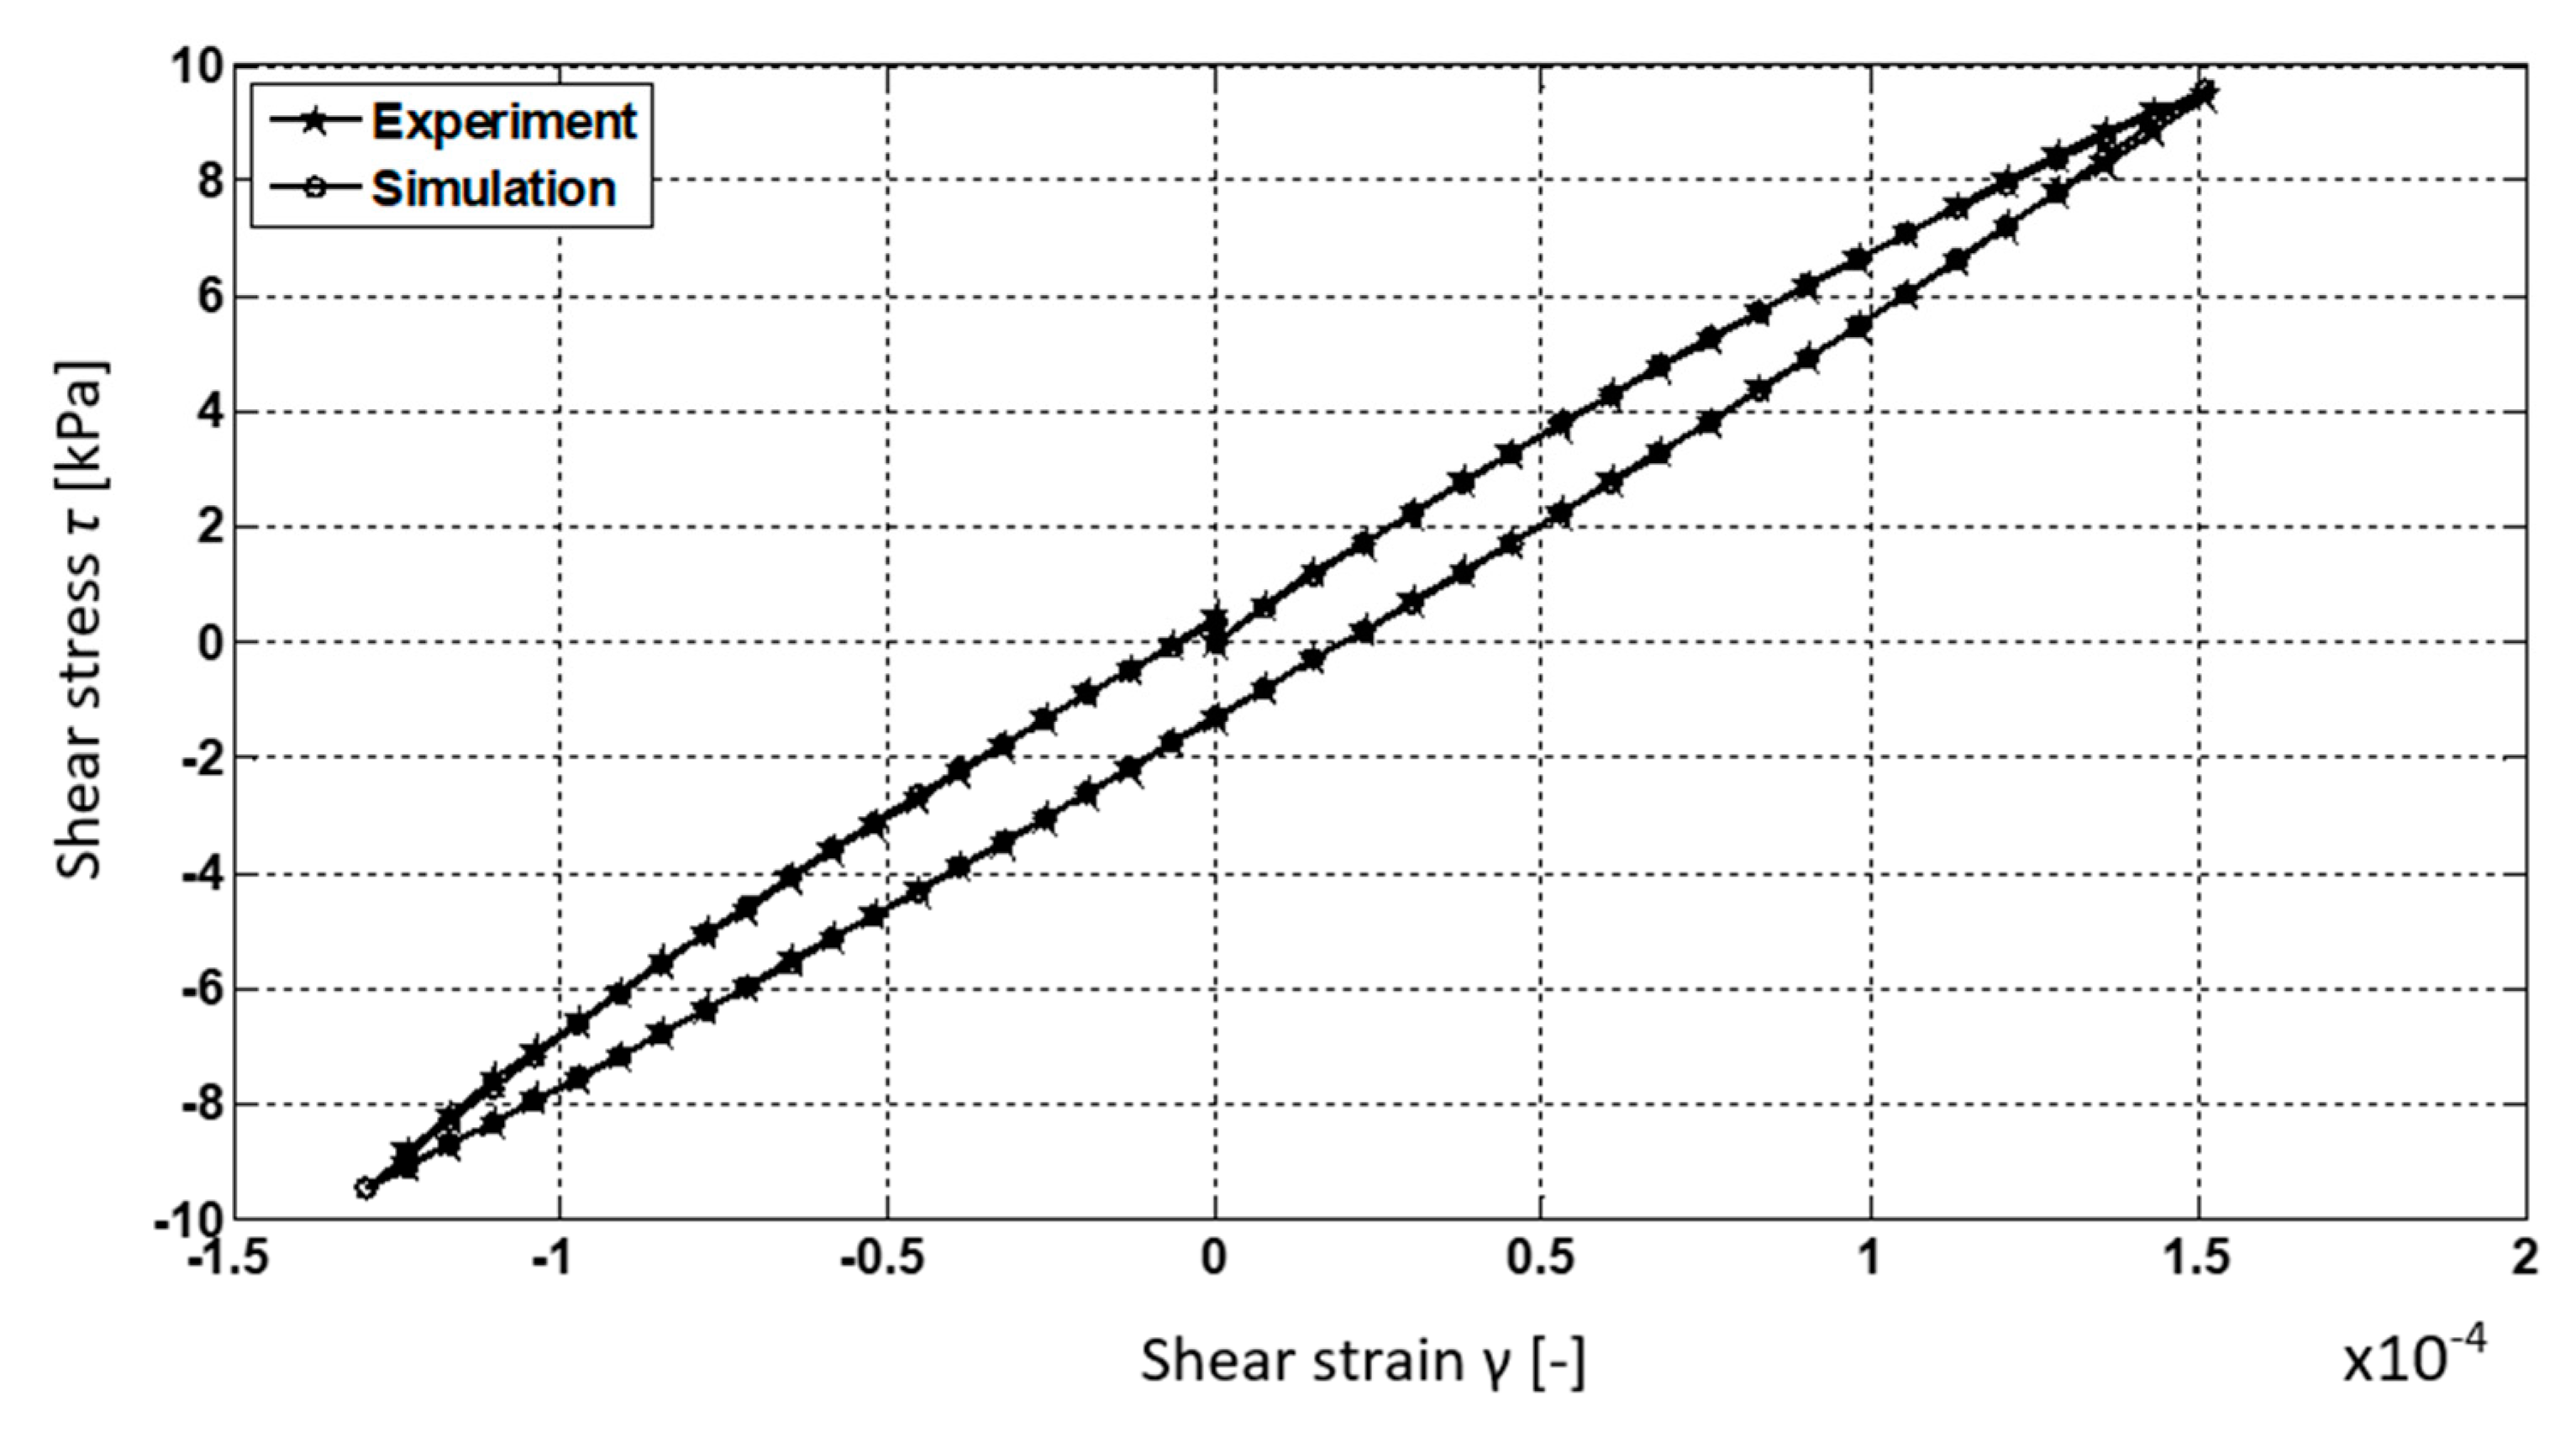
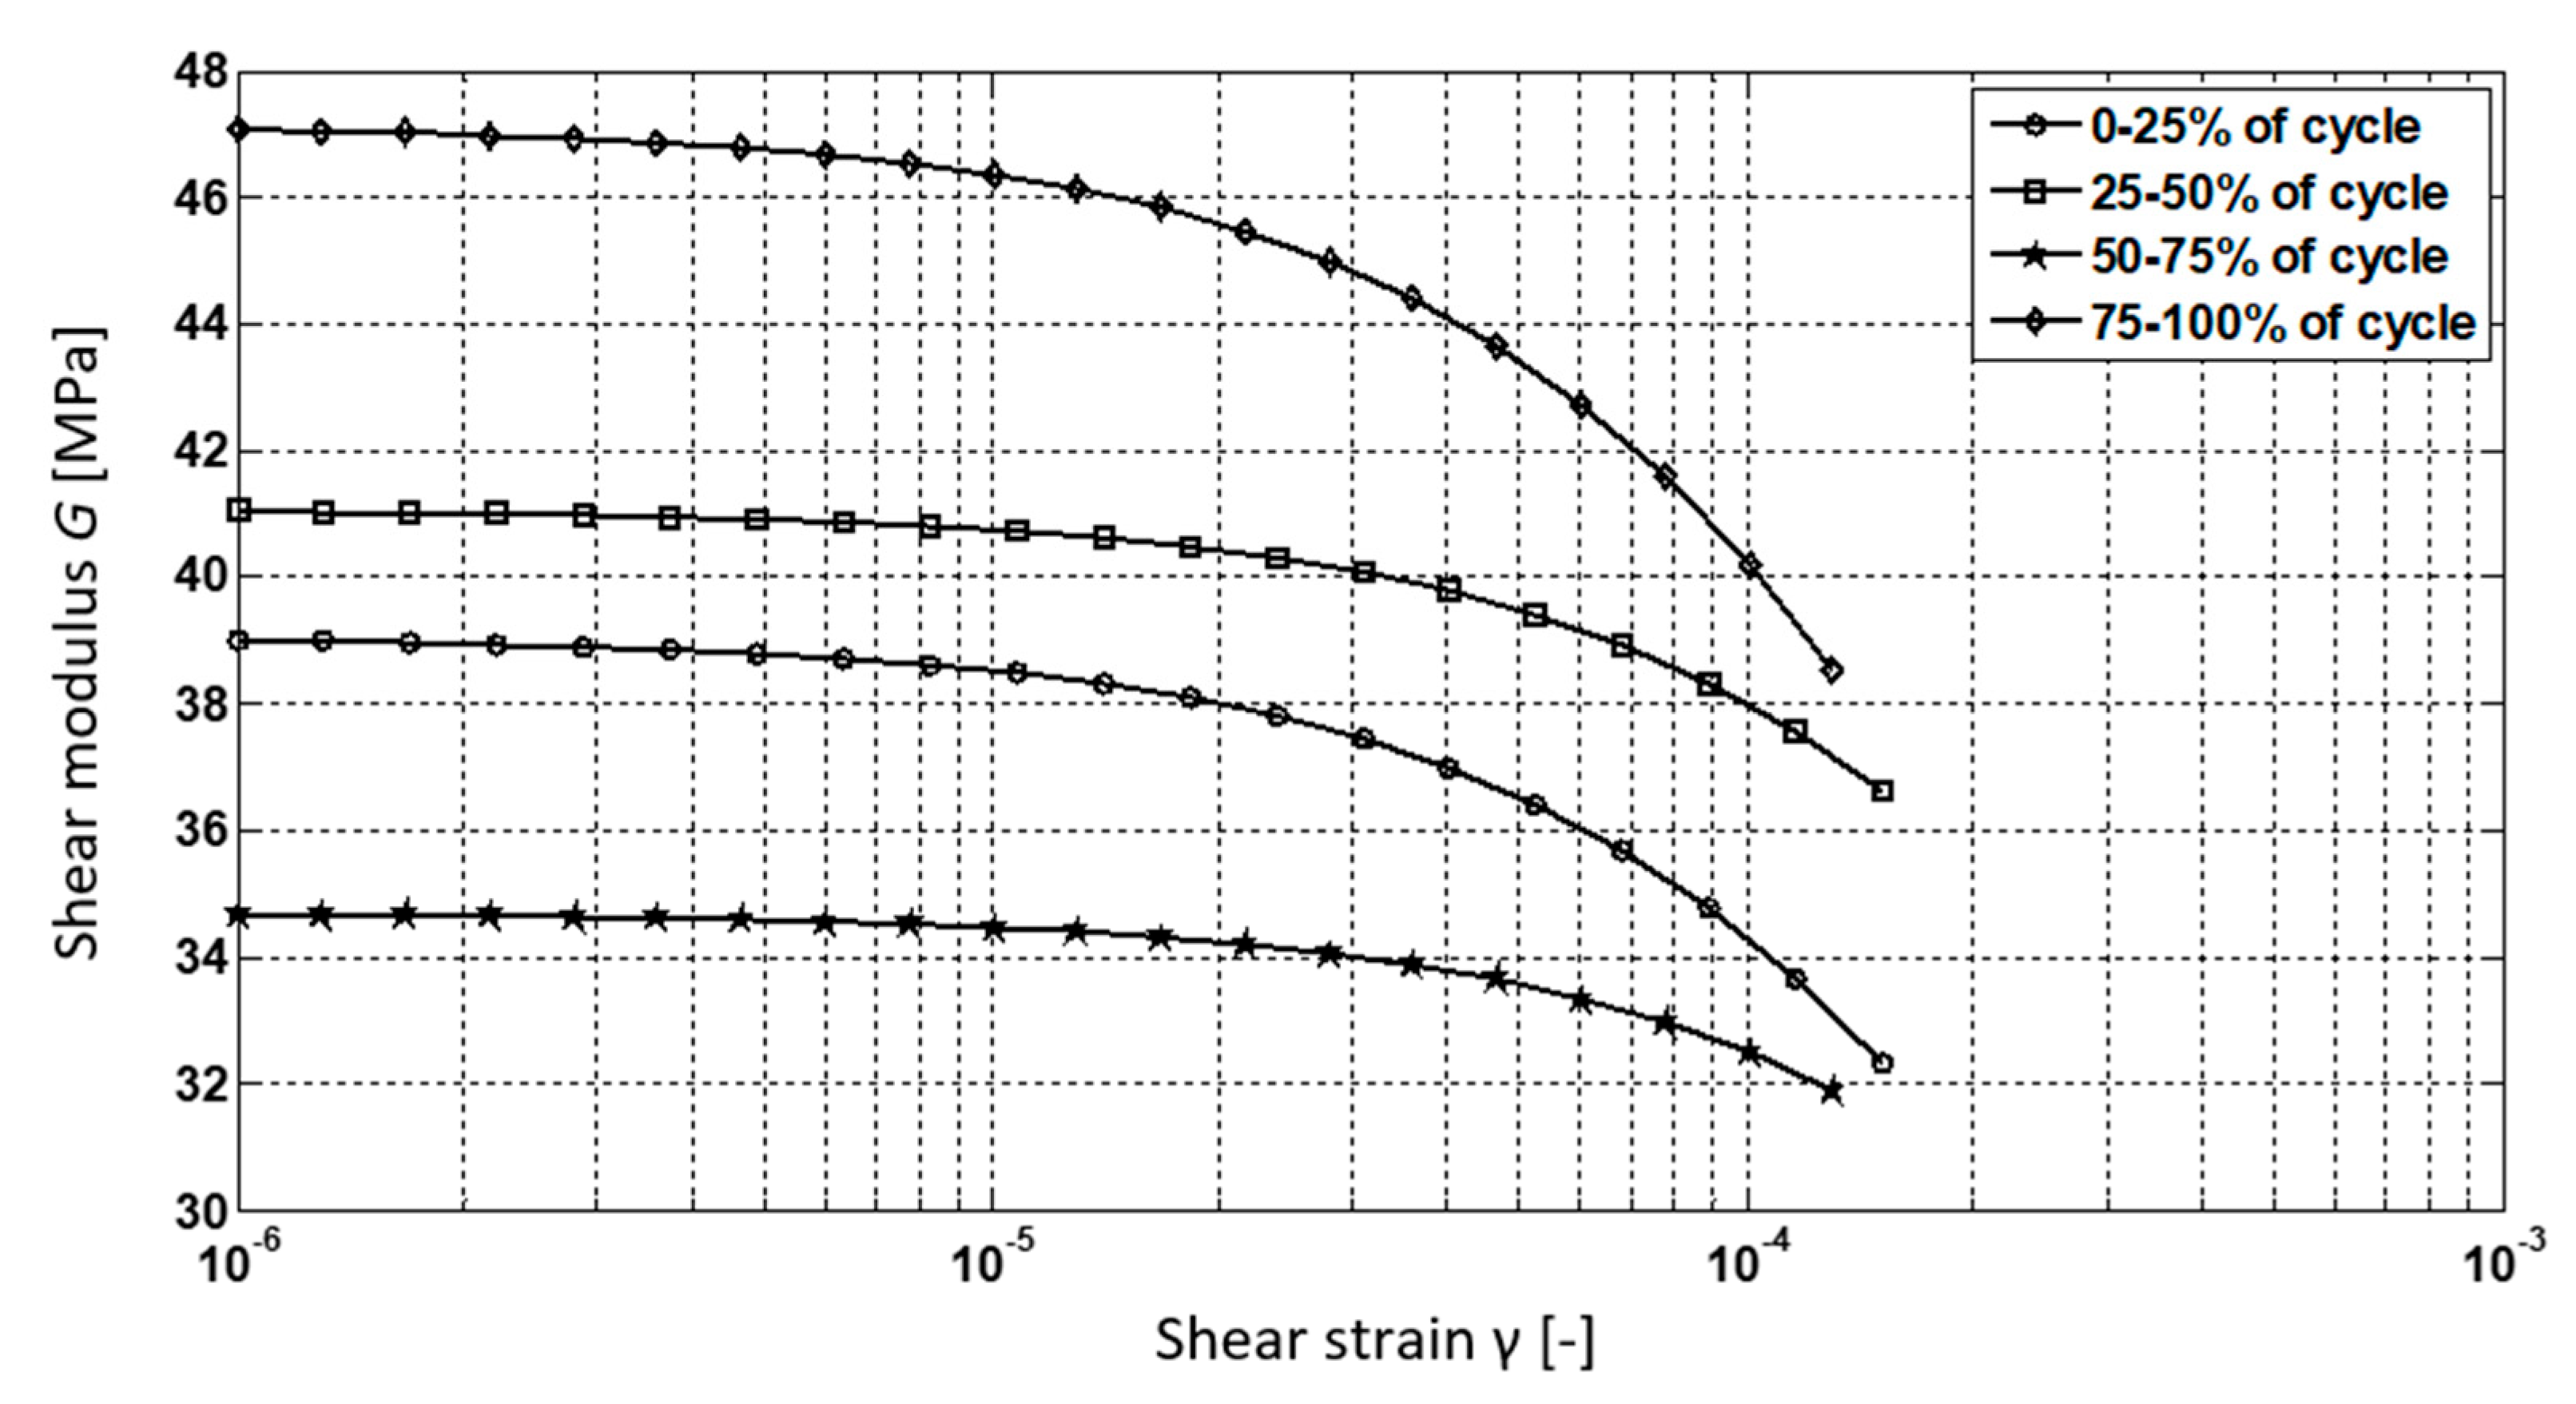
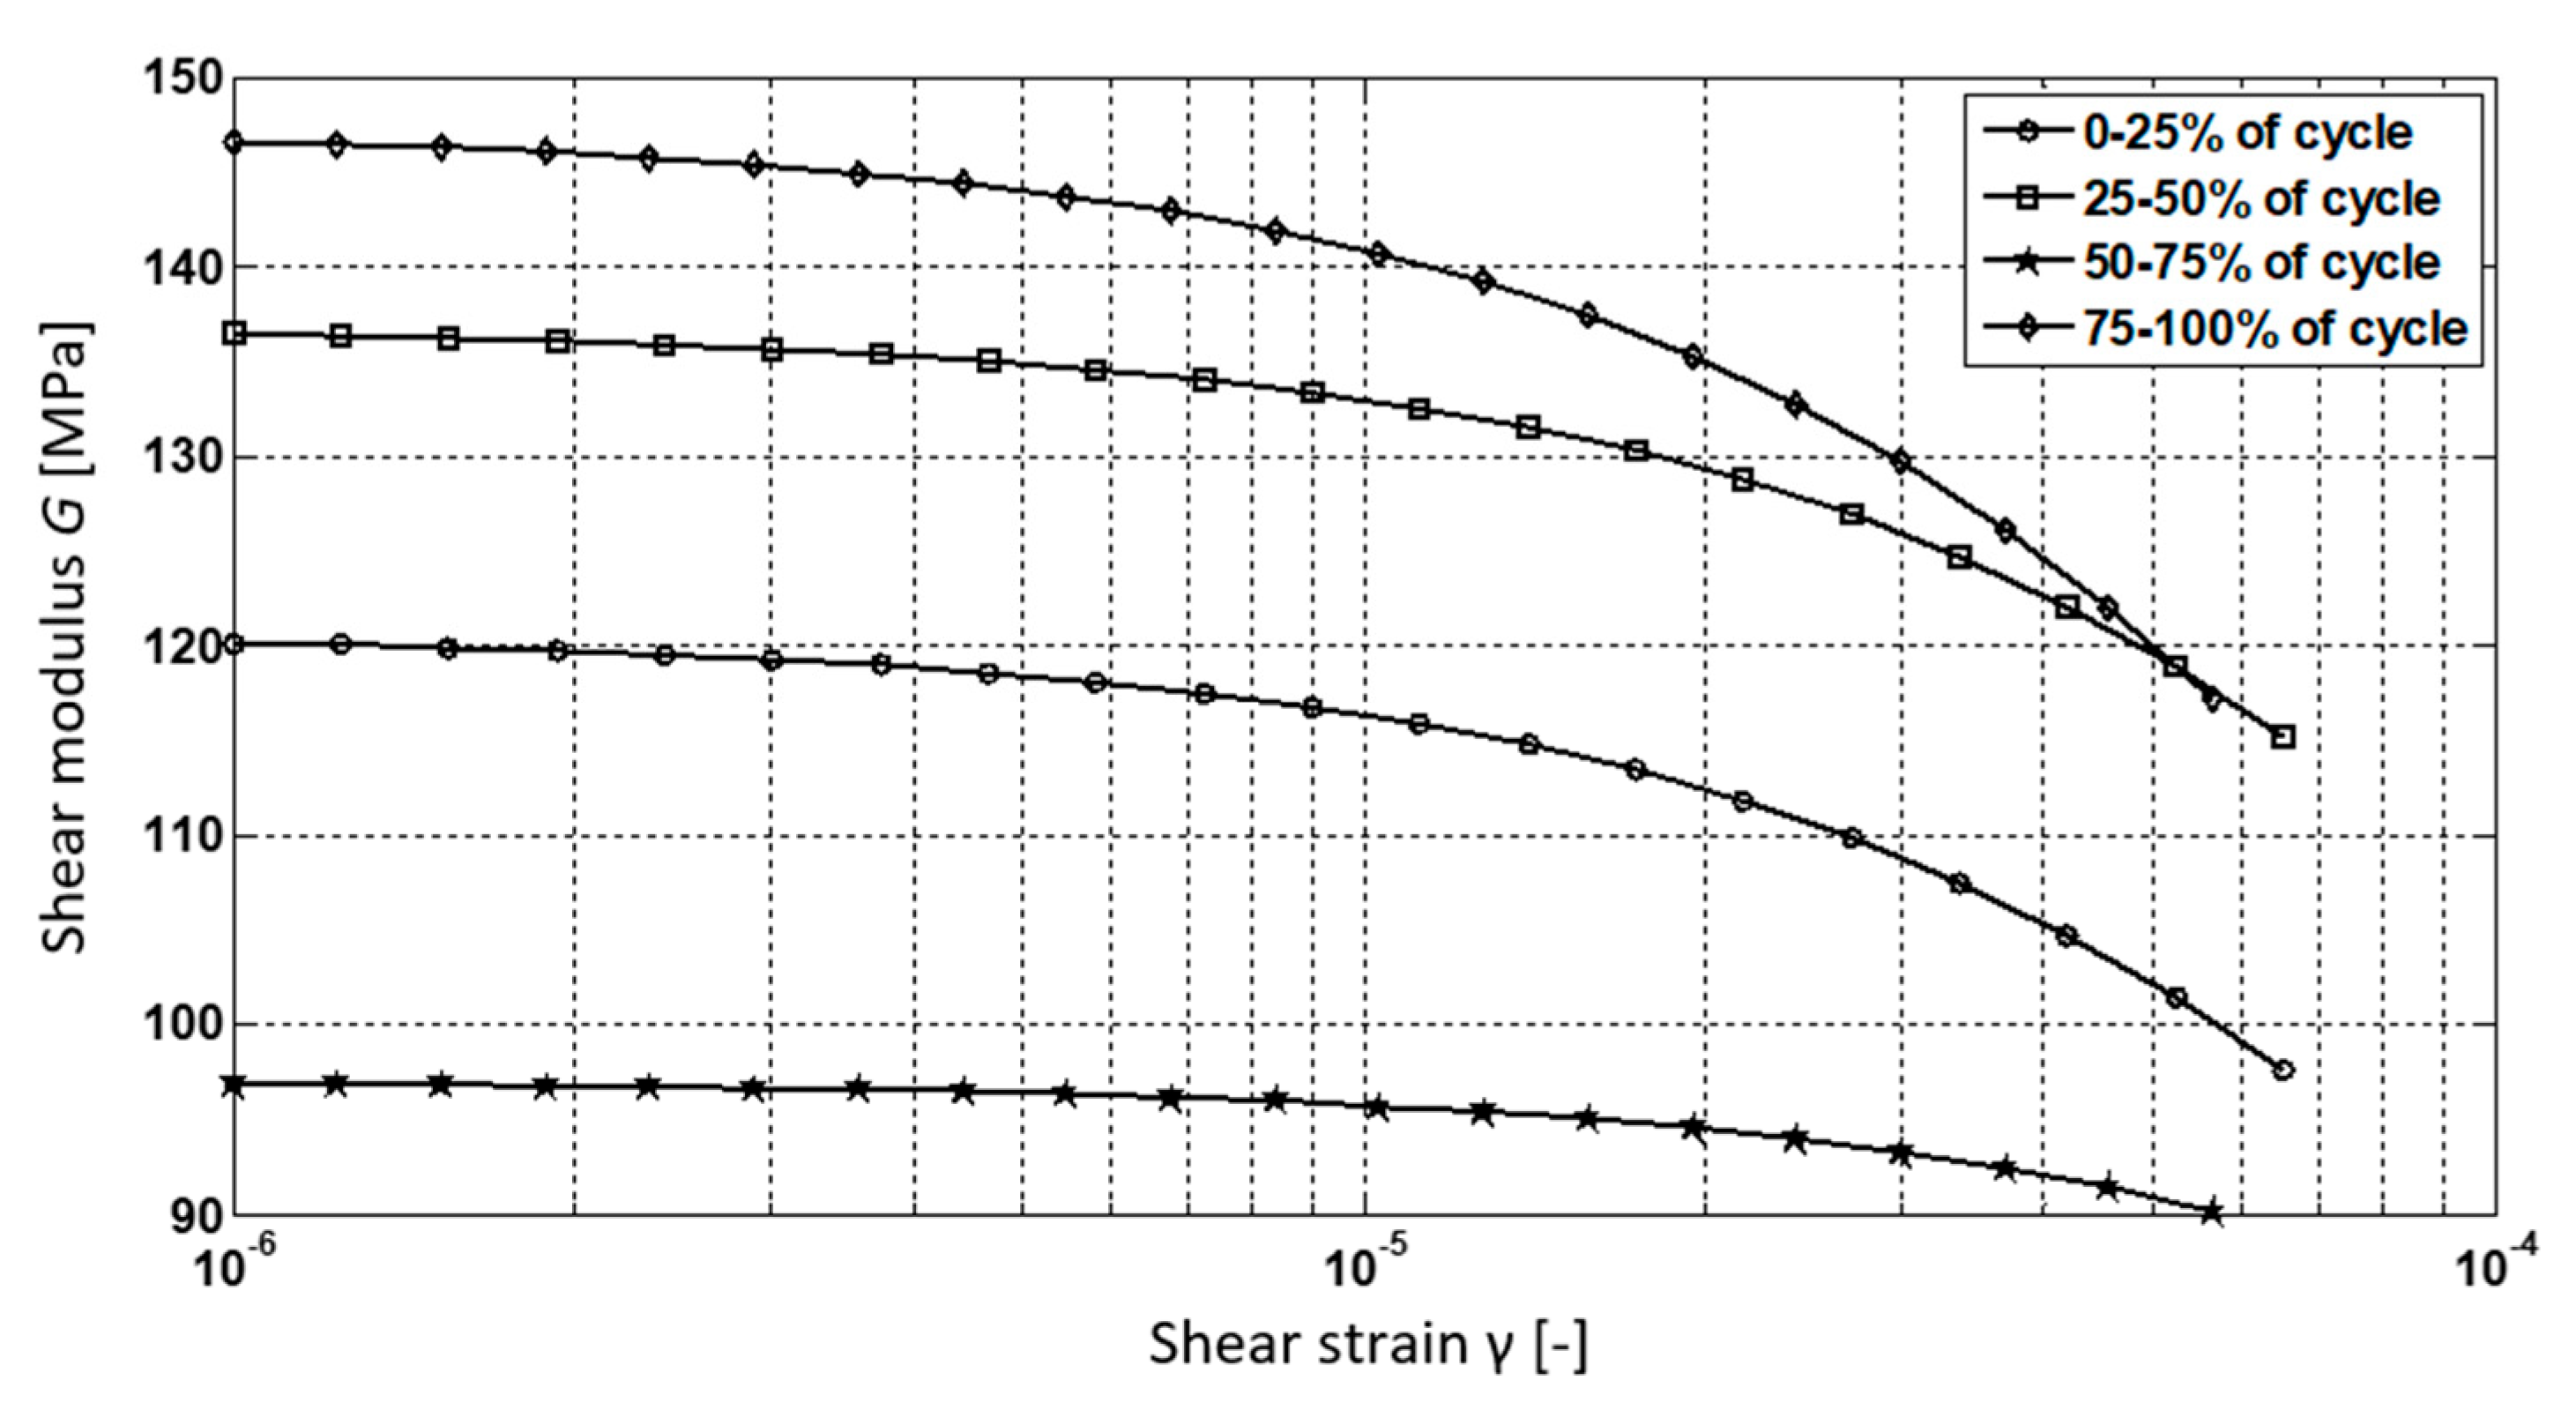
Figure 13, Figure 14, Figure 15, Figure 16, Figure 17, Figure 18, Figure 19 and Figure 20 presents the results of back analysis of the TS tests for fresh (F1, F2) and cured (C1, C2) composite specimens.
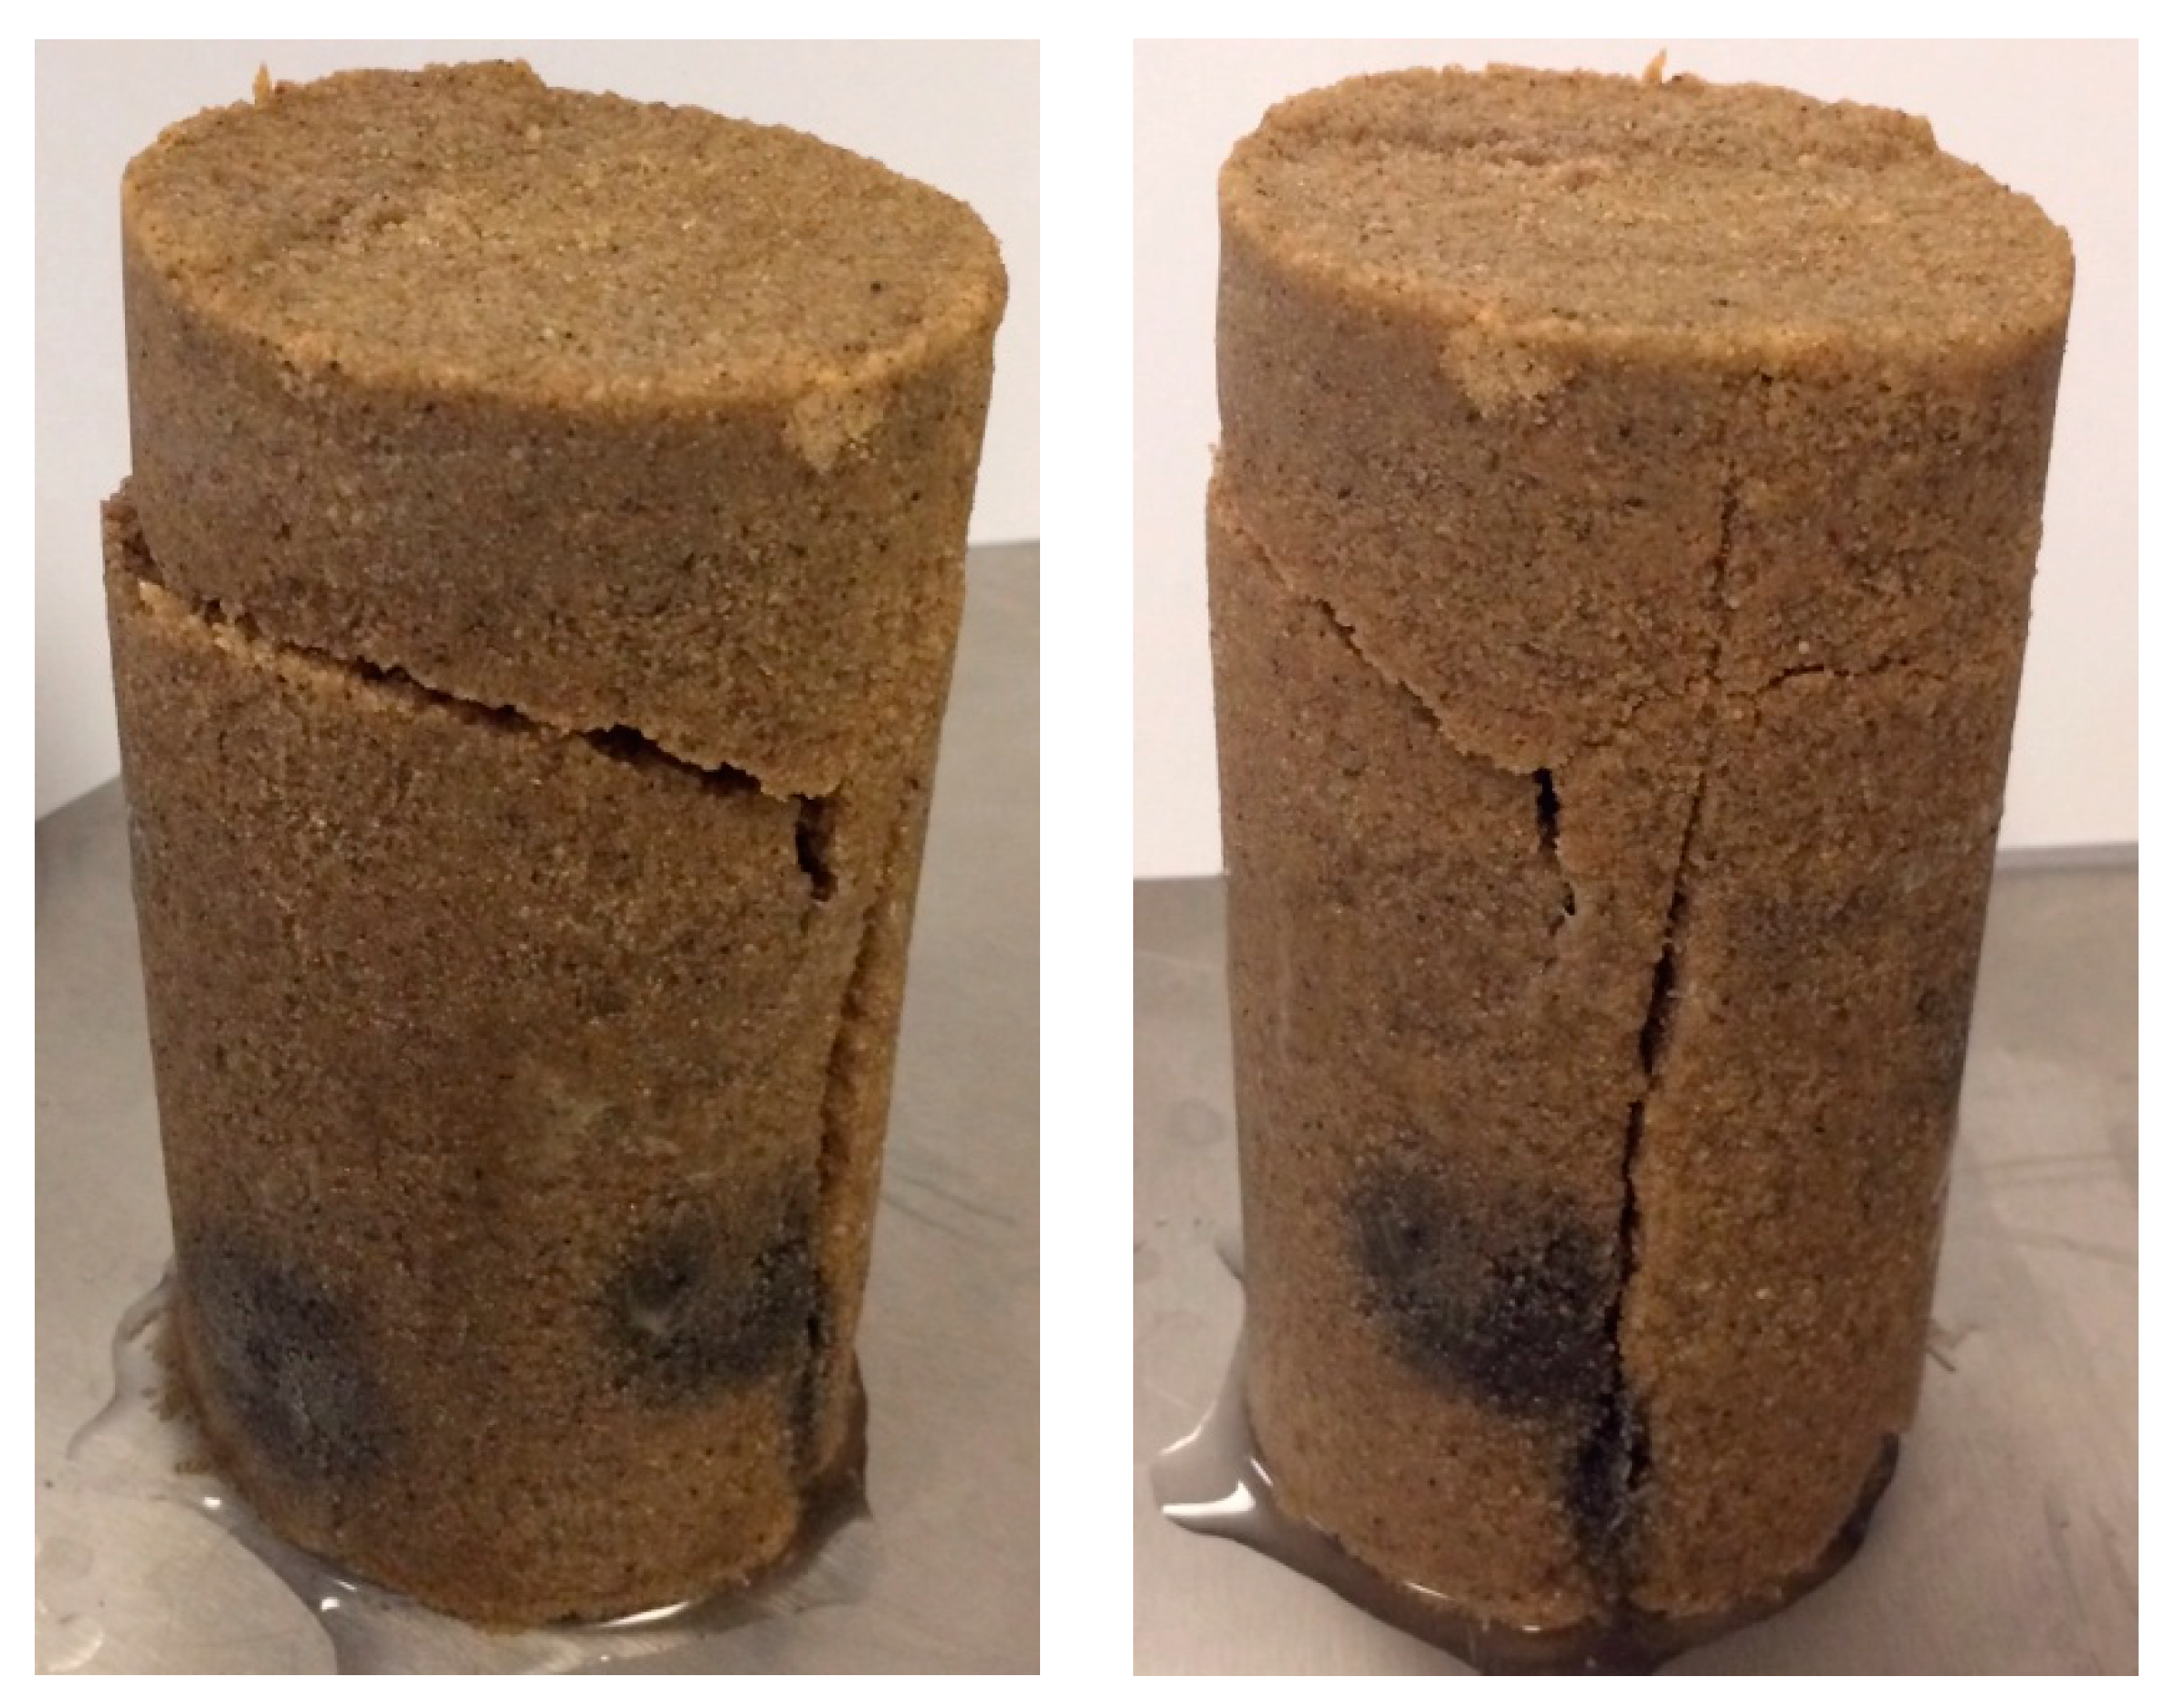
Figure 23 presents a cured composite specimen after 14 days of degradation in water (20 °C). The observation confirmed that gradual degradation of bonds between soil particles and the biopolymer.

4. Discussion

Comparing results presented in Figure 9 and Figure 10, increments of dynamic shear modulus Gmax are noticeable. Maximum shear modulus values of fresh composite specimens F1 and F2 are 1.2 to 1.4 times higher than corresponding values for untreated, pure silica sand specimen P. Specimens curing resulted in increasing shear modulus values from 1.1 to 1.6 higher than corresponding values for fresh F1, F2 specimens.
Influence of the chitosan binder and curing process on the stiffness of composites is significant. For cured composite specimens C1 and C2 maximum shear modulus values are 1.3 to 2.1 times higher than values for untreated, pure silica sand specimen P.
It should be stressed that adding chitosan solution to soil enhances soil dynamic properties even before specimen curing. The beneficial effect of chitosan solution before curing was only observed in dynamic (RC) tests. It is an important observation, considering the fact that optimal curing conditions are easier to provide and control in laboratory, but might not be possible to provide on a construction site. Another important issue is obtaining a homogenous soil–chitosan mixture. While it is not a problem in the laboratory conditions, it can be quite difficult at the construction site. Additional research (including in situ tests of stabilized soil) should be conducted to propose and test appropriate mixing technology.
In TS tests there was no significant difference between pure soil specimen and fresh composites’ behavior.
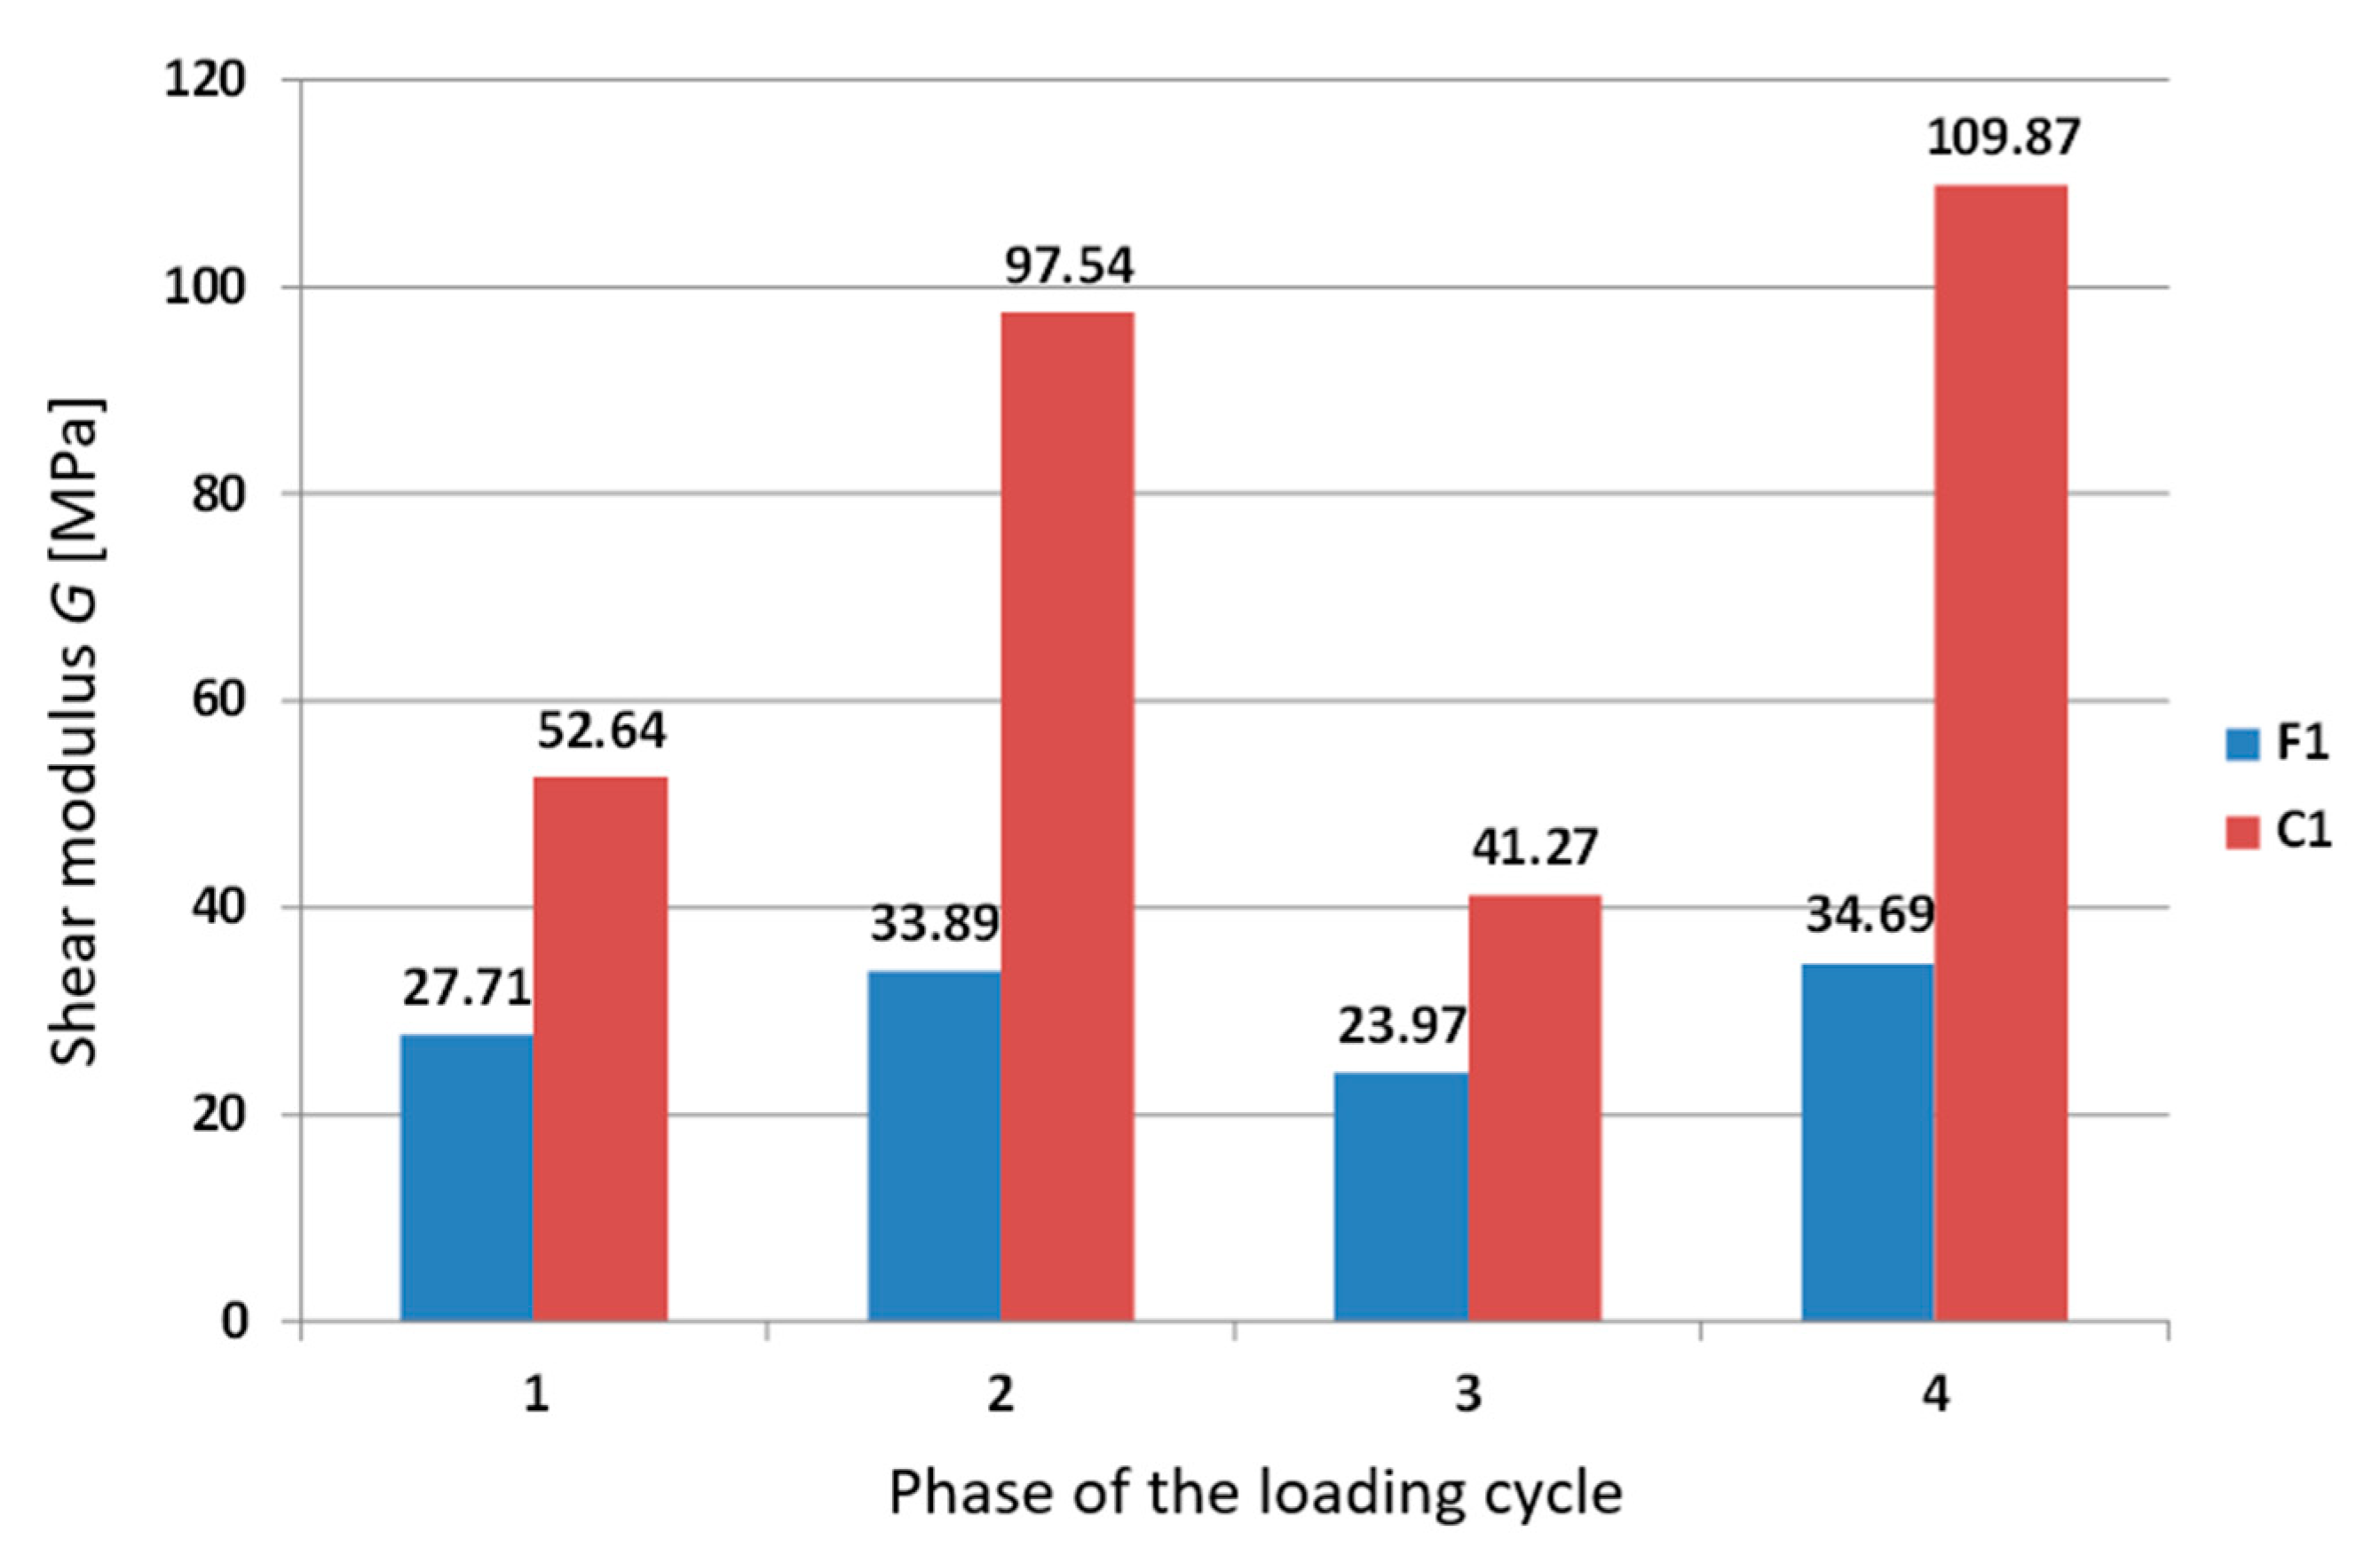
In the TS tests (as can be seen in Figure 13, Figure 14, Figure 15, Figure 16, Figure 17, Figure 18, Figure 19 and Figure 20) the effect of chitosan on composite stiffness is substantial. Initial shear modulus G0 of cured specimens (C1 and C2) is 1.9 to 3.1 times higher compared to the fresh specimen (F1 and F2 respectively).
Considering G values at the beginning of each of the four phases in full loading cycle (see Table 6), the cured specimens’ stiffness is from 1.7 up to 3.3 times higher than for fresh mixtures (see Figure 21 and Figure 22).
Cured soil–chitosan composites exhibit better dynamic properties in response to high frequency and high amplitude loadings than non-enhanced soil. Is suggests chitosan can be considered as a soil stabilizer for temporary structures that are often in danger of stability loss due to, e.g., operation of construction machines.
Stiffness (measured by the shear modulus G) of the composite specimen is several times greater than stiffness of the non-enhanced soil specimen.
The composites exhibit slow degradation in a humid environment, especially when totally submerged in water. Some observable effects of water degradation were documented (Figure 23), but a precise determination of the rate of bond degradation is outside the scope of this study. As it is important to ensure geotechnical structures stability over time, further research is needed to assess the change in chitosan stabilization effect for large scale use of chitosan as a soil stabilizer.
Considering the fact that both soil and chitosan are natural materials, the properties of the composite can be affected by many factors and can vary noticeably from specimen to specimen. Large number of tests should be performed to confirm the repeatability of the enhanced mechanical parameters. It should also be noted that the experiments were carried out in the controlled laboratory environment. The use of chitosan in geotechnical structures is a promising solution but it cannot be fully recommended without further studies on how soil–chitosan behavior is influenced by various environmental factors (e.g., seawater exposition). Future research should also focus on understanding the underlying binding mechanisms of chitosan stabilizer so that optimal conditions for binding can be clearly identified and recreated in engineering practice.

5. Conclusions

The following main conclusions can be drawn from this study.
  • Medium-grained low-cohesive soils can be effectively stabilized with chitosan solutions.
  • Adding chitosan to the tested soil specimens improves their shear modulus G substantially (even up to 3 times).
  • Soil–chitosan mixtures show better dynamic properties (dynamic shear modulus) even before the curing process. Therefore, the soil dynamic characteristics are noticeably enhanced even when the optimal curing conditions cannot be met.
  • Even relatively low chitosan concentration solutions (1.5 g of chitosan per 1 kg of dry silica sand) can be a very effective stabilizer.
  • Chitosan can be used as an eco-friendly short-term soil stabilizer. The specimens show signs of degradation after 14 days of being submerged in water.
The findings presented in this study suggest that chitosan solutions can be successfully used as a soil stabilizer. It positively affects soil dynamic properties. This, along with the biodegradability of chitosan makes it a possible solution for stabilizing temporary soil structures (e.g., working platforms) or for regular slope surface stabilization. Chitosan stabilization is a low-cost (as chitosan is a waste material) and easy-to-use (does not require specialized equipment to apply) method for temporary ground improvement. Considering high eco-compatibility of the material, its application is compliant with the main goals of sustainable engineering.
The authors plan to continue their research on chitosan–soil composites. Specifically, more dynamic tests will be conducted and focused on determining other dynamic properties (e.g., the damping ratio) and more in-depth analysis of the underlying binding mechanisms of chitosan solutions will be performed.

Author Contributions

Conceptualization, I.D. and P.S.; methodology, M.B. (Marcin Bujko) and I.D.; software, P.S.; validation, I.D. and P.S.; formal analysis, I.D. and R.O.; investigation, I.D., M.B. (Marcin Bujko) and M.B. (Marta Bocheńska); resources, I.D., P.S. and R.O.; writing—original draft preparation, M.B. (Marta Bocheńska) and M.B. (Marcin Bujko); writing—review and editing, M.B. (Marta Bocheńska) and P.S.; visualization, M.B. (Marta Bocheńska); supervision, I.D. All authors have read and agreed to the published version of the manuscript.

Funding

This research received no external funding.

Institutional Review Board Statement

Not applicable.

Informed Consent Statement

Not applicable.

Data Availability Statement

The data that support the findings of this study are available from the corresponding author, upon reasonable request.

Conflicts of Interest

The authors declare no conflict of interest.

References

  1. Das, B.M. Principles of Geotechnical Engineering; PWS Engineering: Boston, MA, USA, 1985. [Google Scholar]
  2. Katra, I. Soil Erosion: Dust Control and Sand Stabilization. Appl. Sci. 2020, 10, 8044. [Google Scholar] [CrossRef]
  3. Santoni, R.L.; Tingle, J.S.; Nieves, M. Accelerated Strength Improvement of Silty Sand with Nontraditional Additives. Transp. Res. Rec. J. Transp. Res. Board 2005, 1936, 34–42. [Google Scholar] [CrossRef]
  4. Tingle, J.S.; Santoni, R.L. Stabilization of Clay Soils with Nontraditional Additives. Transp. Res. Rec. J. Transp. Res. Board 2003, 1819, 72–84. [Google Scholar] [CrossRef]
  5. Newman, J.K.; Tingle, J.S.; Gill, C.; McCaffrey, T. Stabilization of Sand Using Polymer Emulsions. Int. J. Pavements 2005, 4, 1–12. [Google Scholar]
  6. Tingle, J.S.; Newman, J.; Larson, S.; Weiss, C.; Rushing, J. Stabilization mechanisms of nontraditional additives. Transp. Res. Rec. 2007, 1, 59–67. [Google Scholar] [CrossRef]
  7. Santoni, R.L.; Tingle, J.S.; Webster, S.L. Stabilization of Silty Sand with Nontraditional Additives. Transp. Res. Rec. J. Transp. Res. Board 2002, 1787, 61–70. [Google Scholar] [CrossRef] [Green Version]
  8. Huang, J.; Kogbara, R.B.; Hariharan, N.; Masad, E.A.; Little, D.N. A state-of-the-art review of polymers used in soil stabilization. Constr. Build. Mater. 2021, 305, 124685. [Google Scholar] [CrossRef]
  9. Consoli, N.C.; Caicedo, A.M.L.; Beck Saldanha, R.; Filho, H.C.S.; Acosta, C.J.M. Eggshell Produced Limes: Innovative Materials for Soil Stabilization. J. Mater. Civ. Eng. 2020, 32, 06020018. [Google Scholar] [CrossRef]
  10. Bensaifi, E.; Bouteldja, F.; Nouaouria, M.S.; Breul, P. Influence of crushed granulated blast furnace slag and calcined eggshell waste on mechanical properties of a compacted marl. Transp. Geotech. 2019, 20, 100244. [Google Scholar] [CrossRef]
  11. Choi, S.-G.; Chang, I.; Lee, M.; Lee, Y.-H.; Han, J.-T.; Kwon, T.-H. Review on geotechnical engineering properties of sands treated by microbially induced calcium carbonate precipitation (MICO) and biopolymers. Constr. Build. Mater. 2020, 246, 118415. [Google Scholar] [CrossRef]
  12. Soldo, A.; Miletić, M.; Auad, M.L. Biopolymers as a sustainable solution for the enhancement of soil mechanical properties. Sci. Rep. 2020, 10, 267. [Google Scholar] [CrossRef] [PubMed] [Green Version]
  13. Benzerara, M.; Guihéneuf, S.; Belouettar, R.; Perrot, A. Combined and synergic effect of algerian natural fibres and biopolymers on the reinforcement of extruded raw earth. Constr. Build. Mater. 2021, 289, 123211. [Google Scholar] [CrossRef]
  14. Losini, A.E.; Grillet, A.G.; Bellotto, M.; Woloszyn, M.; Dotelli, G. Natural additives and biopolymers for raw earth construction stabilization—A review. Constr. Build. Mater. 2021, 304, 124507. [Google Scholar] [CrossRef]
  15. Mendonça, A.; Morais, P.V.; Pires, A.C.; Chung, A.P.; Oliveira, P.V. A Review on the Importance of Microbial Biopolymers Such as Xanthan Gum to Improve Soil Properties. Appl. Sci. 2021, 11, 170. [Google Scholar] [CrossRef]
  16. Fatehi, H.; Ong, D.E.L.; Yu, J.; Chang, I. Biopolymers as Green Binders for Soil Improvement in Geotechnical Applications: A Review. Geosciences 2021, 11, 291. [Google Scholar] [CrossRef]
  17. Shariatmadari, N.; Reza, M.; Tasuji, A.; Ghadir, P.; Javadi, A. Experimental Study on the Effect of Chitosan Biopolymer on Sandy Soil Stabilization. In Proceedings of the 4th European Conference on Unsaturated Soils, E3S Web of Conferences, Les Ulis, France, 19–21 October 2020; Volume 195, p. 06007. [Google Scholar] [CrossRef]
  18. Chang, I.; Lee, M.; Tran, A.T.P.; Lee, S.; Kwon, Y.-M.; Im, J.; Cho, G.-C. Review on biopolymer-based soil treatment (BPST) technology in geotechnical engineering practices. Transp. Geotech. 2020, 24, 100385. [Google Scholar] [CrossRef]
  19. Chang, I.; Im, J.; Cho, G.-C. Introduction of microbial biopolymers in soil treatment for future environmentally-friendly and sustainable geotechnical engineering. Sustainability 2016, 8, 251. [Google Scholar] [CrossRef] [Green Version]
  20. Wiszniewski, M.; Skutnik, Z.; Biliniak, M.; Çabalar, A.F. Some geomechanical properties of a biopolymer treated medium sand. Ann. Wars. Univ. Life Sci. SGGW Land Reclam. 2017, 49, 201–212. [Google Scholar] [CrossRef]
  21. Hataf, N.; Ghadir, P.; Ranjbar, N. Investigation of soil stabilization using chitosan biopolymer. J. Clean. Prod. 2018, 170, 1493–1500. [Google Scholar] [CrossRef]
  22. Jang, J. A Review of the Application of Biopolymers on Geotechnical Engineering and the Strengthening Mechanisms between Typical Biopolymers and Soils. Adv. Mater. Sci. Eng. 2020, 2020, 1465709. [Google Scholar] [CrossRef] [Green Version]
  23. Ni, J.; Li, S.-S.; Ma, L.; Geng, X.-Y. Performance of soils enhanced with eco-friendly biopolymers in unconfined compression strength tests and fatigue loading tests. Constr. Build. Mater. 2020, 263, 120039. [Google Scholar] [CrossRef]
  24. Ni, J.; Hao, G.-L.; Chen, J.Q.; Ma, L.; Geng, X.-Y. The Optimisation Analysis of Sand-Clay Mixtures Stabilised with Xanthan Gum Biopolymers. Sustainability 2021, 13, 3732. [Google Scholar] [CrossRef]
  25. Santos, V.; Marques, N.; Maia, P.; Lima, M.; Franco, L.; Campos-Takaki, G. Seafood Waste as Attractive Source of Chitin and Chitosan Production and Their Applications Int. J. Mol. Sci. 2020, 21, 4290. [Google Scholar] [CrossRef]
  26. Zenga, D.; Wua, J.; Kennedy, J. Application of a chitosan flocculant to water treatment. Carbohydr. Polym. 2008, 71, 135–139. [Google Scholar] [CrossRef]
  27. Şenel, S.; İkinci, G.; Kaş, S.; Yousefi-Rad, A.; Sargon, M.; Hıncal, A. Chitosan films and hydrogels of chlorhexidine gluconate for oral mucosal delivery. Int. J. Pharm. 2000, 193, 197–203. [Google Scholar] [CrossRef]
  28. Paulraj, M.G.; Ignacimuthu, S.; Gandhi, M.J.; Shajahan, A.; Ganesan, P.; Packiama, S.M.; Al-Dhabib, N.A. Comparative studies of tripolyphosphate and glutaraldehyde cross-linked chitosan-botanical pesticide nanoparticles and their agricultural applications. Int. J. Biol. Macromol. 2017, 104, 1813–1819. [Google Scholar] [CrossRef] [PubMed]
  29. Benucci, I.; Liburdi, K.; Cacciotti, I.; Lombardelli, C.; Zappino, M.; Nannic, F.; Estia, M. Chitosan/clay nanocomposite films as supports for enzyme immobilization: An innovative green approach for winemaking applications. Food Hydrocoll. 2018, 74, 124–131. [Google Scholar] [CrossRef]
  30. Ramkumar, R.; Minakshi, M. Fabrication of Ultrathin CoMoO4 Nanosheet Modified with Chitosan and their Improved Performance in Energy Storage Device. Dalton Trans. 2015, 44, 6158–6168. [Google Scholar] [CrossRef]
  31. Ramkumar, R.; Minakshi, M. A biopolymer gel-decorated cobalt molybdate nanowafer: Effective graft polymer cross-linked with an organic acid for better energy storage. New J. Chem. 2016, 40, 2863–2877. [Google Scholar] [CrossRef]
  32. Li, Q.; Dunn, E.T.; Grandmaison, E.W.; Goosen, M.F.A. Applications and Properties of Chitosan. J. Bioact. Compat. Polym. 1992, 7, 370–397. [Google Scholar] [CrossRef]
  33. Morin-Crini, N.; Lichtfouse, E.; Torri, G.; Crini, G. Fundamentals and Applications of Chitosan. In Sustainable Agriculture Reviews: Chitin and Chitosan: History, Fundamentals and Innovations; Crini, G., Lichtfouse, E., Eds.; Springer: Cham, Switzerland, 2019; Volume 35, pp. 49–124. [Google Scholar]
  34. Jiménez-Gómez, C.P.; Cecilia, J.A. Chitosan: A Natural Biopolymer with a Wide and Varied Range of Applications. Molecules 2020, 25, 3981. [Google Scholar] [CrossRef] [PubMed]
  35. Azmana, M.; Mahmood, S.; Hilles, A.R.; Rahman, A.; Bin Arifin, M.A.; Ahmed, S. A review on chitosan and chitosan-based bionanocomposites: Promising material for combatting global issues and its applications. Int. J. Biol. Macromol. 2021, 185, 832–848. [Google Scholar] [CrossRef] [PubMed]
  36. Wan, M.-W.; Petrisor, I.G.; Lai, H.-T.; Kim, D.; Yen, T.F. Copper adsorption through chitosan immobilized on sand to demonstrate the feasibility for in situ soil decontamination. Carbohydr. Polym. 2004, 55, 249–254. [Google Scholar] [CrossRef]
  37. Ham, S.; Kwon, T.; Chang, I.; Chung, M. Ultrasonic P-wave reflection monitoring of soil erosion for erosion function apparatus. Geotech. Test. J. 2016, 39, 301–314. [Google Scholar] [CrossRef] [Green Version]
  38. Aguilar, R.; Nakamatsu, J.; Ramírez, E.; Elgegren, M.; Ayarza, J.; Kim, S.; Pando, M.A.; Ortega-San-Martin, L. The potential use of chitosan as a biopolymer additive for enhanced mechanical properties and water resistance of earthen construction. Constr. Build. Mater. 2016, 114, 625–637. [Google Scholar] [CrossRef]
  39. Karimi, S. A Study of Geotechnical Applications of Biopolymer Treated Soils with an Emphasis on Silt. Ph. D. Thesis, University of Southern California, Los Angeles, CA, USA, 1998. [Google Scholar]
  40. Ham, S.-M.; Chang, I.; Noh, D.-H.; Kwon, T.-H.; Muhunthan, B. Improvement of surface erosion resistance of sand by microbial biopolymer formation. J. Geotech. Geoenvironmental Eng. 2018, 144, 06018004. [Google Scholar] [CrossRef] [Green Version]
  41. Chang, I.; Cho, G.C. Geotechnical behavior of a beta-1,3/1,6-glucan biopolymer-treated residual soil. Geomech. Eng. 2014, 7, 633–647. [Google Scholar] [CrossRef] [Green Version]
  42. Wichtmann, T. Soil Behaviour under Cyclic Loading—Experimental Observations, Constitutive Description and Applications. Ph.D. Thesis, Karlsruhe Institute of Technology, Karlsruhe, Germany, 2016. [Google Scholar]
  43. Dyka, I.; Srokosz, P.E.; Bujko, M. Influence of grain size distribution on dynamic shear modulus of sands. Open Eng. 2017, 7, 317–329. [Google Scholar] [CrossRef]
  44. Srokosz, P.E.; Bujko, M.; Bocheńska, M.; Ossowski, R. Optical flow method for measuring deformation of soil specimen subjected to torsional shearing. Measurement 2021, 174, 109064. [Google Scholar] [CrossRef]
  45. Im, J.; Tran, A.T.P.; Chang, I.; Cho, G.-C. Dynamic properties of gel-type biopolymer-treated sands evaluated by Resonant Column (RC) tests. Geomech. Eng. 2017, 12, 815–830. [Google Scholar] [CrossRef]
  46. Bhardwaj, N.; Kundu, S.C. Electrospinning: A fascinating fiber fabrication technique. Biotechnol. Adv. 2010, 28, 325–347. [Google Scholar] [CrossRef] [PubMed]
  47. Jiang, T.; James, R.; Kumbar, S.G.; Laurencin, C.T. Chitosan as a Biomaterial: Structure, Properties, and Applications in Tissue Engineering and Drug Delivery. In Natural and Synthetic Biomedical Polymers; Elsevier: Amsterdam, The Netherlands, 2014; pp. 91–113. [Google Scholar]
  48. ASTM D1557–12e1; Standard Test Methods for Laboratory Compaction Characteristics of Soil Using Modified Effort (56,000 ft-lbf/ft3 (2700 kN-m/m3)). ASTM International: West Conshohocken, PA, USA, 2012.
  49. Srokosz, P.E.; Dyka, I.; Bujko, M.; Bocheńska, M. A Modified Resonant Column Device for In-Depth Analysis of Vibration in Cohesive and Cohesionless Soils. Energies 2021, 14, 6647. [Google Scholar] [CrossRef]
  50. ASTM D4015–21; Standard Test Methods for Modulus and Damping of Soils by Fixed-Base Resonant Column Devices. ASTM International: West Conshohocken, PA, USA, 2021.
  51. Srokosz, P.E.; Dyka, I.; Bujko, M. Determination of Shear Modulus of Soil in the RC/TS Apparatus for Designing Offshore Wind Power Plant Foundations. Pol. Marit. Res. 2018, 25, 69–83. [Google Scholar] [CrossRef] [Green Version]
  52. Nelder, J.A.; Mead, R. A simplex method for function minimization. Comput. J. 1965, 7, 308–313. [Google Scholar] [CrossRef]
  53. Lagarias, J.C.; Reeds, J.A.; Wright, M.H.; Wright, P.E. Convergence Properties of the Nelder-Mead Simplex Method in Low Dimensions. SIAM J. Optim. 1998, 9, 112–147. [Google Scholar] [CrossRef] [Green Version]
Figure 1. Grains of “silica sand 1” in magnification.
Applsci 12 05332 g001
Figure 2. Determination of maximum dry density (g/cm3) and optimum moisture content (%) for “silica sand 1”.
Applsci 12 05332 g002
Figure 3. Chemical structure of chitosan [47].
Applsci 12 05332 g003
Figure 4. Grains of chitosan in magnification.
Applsci 12 05332 g004
Figure 5. Particle size distribution of used materials.
Applsci 12 05332 g005
Figure 6. Chitosan (a) powder, (b) 4% solution in 10% acetic acid, (c) 7% solution in 10% acetic acid.
Applsci 12 05332 g006
Figure 7. Schematic drawing of RC/TS apparatus.
Applsci 12 05332 g007
Figure 8. Discretized specimen model (a) Finite Element Method mesh, (b) after rendering.
Applsci 12 05332 g008
Figure 9. Comparison of RC test results. Specimens P, F1-32551 and C1-30437.
Applsci 12 05332 g009
Figure 10. Comparison of RC test results. Specimens P, F2-30608 and C2-23608.
Applsci 12 05332 g010
Figure 11. Comparison of RC test results of silica sand specimen (P).
Applsci 12 05332 g011
Figure 12. Comparison of RC test results of specimen P—normalized shear modulus.
Applsci 12 05332 g012
Figure 13. Comparison of back analysis results. Specimen F1-32551.
Applsci 12 05332 g013
Figure 14. Comparison of back analysis results. Specimen F1-32551.
Applsci 12 05332 g014
Figure 15. Comparison of back analysis results. Specimen C1-30437.
Applsci 12 05332 g015
Figure 16. Comparison of back analysis results. Specimen C1-30437.
Applsci 12 05332 g016
Figure 17. Comparison of back analysis results. Specimen F2-30608.
Applsci 12 05332 g017
Figure 18. Comparison of back analysis results. Specimen F2-30608.
Applsci 12 05332 g018
Figure 19. Comparison of back analysis results. Specimen C2-23608.
Applsci 12 05332 g019
Figure 20. Comparison of back analysis results. Specimen C2-23608.
Applsci 12 05332 g020
Figure 21. Comparison of back analysis results. Specimens F1-32551 and C1-30437.
Applsci 12 05332 g021
Figure 22. Comparison of back analysis results. Specimens F2-30608 and C2-23608.
Applsci 12 05332 g022
Figure 23. Specimen C2-23608 after 14 days of degradation in water.
Applsci 12 05332 g023
Table 1. Biopolymer additives used in geotechnical engineering [18].
BiopolymerChemical CompositionBehavior with Soils
Agar GumC14H24O9Strengthening
Pore clogging
Erosion reduction
β-glucanC18H32O16Grouting
Strengthening
Superplasticizer in concrete
CaseinC81H125N22O39PStrengthening
Water resistance
Hydraulic conductivity reduction
ChitosanC18H35N3O13Strengthening
Coagulant effects
Removal of heavy metals in water
DextranH(C6H10O5)xOHDrilling muds
Conditioners
Erosion reduction
Gellan GumC24H37O20Strengthening
Pore clogging
Erosion reduction
Guar GumC10H14N5Na2O12P3Dust control
Strengthening
Grouting
StarchC27H48O20Adhesives for drilling fluids
Strengthening
Erosion reduction
Xanthan GumC36H58O29P2Drilling mud thickener
Strengthening
Table 2. Parameters of the tested soil (“silica sand 1”) *.
Soil Type G s   [ - ] d 50   [ mm ] d 60   [ mm ] d 10   [ mm ] C U   [ - ] e m a x   [ - ] e m i n   [ - ] ρ d m a x   [ g / cm 3 ] w
[%]
Silica sand 12.650.330.350.221.60.680.411.683.30
* d , d 60 , d 10 —the values of the particle diameter at 50%, 60% and 10% in the cumulative distribution; e m a x —maximum void ratio, e m i n —minimum void ratio, C U —uniformity coefficient, ρ d m a x —maximum dry soil density, w—moisture content, G s —specific gravity.
Table 3. Parameters of the tested chitosan *.
G s   [ - ] d 50   [ mm ] d 60   [ mm ] d 10   [ mm ] C U   [ - ] emax [-]emin [-]
1.470.110.130.0442.853.291.73
* d 50 , d 60 , d 10 —the values of the particle diameter at 50%, 60% and 10% in the cumulative distribution; e —void ratio, C U —uniformity coefficient, G s —specific gravity.
Table 4. Composition of specimens’ mixtures [in g per 1 kg of dry silica sand].
Dry ChitosanReversed Osmosis Water10% Acetic Acid Solution
specimen 10350
specimen 22.5035
specimen 31.51520
Table 5. Parameters of the numerical model of the specimens *.
Specimend [mm]h [mm]N [-]k [-]f [Hz]αmin [mRad]αmax [mRad]
F1-32551701401800.05−0.89821.0036
C1-30437701401800.05−0.52000.7550
F2-30608701401800.05−0.77510.9017
C2-23608701401800.05−0.33670.3887
* d—specimen diameter; h—specimen height; N—number of TS cycles; k—number of FEM steps per cycle; f—frequency; αmin, αmax—minimum and maximum twist angle; F, C—fresh and cured composite.
Table 6. Four phases in one full cycle of the TS test.
PhaseγτdτLoad Direction [-]
1positivepositivepositivepositiveload
2positivenegativepositivenegativeunload
3negativenegativenegativenegativereload
4negativepositivenegativepositivere-unload
γ—shear strain; dγ—change in shear strain; τ—shear stress; dτ—change in shear stress.
Publisher’s Note: MDPI stays neutral with regard to jurisdictional claims in published maps and institutional affiliations.