Article

Settlements and Subgrade Reactions of Surface Raft Foundations Subjected to Vertically Uniform Load

1
Department of Civil Engineering, Tamkang University, New Taipei City 25165, Taiwan
2
Department of Civil and Construction Engineering, National Taiwan University of Science and Technology, Taipei City 10607, Taiwan
3
Taiwan Building Technology Center, National Taiwan University of Science and Technology, Taipei City 10607, Taiwan
*
Author to whom correspondence should be addressed.
Appl. Sci. 2022, 12(11), 5484; https://doi.org/10.3390/app12115484
Submission received: 18 April 2022 / Revised: 19 May 2022 / Accepted: 26 May 2022 / Published: 28 May 2022

Abstract

:
The settlements and corresponding soil reactions of a surface raft foundation subjected to vertically uniform load at the sites of granular or cohesive soils have been qualitatively introduced to engineers in the past. This study intends to verify the foundation load-response mechanism using three-dimensional finite-element analyses. The Mohr–Coulomb soil model was used to simulate the nonlinear effects of the granular and cohesive soils. The coefficients of subgrade reactions of the soil were back-calculated and compared to those obtained from the rigid foundation model. For all the square surface rafts studied, non-uniform settlements with the largest value at the center can be found. For the smallest rafts located in clay, the soil reactions were found to be rather consistent. For larger rafts in clay, the soil reactions would be changed according to the soil stiffness and raft dimensions. For surface rafts in sand, the effects of soil stiffness on soil reactions appeared to be insignificant. The soil reactions were generally higher at the center and varied with raft dimensions. For the smallest raft in sand, large soil reactions can be found at the edge. The coefficients of subgrade reactions were found to be more consistent with the smallest values occurring at the center. The results of this study indicate that the load-response mechanism of the raft foundation is rather complicated. Such load-response mechanisms are strongly affected by the relative rigidity of the foundation depending on soil stiffness and foundation dimensions.

1. Introduction

The settlements of a raft foundation under vertical loads can be estimated using either analytical or numerical solutions. The analytical formula provides a relatively simple solution; however, it has a shortcoming when modeling variations of foundation settlements. For numerical solutions, one-dimensional (1D) beams on elastic foundation (i.e., the Winkler foundation) or two-dimensional (2D) plates underlain by a set of soil springs can be used to model the foundation. A three-dimensional (3D) structure–foundation–soil system can also be adopted as a more rigorous analysis. The relative stiffness (or rigidity) of the foundation is typically important in affecting the load-response mechanism of the foundation. Design engineers must know that the performance of a raft foundation can be influenced by the rigidity of that foundation. It has been generally noted that rigid foundations under vertical loads would result in more uniform settlements and variable contact pressures of the soils (i.e., soil reactions). On the contrary, flexible foundations can exert large differential settlements and more consistent contact pressures of the soils.
To estimate foundation rigidity, the relative stiffness of a raft foundation (Kr) can be evaluated using the formula suggested by the ACI committee 336 report, DIN 4018 code, and IS 2950-1 code [1,2,3]. Ignoring the superstructure, the value of Kr can be simply computed as follows,
K r = E b 12 E ( d L ) 3 ,
where Eb is the Young’s modulus of the concrete raft, E is the Young’s modulus of the soil, d is the thickness of the raft, and L is the length of the raft. A rigid or flexible raft is indicated by Kr > 0.5 or Kr < 0.5, respectively. Alternatively, the effect of changes in the Poisson’s ratios of the foundation and soil can be expressed by Equation (2) [4].
K r = E b ( 1 υ 2 ) 12 E ( 1 υ b 2 ) ( d L ) 3 ,
where υ b and υ are the Poisson’s ratio of the concrete and the soil, respectively. Per the definition used by Brown [5] in their finite element (FE) analysis, Kr < 0.05, 0.05 < Kr < 5, and Kr > 5 represent flexible, semi-rigid, and rigid foundations, respectively. The detailed expressions of Equation (2) can be found in Pantelidis and Gravanis [6]. Moreover, El Gendy [7] reported that Kr can be calculated following the Egyptian code [8]:
K r = E b E ( d L ) 3 .
According to El Gendy [7], Kr < 0.005, 0.005 < Kr < 2 and Kr > 2 can represent for flexible, semi-rigid, and rigid foundations, respectively. In calculating Kr values of the foundations, this study found that the Egyptian code is more stringent than others in satisfying the flexible foundation. When a 2D raft foundation is considered as a 1D beam and implemented with a vertically uniform load, the settlements and contact pressures (or the soil reactions) of the foundation are not only dependent of the rigidity of the foundation but also affected by the type of soil underneath the foundation. Figure 1 depicts qualitative plots of the foundation settlements and the contact pressure of the soil for a raft foundation subjected to a vertically uniform load. For granular soil such as sand, if the foundation is elastic (i.e., flexible), the settlement is larger at the edges and smaller at the center; corresponding stress of the soil reaction is relatively uniform. For rigid foundations in sand, uniform settlements can be expected and the stress of the soil reaction is larger at the center and negligible at the edges. For a flexible foundation on clayey soil with similar load, the settlements will be larger at the center and the stress of the soil reaction will tend to be uniform. Rigid foundations in clayey soil will result in uniform settlements, and the stress of the soil reaction is smaller at the center and higher at the edges. The above information has been assumed in structural design and analysis of the foundation for many years. Earlier discussions of the contact pressures under the foundation can be found in Barden [9] based on the approximate calculation method. A number of studies were carried out taking the foundation–soil system as a two-dimensional structure subjected to combined static loads and/or dynamic load. Until recent years, the effects of the three-dimensional geometry of the foundation–soil system were found to be important in affecting the actual responses of the structure system [10,11]. Therefore, it is worthwhile to investigate the principles of foundation settlements and distribution of contact pressure with 3D solutions.
At present, the foundation settlements and soil reactions of arbitrarily loaded foundations can be easily estimated using either numerical or physical models. While the physical model is usually scaled, thus resulting in stress levels incomparable to the real foundation, rigorous numerical methods such as the 3D FE analyses can provide a more convenient and effective solution to engineering problems. Kumar et al. [12] and Roy et al. [13] have demonstrated the advantages of employing analytical and numerical analyses for certain foundation problems. As the resulting coefficient of subgrade reaction (i.e., the soil spring constant, ks) plays a key role in the structural design of foundations, numerous soil spring models have been developed since 1950. Besides the beam on elastic foundation model (Winkler’s model), the so called two-parameter soil spring model proposed by Pasternak [14], which can account for the elastic shear influence on the surrounding soil, has been adopted and modified by numerous researchers [15,16,17,18]. Such models have disadvantages in modeling layered soil profiles. From the 3D FE analysis, the soil reactions and soil springs underneath the raft were found to be dependent upon foundation size and the characteristics of the soil [19]. Other research conducted on soil springs using FE analysis can be found in Liao [20] and Loukidis and Tamiolakis [21]. Based on the 3D FE analysis, Worku and Seid [22] compared the applicability of two-parameter foundation models under certain load conditions. Additionally, Chang et al. [23] proposed a two-dimensional soil spring model modified from Lysmer’s analog model using Midas-GTX analysis. Besides the alternative foundation models on soil springs, it has been suggested by Poulos [24] that the rigorous computer-based method, e.g., the 3D FE analysis, is becoming a very convenient tool for engineers in dealing with foundation design. In recent years, 3D FE analysis has been popularly adopted as a design tool in engineering practice for foundation designs of high-rise buildings [25,26,27].
With the above information, this study intends to examine the load-response mechanism of a surface raft foundation model in clay and in sand subjected to vertically uniform loads using the 3D FE analysis. It should be pointed out that a surface raft, or a raft with very shallow embedment, is used to sustain mainly vertical structural load. The lateral resistance of such foundations is generally ignored in the design purpose. For simplicity, the small-strain level shear wave velocities (Vs) of the soils were assumed within a range (Vs = 120~180 m/s) in order to simulate the type-III soils (basin soils) at local sites. For clay, the Poisson’s ratio was assumed to be 0.4. For sand, the Poisson’s ratio was assumed to be 0.3. Elastic moduli were thereafter obtained. For more realistic solutions, nonlinear soil responses were modeled based on the Mohr–Coulomb model. Undrained shear strength of the clay soils was assumed based on correlations with the shear wave velocity of the soil. Drained internal friction angles were assumed for sand using empirical relations based on shear wave velocity and SPT-N value. A surface square raft foundation model was presumed to be located at various sites in the soils. The width of the square raft was kept in a range of 16~36 m to model the dimensions of ordinary foundations. A total load with magnitude of 67.6 MN was applied to the raft with different dimensions. The numerical results of the foundation settlements, soil reactions, and the coefficients of the soil reactions are presented and discussed in following sections.

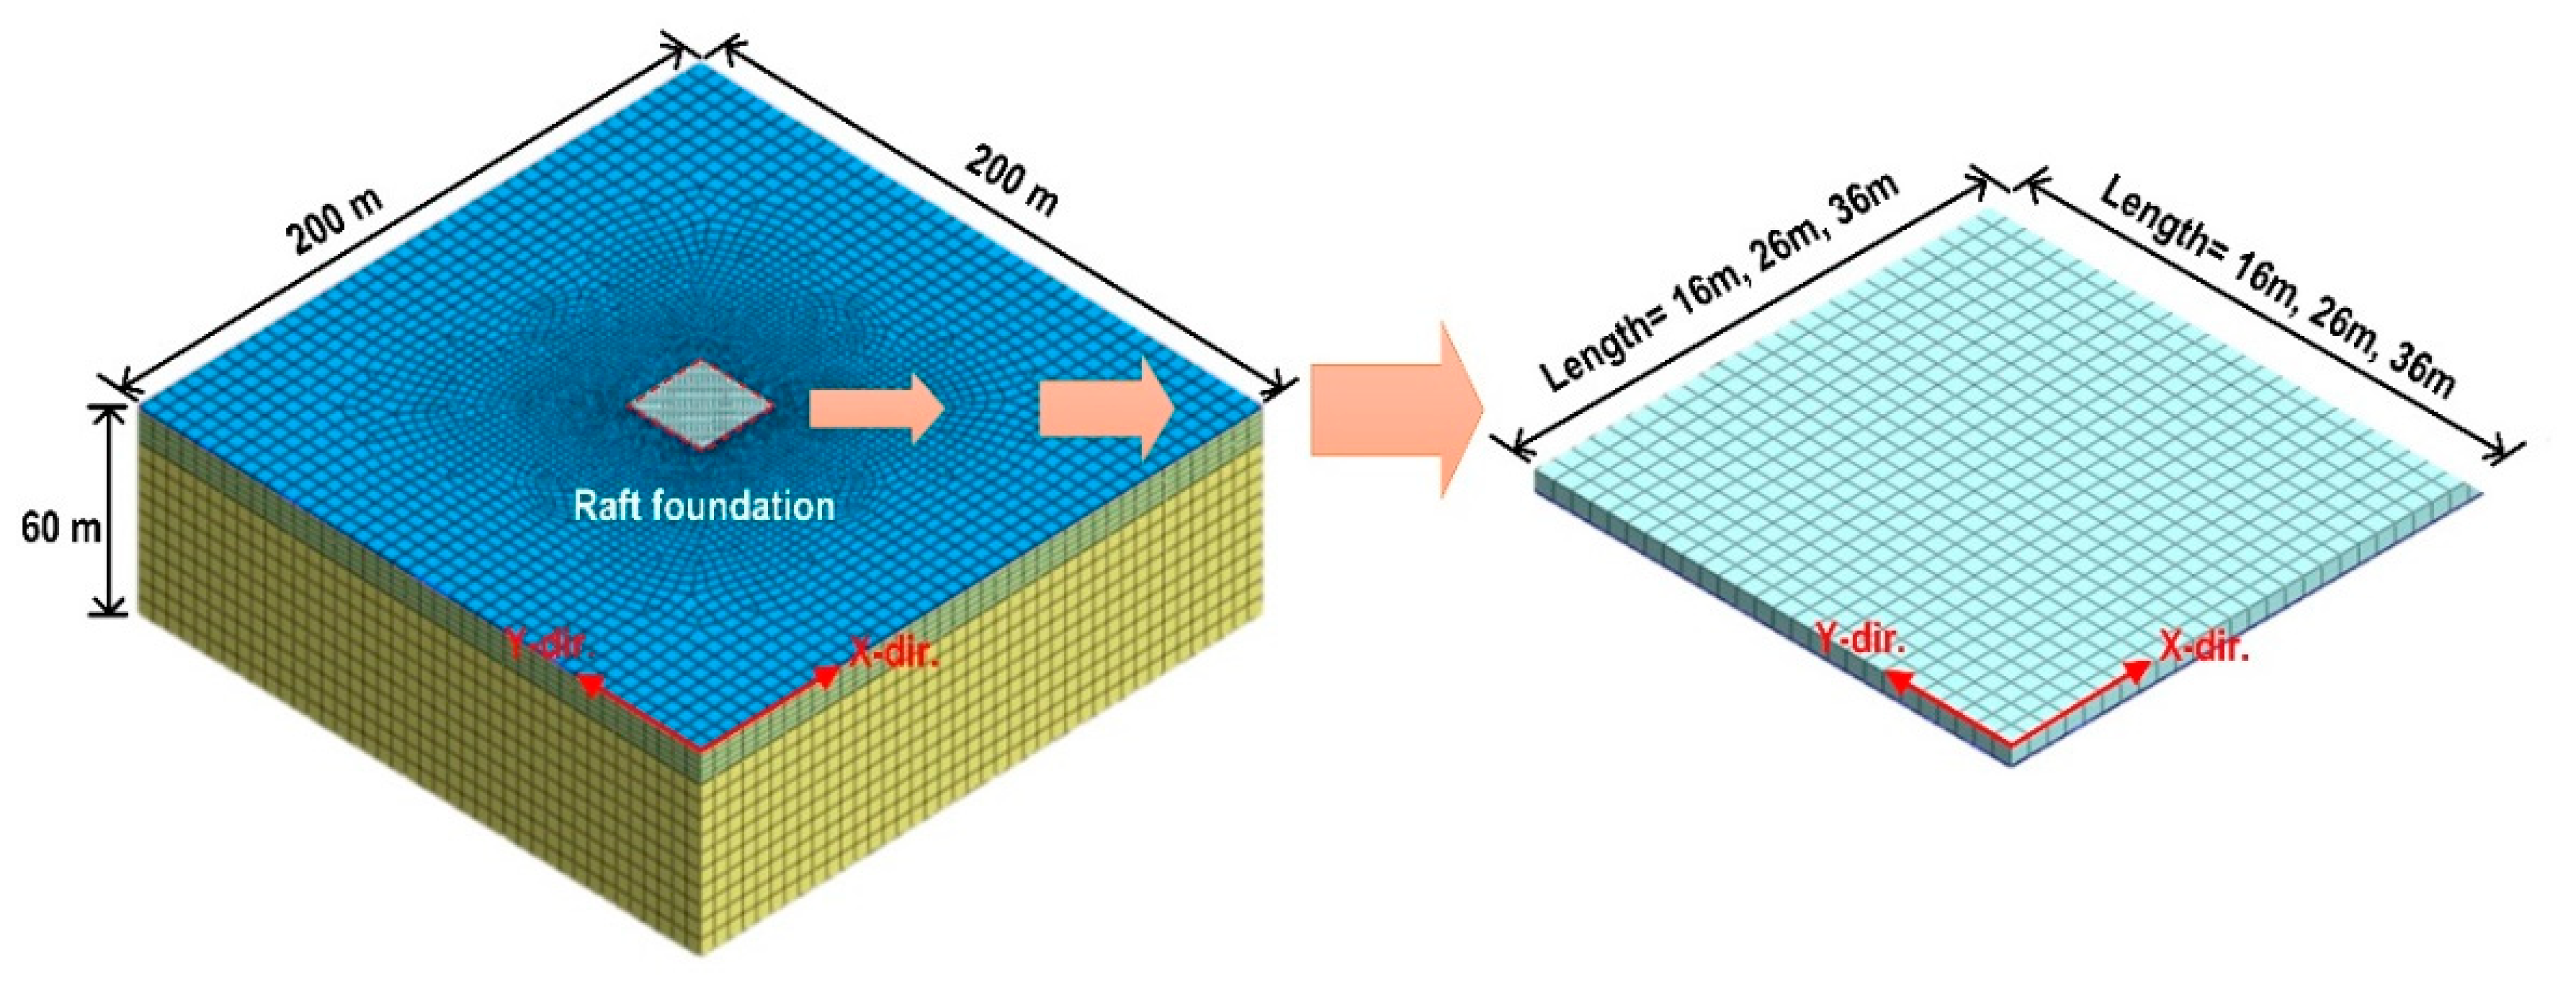
2. Numerical Modeling

This study focuses on surface raft foundations in clay and in sand with the applications of the Mohr–Coulomb soil model to investigate nonlinear foundation behaviors. Considering the local basin soils, the shear wave velocities (Vs) of the soil were assigned to be 120 m/s, 150 m/s, and 180 m/s. The unit weight of the soil (γs) was assumed at 20 kN/m3. The Poisson’s ratio was assumed to be 0.4 and 0.3 for clay and sand, respectively. The Young’s moduli (E) of the clay can be thus calculated as 82 MPa, 128 MPa, and 185 MPa, respectively. These clays are termed as Clay 1, Clay 2, and Clay 3. Corresponding values of the Young’s moduli for sandy soils were computed as 76 MPa, 119 MPa, and 171 MPa, respectively. The soils are termed as Sand 1, Sand 2, and Sand 3. For simplicity, the ground water influence was ignored in this study. Table 1 presents the material properties used in the numerical studies. To capture more realistic phenomena, nonlinear soil behavior was considered. For the clays, the empirical equation between Vs and undrained shear strength, su of the clays (where Vs = 23 su0.475) suggested by Dickenson [28] and Ashford et al. [29] was used to compute the undrained shear strengths of the clays. As a result, the undrained shear strengths of the clays (Clay 1~Clay 3) were found to be 32 kPa, 52 kPa, and 76 kPa. For the sands, the drained internal friction angles ( ϕ ) were calculated using the correlations ( ϕ vs. SPT-N value) suggested by Hatanada and Uchida [30], and the SPT-N value vs. Vs relation suggested by the local Seismic Design Code [31]. The corresponding values of internal friction angles for these sands (Sand 1~Sand 3) were obtained as 28°, 31°, and 34°. Cohesion was taken as zero for sands in drained conditions.
For square rafts with different widths (i.e., 16 m, 26 m, and 36 m) and a fixed thickness of 1 m, the Kr values of the foundation were computed using Equations (1)–(3). Table 2 presents the Kr values of the foundations evaluated using Equation (3). It is clear that nearly all the cases are semi-rigid foundations because Kr was in the range of 0.005~0.1. Kr will decrease with the increase in soil stiffness and foundation dimension. When the width of the foundation reaches 36 m and the soil becomes stiffer, Kr was found to be less than 0.005. If Equation (1) was applied, nearly all the foundations could be defined as flexible foundations. Thus, the results can be used to interpret the behaviors of semi-rigid or flexible foundations; the possible influence of foundation thickness was ruled out in this study.
3D Midas-GTS NX analysis [32] was adopted in the study. Such analysis has been used in many engineering design projects. The first author has adopted Midas-GTS analysis to investigate raft foundations and piled raft foundations for many years [33,34]. Agreeable results obtained from the 3D Midas-GTS analysis on elastic and inelastic soils have been successfully compared to those from 3D PLAXIS analysis [35,36].
In the study, the analytic zone of the FE mesh was set up to be 200 m × 200 m × 60 m (Figure 2). The essential boundary conditions (roller and hinge) were applied to the FE zone. Eight-node isoparametric solid elements were mainly used to discretize the mesh. At some finer regions, 6-node solid elements can also be found. Since linearized shape functions were used for these elements, the FE mesh was made by smaller cubic elements with the dimension of 1m for the foundation and the soils around the ground surface. The convergence and stability of the solutions were ensured. As the maximum differential settlements of the rafts are much less than the distance between the center and the edge of the raft, compatibility condition was assumed at the interface between the slab and the soil. The possible influences of the discrete mesh, the size of the FE zone, and the boundary conditions were clarified to ensure that the solutions are stable and accurate enough in this study. Figure 3 and Figure 4 depict the results of the validations of the FE analytical zone and the solutions compared to PLAXIS analysis on linearly elastic soils and FD analysis with nonlinear soil springs.
The effect of the initial state of ground stress was considered in the analysis for more realistic estimation of foundation behavior. The staged construction procedure of the analysis was adopted to model the material nonlinearities. Incremental load was applied at each step in order to reach the total loading pressure. A 10-story building load on the raft measuring 26 m × 26 m was presumed. The design structural load pressure is about 100 kPa (10 kPa per story suggested by the design code). Therefore, a total foundation load of 67.6 MN was assumed, and the same amount of load was applied to the rafts with different dimensions. Iterative procedures were employed to ensure the convergence of the foundation settlements. FE analysis was performed to solve for the nodal displacements at the interfaces between the foundation and soil. The soil reaction at the bottom node of the slab was obtained by averaging the internal stresses of the top soil elements. Once the displacements and the soil reactions were obtained, the coefficient of subgrade reactions was computed by dividing the pressure with the displacement.

3. Observations and Discussions

To monitor the settlements, the contact pressure, and the coefficient of subgrade reaction of the surface raft under vertically uniform load at clayey and sandy sites, following studies were planned. The effects of soil stiffness and foundation rigidity were discussed. The observations can help engineers to better understand the foundation load-response mechanism.

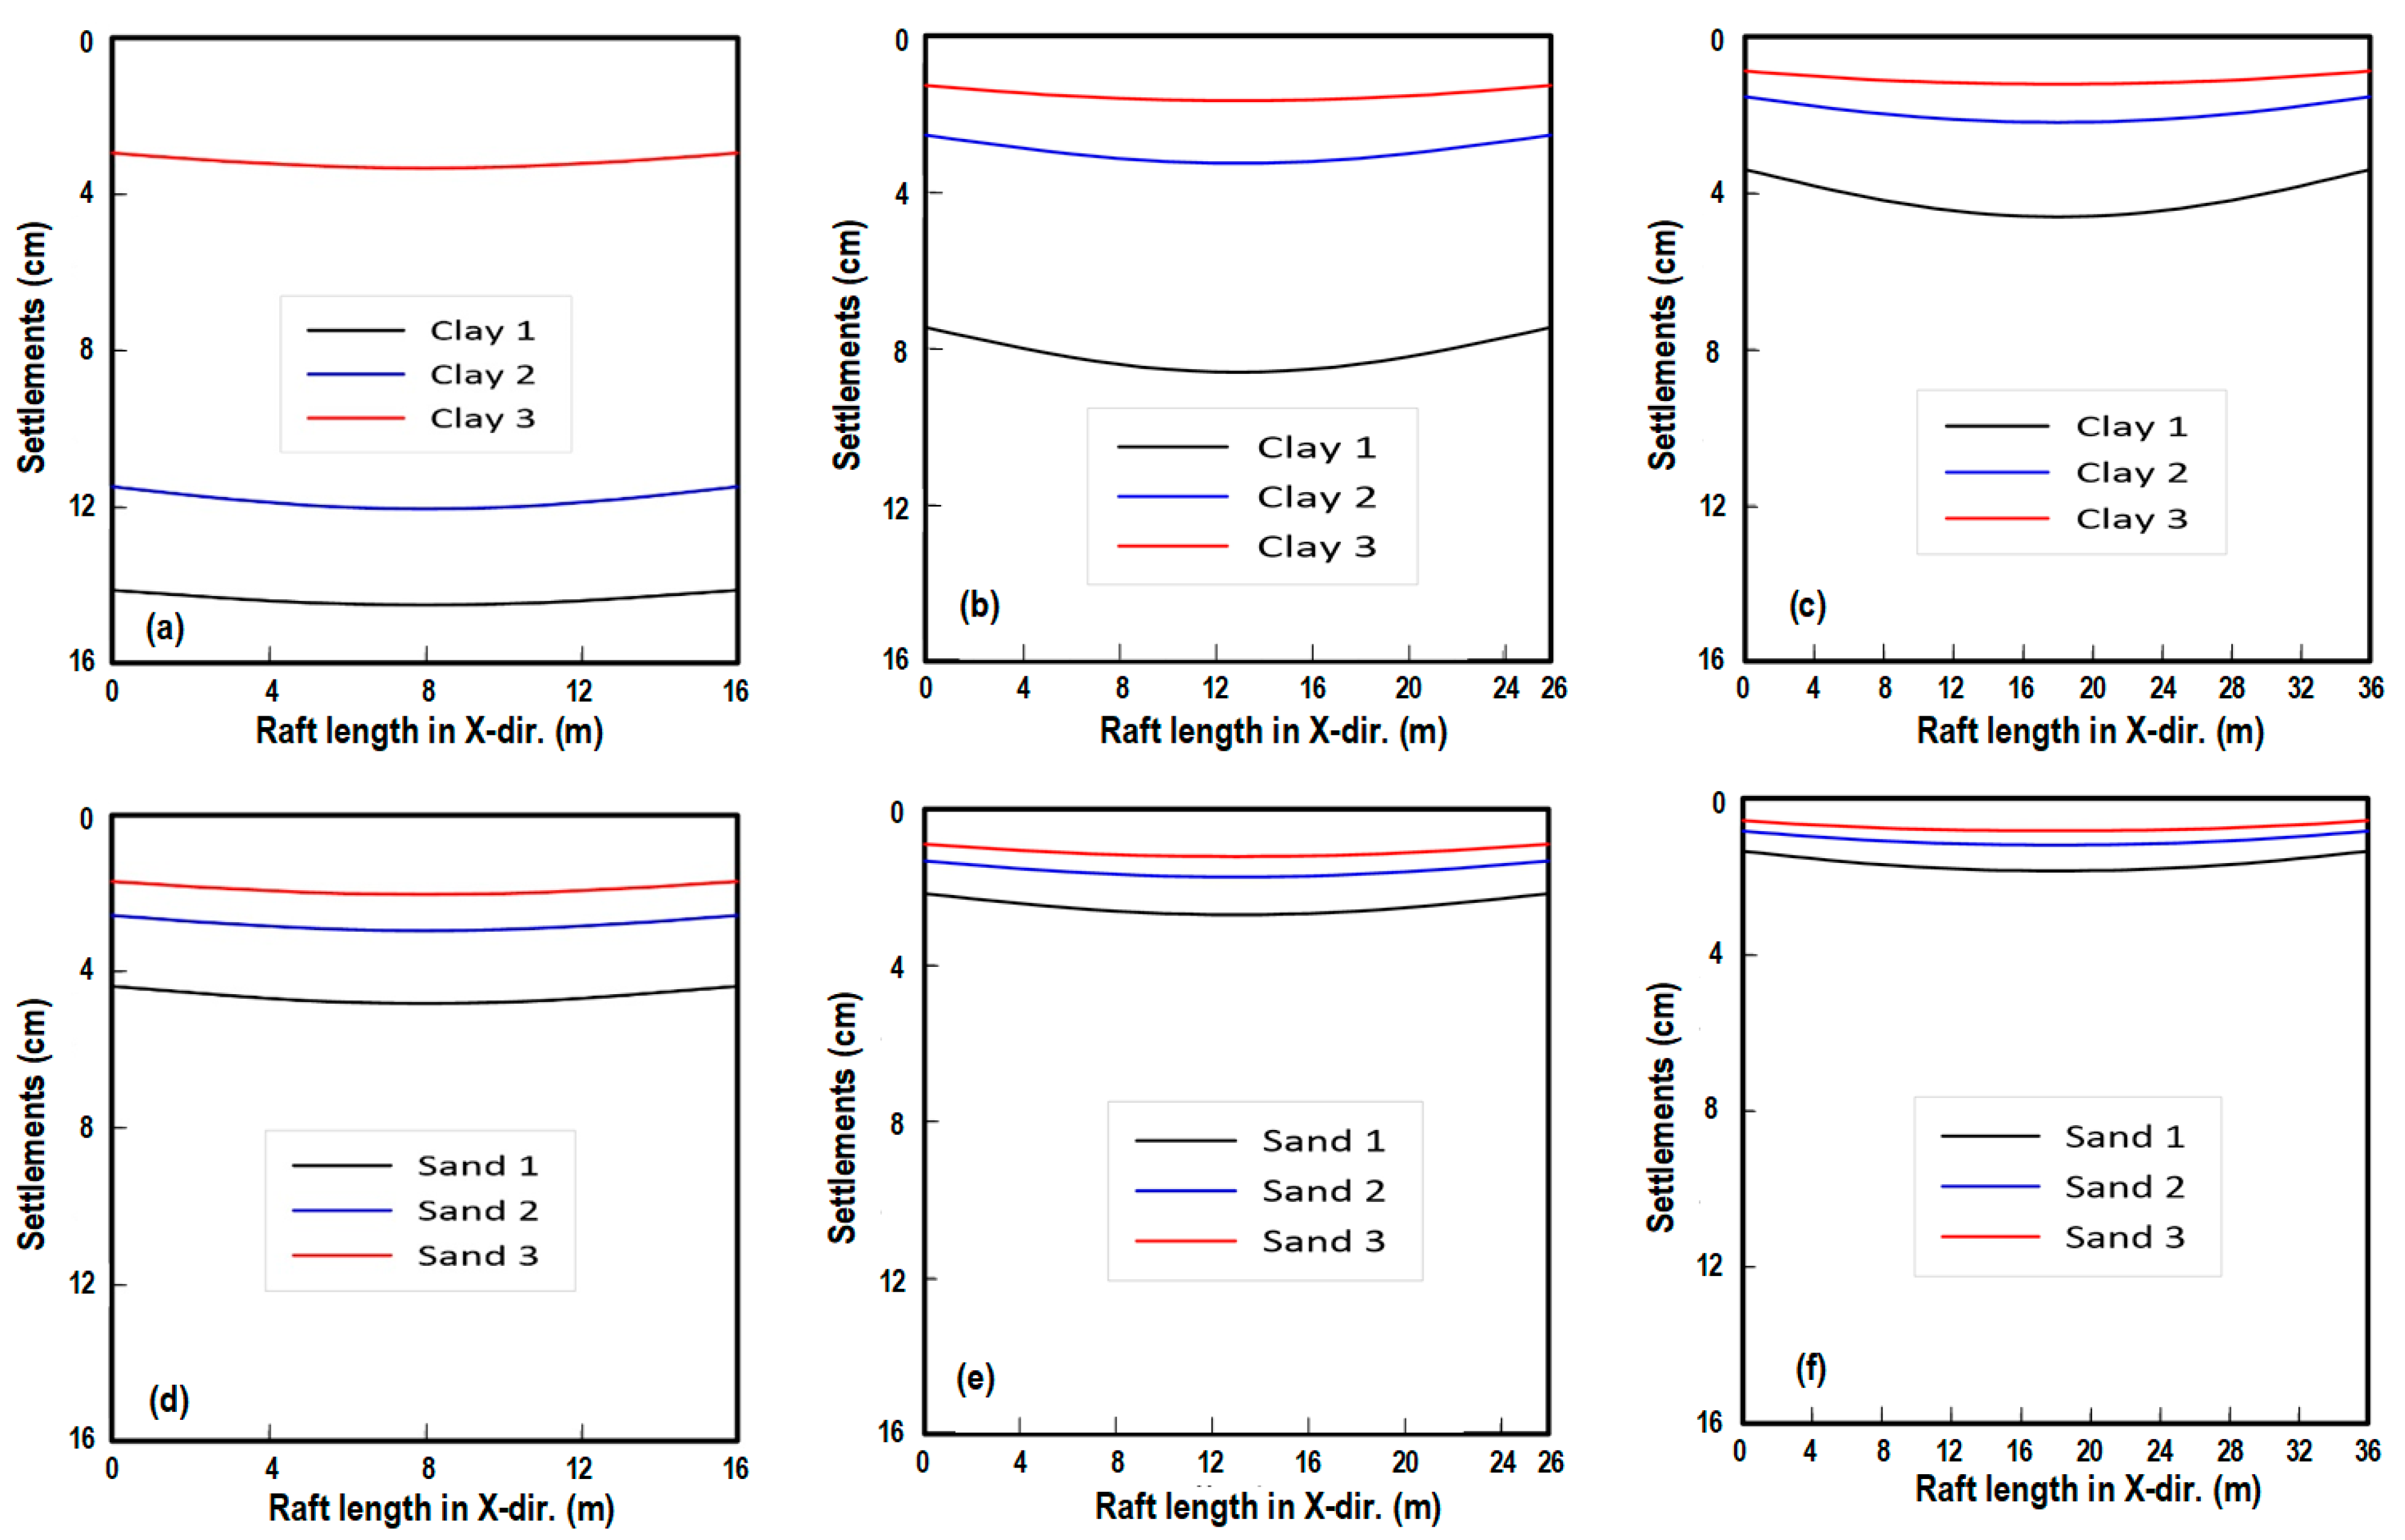
3.1. Foundation Settlements

Figure 5 illustrates the settlements across the middle section of the raft in different soils. It is clear that all the foundation models in the study were semi-rigid and/or flexible foundations because of the presence of differential settlements. The maximum settlement of the raft always occurred at the center. As the soil became stiffer (from Clay 1 to Clay 3), the maximum settlement decreased and more uniform settlements were found. The influence of soil stiffness was more clearly observed in clay (Figure 5a–c). For foundations in sand, the effect of soil stiffness became relatively insignificant. Similarly, when the soil stiffness increased (from Sand 1 to Sand 3), more uniform settlements were observed (Figure 5d–f). Figure 5 also depicts the effects of raft dimension on foundation settlements. Since the total load applied to the rafts was kept the same, rafts with smaller dimensions should result in larger settlements. The foundation settlements were highly affected by the soil stiffness. While the rigidity of the foundation can be increased by reducing the raft dimensions and soil stiffness, more uniform settlements of the raft can be found in Figure 5a,d. For soils with the same stiffness, granular soils can provide better resistances in minimizing the foundation settlements.

3.2. Contact Pressures of Soils

The corresponding stresses of the soil reactions (i.e., the contact pressures) are plotted in Figure 6 for rafts with different dimensions in clays and in sands. It can be obviously seen that the contact pressures from the soil elements were varied at different locations under the foundation. For the smallest raft in clay, the contact pressures appeared to be more consistent (Figure 6a). For such rafts in very soft clays, the stresses of the soil reactions were found to be much smaller than those exerted in stiffer clays. Notice that the load pressures applied to the smallest raft were around 264 kPa, adding up with the weight of the concrete slab, the total load transmitted to the bottom of the foundation should approximate 288 kPa. The soil reactions for Clay 2 and Clay 3 with the smallest raft can reflect such levels of the pressure. It is believed that the total amount of energy carried out by the underneath soils is key in presenting the settlements and the contact pressures. When the raft became larger (Figure 6b,c), load pressures applied to the raft became 100 kpa and 52 kpa, respectively. The contact pressures of Clay 1 appeared to be larger at the edge and smaller at the center. Sharp changes in the contact pressures near to the edge are believed to be activated by the discontinuity of the foundation geometry in these cases. For the cases in Clay 2, the distributions of the contact pressures were varying from Figure 6b,c. Higher contact pressures were found in the center of the foundation for Clay 2. For the rafts in Clay 3, larger contact pressures were found at the center of the foundation. These observations implied that the contact pressures of a raft foundation in clay are far more complicated than those revealed commonly.
For the rafts in sand (Figure 6d–f), more consistent distribution of contact pressures can be found. Larger contact pressures at the center and lower at the edges were observed for rafts with dimensions of 26 m and 36 m. The stresses at the foundation edge are smaller compared to the center one especially for very stiff sand. For the smallest raft, larger stresses occurred at the edge. The effects of soil stiffness (or strength) of the sand were found to be negligible to the contact pressures. Once again, sharp changes in the contact pressures of the soil near to the edge were observed for rafts in sand.

3.3. Coefficient of Subgrade Reaction (ks)

Figure 7 presents the coefficient of subgrade reaction for raft foundations with different dimensions. The value of ks (Units in F/L3) was calculated dividing the contact pressure by the foundation settlement at the same node. Excluding the data shown in Figure 7a for the small raft in clay, ks was generally found to be smaller at the center and larger at the edges. Stiffer soils provide higher coefficients of the subgrade reactions. Sandy soils provide higher coefficients compared to those found in clay. For square rafts in sand, ks was affected considerably by the foundation width and the soil stiffness. For small rafts in clay, the values of ks became rather consistent. Corresponding ks values at the center of the foundation (ksc) are summarized in Table 3. It can be learnt that the values of ksc for the subgrade soils at the center of the foundations were affected by both the soils and the foundation dimension. However, the effects due to the dimensions of the foundation were relatively small in comparison to those caused by soil stiffness.
The functional values of the normalized functions of f(x) for ks based on the values of ksc at the center of the foundation are shown in Figure 8. It can be found that the normalized values of ks in sand were nearly independent of soil stiffness (Figure 8d–f), whereas those found in clay exhibited some deviations at the edge according to the changes in soil stiffness (Figure 8a–c). Except for the smallest raft in clay, all the shapes of the normalized values of ks for the subgrade soils were about the same. This indicates that the normalized ks can be modelled by some mathematic functions which are useful to routine design practice.

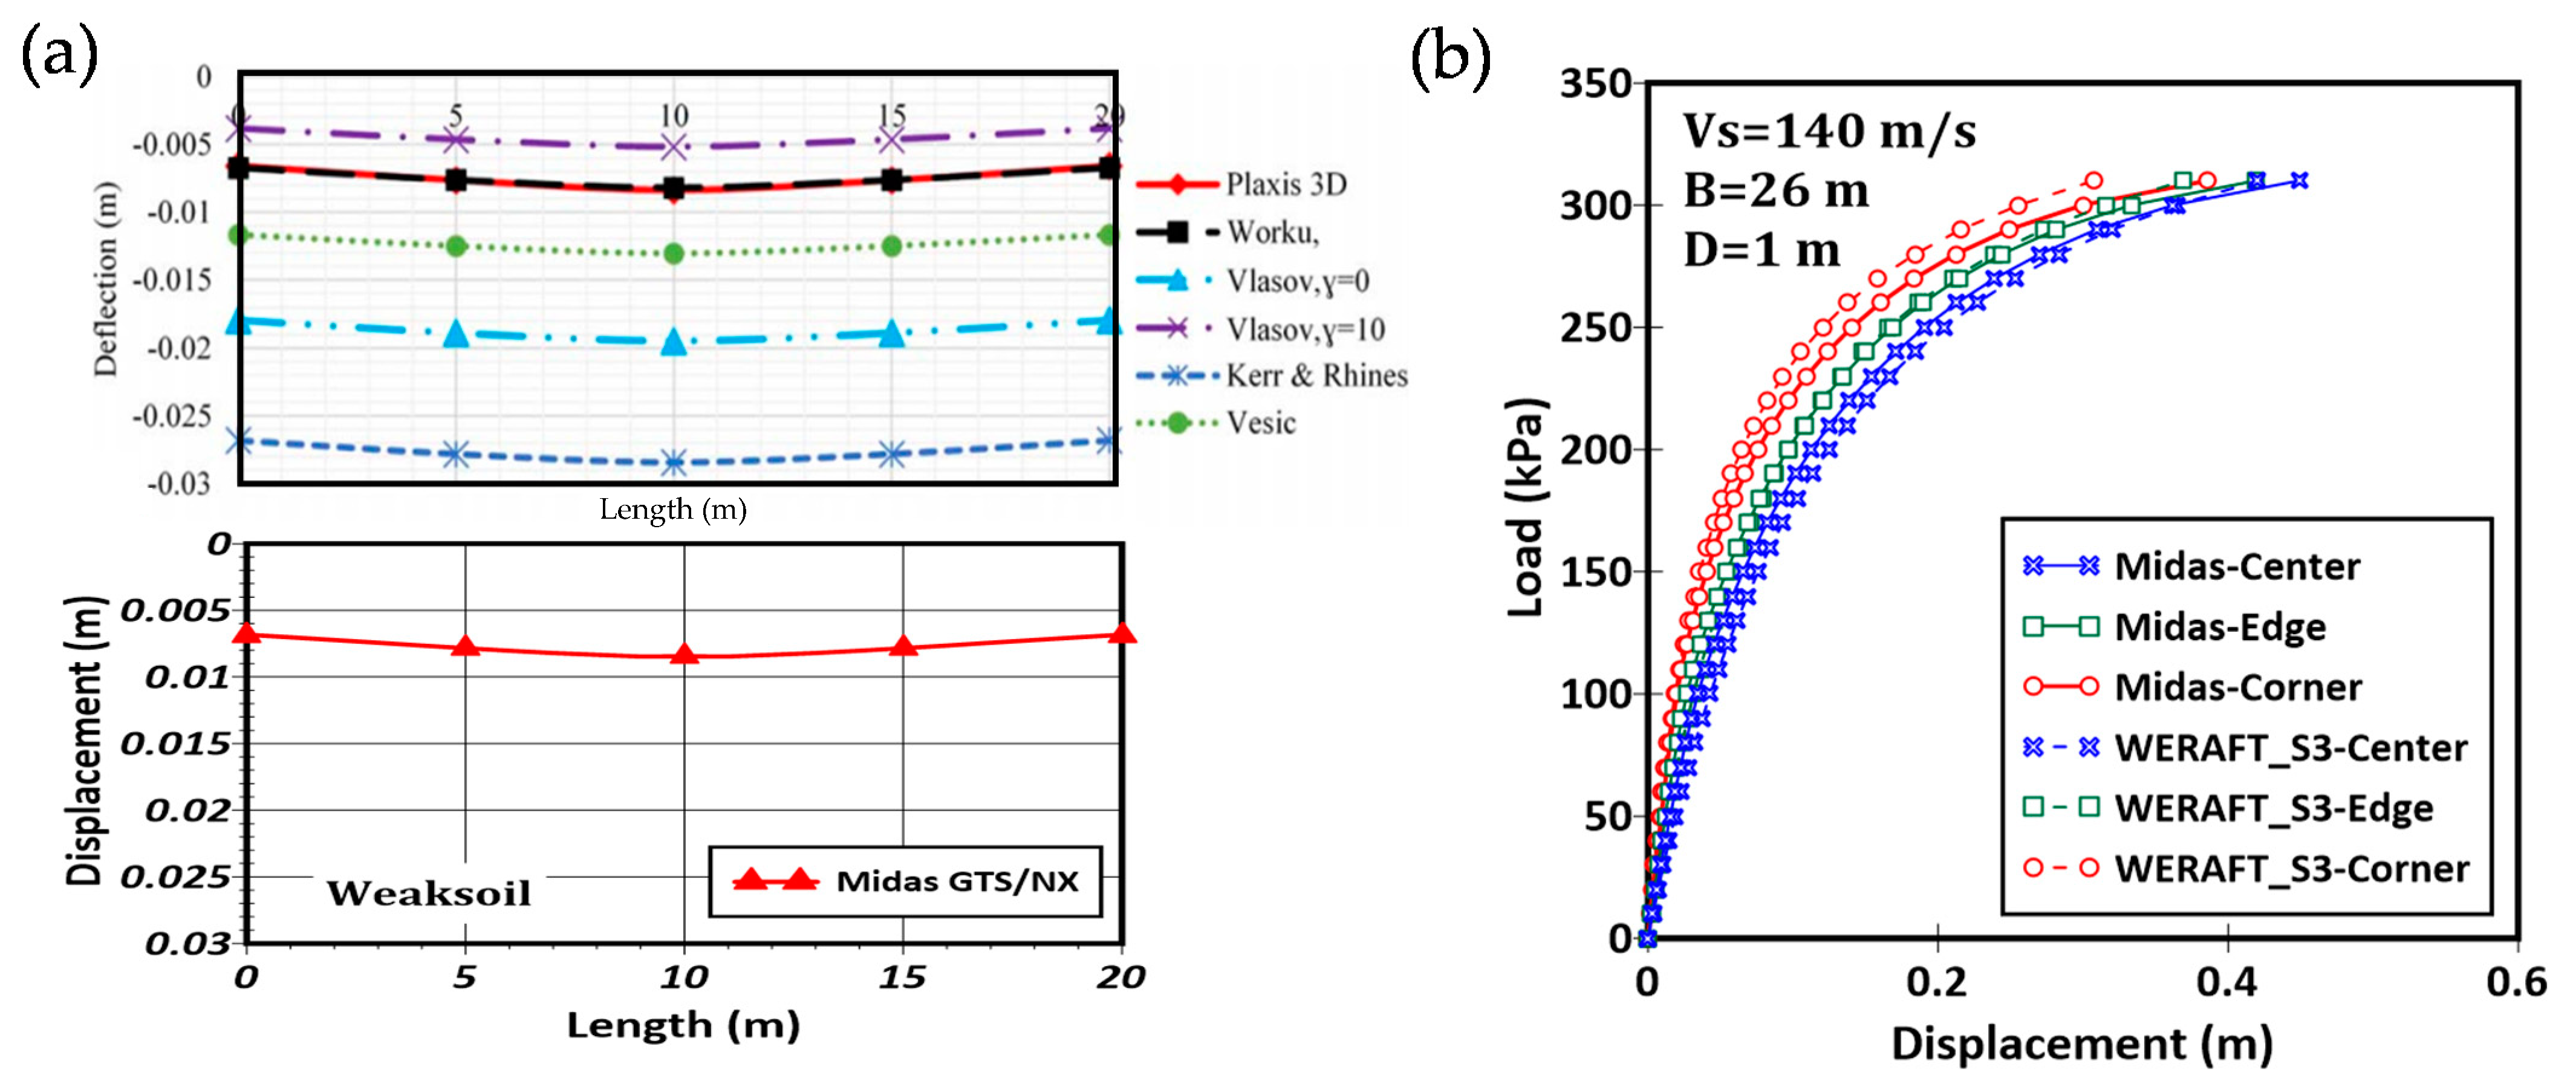
3.4. Comparisons to Lysmer’s Analog Spring Model

Figure 9 presents the data from Table 3 for coefficients of subgrade reactions at the center of foundations with the soil spring constants calculated from Lysmer’s analog model, i.e., k s = 4 G r 0 / ( 1 υ ) , where G is the shear modulus of the soil and r0 is the equivalent radius of the foundation. Note that Lysmer’s model was suggested for total soil spring under a rigid foundation. The Units of ks in Lysmer’s model are F/L. In order to make the comparisons, the value of ks from Lysmer’s model was divided by (n + 1)2 to obtain the value of ksc for a series of micro springs, where n is the integer number of the foundation width in meters. Each spring was located at the grid point occupying the area of 1 m2. It can be learnt that when Lysmer’s model was used for raft foundations in clay, ksc would be significantly overestimated except for the case where raft dimension was 36 m and Vs was at 180 m/s. Note that the deviations became significant for small rafts (Figure 9a). If Lysmer’s model was used for raft foundations in sand, ksc would be significantly underestimated in the cases where raft dimension was kept at 26 m or 36 m (Figure 9b). The underestimations were especially noted for very stiff sand.
In Figure 10, the values of ksc are plotted against the corresponding values of foundation rigidity Kr obtained from Equation (3). It can be seen that the influence of Kr on ksc was relatively small for those obtained from this study in comparison to those from Lysmer’s model. For the foundation models studied with Kr in the range of 0.005–0.1, the value of ksc was found to be mainly affected by soil stiffness. Similarly, the values of ksc predicted from Lysmer’s model in clay were overestimated compared to those obtained from this study. The values of ksc from Lysmer’s model in sand would be underestimated compared to those from this study. The deviations of ksc in sand became trivial as the foundation rigidity increased, especially for low stiffness sand.

3.5. Modeling of ks

The values of ksc for the raft models with different dimensions were obtained to show their relationships with the shear wave velocities of the soils. Figure 11 presents the plots of ksc vs. Vs. The medians of ksc were used to suggest the interpolation functions in representing the relationships. The resulting functions are presented in Table 4. It should be pointed out that the functions can yield more accurate ksc in cases where foundation dimension is greater than 20 m. The coefficient of subgrade reaction underneath the raft ks can be calculated using the following equation:
k s ( x , y ) = k s c × h ( x , y ) = k s c × f ( x ) × f ( y ) ,
where h(x, y) is a 2D function formed by multiplying the normalized function f(x) with g(y); g(y) has the same expression as f(x) replacing x by y. Note that x is the distance between the center and point of interest in the width direction, and 0 ≤ xB/2 (for square raft foundation, B = L). Similarly, y is the distance between the center and the point of interest in the length direction; 0 ≤ yL/2. The normalization function f(x) values are listed in Table 5. By knowing the averaged shear wave velocity of the soils at the site and the designed width of the raft foundation, engineers can use Equation (4) with the values of ksc from Table 4 and the normalized functions from Table 5 to compute the coefficients of subgrade reactions ks for foundation analysis.

4. Concluding Remarks

The foundation settlements, contact pressure of the soil, and the coefficient of the subgrade reaction were investigated for square raft foundations located at the surface of clayey and sandy ground under a uniform vertical load. The Mohr–Coulomb model was used to model the soils, with the strength parameter corresponding to various shear wave velocities of the soil (Vs ≤ 180 m/s). The findings are summarized as follows:
(1)
For the raft foundation models simulated in this study, the rigidity of the foundation Kr was calculated following the Egyptian code. The values of Kr were in the range of 0.005–0.1, indicating that the foundations were semi-rigid. The maximum foundation settlements were found at the center of the foundation models. The foundation settlements decreased with increases in soil stiffness.
(2)
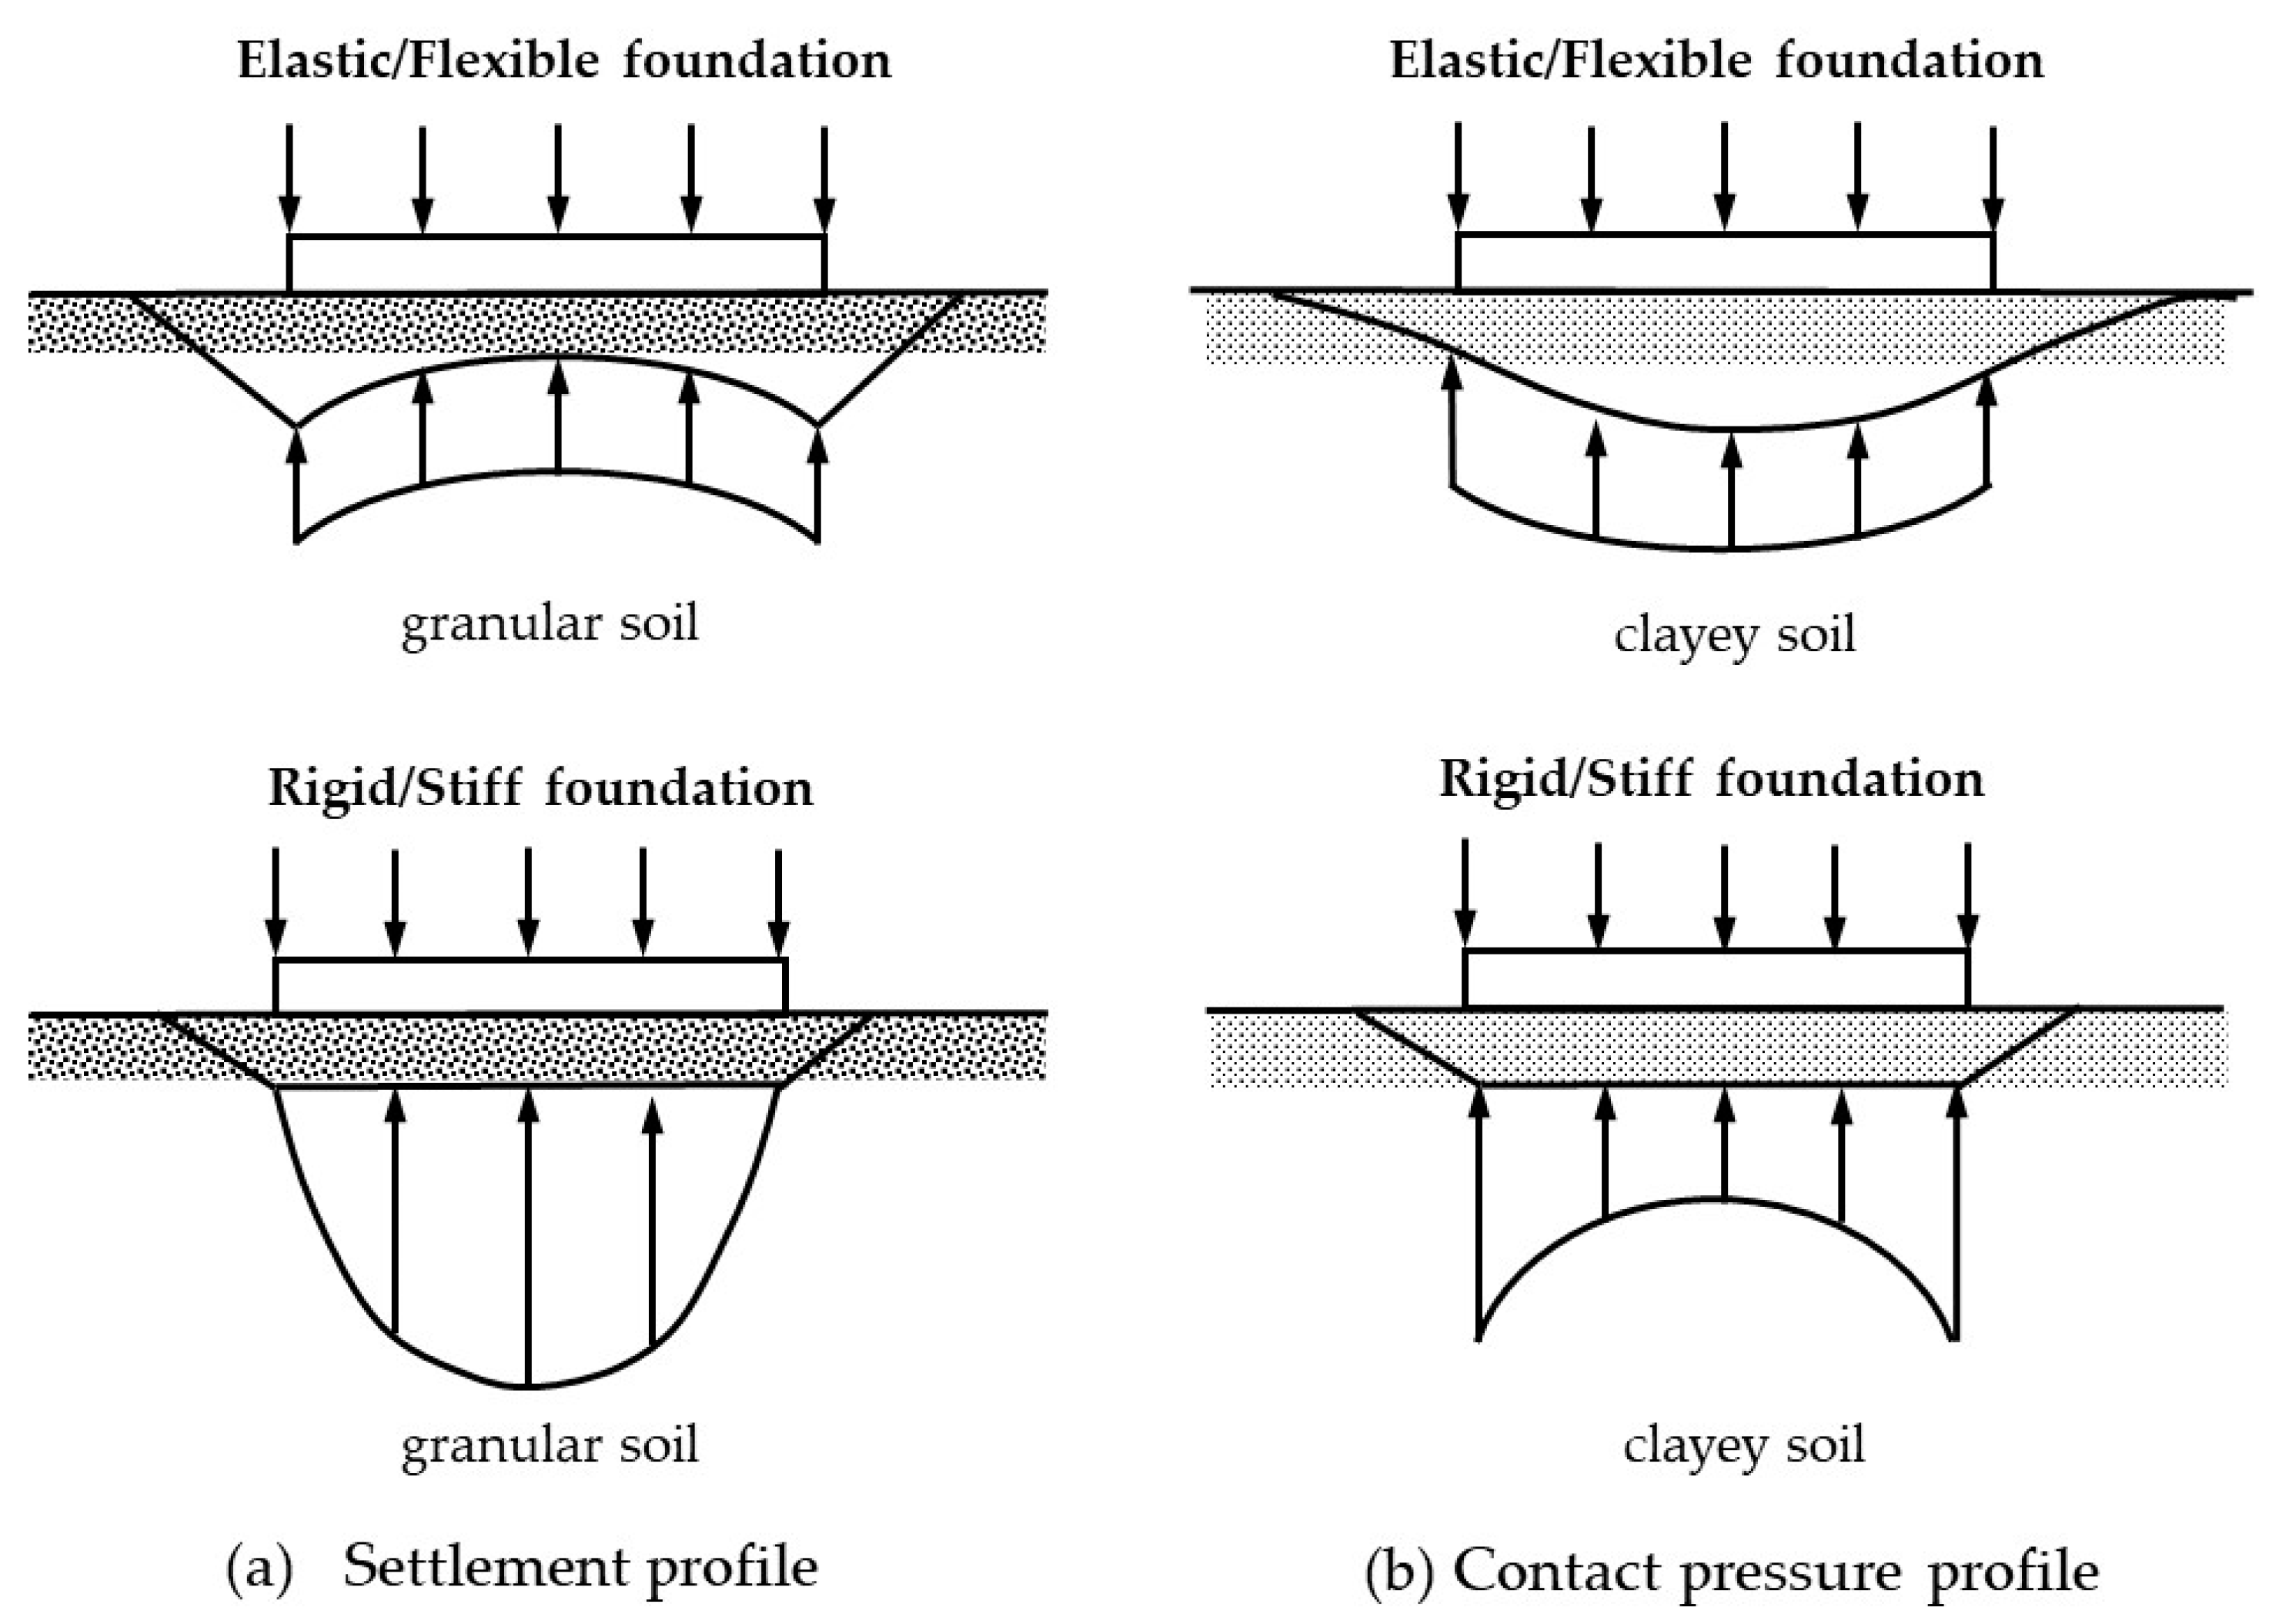
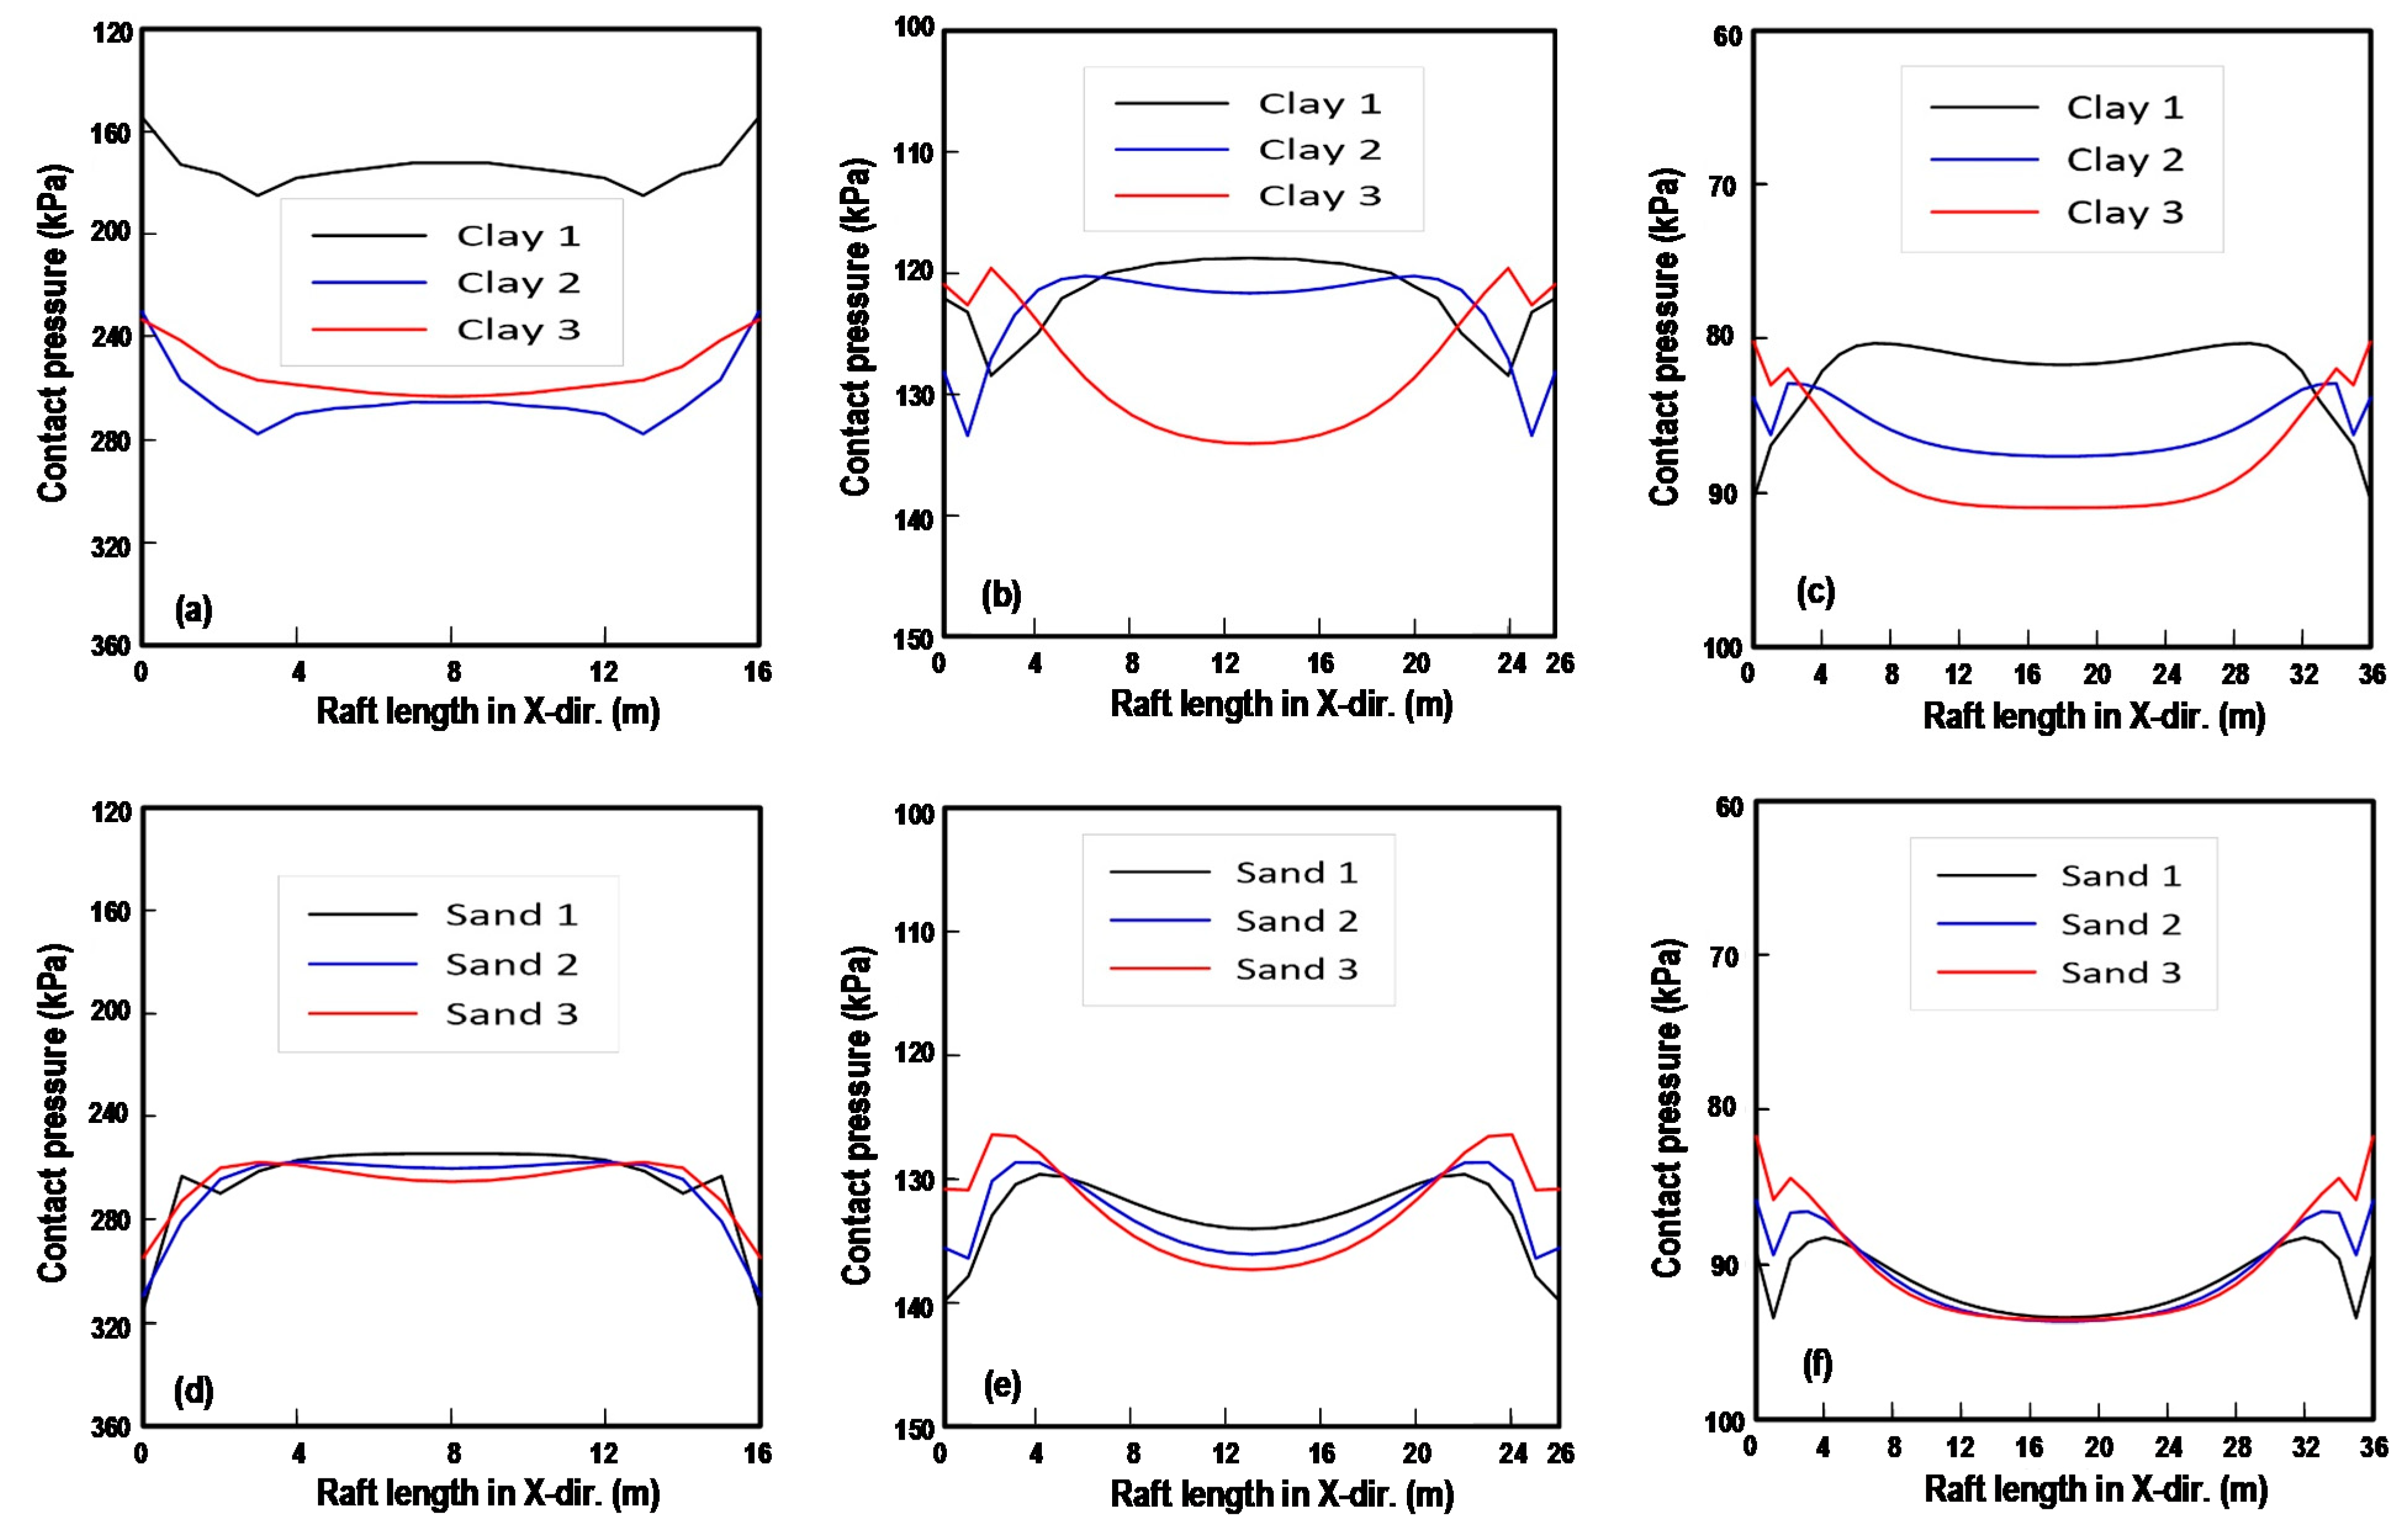
The contact pressure distribution was significantly affected by the rigidity factor of the foundation and the soil stiffness. For the rafts with L = 16 m in clay, the contact pressure was relatively consistent. For the raft with L ≥ 26 m in very soft clay, the contact pressure was found to be low at the center and high at the edges. As the clays became stiffer, a higher contact pressure was then noted at the center. For the foundation with L = 16 m in sandy soil, the contact pressure was independent of soil stiffness and was low at the center. For the foundation with L ≥ 26 m in sandy soil, high contact pressure was observed at the center. This pattern was more prominent in soil with higher soil stiffness. Owing to the discontinuity of the structure geometry, sudden changes in contact pressures near to the edges were observed in all cases; however, it was negligible for high soil stiffness.
(3)
Unlike the distributions of contact pressure, the distributions of coefficients of subgrade reactions of the soils under the raft were found to be more consistent. They will be generally lower at the center and become higher at the edge. For the smallest rafts in clay, the coefficients of subgrade reaction would be slightly varied under the foundation.
(4)
The coefficient of subgrade reactions ks is suggested by mathematic function. The value of ks can be determined by multiplying the reference value ksc at the center of the foundation with a 2D polynomial function. For raft foundations in sand, the functions are only dependent on foundation dimensions. For raft foundations in clay, the functions are dependent on both soil stiffness and foundation dimension.
(5)
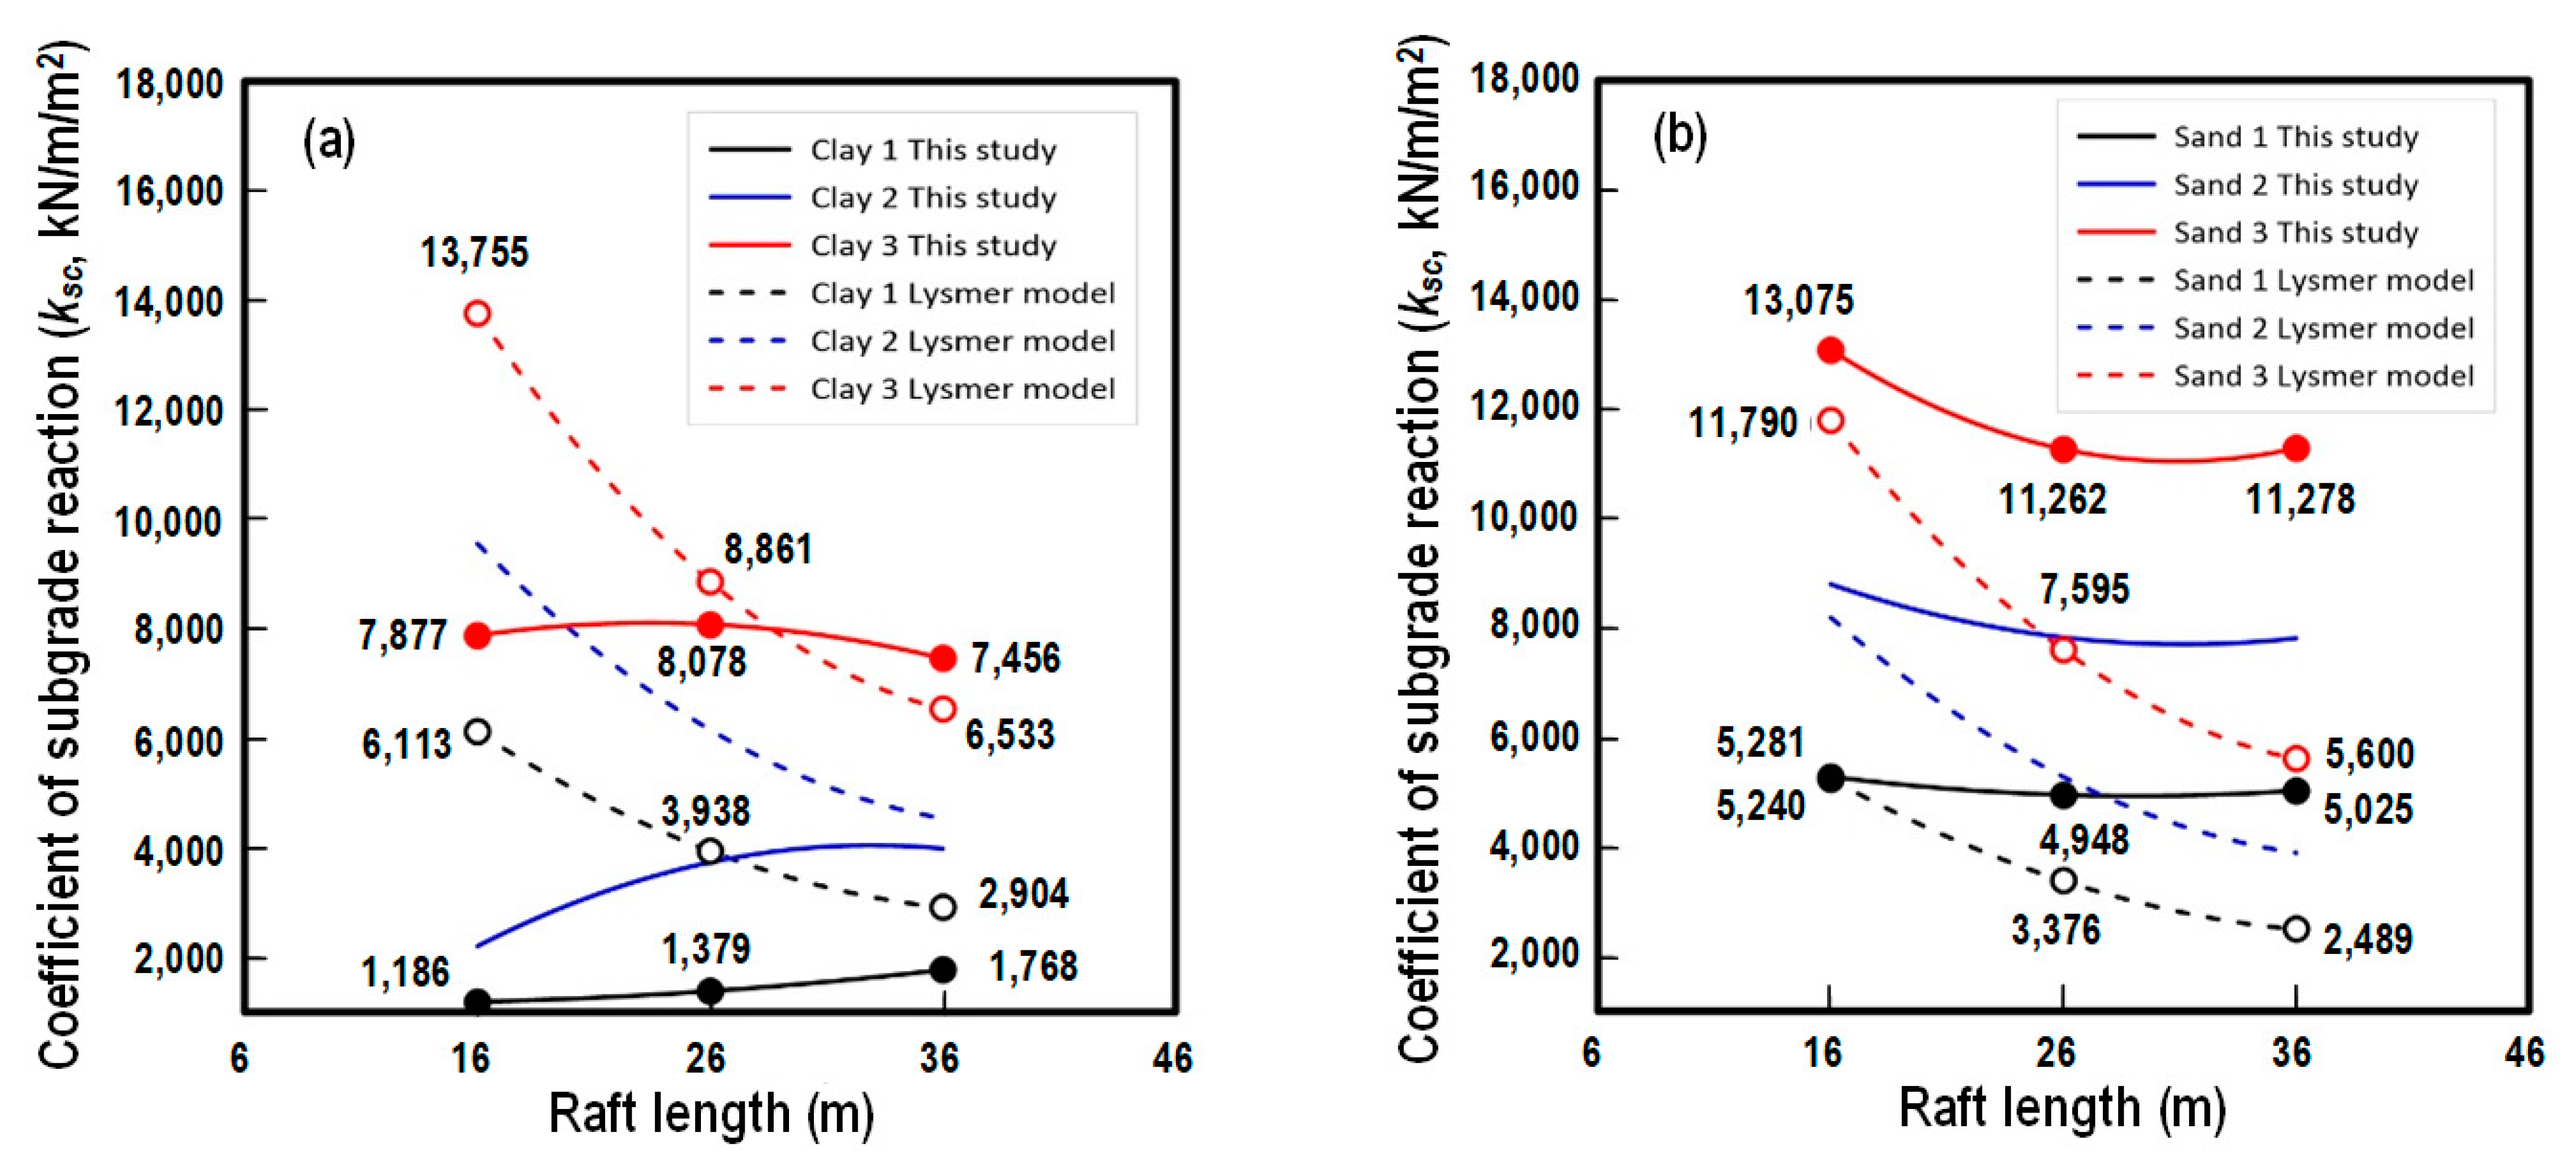
With the presumed design loads, the coefficient of subgrade reaction ksc at the center of foundations was found to be 1186~1768 kN/m/m2, 2201~3983 kN/m/m2, and 7456~8078 kN/m/m2 for Clay 1, Clay 2, and Clay 3, respectively. Similarly, for Sand 1, Sand 2, and Sand 3, the value of ksc was found to be 4948~5281 kN/m/m2, 7808~8793 kN/m/m2, and 11,262~13,075 kN/m/m2, respectively. It is noted that the value of ksc will be affected by foundation dimensions.
(6)
It should be noted that the actual stiffness of sand in the field could be much higher than the values obtained in this study. Much higher values of ksc for sand should be expected in actual applications. In spite of the possible influence of ksc, the suggested functions are applicable to sand because the influence of soil stiffness was found to be trivial to the proposed functions in sand.
(7)
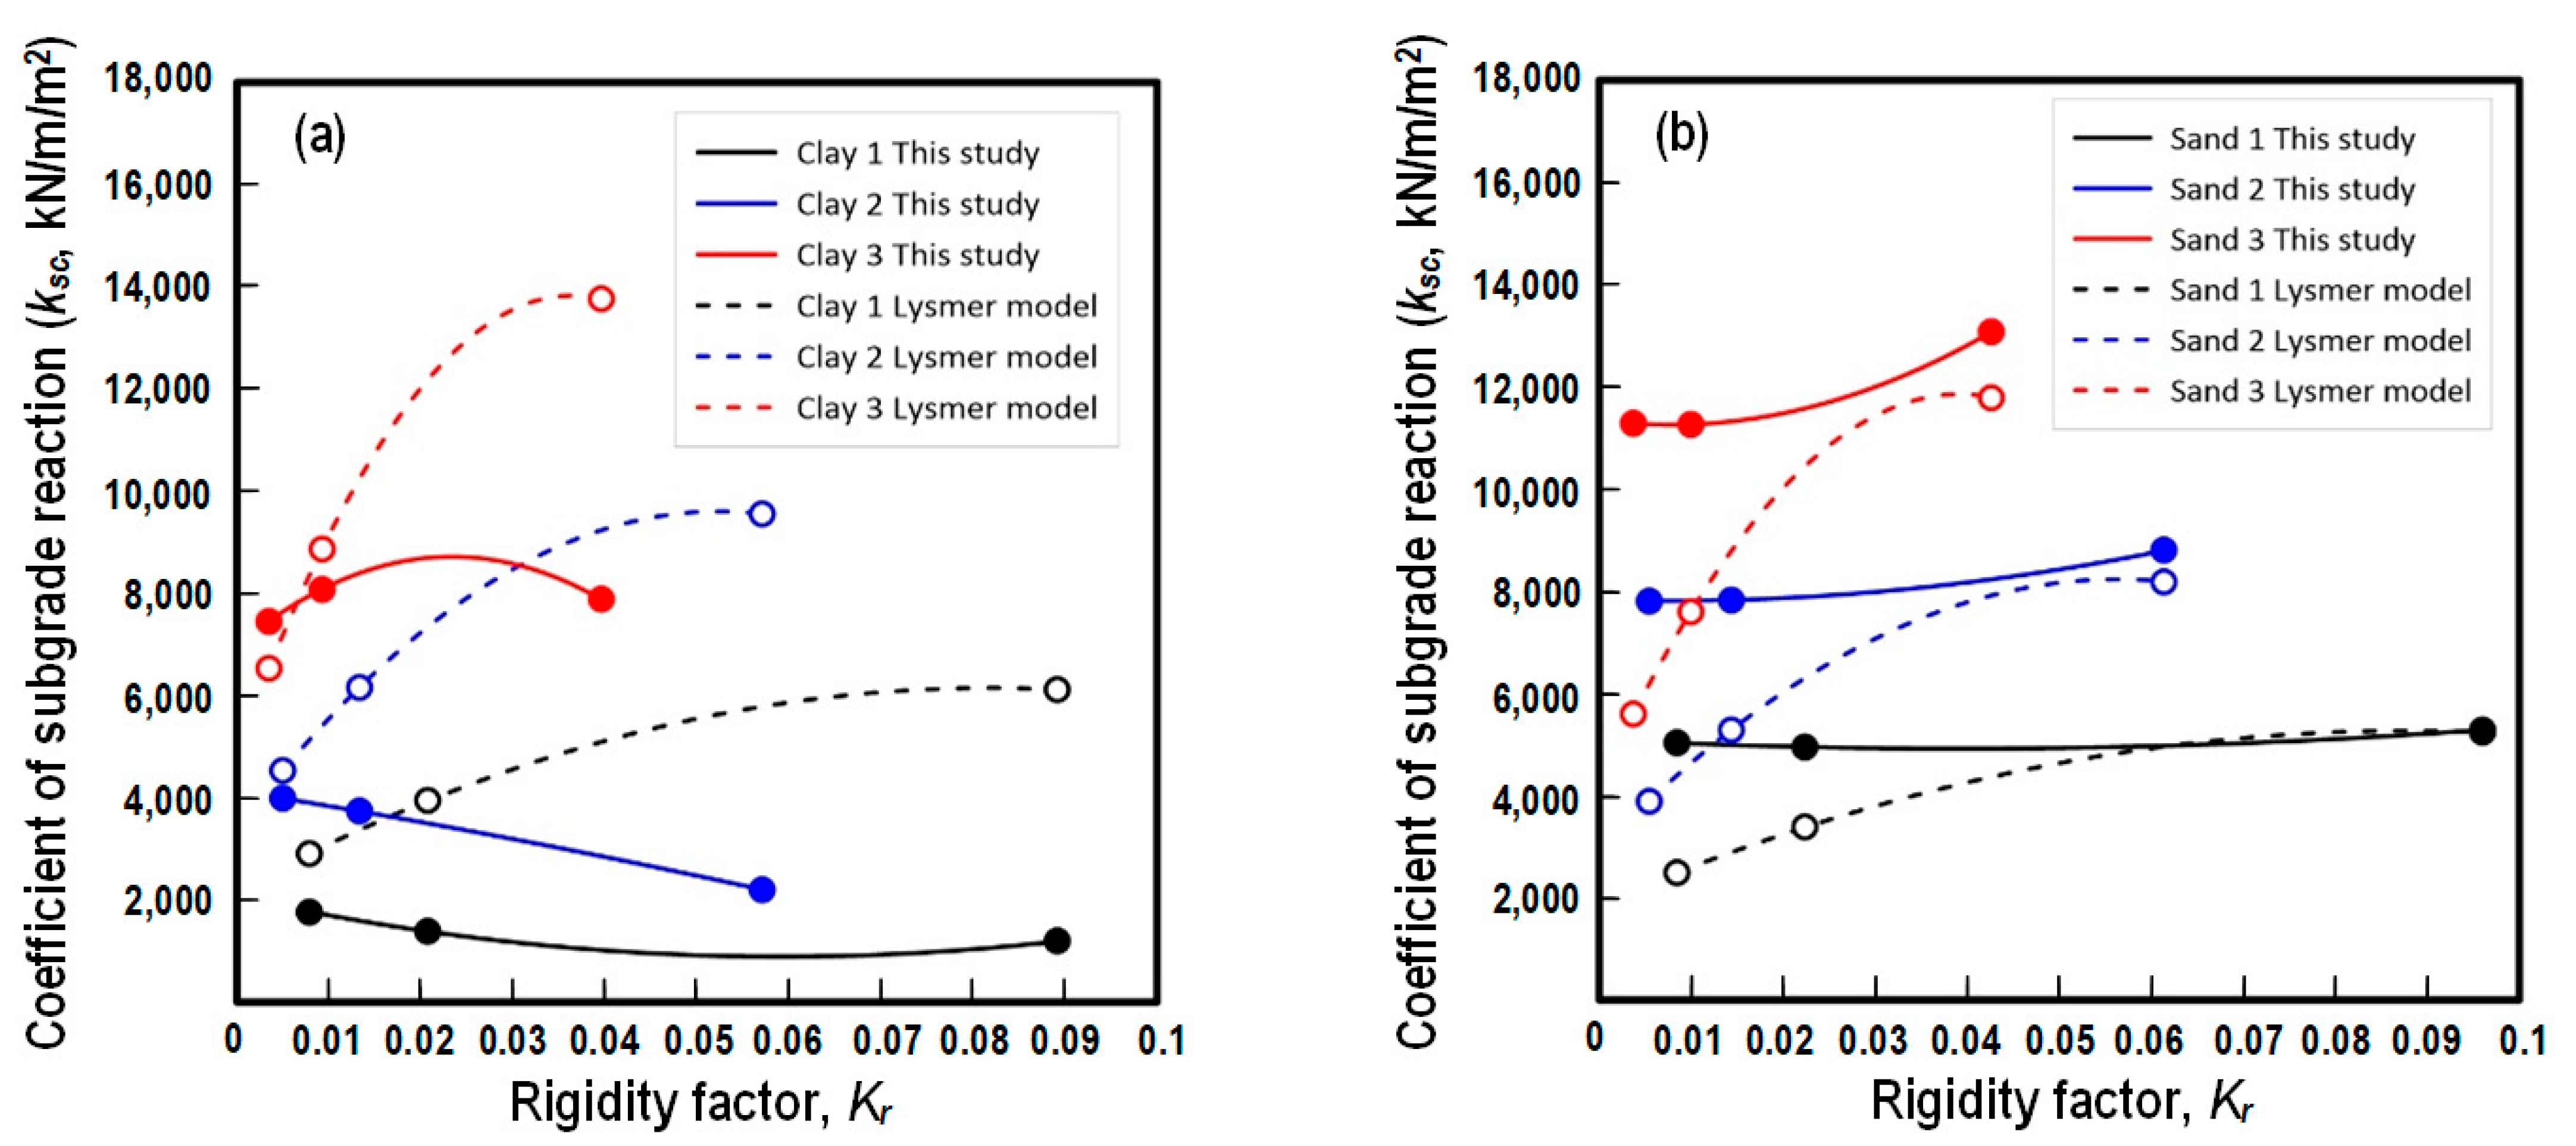
For raft foundations in clay, if Lysmer’s analog spring model is used, it will generally overestimate the value of ks. For raft foundations in sand, Lysmer’s model will underestimate the value of ks, especially for foundations with low rigidity.

Author Contributions

The conceptualization, methodology, writing—original draft preparation, and validation have been made by D.-W.C., C.-W.L., Y.-J.T. and S.-H.C.; formal analysis, writing—review, and editing by D.-W.C. and S.-H.C.; and prepared figures and tables by Y.-J.T. and S.-H.C. All the authors have reviewed the manuscript. All authors have read and agreed to the published version of the manuscript.

Funding

This study is supported by MOST through research grant 109-2813-C-032-009-E.

Acknowledgments

Besides the fund from MOST, this study also thanks for the support by the Taiwan Building Technology Center from the Featured Areas Research Center Program funded by the Ministry of Education in Taiwan. The authors would like to express their sincere gratitude towards the supports which made this research possible.

Conflicts of Interest

The authors declare no conflict of interest.

References

  1. ACI Committee 336. Suggested analysis and design procedures for combined footings and mats. Struct. J. 1988, 86, 304–324. [Google Scholar]
  2. DIN 4018; Berechnung der Sohldruckverteilung unter Flächengründungen Einschl. DIN-Normenausschuss Bauwesen (NABau): Berlin, Germany, 1974.
  3. IS 2950; Code of Practice for Design and Construction of Raft Foundations: Part 1. Bureau of Indian Standards: Delhi, India, 1981.
  4. Milovic, D. Stresses and Displacements for Shallow Foundations; Elsevier Science: Amsterdam, The Netherlands, 1992. [Google Scholar]
  5. Brown, P.T. Numerical Analyses of Uniformly Loaded Circular Rafts on Deep Elastic Foundations. Geotechnique 1969, 19, 399–404. [Google Scholar] [CrossRef]
  6. Pantelidis, L.; Gravanis, E. Elastic Settlement Analysis of Rigid Rectangular Footings on Sands and Clays. Geosciences 2020, 10, 491. [Google Scholar] [CrossRef]
  7. El Gendy, M. An analysis for determination of foundation rigidity. In Proceedings of the 8th International Colloquium on Structural and Geotechnical Engineering, Ain Shams University, Cairo, Egypt, 15–17 December 1998. [Google Scholar]
  8. ECP 196; A Egyptian Code for Soil Mechanics-Design and Construction of Foundations: Part 3. The Housing and Building Research Center (HBRC): Cairo, Egypt, 1995.
  9. Barden, L. Distribution of Contact Pressure Under Foundations. Geotechnique 1962, 12, 181–198. [Google Scholar] [CrossRef]
  10. Dash, S.K.; Saikia, R.; Nimbalkar, S. Contact pressure distribution on subgrade soil underlying geocell reinforced foundation Beds. Front. Built Environ. 2019, 5, 137. [Google Scholar] [CrossRef]
  11. Fattah, M.Y.; Salim, N.M.; Alwan, K.K. Contact pressure distribution under circular shallow foundation subjected to vertical and rocking vibration modes. J. Build. Eng. 2019, 26, 100908. [Google Scholar] [CrossRef]
  12. Kumar, A.; Choudhury, D.; Katzenbach, R. Effect of Earthquake on Combined Pile–Raft Foundation. Int. J. Geomech. 2016, 16, 04016013. [Google Scholar] [CrossRef]
  13. Roy, J.; Kumar, A.; Choudhury, D. Pseudostatic approach to analyze combined pile-raft foundation. Int. J. Geomech. 2020, 20, 06020028. [Google Scholar] [CrossRef]
  14. Pasternak, P.L. On a New Method of an Elastic Foundation by Means of Two Foundation Constants; Gosstroiizdat: Moscow, Russia, 1954. [Google Scholar]
  15. Vlasov, V.N.; Leont’ev, N.N. Beams, Plates and Shells on Elastic Foundations; Israel Program for Scientific Translations: Jerusalem, Israel, 1960. [Google Scholar]
  16. Kerr, A.D.; Rhines, W.J. A Further Study of Elastic Foundation Models; Rep. S-67-1; New York University School of Engineering and Science: Bronx, NY, USA, 1967. [Google Scholar]
  17. Ozgan, K.; Daloglu, A.T. Effect of transverse shear strains on plates resting on elastic foundation using modified Vlasov model. Thin-Walled Struct. 2008, 46, 1236–1250. [Google Scholar] [CrossRef]
  18. Worku, A. Development of a calibrated Pasternak foundation model for practical use. Int. J. Geotech. Eng. 2014, 8, 26–33. [Google Scholar] [CrossRef]
  19. Jeong, S.; Park, J.; Hong, M.; Lee, J. Variability of subgrade reaction modulus on flexible mat foundation. Geomech. Eng. 2017, 13, 757–774. [Google Scholar]
  20. Liao, S.S.C. Estimating the coefficient of subgrade reaction for plane strain conditions. Proc. Inst. Civ. Eng.-Geotech. Eng. 1995, 113, 166–181. [Google Scholar] [CrossRef]
  21. Loukidis, D.; Tamiolakis, G.-P. Spatial distribution of Winkler spring stiffness for rectangular mat foundation analysis. Eng. Struct. 2017, 153, 443–459. [Google Scholar] [CrossRef]
  22. Worku, A.; Seid, T. Application of a robust subgrade model in the analysis of plates on an elastic foundation. Int. J. Geomech. 2020, 20, 04020192. [Google Scholar] [CrossRef]
  23. Chang, D.W.; Hung, M.H.; Jeong, S.S. Modified Lysmer’s Analog model for two dimensional mat settlements under vertically uniform load. Geomech. Eng. 2021, 25, 221–231. [Google Scholar]
  24. Poulos, H.G. Pile-raft foundation: Design and applications. Geotechnique 2001, 51, 95–113. [Google Scholar] [CrossRef] [Green Version]
  25. Poulos, H.G. The Design of Foundations for High-rise Buildings. Proc. Inst. Civ. Eng. 2010, 163, 27–32. [Google Scholar] [CrossRef]
  26. Katzenbach, R.; Leppla, S.; Choudhury, D. Foundation Systems for High-Rise Structures; CRC Press: Boca Raton, FL, USA, 2016; pp. 154–196. [Google Scholar]
  27. Shehata, H.F.; EI-Zahaby, K.M. New trends in foundation design using the finite element analysis method. In Proceedings of the 4th Geo-China International Conference, Jinan, China, 25–27 July 2016. [Google Scholar]
  28. Dickenson, S.E. Dynamic Response of Soft and Deep Cohesive Soils during the Loma Prieta Earthquake of October 17, 1989. Ph.D. Thesis, University of California, Berkeley, CA, USA, 1994. [Google Scholar]
  29. Ashford, S.A.; Jakrapiyanun, W.; Lukkunaprasit, P. Amplification of earthquake ground motion in Bangkok. In Proceedings of the 12th World Conference on Earthquake Engineering, Auckland, New Zealand, 30 January–4 February 2000. [Google Scholar]
  30. Hatanaka, M.; Uchida, A. Empirical correlation between penetration resistance and internal friction angle of sandy soils. Soil Found. 1996, 36, 1–9. [Google Scholar] [CrossRef] [Green Version]
  31. Ministry of the Inderior. Seismic Design Code for Buildings; Construction and Planning Agency, Ministry of the Interior: Taipei, Taiwan, 2011. (In Chinese)
  32. Midas. Midas GTS NX User Manual; Midas Ltd., Co.: Tokyo, Japan, 2017. [Google Scholar]
  33. Chang, D.-W.; Lien, H.-W.; Wang, T. Finite difference analysis of vertically loaded raft foundation based on the plate theory with boundary concern. J. GeoEngineering 2018, 13, 135–147. [Google Scholar]
  34. Chang, D.-W.; Lien, H.-W.; Hu, G.-Y.; Chuang, Y.-A. Developing a three dimensional finite-difference analysis for piled raft foundation settlements under vertical loads. In Proceedings of the 4th International Conference on Deep Foundations, Santa Cruz, Bolivia, 23–24 May 2019. [Google Scholar]
  35. Ryltenius, A. FEM Modeling of Piled Raft Foundations in Two and Three Dimensions. Master’s Thesis, Lund University, Lund, Sweden, 2011. [Google Scholar]
  36. Vu, A.; Pham, D.; Nguyen, Y.; He, Y. 3D finite element analysis on behaviour of piled raft foundations. Appl. Mech. Mater. 2014, 580–583, 3–8. [Google Scholar] [CrossRef]
Figure 1. Assumed distributions of foundation settlements and contact pressures for structural design analysis of foundations.
Applsci 12 05484 g001
Figure 2. FE mesh used in this study.
Applsci 12 05484 g002
Figure 3. Validations of the Midas analysis: (a) comparison with Plaxis analysis on linearly elastic soils; (b) comparison with FD analysis on strain hardening clay.
Applsci 12 05484 g003
Figure 4. Solution convergence on FE analytic zone in this study.
Applsci 12 05484 g004
Figure 5. Foundation settlements obtained for square raft foundations with different dimensions: (a) 16 m, (b) 26 m, (c) 36 m in clays; (d) 16 m, (e) 26 m, (f) 36 m in sands.
Applsci 12 05484 g005
Figure 6. Contact pressure under square raft foundations with different dimensions: (a) 16 m, (b) 26 m, (c) 36 m in clays; (d) 16 m, (e) 26 m, (f) 36 m in sands.
Applsci 12 05484 g006
Figure 7. Coefficient of subgrade reactions for square raft foundations with different dimensions: (a) 16 m, (b) 26 m, (c) 36 m in clays; (d) 16 m, (e) 26 m, (f) 36 m in sands.
Applsci 12 05484 g007
Figure 8. Normalized function for coefficients of subgrade reactions, ks of raft foundations with different dimensions: (a) 16 m, (b) 26 m, (c) 36 m in clays; (d) 16 m, (e) 26 m, (f) 36 m in sands.
Applsci 12 05484 g008
Figure 9. Comparisons of the coefficient of subgrade reaction ksc at the foundation center from this study and those from Lysmer’s model varying with foundation dimensions: (a) rafts in clays, (b) rafts in sands.
Applsci 12 05484 g009
Figure 10. Comparisons of the coefficient of subgrade reaction ksc at the foundation center from this study and those from Lysmer’s model varying with foundation rigidity: (a) raft in clays, (b) raft in sands.
Applsci 12 05484 g010
Figure 11. Interpolation function of the coefficient of subgrade reaction ksc at the foundation center based on the shear wave velocity of soils: (a) rafts in clays, (b) rafts in sands.
Applsci 12 05484 g011
Table 1. Parameters of the numerical model.
ParametersValue
SoilsShear wave velocity, Vs (m/s)120, 150, 180
Unit weight, γs (kN/m3)20
Poisson’s ratio, υ 0.4 for clays, 0.3 for sands
Calculated Young’s modulus,
E (MPa), where E = 2G ( 1 + υ ),
G = Vs2ρs, ρs is the mass density
of soil = γs/g, g = 9.81 m/s2
82, 128, 185 for clays
76, 119, 171 for sands
Calculated strength parameters
Vs = 23 su0.475 (Refs. [28,29])
φ′ = 3.5(N)0.5 + 22 (Ref. [30]) and
Vs = 80(N)0.33 (Ref. [31]),
where N is SPT-N value
The undrained shear strengths, Su for clays = 32, 52, 76 kPa
The drained internal friction angles,
ϕ for sands = 28°, 31°, 34°
FoundationLength, L (m) (L = B)16, 26, 36
Width, B (m) (B = L)16, 26, 36
Thickness, d (m)1
Unit weight, γ (kN/m3)24
Poisson’s ratio υ b 0.13
Young’s modulus, Eb (GPa)30
Applied LoadUniform load with intensity, q (kPa)264, 100, and 52 for raft with dimensions of 16 m, 26 m, and 36 m
Table 2. Rigidity factor Kr of the model foundation in this study.
Size
(L = B)
The Relative Stiffness of a Raft Foundation (Kr)
Clay 1Clay 2Clay 3Sand 1Sand 2Sand 3
16 m0.08910.05700.03960.09590.06140.0426
26 m0.02070.01330.00920.02240.01430.0099
36 m0.00780.00500.00350.00840.00540.0037
Table 3. The coefficients of subgrade reactions obtained at the center of the foundation.
Size
(L = B)
The Coefficients of Subgrade Reactions at the Center of the Foundation (ksc)
Clay 1Clay 2Clay 3Sand 1Sand 2Sand 3
16 m1186220178775281879313,075
26 m1379373280784948782411,262
36 m1768398374565025780811,278
Table 4. The suggested functions of coefficient of subgrade reaction at the center of the foundation based on shear wave velocity of the soil.
Soilksc (Units in kN/m/m2)Vs (Units in m/s)
Clayksc = 0.9956(Vs)2 − 190.378Vs + 9888.4120 ≤ Vs ≤ 180
Sandksc = 0.3721(Vs)2 − 7.6883Vs + 588.467
Table 5. The normalized function f(x) for the coefficient of subgrade reaction.
Lf(x) Where 0 ≤ xL/2 (Unit of x: m)
Sand 1~Sand 3Clay 1Clay 2Clay 3
16 m0.00534x2 + 0.9662,
r2 = 0.954
−0.0001x4 + 0.00555x2+ 0.9924,
r2 = 0.967
−0.000096x4 + 0.0049x2+ 0.9905,
r2 = 0.979
−0.000026x4 + 0.00167x2+ 0.9992,
r2 = 0.938
26 m0.00172x2 + 0.9758,
r2 = 0.963
0.00131x2 + 1.0054,
r2 = 0.962
0.002255x2 + 0.9788,
r2 = 0.983
0.000944x2 + 0.992,
r2 = 0.955
36 m0.00091x2 + 0.9883,
r2 = 0.978
0.0014x2 + 0.9709,
r2 = 0.978
0.00108x2 + 0.9897,
r2 = 0.985
0.00065x2 + 1.0037,
r2 = 0.995
Publisher’s Note: MDPI stays neutral with regard to jurisdictional claims in published maps and institutional affiliations.

