Article

The Flow Resistance of the Filter Bags in the Dust Collector Operating in the Line of Wood-Based Furniture Panels Edge Banding

1
Department of Furniture Design, Faculty of Wood Technology, Poznań University of Life Sciences, 60-627 Poznań, Poland
2
Department of Technology, Faculty of Natural Sciences, Matej Bel University, 974 01 Banská Bystrica, Slovakia
3
Department of Woodworking, Faculty of Wood Science and Technology, Technical University in Zvolen, 960 01 Zvolen, Slovakia
*
Author to whom correspondence should be addressed.
Appl. Sci. 2022, 12(11), 5580; https://doi.org/10.3390/app12115580
Submission received: 18 May 2022 / Revised: 28 May 2022 / Accepted: 28 May 2022 / Published: 31 May 2022
(This article belongs to the Special Issue Application of Wood Composites III)

Abstract

:
The article describes the process of forming the wood dust filtration resistance generated during furniture production using the honeycomb board technology in a filtering installation operating in industrial conditions. The influence of the service life of the filter fabric on the filtration resistance values in industrial conditions for one installation and one type of filter fabric was analyzed. For this purpose, filter bags made of one type of filter material were used in an industrial filtering installation at four different times. The results were compared to those previously obtained at the same factory but with a different filter bag type. The analysis was based on the changes in the flow resistance of clean and dust-laden air through the filter fabric used at various times in the filtering installation of the narrow-surface treatment line in a furniture factory. This allowed for the determination of the dynamics and nature of changes in filtration resistance in industrial conditions for wood dust. The values of the dust resistance coefficient depend on the operating time and increased to the level of 20594 [s−1] for material A and from 6412.031 [s−1] to 10128.94 [s−1] for material B. The dimensional characteristics of the filtered dust and the technological conditions under which it was generated were also described.

1. Introduction

The working environment inside the production rooms of the wood industry is associated with the presence of wood dust, which is not indifferent to the health of employees [1,2]. There, wood dust is an inseparable element of the work environment because it is generated during wood processing. Its properties depend not only on the type of wood processed but also on the tools used [3]. The applicable standards of the minimum permissible dust concentration are, according to current studies, too high, and continue to expose workers to diseases of the upper respiratory tract [4]. Among people exposed to the influence of wood dust, the risk of adenocarcinoma of the mucosa and paranasal sinuses among plant employees furniture industry is approximately 500 times larger than in the general population. Soćko, et al. [5] propose lowering the permissible value of the threshold limit value TLV to 2 mg·m−3 for a fraction of inhalable wood dust regardless of the type of wood. According to the EU directive [6], all Member States should introduce this value into national legislation by 17 January 2023. Currently, care for clean air seems to be a priority issue. The amount of PM10 and PM 2.5 dust emissions from industrial sources in Poland has steadily increased since 2005. Poland is at the forefront of the European Union regarding urban population exposure to air polluted with PM2.5 and PM10 dust. The highest values for both types of dust were recorded in 2017 in Central Europe (Poland, Bulgaria, Croatia, Slovenia, Romania, and Hungary) and in Italy [7]. Wood dust suspended in the air poses a health hazard to workers [1,6,8,9,10,11]. In addition, when processing wood materials such as MDF boards, we deal with formaldehyde used in their production, mostly free formaldehyde in the adhesives and the formaldehyde emission from the finished wood composites, which is carcinogenic to humans and harmful to the environment [12,13]. Therefore, the critical issue to pay special attention to is the possibility of air cleaning from wood dust. Studies have shown that using a properly operating dedusting installation reduces workers’ exposure to wood dust by almost eleven times compared to when dedusting is not used [14]. This will contribute directly to reducing the harmful effects of dust on the human body and the risk of fire or explosion. This risk occurs for various concentrations and sizes of airborne dust particles, but according to research [15], the most dangerous concentration is 0.73 g·dm3 for particles in the size range of 25 to 45 µm. The filtration of wood dust from the air and the benefits for human health and safety are also helpful for the industrial use of dust in the energy industry [16,17] or in the production of filaments for 3D printing [18,19]. To do this effectively, it is necessary to understand the phenomena occurring during filtration in industrial conditions and the factors influencing the course of this process. Despite the enormous development of filtration techniques, manifested both in the development of the construction of all kinds of particle-separation devices (cyclones and filters) and in the design and development of filtration nonwovens, many questions regarding the filtration process remain unanswered. The current state of knowledge about the phenomena occurring during filtration and the factors determining it is based on laboratory tests carried out in small-scale devices and limited research possibilities [20]. The limited scale of laboratory equipment and the aging tests of filtering nonwovens according to specific rules [21,22], aimed at simulating the use process in industrial conditions, are burdened with a certain error resulting from imprecise simulations of real conditions [23]. These studies focused on studying the impact of the type of non-woven fabric used on its effects [20,24,25,26,27]. In some cases, the influence of the operating time of filtering nonwovens on their functional properties was also investigated [26]. The differences obtained as a result of computational analysis and as a result of laboratory experiments generate the need to investigate the phenomena occurring during dust filtration in real conditions. There are no results describing the filtration process for materials operating in industrial conditions. To investigate the phenomena occurring during filtering air purification from wood dust, one should refer to the actual filtration conditions encountered in furniture factories, where industrial-scale filtration devices are used to separate this type of dust. Only the actual conditions of using the filter materials give the appropriate test samples that will allow for describing the filtration time and the type and amount of the separated dust on the filter effect. Therefore, for this purpose, it is essential to obtain filter bags from wood dust filters used in a furniture factory and to make laboratory samples from them, which, in later tests, will allow for determining the nature of the process of shaping filtration resistance and the efficiency of dust separation during long-term use of filter materials. The results obtained in this way have the highest application value and can be used when selecting the operating parameters of the filtering installations.
The work aims to study the influence of the long-term operation time of filter bags on filtration resistance in an industrial filtering installation in a furniture factory and compare them with the previously achieved test results. The test results will allow for a comparative analysis of the work of filter bags made of various nonwovens in the filter in one production line.

2. Materials and Methods

2.1. Place and Conditions of Conditioned Filter Materials

According to the long service life of the said bags, a factory with an extensive production scale and a three-shift system of work was selected for testing—IKEA Industry in Lubawa (Poland). This factory is characterized by a very large scale of production and a high degree of automation. It produces furniture made of particleboard, MDF, HDF, and honeycomb paper filling. The size of the factory is nearly 420,000 m2 of space (including 150,000 m2 of roofed area) and approximately 1500 employees. Due to the scale of the enterprise, it has several filtering installations operating in various technological lines, which gives a wide field for research on the filtration process. The narrow-surfaces processing lines were selected for the study.
During production in the technological lines, the furniture element undergoes two-stage processing of narrow surfaces. In the first phase, cutting and veneering occur at a feed speed of 35 m·min−1, and in the second phase, they occur at 15 m·min−1. Both stages use circular saws and cutters to process the excess natural veneer, standotron, or ABS edge band.
A filtering installation for two processing lines for narrow surfaces of furniture board elements with a JKF SBF-140-5.0S-1A filter (Berzyna, Poland) was selected for the tests. To obtain samples, the filter was equipped with FP-PB400PS2 polyester bags by Filtrapol (Łódź, Poland), marked in the text as material A. Using one type of bag in the installation allowed for effective observation of phenomena occurring during filtration, in different periods of non-woven use.

2.2. Lines for Processing Narrow Surfaces of Furniture Panels

The production lines are used for formatting and veneering narrow surfaces of elements made of furniture boards. Chips and dust are produced by sawing particleboard, fiberboard, or solid wood with saws. Depending on the production technology, saws can cut double elements into two separate ones, which, in the next step, are also formatted with saws by cutting the edge of the element frame. The machining surplus is selected so that no waste is produced due to the operation. The entire material to be cut (approx. 2 to 3 mm wide) is converted into chips and transported to the filter via a filtering installation. At a later stage, after veneering narrow surfaces, the excess veneer is cut off using cutters. Due to the processing possibilities, the factory uses two lines for processing narrow surfaces: A double-sided line for formatting and veneering boards and a one-sided line for processing and narrow veneering surfaces in elements such as bed connects, which, due to their narrow width, cannot be processed on a double-sided line. The technological scheme of the narrow-surface treatment line is presented in a previous paper [28].
The basic size properties of the dust were determined by examining the proportion of individual fractions using the sieve analysis method. The determination was carried out using a Retsch AS 200 shaker (Haan, Germany). Sieves with mesh sizes of 0.032, 0.063, 0.125, 0.250, 0.500, and 1000 mm were used in the analysis. The particle size distribution is presented in Figure 1.

2.3. Dust Extraction Installation, Filter, and Filter Material

The dust extraction installation consists of main no. 1 and auxiliary no. 2, respectively, serving two-sided and one-way lines (Table 1). When working in an industrial installation, the bags were loaded with dust generated during the processing of narrow surfaces. Both narrow-surface treatment lines (two-sided and one-sided) are dedusted using one filter baghouse with 140 bags (Table 2). The diagram of the construction of the filter and the installation is presented in the previous paper [28].
Bags described in Table 3 were installed in the filter baghouse with the intention to disassemble them at specified intervals. After disassembly, the bags were analyzed in the laboratory regarding airflow resistance through the clean bag and resistance during filtration of the test dust. Bags made of material A, new and working for 85, 146, 275, and 382 days, were tested. The obtained results were compared with the results of the Gutsche bag examination, marked in the text as material B, described in an earlier publication [28].

2.4. Test Stand

The filter bags used in the furniture factory were tested to determine the airflow resistance using the pilot-scale test stand for the phenomena of the filtration processes (Figure 2). The technical capabilities of the stand allow for the determination of the basic operational properties of the bags in conditions similar to the real ones prevailing in industrial filters. The equipment of the stand allows for creating the test conditions of individual devices, measurement, and control systems included in its composition:
  • Dust dosing system.
  • Regulating valve to regulate the volumetric output of the fan of the main air circulation.
  • A system that controls the frequency of cleaning pulses.
To register the basic quantities related to the filtration process, installed measuring systems allow one to determine:
  • Airflow resistance.
  • Airflow rate in the entire measuring system.

2.5. Dust Used in Tests

After the end of the assumed period of work in the industrial sector, the bags were tested using standard test dust. We used the beech dust obtained from wood processing in a bent furniture factory. This dust was used in previous studies, and its properties were presented in the works [28,29]. Particles with the size of 0.063–0.125 and 0.032–0.063 µm had the largest share of this dust.

2.6. Airflow Resistance

To thoroughly investigate the phenomenon of shaping the airflow resistance through the filter layer, we first needed to determine the airflow resistance through the non-dust-loaded non-woven fabric. To this end, clean air was passed through the filter material at a gradually changing velocity. By gradually changing the position of the regulation valve, the flow rate was changed, which caused changes in the filtration velocity during the experiment, and the flow resistance was determined at various airflow rates. These velocities gradually increased and gradually decreased in the second part of the experiment. This made it possible to determine the airflow resistance through the filter material not loaded with dust (Δp0). Based on the results of this experiment, the K0 coefficient of clean material resistance was calculated, which is a constant value characteristic for given filter material. This coefficient is also a linear coefficient of the function of resistance dependence on the filtration velocity. These dependencies are described by formulas (1) and (2).
∆p0 = K0wf,
where:
  • ∆p0—resistance of clean filter fabric.
  • K0—clean bag filtration resistance coefficient, which is a linear coefficient of the function describing the evolution of the clean bag filtration resistance, shown in the diagram.
  • wf—filtration velocity m·s−1.
We, therefore, determine coefficient k0 from dependencies:
K0 = Δp0/wf,
Determining the resistances of the dust-free filter materials is necessary to determine the resistances of the dust layer, which ultimately allows the calculation of the dust resistance coefficient K2. After determining the resistance to clean airflow through the filter layer, wood dust was added to the experimental stand air circulation. For this purpose, a dust feeder and a regeneration impulse control system were launched. The test was carried out under strictly controlled conditions described in Table 4.
During the tests of the filtration process, measurements of the maximum airflow resistance before the regeneration impulse were made. The regeneration pulses entering the filter bag through the blowing nozzle were supplied with compressed air at a pressure of 0.5 MPa and occurred at five-minute intervals. This allowed for drawing a curve for shaping the airflow resistance during the experiment. Based on individual curves’ regression equations, the maximum airflow resistance value in the final phase of the study Δpc was calculated. The results obtained during the study were prepared in the form of graphs.
Obtaining the value of the resistance of the dust-free filter material Δp0 and the total resistance during the filtration process, Δpc, made it possible to calculate the resistance of the dust layer Δpp accumulated on the filter material. It was calculated based on formulas (3) and (4). Since Δpc is the sum of the material resistance and the dust layer resistance:
∆pc = ∆p0 + ∆pp,
where:
  • ∆pc—the maximum airflow resistance for 250 minutes of testing calculated from the equations for the individual bags.
  • ∆pp—the resistance of the dust layer.
  • ∆p0—the resistance of clean filter fabric.
The dust layer resistance can be easily calculated based on the measurement results Δpc and Δp0:
∆pp = ∆pc − ∆p0,
By calculation, the airflow resistance through the dust layer depends on the filtration velocity wf, the dust load s, and the dust resistance coefficient K2 according to Equation (5) [30,31,32]. After transforming this formula, we obtain formula (6) to calculate the dust resistance coefficient K2. The dust load on the bag necessary to calculate the value of the K2 coefficient was determined by Equation (7)
∆pp = wfsK2,
where:
  • wf—filtration velocity.
  • K2—the dust resistance coefficient.
  • S—dust deposit areal density.
K2 = ∆pp/wfs,
The dust load s, which is necessary to calculate the value of the K2 coefficient, was determined by relationship (7):
s = wf·c·t,
where:
  • s—dust deposit areal density g·m−2.
  • c—the dust concentration at the test stand inlet g·m−3.
  • t—the time between cleaning pulses t = 300 s.

3. Results and Analyses

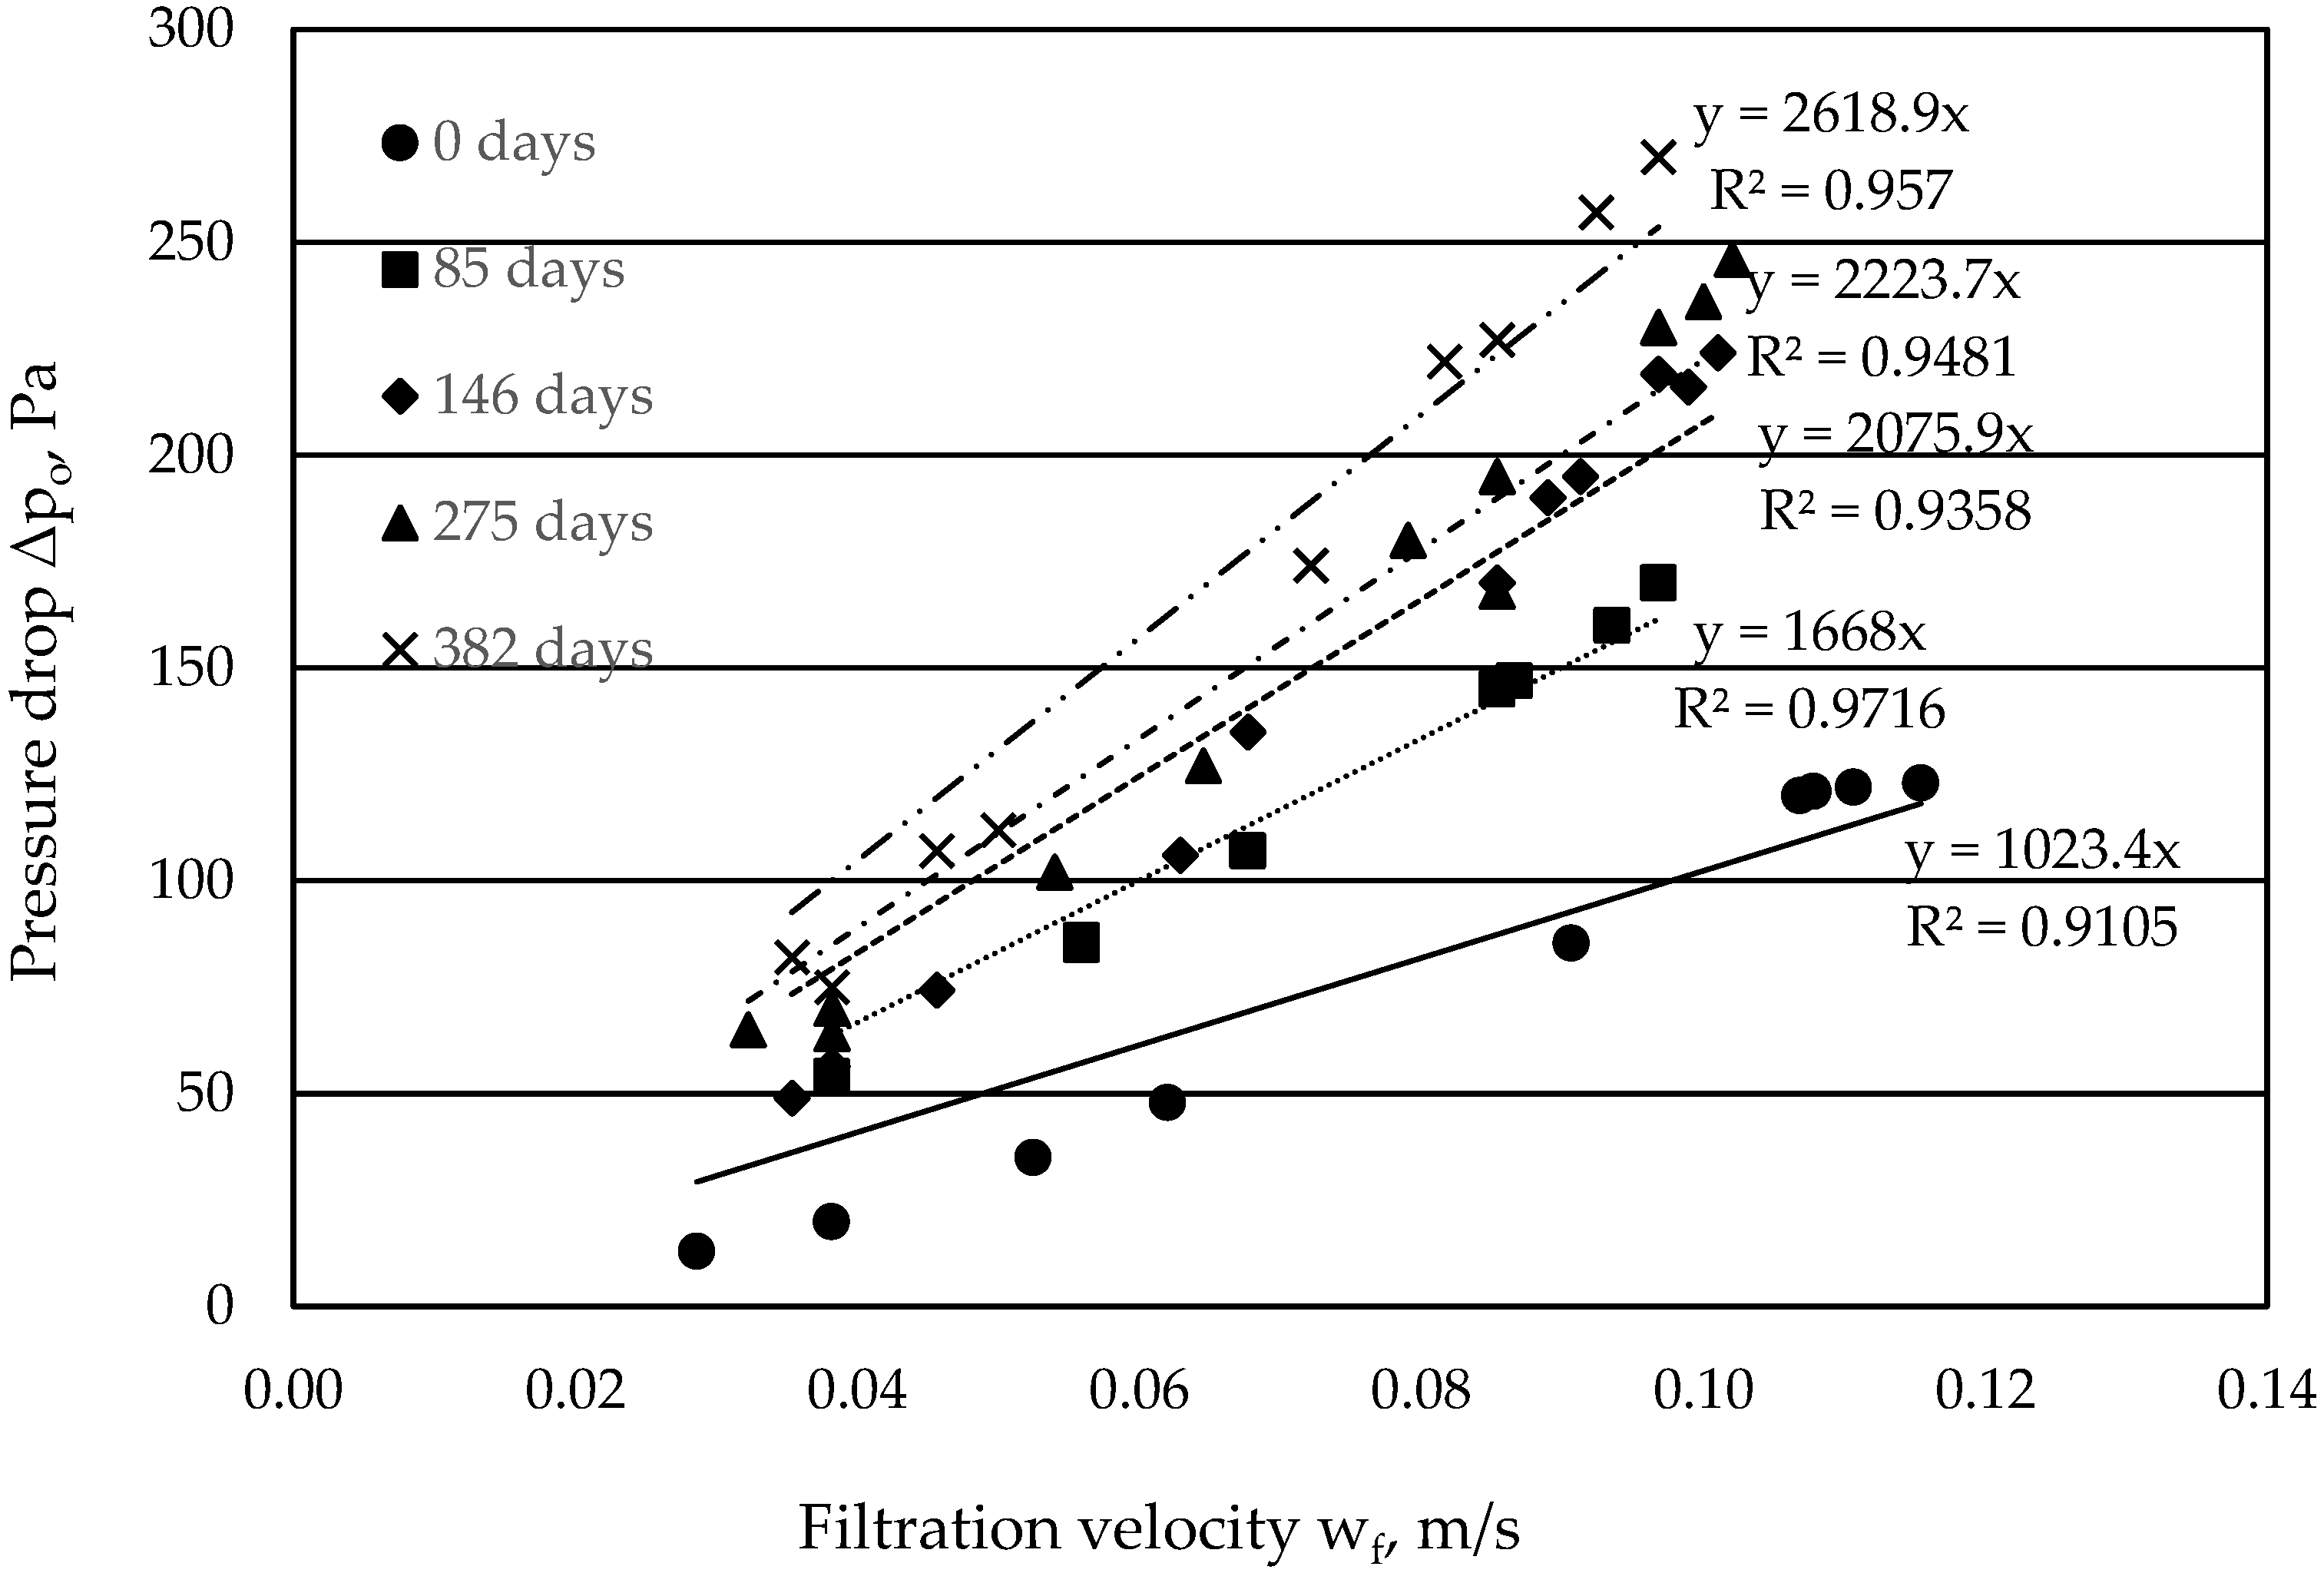
Figure 3 shows the formation of airflow resistance through the dust-free filter material. Using the functions indicated in the diagram, the resistance value of the clean filter material for a new bag Δp0 was calculated based on formulas no. 1 and 2 for a specific filtration speed of 0.0405 m·s−1, which was used in the test filtration processes. This resistance was 41.448 Pa. On the other hand, the value of the K0 coefficient, which is the slope of the equation for the appropriate working time of the bag, was read from the graph for the bag that was not used before and was 1023.4 Pa·s·m−1, while for the load used for 382 days, it is as much as 2618.9 Pa·s·m−1.
Analyzing the above graph (Figure 3), it can be stated that with the increasing service life of the bags, the value of the resistance to the flow of clean air through the non-woven fabric increases. This is due to the growing penetration of wood dust inside the filter material. Comparing the obtained results, the resistance values Δp0, and the K0 coefficient, we note that for bags from the same production line, they are lower than those obtained when testing the nonwoven fabric made of material B, for which the results are described in a previous paper [28], which shows that the resistance values are dependent on the type of non-woven fabric used.
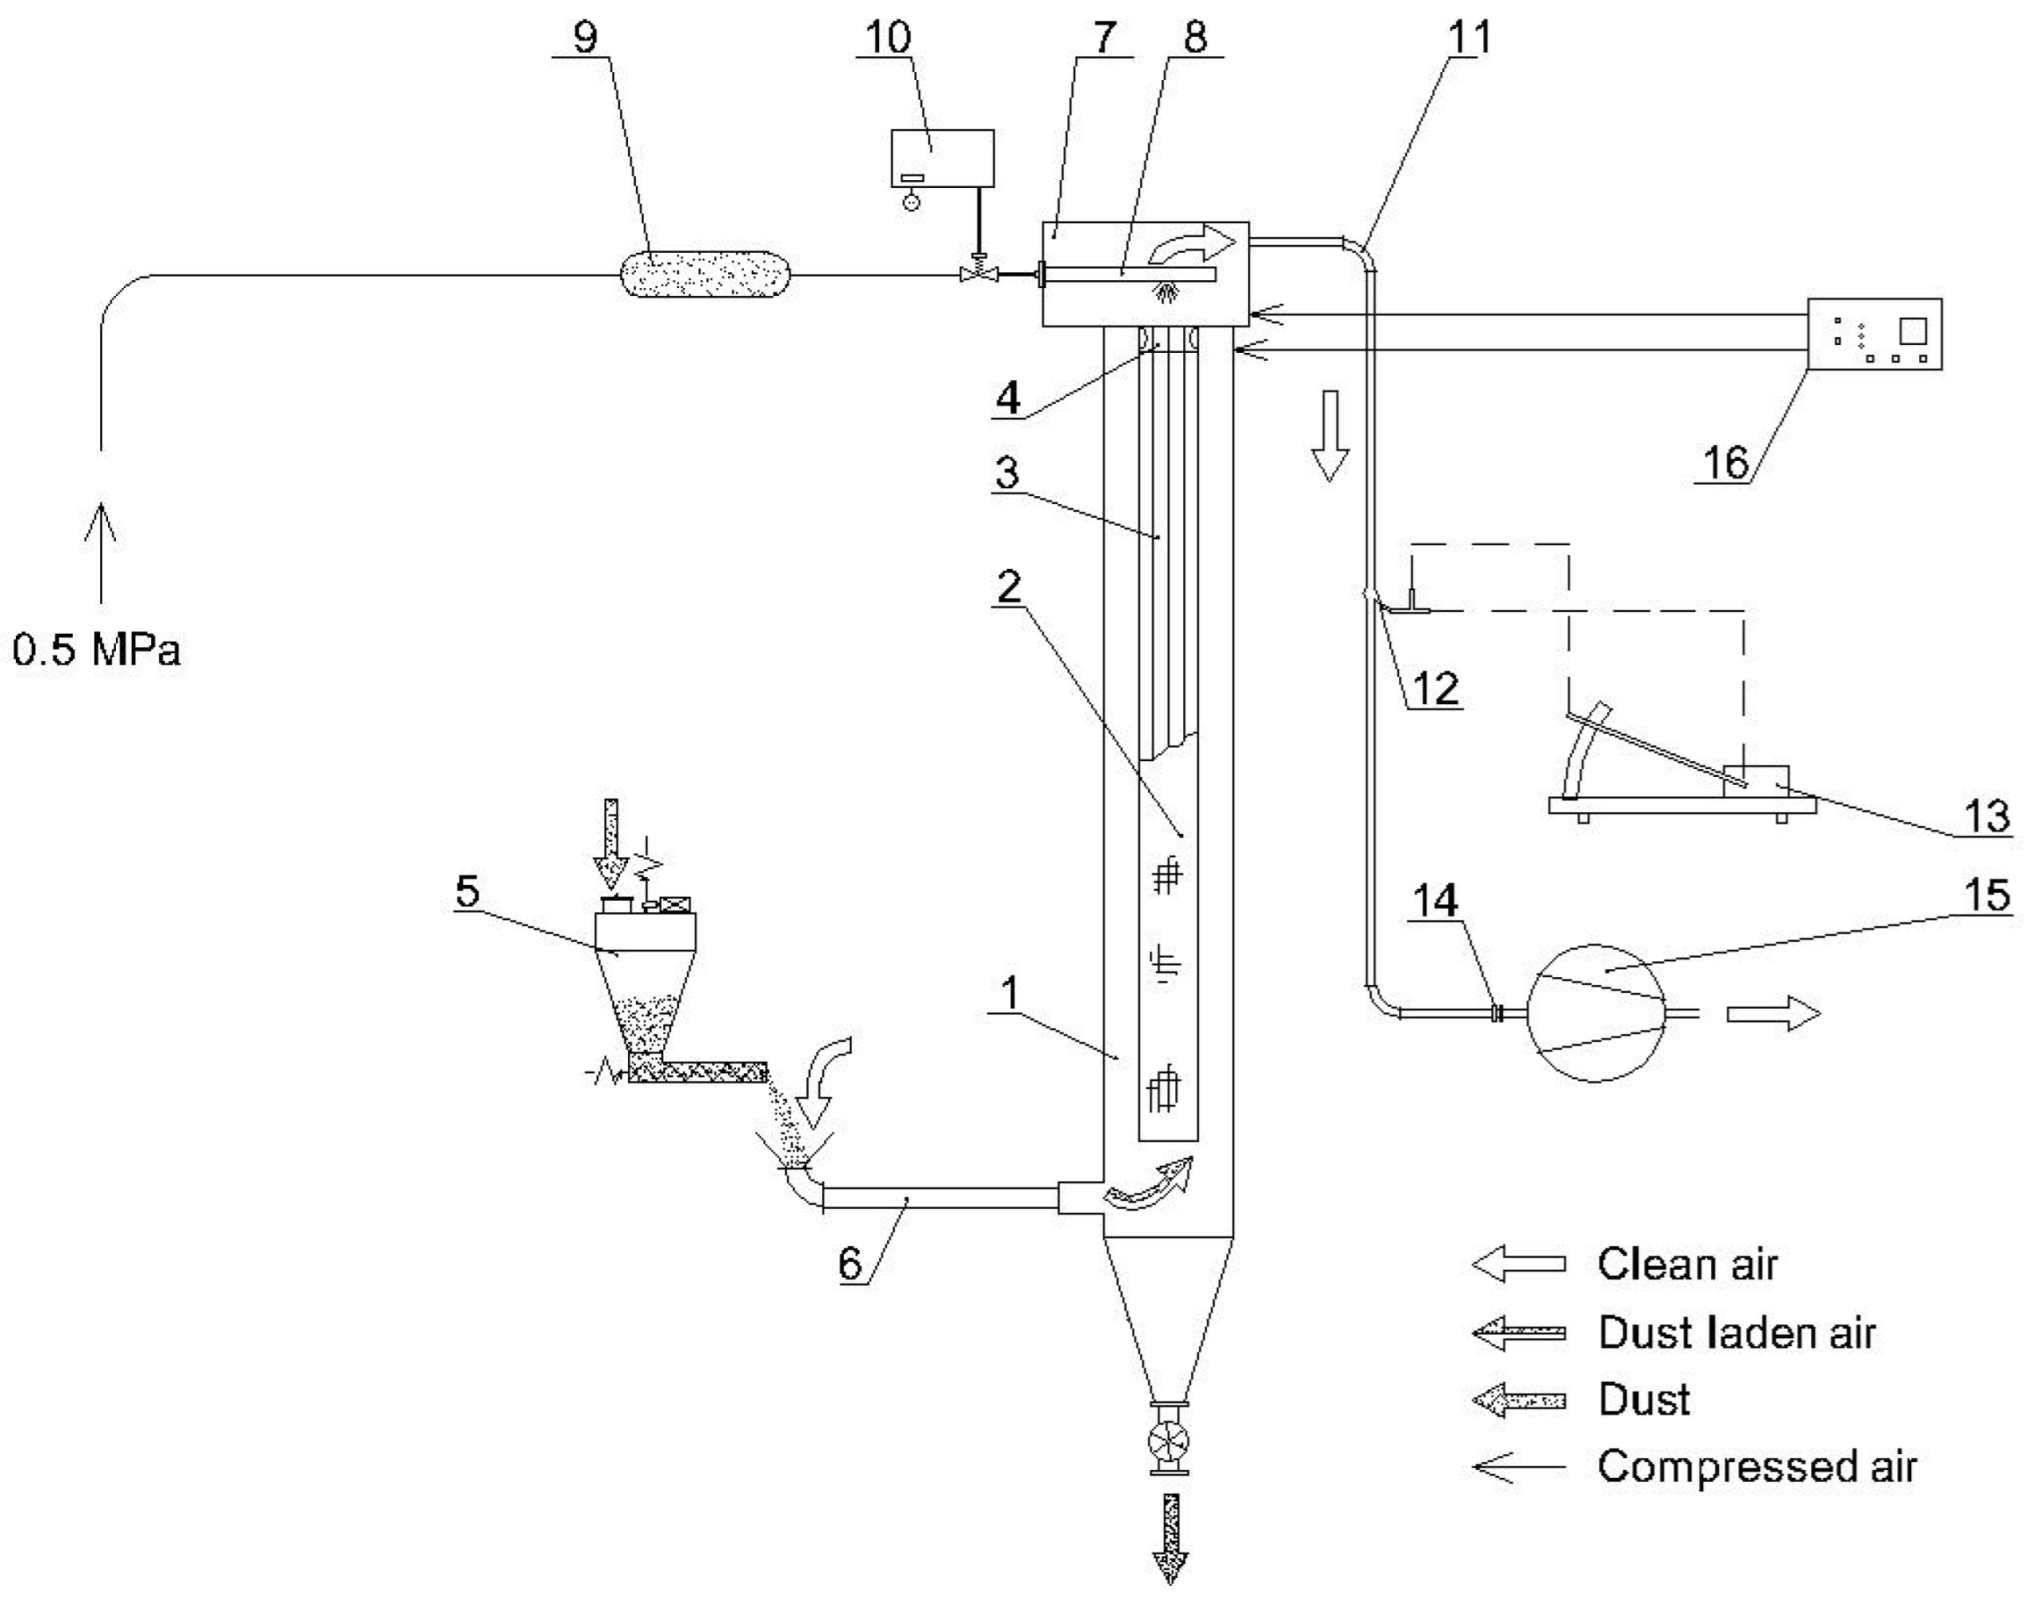
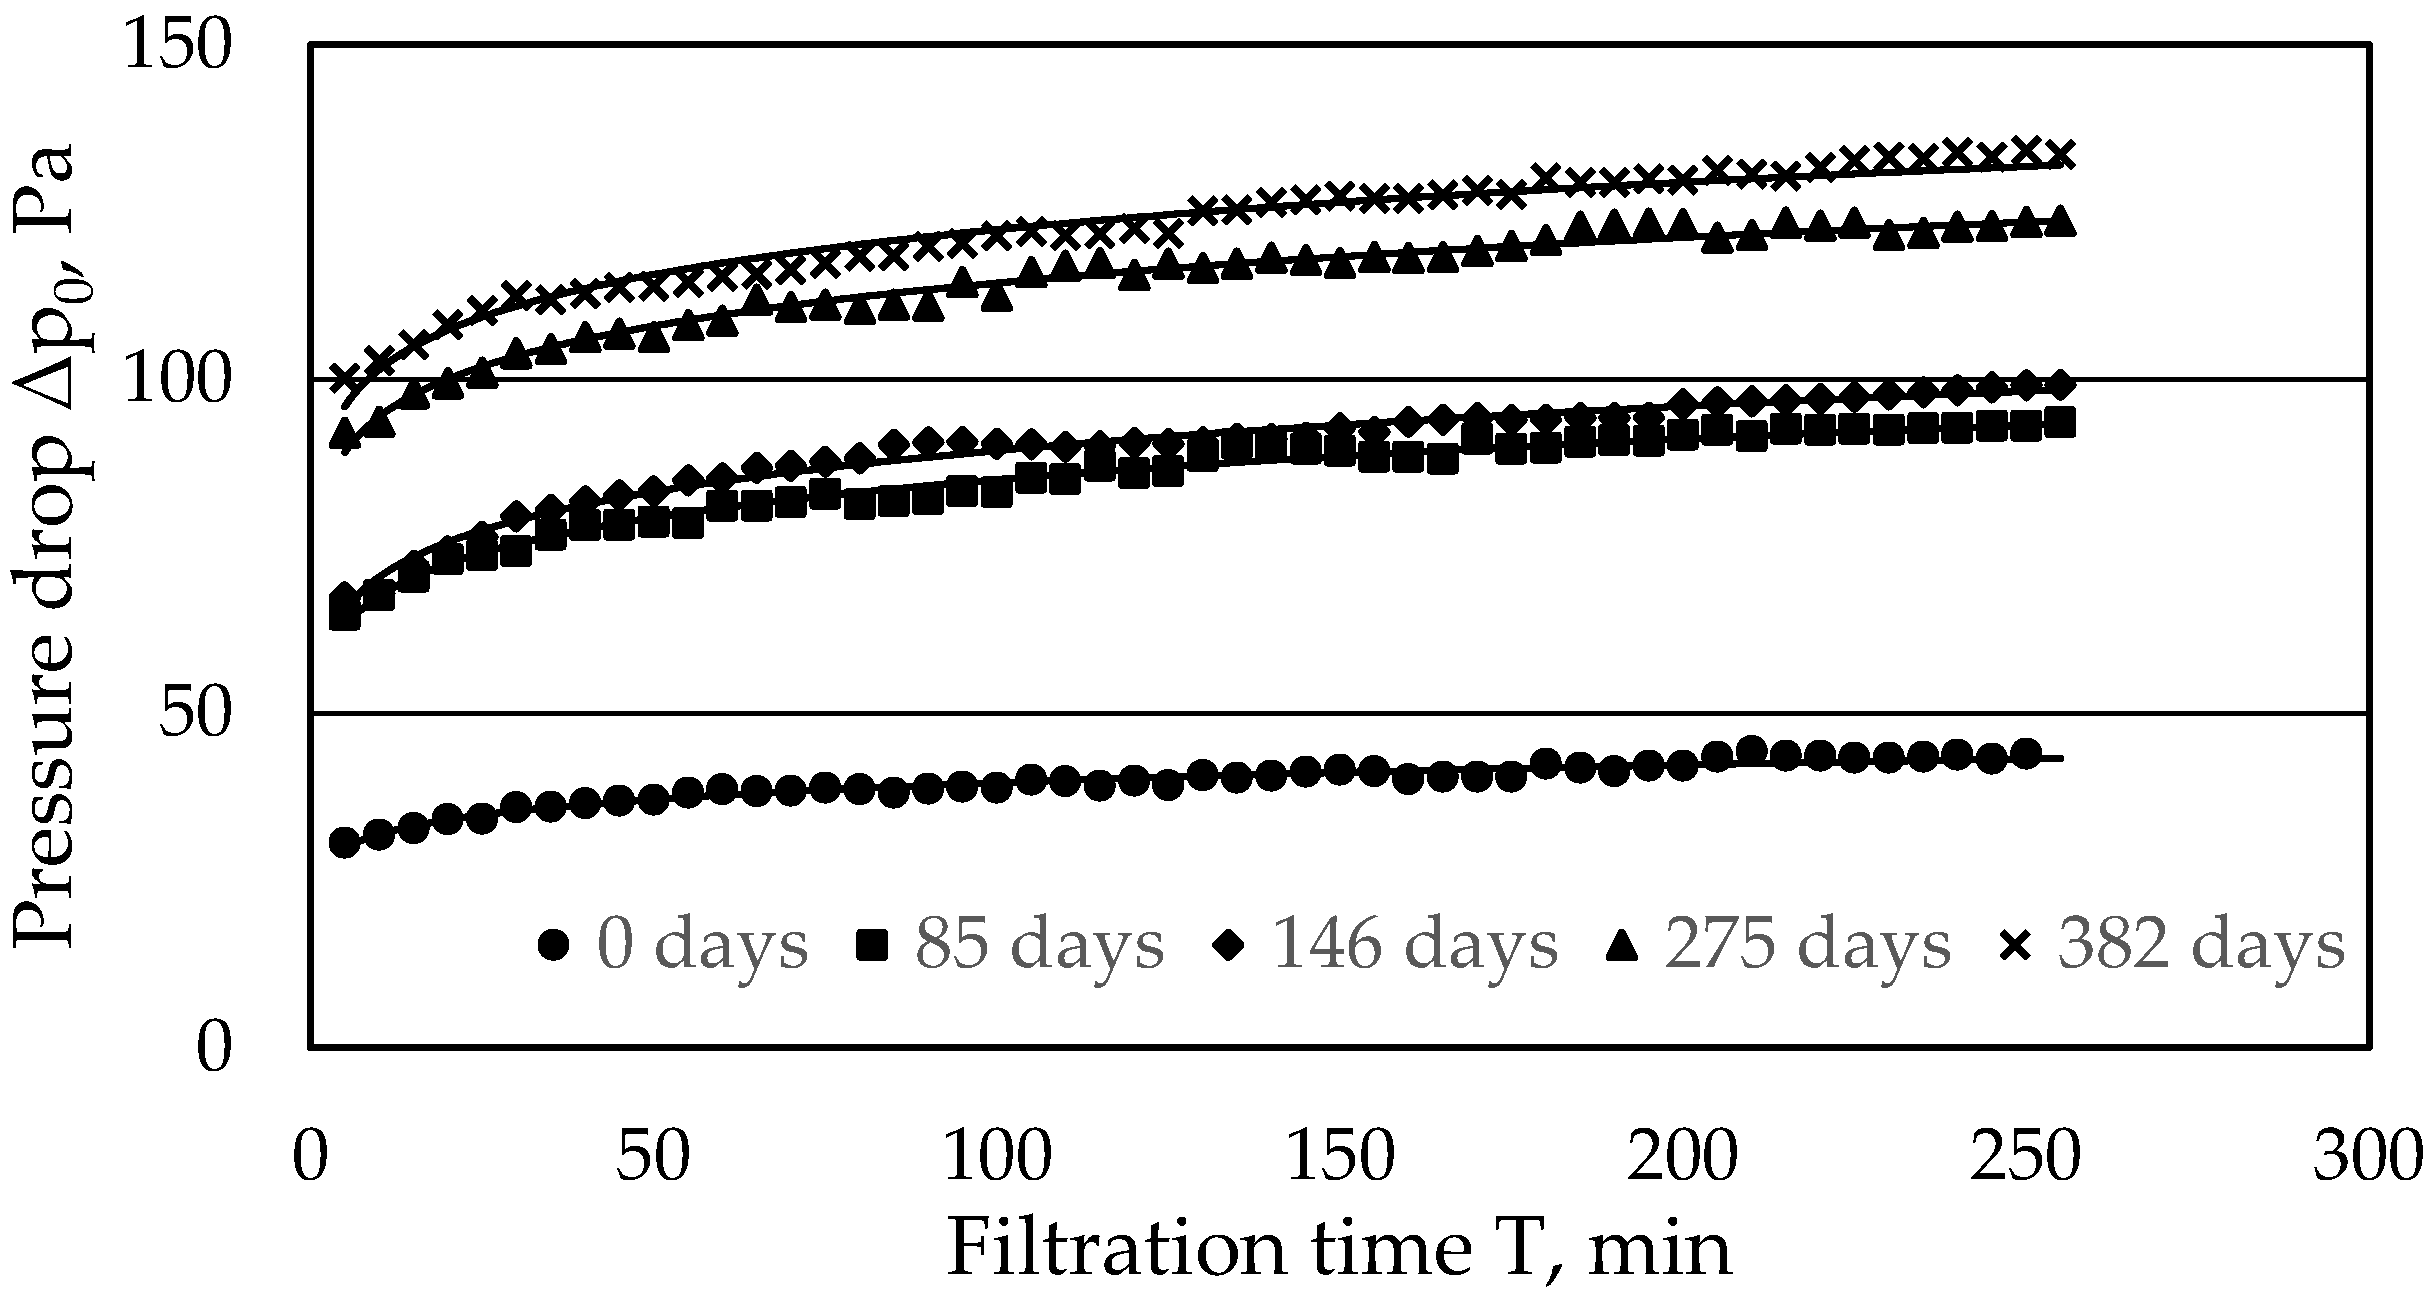
The next test stage was to test the resistance during the filtration of air dusted with standard wood dust. As the duration of the test increased, the flow resistance increased. At the beginning of the study, there was a significant increase in resistance. After some time, the increase in resistance slowed down, showing slight increases at the end of the test process. The formation of the resistance for filter bags operating at different times in an industrial installation is shown in Figure 4.
When analyzing the data presented in the diagram, it is easy to note the increasing value of the filtration resistance depending on the time the bags are used in the filtering dust collector. Comparing the obtained results with previous studies [28], for a similar period of operation (272 days for material B and 275 days for material A), we can see that material A obtained filtration resistance approximately 20% higher than material B, with 123.4 Pa for material A and 101.52 Pa for material B. Similar characteristics of changes in filtration resistance were obtained by Xingcheng Liu, Henggen Shen, and Xueli Nie [33] while examining PE and PTFE nonwovens coated with a membrane. They tested five types of nonwovens in terms of filtration resistance depending on the porosity of the nonwoven fabric and the thickness of the fiber.
The values of the total resistance Δpc for the particular periods of use of the bags in the industrial installation after the end of the experiment covering 50 filtration cycles on the experimental stand were determined using the regression equations. The equations and the values of Δpc are presented in Table 5 and are compared with the values obtained in the tests of bags made of material B [28].
Based on the obtained results and using formula (6), the value of the K2 dust resistance coefficient for material A was calculated. The K2 coefficient for material B was calculated earlier [28]. For clarity, Table 6 also presents the results obtained in [28] for material B from the same dust extraction installation.
The results shown in Figure 5 indicate different shapes of the K2 coefficient under the same conditions of use, depending on the type of filter material used. In the case of material B, from 0 to 272 days, it increased from 6412.031 s−1 to 10,128.94 s−1, and its increase was close to linear. The K2 dust layer resistance coefficient for material A was slightly different. However, the overall resistance systematically increased. The K2 coefficient for material A increased from 0 to 275 days at a level of 240 to 18635. The extension of the service life to 382 days increased the K2 coefficient to the level of 20,594 s−1. The differences in the physical properties of nonwovens are noteworthy. The properties of the non-woven fabric made of material A are described in Table 3. In the previously tested non-woven fabric made of material B [28], we can note its much lower tensile strength values along (40 da·N·5cm−1) and across (50 da·N·5cm−1) and higher air permeability (250 dm3min−1dm−2).
The obtained results indicate that the type of filter material used plays a vital role among the factors influencing the filtration resistance in a dedusting installation. For the tested installation, bags made of material B are characterized by lower values of the dust resistance coefficient during long-term use.
The research on the behavior of various filter nonwovens under the same conditions of use with the same dust has already been the subject of study. M. Saleem, R.U. Khan, M.S. Tahir, and G. Krammer [34] tested three different filter materials: Two nonwovens Polyimide (PI) and Polyphenylensulfide (PPS), a single polymer (PI), and Teflon-laminated (membrane) Polyester needle felt. The nonwovens were tested for the filtration of limestone dust with a density of 2700 kg·m−3. The phenomenon of dust layer formation on the surface of filtration nonwovens was investigated, disregarding filtration resistance. Similar studies with phosphate rock were conducted by E. Tanabe, P. Barros, K. Rodrigues, and M. Aguiar [25]. They investigated issues related to the influence of the filter fabric on the formation of a dust layer. The research consisted of determining the experimental strength of the dust layer adhesion on the surface of various filter materials under the same filtration conditions. Acrylic, polypropylene, and polyester non-woven fabrics were tested. Contrary to our study, it was mineral dust; the filtration conditions also differed and did not apply to the conditions encountered in the furniture factory. The tests used a filtration speed of wf = 10 cm·s−1 and a maximum pressure drop of 980 Pa, followed by a cleaning pulse. The quantity characterizing the pressure drop was thus the time interval between the pulses. The method of cleaning filter bags depending on the pressure drop is, in this case, different from that used in the filter dust collector in a furniture factory, from where the test bags were collected, where the cleaning pulse is applied at equal intervals regardless of the value of the pressure drop. This difference is very important from the point of view of the obtained data and makes it impossible to compare the results. As a result of the experiment, a differentiated mechanism of dust layer formation on the surface of the filter material was established, clearly indicating a significant influence of the type of non-woven fabric used in the course of the filtration process. However, due to the considerable differences between the experimental conditions and the filtration conditions used in the furniture factory, the results of this experiment are not entirely suitable for describing the phenomena occurring during the filtration of wood dust.
Comparing the properties of various filtration nonwovens under the same filtration conditions was the aim of the studies by Jianlong Li, Shihang LI, and Fubao Zhou (2016) [26]. Three types of filtering nonwovens were tested (polyester with a thermally treated surface, a filter with a PTFE membrane, and a filter with a polyester hydrophobic layer) that filter coal dust and operate at various airflow velocities. Among the velocities used, the closest to that used in a furniture factory was 3 cm·s−1. The applied nonwovens had a similar basis weight, from 240 to 260 g·m−2. The airflow resistance through the clean non-woven fabric showed significantly different values for non-woven polyester with a thermally bonded surface of 8.91 Pa·s·cm−1, a filter with a PTFE membrane of 42.57 Pa·s·cm−1, and a filter with a polyester hydrophobic layer of 19.93 Pa·s·cm−1. As a result of the research, a different value of the dust layer resistance during filtration was found, reaching values for the velocity of wf = 3 cm·s−1 and K2 = 1.0 × 10⁻⁸ Pa·s·m−2. It was undoubtedly influenced by different values of initial resistances and air properties.
Because the experiment did not concern wood dust, the results cannot be used to describe phenomena occurring during filtration in furniture factories. The properties of the filter media used were also different. The primary conclusion that should be noted here is that the properties of the dust layer on the surface of the filtering material are differentiated by the value of the adhesion force to the filtering surface, which is different for each type of non-woven fabric. The dust on the polyester non-woven fabric with the thermally treated surface had the highest adhesion value. Earlier studies also showed that during the filtration of wood dust, thermal treatment of the surface of the filter material resulted in lower airflow resistance through the non-woven fabric [29].
The issues related to the influence of the surface finish of the filter fabric on the phenomena occurring during filtration were also the subject of studies by Arunangshu Mukhopadhyay and Harshad S. Bawane (2015) [27]. They focused on comparing the filtration efficiency of polyester filter fabrics with and without a PTFE membrane. The experiment was conducted under the same conditions (dust concentrations of 50 and 150 g·m−3 and wf = 2 m·min−1 (3.33 cm·s−1). A cleaning pulse was applied when the pressure drop reached 1000 Pa. Fly ash was used for the tests during filtration. The research showed better filtration efficiency for both PM2.5 and PM10 particles for fabrics finished with a PTFE membrane, confirming, at the same time, the massive role of filter material selection in the air purification process. Nevertheless, due to the conditions of using bags and the course of the test that differ from the furniture factory conditions, these results cannot be used to describe the phenomena occurring during the filtration of wood dust in industrial conditions.
The variability of the filtration process depending on the type of filter material used was the subject of studies by Mahmood Saleem, Rafi Ullah Khan, M. Suleman Tahir, and Gernot Krammer (2011) [34]. They studied three types of nonwovens (polyimide PI with polyphenylene sulfide PPS, single polyimide PI laminated with a Teflon layer, and a polyester filter) with the participation of limestone dust and a filtration velocity of 5 cm·s−1. The first two nonwovens were heat-treated on the dust side (PI polyimide with polyphenylene sulfide PPS heat-treated dust side, single polyimide PI). Researchers paid particular attention to the formation of a dust layer on the filtering surface. The conducted research showed that the differentiated porosity of the surface of the filtering nonwovens significantly influences the size and strength of the dust layer adhesion. Filter materials subjected to heat treatment or with a membrane were characterized by lower filtration resistance and lower adhesion force of the dust layer, which directly translated into the ease of its removal from the surface.
The operation of thermally treated bags was also analyzed in 2017 by R. Cirqueira, E.H. Tanabe, and M.L. Aguiar [20]. The test was carried out by the VDI 3926 standard, using dolomite limestone dust and polyester filters with surface thermal treatment, calendering with anti-cracking treatment, and without thermal treatment. The surface of the filter bags and the air humidity during the experiment differed from those used in our experiment (humidity 30%, filter area 227 cm2). During the test, the pressure drop (P) on the side of the cleaned air was checked over 50 filtration cycles; the difference between the pulse generation method was that they were activated at a certain pressure drop value and not after five minutes, as was performed in the case of the test of our nonwovens. The filtration velocity during the research was similar to that used in our study and was 4 cm·s−1. By examining the filtration efficiency, researchers concluded that the way the surface is treated has a significant impact on the efficiency of the filtration process. The untreated (NT) material had a porous surface. The calendered filter material (SCT) had a non-uniform surface with a porous and smooth structure. This was due to processing imperfections in which some areas of the nonwoven fabric were not sufficiently calendered. The nonwovens subjected to calendering and additional anti-pilling (SCT-AP) treatment had an almost entirely smooth and uniform filter surface with fewer elements of high porosity. When analyzing the total time of 50 filtration cycles, it was noted that the surface properties influenced the formation of the filtration resistance. The smoother the surface, the higher the resistance and the higher the filtration efficiency.
The impact of various types of dust on the filtration resistance and the development of the K1 and K2 coefficient in given operating conditions were the subject of T. Rogoziński’s research [30] in 2018. Three types of dust (beech, pine, and from a furniture factory) were filtered using the KYS-PROGRES polyester filter material (Remark-KAYSER Polska). The tests were carried out, among others, at the same filtration speed as described in the publication Vf = 0.0405 m·s−1). The author showed that the type of dust used directly affects the airflow resistance through the filter fabric. The relationship between the increase in filtration resistance and the increase in filtration velocity was also shown. For the dust from the furniture factory, the author obtained the values of the filtration resistance (for the same filtration velocity) for the clean non-woven fabric of 21.4 Pa, while in the tests described in the article, this value was 42.6 Pa. These differences should be explained by the different basis weight and properties of the nonwovens used.
In 2017, Ruitian Zhu, Jinwei Zheng, Bingxuan Ni, and Peng Zhang also dealt with the aging of filter nonwovens and their filtration properties [35]. PPS nonwoven tests were carried out by GB/T 5453-1997 using a III air permeability tester (Model FX3300) manufactured by TEXTEST AG (Zurich, Switzerland) with a circular test area of 20 cm2. The particle size was analyzed according to ISO 13320-2009 with a laser particle analyzer (Model HELOS/BR-OM/RODOS) from Sympatec GmbH, Germany, with a dispersion pressure of 4.00 bar. The sample’s morphology was examined using a HITACHI S-3000N (Japan) scanning electron microscope with a voltage of 15 kV and a working distance of 22 mm. Researchers focused on the separation of PM 2.5 particles. For this purpose, the filter material was aged using a four-phase process:
  • Phase 1: Conditioning 30 filtration cycles with bag cleaning with 1000 Pa pulses.
  • Phase 2: Aging of the nonwoven fabric for 2500 cycles using a regeneration pulse with an interval of 20 s each.
  • Phase 3: Stabilization of 10 filtration cycles with differential pressure-controlled pulse cleaning.
  • Phase 4: Measurement of 30 dust loads using a regenerative pulse with a filtration resistance of 1000 Pa.
In addition to showing an increase in filtration resistance with increasing airflow velocity over increasingly shorter periods between regenerative pulses, scientists also demonstrated the ability to filter particles at 99.971% and PM 2.5 particles at an efficiency level of 99.854%.

4. Conclusions

The conducted research allowed us to determine the properties of filter materials used in industrial conditions. It has been shown that type of filter material used during filtration in industrial wood dust collectors in furniture factories affects the formation of airflow resistance through the filter fabric. The nature and course of formation of the filtration resistance are different for individual filter materials. For material B [28], which, apart from the thermal treatment of the surface, also had a PP film, lower values of the total resistance and lower values of the K2 coefficient were demonstrated during the tests. Despite the same basis weight of the bags used and the thermal surface treatment applied, the resistance to airflow through the nonwoven fabric changed in different ways. Comparing the results with previous studies [28], we note that the differences in the properties of both nonwovens, which were expressed in different strength properties, different resistances of clean bags, and the presence of a PP film and different air permeability, can be considered key in the subsequent formation of the filtration resistance. The comparison of the obtained test results with other tests described in the literature shows that the formation of the filtration resistance during the separation of wood dust proceeds in a different way than in the case of dust of other origins. In the case of filtration resistance during the separation of wood dust, the values of this resistance are lower than in the case of tests for other dust. The obtained results can be used for a better selection of filter material and the duration of their working time in industry conditions.

Author Contributions

Conceptualization, C.D., T.R. and Z.P.; methodology, C.D. and Z.P.; software, C.D.; validation, C.D., Z.P. and T.R.; formal analysis, M.K., R.K., A.O. and T.R.; investigation, C.D. and Z.P.; resources, C.D. and Z.P.; data curation, Z.P. and T.R.; writing—original draft preparation, C.D.; writing—review and editing, C.D., T.R. and Z.P.; visualization, C.D.; supervision, T.R.; project administration, M.K., R.K., T.R. and A.O.; funding acquisition, M.K., T.R. and R.K. All authors have read and agreed to the published version of the manuscript.

Funding

This research was supported by the Cultural and Educational Grant Agency of the Ministry of Education, Science, Research, and Sport of the Slovak Republic under contract no. KEGA 026UMB-4/2021 and by the grant agency VEGA under the project No. 1/0324/21. The study was also supported by the funding for statutory R&D activities as the research task No. 506.227.02.00 of the Faculty of Forestry and Wood Technology, Poznań University of Life Sciences.

Institutional Review Board Statement

Not applicable.

Informed Consent Statement

Not applicable.

Data Availability Statement

Not applicable.

Conflicts of Interest

The authors declare no conflict of interest.

References

  1. Očkajová, A.; Kučerka, M.; Kminiak, R.; Krišťák, L.; Igaz, R.; Réh, R. Occupational Exposure to Dust Produced When Milling Thermally Modified Wood. Int. J. Environ. Res. Public Health 2020, 17, 1478. [Google Scholar] [CrossRef] [PubMed] [Green Version]
  2. Čavlović, A.; Beljo Lučić, R.; Ištvanić, J. Exposure to Wood Dust in Croatian Woodworking Industry. Wood Res. 2009, 54, 109–116. [Google Scholar]
  3. Dado, M.; Mikusova, L.; Schwarz, M.; Hnilica, R. Effect of selected factors on mass concentration of airborne dust during wood sanding. J. MM Sci. J. 2019, 2019, 3679–3682. [Google Scholar] [CrossRef] [Green Version]
  4. Szewczyńska, M.; Pośniak, M. Assessment of Occupational Exposure to Wood Dust in the Polish Furniture Industry. Med. Pr. 2017, 68, 45–60. [Google Scholar] [CrossRef] [Green Version]
  5. Soćko, R.; Pakulska, D.; Szymczak, W. Wood Dust—Inhalable Fraction Documentation of Proposed Values of Occupational Exposure Limits (OELs). Podstawy Metod. Oceny Sr. Pr. 2021, 108, 27–138. [Google Scholar] [CrossRef]
  6. Directive (EU) 2017/2398 of the European Parliament and of the Council of 12 December 2017 Amending Directive 2004/37/EC on the Protection of Workers from the Risks Related to Exposure to Carcinogens or Mutagens at Work. 2017. Available online: https://www.eumonitor.eu/9353000/1/j9vvik7m1c3gyxp/vklpgng5lezp (accessed on 15 May 2022).
  7. Gabryelewicz, I.; Stryjski, R.; Wędrychowicz, M.; Dąbrowski, T. The State of the Air Quality in Poland. Rocz. Ochr. Sr. 2020, 22, 998–1013. [Google Scholar]
  8. Ibama, O.; Brown, H.; Briggs, O. Assessment of kidney function in carpenters exposed to wood dust in port-harcourt. Eur. J. Pharm. Med. Res. 2018, 8, 197–199. [Google Scholar]
  9. Gallet, P.; Nguyen, D.T.; Russel, A.; Jankowski, R.; Vigouroux, C.; Rumeau, C. Intestinal and Non-Intestinal Nasal Cavity Adenocarcinoma: Impact of Wood Dust Exposure. Eur. Ann. Otorhinolaryngol. Head Neck Dis. 2018, 135, 383–387. [Google Scholar] [CrossRef]
  10. Antov, P.; Neykov, N.; Savov, V. Effects of Occupational Safety and Health Risk Management on the Rate of Work-Related Accidents in the Bulgarian Furniture Industry. Wood Des. Technol. 2019, 7, 1–9. [Google Scholar] [CrossRef]
  11. Antov, P.; Neykov, N. Costs of Occupational Accidents in the Bulgarian Woodworking and Furniture Industry; Ss. Cyril and Methodius University: Skopje, Macedonia, 2017; Volume III, pp. 213–221. [Google Scholar]
  12. Kristak, L.; Antov, P.; Bekhta, P.; Lubis, M.A.R.; Iswanto, A.H.; Reh, R.; Sedliacik, J.; Savov, V.; Taghiyari, H.R.; Papadopoulos, A.N.; et al. Recent Progress in Ultra-Low Formaldehyde Emitting Adhesive Systems and Formaldehyde Scavengers in Wood-Based Panels: A Review. Wood Mater. Sci. Eng. 2022, 1–20. [Google Scholar] [CrossRef]
  13. Antov, P.; Savov, V.; Trichkov, N.; Krišťák, L.; Réh, R.; Papadopoulos, A.N.; Taghiyari, H.R.; Pizzi, A.; Kunecová, D.; Pachikova, M. Properties of High-Density Fiberboard Bonded with Urea–Formaldehyde Resin and Ammonium Lignosulfonate as a Bio-Based Additive. Polymers 2021, 13, 2775. [Google Scholar] [CrossRef] [PubMed]
  14. Michalski, K.; Gembalska-Kwiecień, A.; Musioł, A.; Olejárová, Š. Impact Study of a Dust Removal System on Reduction of Selected Health Hazards of Employees in Carpentry. Multidiscip. Asp. Prod. Eng. 2018, 1, 323–329. [Google Scholar] [CrossRef] [Green Version]
  15. Callé, S.; Klaba, L.; Thomas, D.; Perrin, L.; Dufaud, O. Influence of the Size Distribution and Concentration on Wood Dust Explosion: Experiments and Reaction Modelling. Powder Technol. 2005, 157, 144–148. [Google Scholar] [CrossRef]
  16. Imuran, A.S.; Salawu, G.A.; Odeniyi, O.M.; Azeez, M.A.; Oloyede, F. Agglomeration of Wood Dust and Charcoal Powder for Solid Fuel Production. Int. J. Res. Eng. Sci. (IJRES) 2021, 9, 10–13. [Google Scholar]
  17. Olkuski, T.; Stala-Szlugaj, K. Międzynarodowy rynek pelletów drzewnych. Zesz. Nauk. Inst. Gospod. Surowcami Miner. Pol. Akad. Nauk. 2018, 105, 75–84. [Google Scholar] [CrossRef]
  18. Fico, D.; Rizzo, D.; Casciaro, R.; Esposito Corcione, C. A Review of Polymer-Based Materials for Fused Filament Fabrication (FFF): Focus on Sustainability and Recycled Materials. Polymers 2022, 14, 465. [Google Scholar] [CrossRef]
  19. Le Guen, M.-J.; Hill, S.; Smith, D.; Theobald, B.; Gaugler, E.; Barakat, A.; Mayer-Laigle, C. Influence of Rice Husk and Wood Biomass Properties on the Manufacture of Filaments for Fused Deposition Modeling. Front. Chem. 2019, 7, 735. [Google Scholar] [CrossRef]
  20. Cirqueira, S.S.R.; Tanabe, E.H.; Aguiar, M.L. Evaluation of Operating Conditions during the Pulse Jet Cleaning Filtration Using Different Surface Treated Fibrous Filters. Process Saf. Environ. Prot. 2017, 105, 69–78. [Google Scholar] [CrossRef]
  21. DIN—VDI 3926 BLATT 1; Testing of Cleanable Filter Media—Standard Test for the Evaluation of Cleanable Filter Media 2004. Deutsches Institut für Normung e. V.: Berlin, Germany, 2004.
  22. ISO 11057:2011; Air Quality—Test Method for Filtration Characterization of Cleanable Filter Media 2017. International Organization for Standardization: Geneva, Switzerland, 2017.
  23. Laminger, T.; Stecher, M.; Mauschitz, G.; Höflinger, W. Modeling the Pressure Drop Behavior of Cleanable Dust Filters during Pressure-Controlled Operation. Sep. Sci. Technol. 2017, 52, 2788–2794. [Google Scholar] [CrossRef] [Green Version]
  24. Höflinger, W. New developments for optimal selection of filter media in fine dust bag-house filtration. Glob. J. Technol. Optim. 2011, 2, 111–116. [Google Scholar]
  25. Tanabe, E.H.; Barros, P.M.; Rodrigues, K.B.; Aguiar, M.L. Experimental Investigation of Deposition and Removal of Particles during Gas Filtration with Various Fabric Filters. Sep. Purif. Technol. 2011, 80, 187–195. [Google Scholar] [CrossRef]
  26. Li, J.; Li, S.; Zhou, F. Effect of Moisture Content in Coal Dust on Filtration and Cleaning Performance of Filters. Physicochem. Probl. Miner. Process 2016, 52, 365–379. [Google Scholar] [CrossRef]
  27. Mukhopadhyay, A.; Bawane, H.S. Emission of Fine Particles and Ageing Behavior of PTFE Finished Filter Media during Industrial Pollution Control. Environ. Pollut. 2015, 4, 58. [Google Scholar] [CrossRef] [Green Version]
  28. Dembiński, C.; Potok, Z.; Dolny, S.; Kminiak, R.; Rogoziński, T. Performance of Filter Bags Used in Industrial Pulse-Jet Baghouses in Wood-Based Panels Furniture Factory. Appl. Sci. 2021, 11, 8965. [Google Scholar] [CrossRef]
  29. Potok, Z.; Rogoziński, T. Pilot-Scale Study on the Specific Resistance of Beech Wood Dust in a Pulse-Jet Filter. Sustainability 2020, 12, 4816. [Google Scholar] [CrossRef]
  30. Rogoziński, T. Pilot-Scale Study on the Influence of Wood Dust Type on Pressure Drop during Filtration in a Pulse-Jet Baghouse. Process Saf. Environ. Prot. 2018, 119, 58–64. [Google Scholar] [CrossRef]
  31. Boudhan, R.; Joubert, A.; Durécu, S.; Gueraoui, K.; Le Coq, L. Influence of Air Humidity on Particle Filtration Performance of a Pulse-Jet Bag Filter. J. Aerosol Sci. 2019, 130, 1–9. [Google Scholar] [CrossRef] [Green Version]
  32. Zhang, W.; Deng, S.; Wang, Y.; Lin, Z. Dust Loading Performance of the PTFE HEPA Media and Its Comparison with the Glass Fibre HEPA Media. Aerosol Air Qual. Res. 2018, 18, 1921–1931. [Google Scholar] [CrossRef] [Green Version]
  33. Liu, X.; Shen, H.; Nie, X. Study on the Filtration Performance of the Baghouse Filters for Ultra-Low Emission as a Function of Filter Pore Size and Fiber Diameter. Int. J. Environ. Res. Public Health 2019, 16, 247. [Google Scholar] [CrossRef] [Green Version]
  34. Saleem, M.; Khan, R.U.; Tahir, M.S.; Krammer, G. Experimental Study of Cake Formation on Heat Treated and Membrane Coated Needle Felts in a Pilot Scale Pulse Jet Bag Filter Using Optical In-Situ Cake Height Measurement. Powder Technol. 2011, 214, 388–399. [Google Scholar] [CrossRef] [Green Version]
  35. Zhu, R.; Zheng, J.; Ni, B.; Zhang, P. Exploration of PM2.5 Filtration Property of Filter Bag for Environment Protection. IOP Conf. Ser. Earth Environ. Sci. 2017, 69, 012040. [Google Scholar] [CrossRef]
Figure 1. Sieve analysis of dust from narrow-surface treatment lines.
Applsci 12 05580 g001
Figure 2. Test rig set-up; 1—filtration chamber, 2—filter bag, 3—supporting cage, 4—Venturi tube, 5 –dust feeder DSK-I-04p (HYDRAPRESS), 6—dust inlet tube, 7—clean air chamber, 8—tube with cleaning nozzle, 9—compressed air tank, 10—controlling control device, 11—outlet tube, 12—Prandtl tube, 13—differential manometer for air velocity control type MPR-1 (ZAM Kety, Poland), 14—regulation valve, 15—main fan, 16—differential manometer for pressure drop measurements CMR-10A (ZAM Kety, Poland).
Applsci 12 05580 g002
Figure 3. Pressure drop across clean filter media from narrow-surface treatment line—service life of the bags: 0, 85, 146, 275, and 382 days.
Applsci 12 05580 g003
Figure 4. Airflow resistance through the filter fleece before the regeneration impulse for the bags used in the tests. Service life of 0, 85, 146 and 275, and 382 days.
Applsci 12 05580 g004
Figure 5. The value of the K2 coefficient depends on the working time and the type of bag.
Applsci 12 05580 g005
Table 1. Basic technical parameters of the dust-extraction installations.
ParameterUnitParameter Value
Factory installation identification No. 1—Main pipelineNo. 2—p Auxiliary pipeline
Factory labeling of the filter Filter no. 3—SBF-140-5,0S-1A
Pipeline lengthm144.334.4
Air velocity in the pipelinem·s−12426.5
Air demandm3·h−155,450
Fan type JK-90 MT (1 pcs)
Fan volume output m3·h−160,000
Table 2. Basic technical parameters of the filter baghouses.
ParameterUnitParameter Value
Number of bagspcs140
Bag lengthm4.68
Bag diameterm0.15
The area of the working surface of the bagm22.205
The total working surface area of the bags in the filterm2313.166
Filtration velocity, cm·s−14.918
The amount of dust generated during processingkg·h−1250
Dust loadg·m−34.509
The interval between the regeneration pulses for one bags606
The number of shifts in the work of the bag during the day-3
Estimated number of regenerative impulses per day-143
Table 3. Basic technical properties of the filter bags according to the manufacturer (material A).
ParameterUnitParameter Value
Bag producer Filtrapol
Fabric type/symbol FP-PB400PS2 Poliester with copper fiber
Material weightg·m−1400
Material thicknessmm1.8
Tensile strength—lengthwisedaN·5 cm−1160
Tensile strength—acrossdaN·5 cm−1110
Breaking elongation—lengthwise%25
Breaking elongation—across %25
Strain under stress 50 N—lengthwise%2.5
Strain under stress 50 N—across%5.0
Air permeabilitydm3·min−1·dm−2220
Surface finishing Thermal stabilization, calendering, honing, water- and oil-resistant treatment.
Electrical resistanceW106
High-temperature resistance°CConstant temperature 140, short-term temperature 150
Table 4. Filtration parameters during testing of filtration non-wovens.
ParameterUnitParameter Value
Maximum airflow speed in the fan duct w m·s−14.290
Average speed wśr = 0.85wm·s−13.646
Air volume flow Vm3·s−10.0286
m3·h−1103
Air-to-cloth ratio fm3·(m2·h)−1145.8
Filtration velocity wfm·s−10.0405
Inlet dust concentrationkg·m−30.01
Table 5. Summary of regression equations and resistance values for the 50th filter cycle.
Period [Days]MATERIAL APeriod [Days]MATERIAL B
EquationΔpc [Pa]EquationΔpc [Pa]
0y = 29.889 T0.093942.630y = 54.642 T0.10988.53
85y = 62.972 T0.099898.9967y = 61.827 T0.105399.60
146y = 65.473 T0.1035105.34133y = 66.455 T0.0995104.98
275y = 89.023 T0.0836133.15272y = 72.250 T0.0879108.54
382y = 95.833 T0.0814142.79
Table 6. Summary of dust layer resistance values for individual test variants and the dust resistance coefficient.
Period [Days]MATERIAL APeriod [Days]MATERIAL B
Δpp [Pa]K2 [s−1]Δpp [Pa]K2 [s−1]
01.18240.7036.8527489.1
8557.5411,694.26747.9229738.8
14663.9012,985.013353.30210,832.1
27591.7018,635.527256.86211,555.6
382101.3420,594.2
Publisher’s Note: MDPI stays neutral with regard to jurisdictional claims in published maps and institutional affiliations.

