Article

Technology Behavior Model—Impact of Extended Reality on Patient Surgery

1
Faculty of Data Science and Information Technology, INTI International University, Persiaran Perdana BBN, Nilai 71800, Negeri Sembilan, Malaysia
2
Faculty of Computer Science and Information Technology, Universiti Putra Malaysia, UPM, Serdang 43400, Selangor Darul Ehsan, Malaysia
*
Author to whom correspondence should be addressed.
Appl. Sci. 2022, 12(11), 5607; https://doi.org/10.3390/app12115607
Submission received: 30 March 2022 / Revised: 10 May 2022 / Accepted: 11 May 2022 / Published: 31 May 2022

Abstract

:
Smart surgery is a new way to utilize smart devices to change existing surgeries. Smart glasses can enhance the surgical procedure so that the patient can understand the procedure more intuitively. Surgery is for patients, and patient acceptance of extended reality surgery is the purpose of this study. This study uses the technology behavior model, which is more in line with the user’s assessment of the acceptance behavior of the new technology. A triangulated research approach was used, which applies to this study for a specific patient population. Primary data were collected from hospitals through questionnaires and were statistically analyzed by CB&PLS-SEM multimodel using SmartPLS software. It was concluded that patients were influenced by operational emotional factors in undergoing extended reality surgery. The study provides a basis for future research related to the practical application of smart surgery from the patient’s perspective in viewing and accepting surgery.

1. Introduction

Along with the development of medical and health technology, smart surgery has come into the limelight [1]. It provides a new solution to the doctor–patient trust and anxiety problems that cannot be solved independently. For a long time, trust between doctors and patients has often been a gap that cannot be crossed in clinical treatment [2]. Patients trust their doctors for their daily care. However, this is true for some acutely ill patients, whose trust in their physicians is often self-identified only by their physicians’ biographies [3]. It is not true trust from the heart. In previous studies, it was found that doctor-patient trust-building activities are critical to surgery and patient care [4]. Smart surgery refers to surgery performed through the use of smart devices or instruments [5], for example, intelligent minimally invasive surgery. Patients can watch the surgeon’s operation from a first-view perspective through the use of smart glasses. Such a demonstration allows patients to clearly observe the procedure, and when they fully understand the specifics of the operation, they will heartily agree with the surgical plan and develop trust in the surgeon [6]. This trust is a prerequisite for the surgery to be performed [7]. Clinical procedures are accompanied by surgical risks, including some unintentional human factor risks and technical risks [8]. These human factors are mainly caused by the unintentional errors of the surgeon. People make mistakes, and doctors are no exception. Especially during high-intensity surgery, surgeons are often in a state of high concentration and stress for long periods, which can result in unconscious errors [9]. The use of smart glasses during surgery can be monitored by external third-party assistance, where the standardization of surgical operations avoids some mistakes, thus reducing the risk in surgical operations and reducing patient’s anxiety [10].
The patient’s psychology is often in excessive tension before the surgery, which often causes some disadvantages for the surgery. Patients’ emotions are often reflected in preoperative tension and anxiety. Such emotions can lead to a rapid heart rate, elevated blood pressure, or the onset of depression. The onset of these emotions is often a neuroendocrine-related onset. Tachycardia can be a risk factor for patients undergoing cardiac surgery and can also accelerate the metabolism of anesthetic drugs in the body, leading to a prognosis for the duration of anesthesia. Depressed patients are at greater risk during surgery, including induction of anesthesia with venous blockage, muscle relaxation, and increased sensitivity to nerve pain. Prolonged postoperative awakening, vomiting, and other symptoms lead to a poor postoperative outcome. Patients need psychological guidance and advanced anesthesia. The patient’s blood pressure and blood flow rate are brought down to the normal range before surgery can be performed. A normal physiological index will help the surgeon to always keep the physiological figures within a safe range during the surgery to ensure the safety of the patient’s life and health. The simulated surgical procedure using smart glasses enables the patient to have a comprehensive understanding of the surgical protocol and the handling of emergencies. It can effectively help patients to relieve their nervous psychological problems [11].
This study investigates the value of smart glasses in terms of operational value, operational risk, trust, and reduction in patient tension through the perceived use of smart glasses by patients’ subjective awareness of the differences between smart glasses surgery and conventional surgery. A new theoretical framework, the technology behavior model, is based on the technology acceptance model and the theory of planned behavior. The main contribution is that this study focuses on changing usage behavior through human subjective awareness, attitudes, and behavioral control, in addition to the usefulness of extended reality technology through the use of perception. It has both the perceived usefulness in the technology acceptance model, as expressed in patient acceptance of smart glasses surgery, and the change in behavior by human attitudes from the theory of planned behavior, as expressed in the ability of smart glasses surgery to improve the success rate of the surgery and increase patient trust in the surgery; both integrated models apply to this study. A mixed research approach was used to conduct the study, where a single research method could not meet the needs of the study because there was no information available about patients’ perceptions and opinions related to smart surgery. The data were analyzed using CB-SEM and PLS-SEM statistical analysis software, which has multimodel, multilevel cross-tabulation, and enables a more comprehensive and systematic analysis of dependent and independent variables, which is especially helpful for the mixed research approach. First, the hypothesis of this study is presented through relevant and similar references to establish the theoretical framework. Secondly, the research methodology and data collection process are presented and analyzed in a systematic study to arrive at a positive hypothesis. Finally, a comprehensive contribution to the contribution and conclusion of this study. Patients are generally more willing to accept smart glasses surgery and are interested in understanding the surgical process through surgical simulation before surgery, which can effectively relieve patients’ tension and improve the reliability of surgery.

2. Literature Review

Extended reality smart glasses (XRGE) use extended reality technology (XRT), which uses computer technology to form 3D images that combine the virtual environment with the physical environment to achieve a virtual–reality continuum and eliminate the original edge boundaries. The enhancement of physical reality and digital virtual information is built according to the contextual content of the overlap to make the visualization of 3D stereoscopic imaging more realistic, and to meet the needs of the real environment, achieving refined human interaction.

2.1. Virtual Surgery

Virtual surgery is achieved with virtual reality and mixed reality technologies [12]. Virtual reality is the use of the internet to collect medically relevant image signals and use computers to convert digital information into recognizable commands that are transmitted to display devices to complete the operation of human action commands [13]. Combined with mixed reality technology to establish a 3D image, the original 2D virtual image multilevel superposition, in the space x, y, z plane, marks each coordinate to achieve unique identification [14]. Avoiding the data errors in the model, especially during the second review of missing data, ensures the real data and virtual information have no difference and match [15]. For example, the preoperative virtual surgery for cardiac interventional procedures was obtained from the QpenEar dataset to obtain the original data, combined with the patient CT and NMR scans, to take the actual data to construct a 3D stereo heart model [16]. The model can identify arteries, veins, atria, ventricles, endothelial thickness, nerve distribution, and other aspects [17,18]. The internal motion and orientation of the organ can be marked by a self-contained optical marker method [19]. The available kinetic and sensor data signals are combined with different colors to differentiate the space of interest.

2.2. Eye Tracking

Eye-tracking is based on the light-sensitive movement of the eyes to achieve the transmission of human-machine command recognition [20]. It is the newest interaction method at present [21]. To be precise, it uses infrared light to track and detect pupil changes and the length of the response time of the cornea to changes in light for recognition [22]. The tracking data is transformed into an image through context and transmitted to the display. The pupil change is detected at the edge of the pupil, locating the pupil position, and determining the user’s movement intention, based on the detection data [23]. Common abnormalities include iris, eyelashes, and some interference filters. Interference filtering is the unintentional use of the eye while gazing, i.e., the natural blinking of the human eye, which results in false commands. Physiological operation can be ruled out by calculating the eye movement threshold. It was found that, when the threshold is >0, the focal point for recognizing light perception is at the end of the eye [24]. When the threshold < 0, the photoreceptor focal point falls at the front of the eye [24]. To reduce the error and to eliminate the physiological variance of the pupil, the user should maintain the eye’s gaze for more than 800 ms to improve the accuracy of the recognition of the glasses and to ensure the correct operation of the instructions [25]. Due to the differences in human behaviors, the recognition time can be self-regulated to speed up the access rate and reduce the waiting time for an operation.

2.3. Image

Extended reality, a hybrid application of virtual and augmented reality, is a concrete manifestation of extended reality, which combines physical reality with virtual reality in 3D technology [26]. Smart glasses are connected to a computer PDM system through a parametric XR system to ensure command recognition [27]. The system treats each marker as a uniquely identified part by planar coordinates, facilitating the assignment of the next step while facilitating the compensation of errors within the model. By processing data analysis and information compensation, the values of multiple components are superimposed to form a three-dimensional image. For missing data, a secondary check is performed to ensure continuous data transfer from the data model [28]. During mixed reality data acquisition, information connection and data exchange between real objects and corresponding PDM elements are marked with different colors and semi-transparent codes to achieve one-to-one correspondence. In constructing stereo images of the human body, the raw 3D data obtained from the dataset are derived from the skeletal structure of the human body, combined with actual data collected by CT, NMR, and NMR thin real-intensity scans [29]. The system outlines the nerves, arteries, veins, and endothelium of organs in 3D, facilitating sectioning tools for segmentation and observation of regions of interest and image processing of lesions. The problem of poorly defined, partially deconstructed edges can be resolved by identifying 2D CT and MR images, and the repetitive jump from CT slices to XR visualized structures is enhanced by system inscriptions [30]. The holographic estimation of the model is performed by different color coding. Computer-aided software allows for 3D processing and editing, converting fragmented and scattered individual decomposition images into a collection of STL files for uploading to the smart glasses display [31]. A spatial model is created based on the multiplication of planar and surface coordinates, and with interactive control, the translucent model can be superimposed on the patient’s body to form a superimposed image that determines the exact location of the data assignment and improves surgical efficiency. To precisely determine the exact location and direction of motion in the enclosed organ, the target is measured using different signals, using satellite sensor data for inertial localization, combined with the annotation of optical methods. This is an important hybrid dynamics basis for mixed reality optical imaging, enhancing the imaging clarity of the image. The 3D human structure spatial coordinates are overlaid by a reference coordinate system capable of coinciding with spatial locations and times that are not visible to the real-world naked eye, resulting in a gaze vector that enhances the visibility of the human eye.

3. Materials and Framework

3.1. Technology Acceptance Model

The technology acceptance model (TAM) is a behavioral representation of the study of human acceptance of new technologies and information [32]. The TAM is currently one of the most used models in new technology research [33]. The purpose of TAM research is that people experience efficiency gains of new technologies over existing ones through the influence of external factors on usage, such as perceived usefulness [34]. In addition, the way and process of use are more convenient than the existing one, perceived use. The perceived experience leads to a change in the user’s usage behavior [35]. This process is the acceptance of new technologies and information by the perceived behavioral intention that the model focuses on [36]. In this study, patients used the extended reality smart glasses to experience the surgical process and the surgical operation to ease their presurgical anxiety through understanding. Subjective perceptions of the superiority of smart glasses surgery over existing surgical modalities were accepted. This leads to patients choosing smart surgery. However, previous studies have shown relatively low explanatory power and inconsistencies among the components in the research model. Mainly reflected in the following points: (1) the research components are inconsistent, some use attitudes to measure acceptance indicators, and some use behavioral intentions or actual use [37]; (2) some major relationships are inconsistent, for example, perceived ease of use only had a significant effect in studies with behavioral intent and had little effect in other studies; (3) the assessment of specific components is ambiguous, and there is no clear division standard [38].

3.2. Theory of Planned Behavior

Ajzen proposed the theory of planned behavior based on the theory of rational behavior, which focuses on the change of subjective human behavior [39]. New things are attractive to people, and some people are willing to try them actively by learning about them, which is the attitude that determines the norm [40]. Tried-and-tested evidence changes the perceived behavior, and the better the perceived behavior effect is, the more people like to use a given item or technology, thus changing the usage habit [41]. That is, attitude determines behavioral beliefs, beliefs determine behavioral control, and control changes behavioral habits [42]. Behavior change can not only reflect the person’s attitude and intention but also can more visually reflect the recognition of something new [43]. When patients choose smart glasses surgery, subjective attitudes are often an essential part of the choice, which includes people’s recognition and trust in smart glasses. The process of trust is in turn influenced by one’s factors. Preoperative experience can better enable patients to recognize the feasibility of surgery from their subjective consciousness and increase their confidence in the procedure. However, when attitudes or subject norms have a large influence, the predictive power of PBC on intentions is weak. Second, some meta-analyses indicated that TPB barely increased the variance explained by TRA for behavior [44]. There are also distinct measures of paired control of programs that do not hold and may lead to a regression in theories [45]. Finally, Hall and Sheeran concluded that prescriptive norms and descriptive norms had different structures and self–efficacy in their measurement domains [46]. The results of regression analysis showed that incorporating demonstrative norms into the regression equation increased the variance of intention by 5% [47]. Explanation rate and the predictive role of the demonstrative norm is second only to attitude, stronger than prescriptive norm and self-efficacy. These errors all lead to the limitations of TPB in its behavioral impact.

3.3. Technology Behavior Model

The theory of planned behavior (TPB) focuses on behavior change in the subjective consciousness of an individual, and the technology acceptance model (TAM) focuses on the change of human behavior by external factors of new technologies and information [6]. These can be understood as one in which people are subjected to internal psychological changes in behavior and one in which people are subjected to external factors that change behavior. In contrast, when studying human behavior change, the TAM is only able to explain 30–40% of causality, ignoring the actual needs of individuals [48], while the TPB lacks research on poor behavior. Therefore, it includes both subjective and perceived consciousness, and a single use of one model cannot accurately identify the main behavioral intention used [43]. The current study is in the medical field, firstly for extended reality smart glasses, a new product, and the new technology is in line with the technology acceptance model. Secondly, it is the behavioral awareness of the individual through which the data is collected, the perceptual awareness. This in turn is consistent with the theory of planned behavior. Therefore, a new theoretical model, the technology behavior model (TBM), is proposed, using a combination of the existing TAM and TPB. This model enables a more comprehensive study of human behavior change as being influenced by both intrinsic and extrinsic factors. Additionally, this model is combined with extended reality technology.

3.4. Determinants

3.4.1. Attitude toward Behavior (ATB)

ATB refers to changes in behavior caused by people’s attitudes toward things and technology. It is the embodiment of human subjective behavior. Before the operation, the patient can immensely experience how the operation is performed by using XRGS to watch the operation video and simulate the operation process which can relieve the patient’s panic about the operation [49], this is conducive to the smooth operation of the operation. Being able to perceive the clarity of the transmitted image when the patient is viewing the procedure through first vision is beneficial for the procedure. Reflecting the usefulness of XR, this will change attitudes and lead to acceptance intelligent surgery. So, the hypotheses are as follows:
Hypothesis 1 (H1).
ATB contributes to patients’ acceptance of extended reality surgery (AXRS).
Hypothesis 2 (H2).
ATB contributes to the usefulness of extended reality.

3.4.2. Extended Reality Usefulness (XRU)

XRU refers to the patient’s acceptance and use of new technologies through the use of XR. The XR system has the function of 3D stereoscopic imaging, which can control and observe the screen of multiple monitoring instruments at the same time [50]. Constructs overlay color images based on collected external data combined with an anatomical model. These visual images enable patients to understand the structure of their lessons in an easy-to-understand manner, relieve the tension of patients before surgery, improve their confidence, and change their attitudes and actions to choose XR surgery. So, the hypotheses are as follows:
Hypothesis 3 (H3).
XRU contributes to patients’ acceptance of extended reality surgery (AXRS).
Hypothesis 4 (H4).
XRU has a facilitative effect on changing patients’ behavioral attitudes.

3.4.3. Operation Value (OV)

OV means that the XR system has a positive impact on the procedure. the main impact of XR technology on the procedure is demonstrated by image enhancement, visualization clarity, and ophthalmoscopic tracking. Patients can experience and perceive the rapid reading of their information using the interaction with and the viewing of relevant test images. Additionally, 3D rotatable stereoscopic images can be created from 2D images, allowing for a better visual experience. It also enhances the clarity of the human eye, enabling observation of smaller things and wide-angle views. These experiences enable patients to better perceive the value of XR surgery. Thus, they can choose smart surgery from their subjective consciousness. So, the hypothesis is as follows:
Hypothesis 5 (H5).
OV has a facilitative effect on changing patients’ behavioral attitudes.

3.4.4. Operation Risk (OR)

OR refers to the risks involved in the surgical procedure. Surgical risks can be divided into two aspects, one is the technical risk. There are still some unresolved treatments in medical surgery, and existing technologies cannot guarantee the successful completion of the surgery [8]. The limitations of the technology lead to the inability of surgical specialists to guarantee the success of the surgery. The XR system allows virtual surgery, where specialists can rehearse the surgical procedure by simulating the actual situation of the patient. On the other hand, there are risks caused by human factors. Experts can operate uncontrollably and unconsciously in a highly concentrated state. Some doctors’ mistakes in surgical operations, although unintentional, cannot be allowed in the presence of life. XR systems can monitor the operator’s behavior, and the glasses tracking interaction enables the expert’s hands to be free. Through the experience, patients can understand that XR surgery is less risky than normal surgery and change their behavioral choices. So, the hypothesis is as follows:
Hypothesis 6 (H6).
OR has a facilitative effect on changing patients’ behavioral attitudes.

3.4.5. Trust (TR)

Trust usually refers to a person’s assurance in another’s responsibility and ability to fulfill a promise under particular conditions. It is also possible to positively trust technology and assess the extent and integrity of the technology to perform the task in a given environment [4]. Patient trust in XR procedures depends on the physician. This trust is passive trust, where the passive user is the one who directly accepts the influence on the outcome of the technology used in the system in accomplishing the task [51]. It is influenced by both the technology and the physician’s active use. It occurs under conditional conditions or with the active user performing the procedure [7]. The patient’s trust in the technology is also an increase in trust in the physician and facilitates the patient’s determination to choose to undergo the technological procedure. So, the hypothesis is as follows:
Hypothesis 7 (H7).
TR has a facilitative effect on changing patients’ behavioral attitudes.

3.4.6. Tension (TS)

TS means that the patient can view the images from a first perspective by watching the simulated surgery on the XR system, and at the same time, the observation enables a deeper understanding of the specific details of the operation [52]. Nervousness is the patient’s emergency response to the unknown, causing a person to think more about a problem [53]. When a patient knows a procedure, especially through visualization, the patient’s nervousness can be relieved. Without fear, there is no anxiety. Patients identify with XR surgery through experience, thus changing behavioral choices. So, the hypotheses are as follows:
Hypothesis 8 (H8).
TS has a facilitative effect on changing patients’ behavioral attitudes.
Hypothesis 9 (H9).
TS contributes to the usefulness of extended reality.

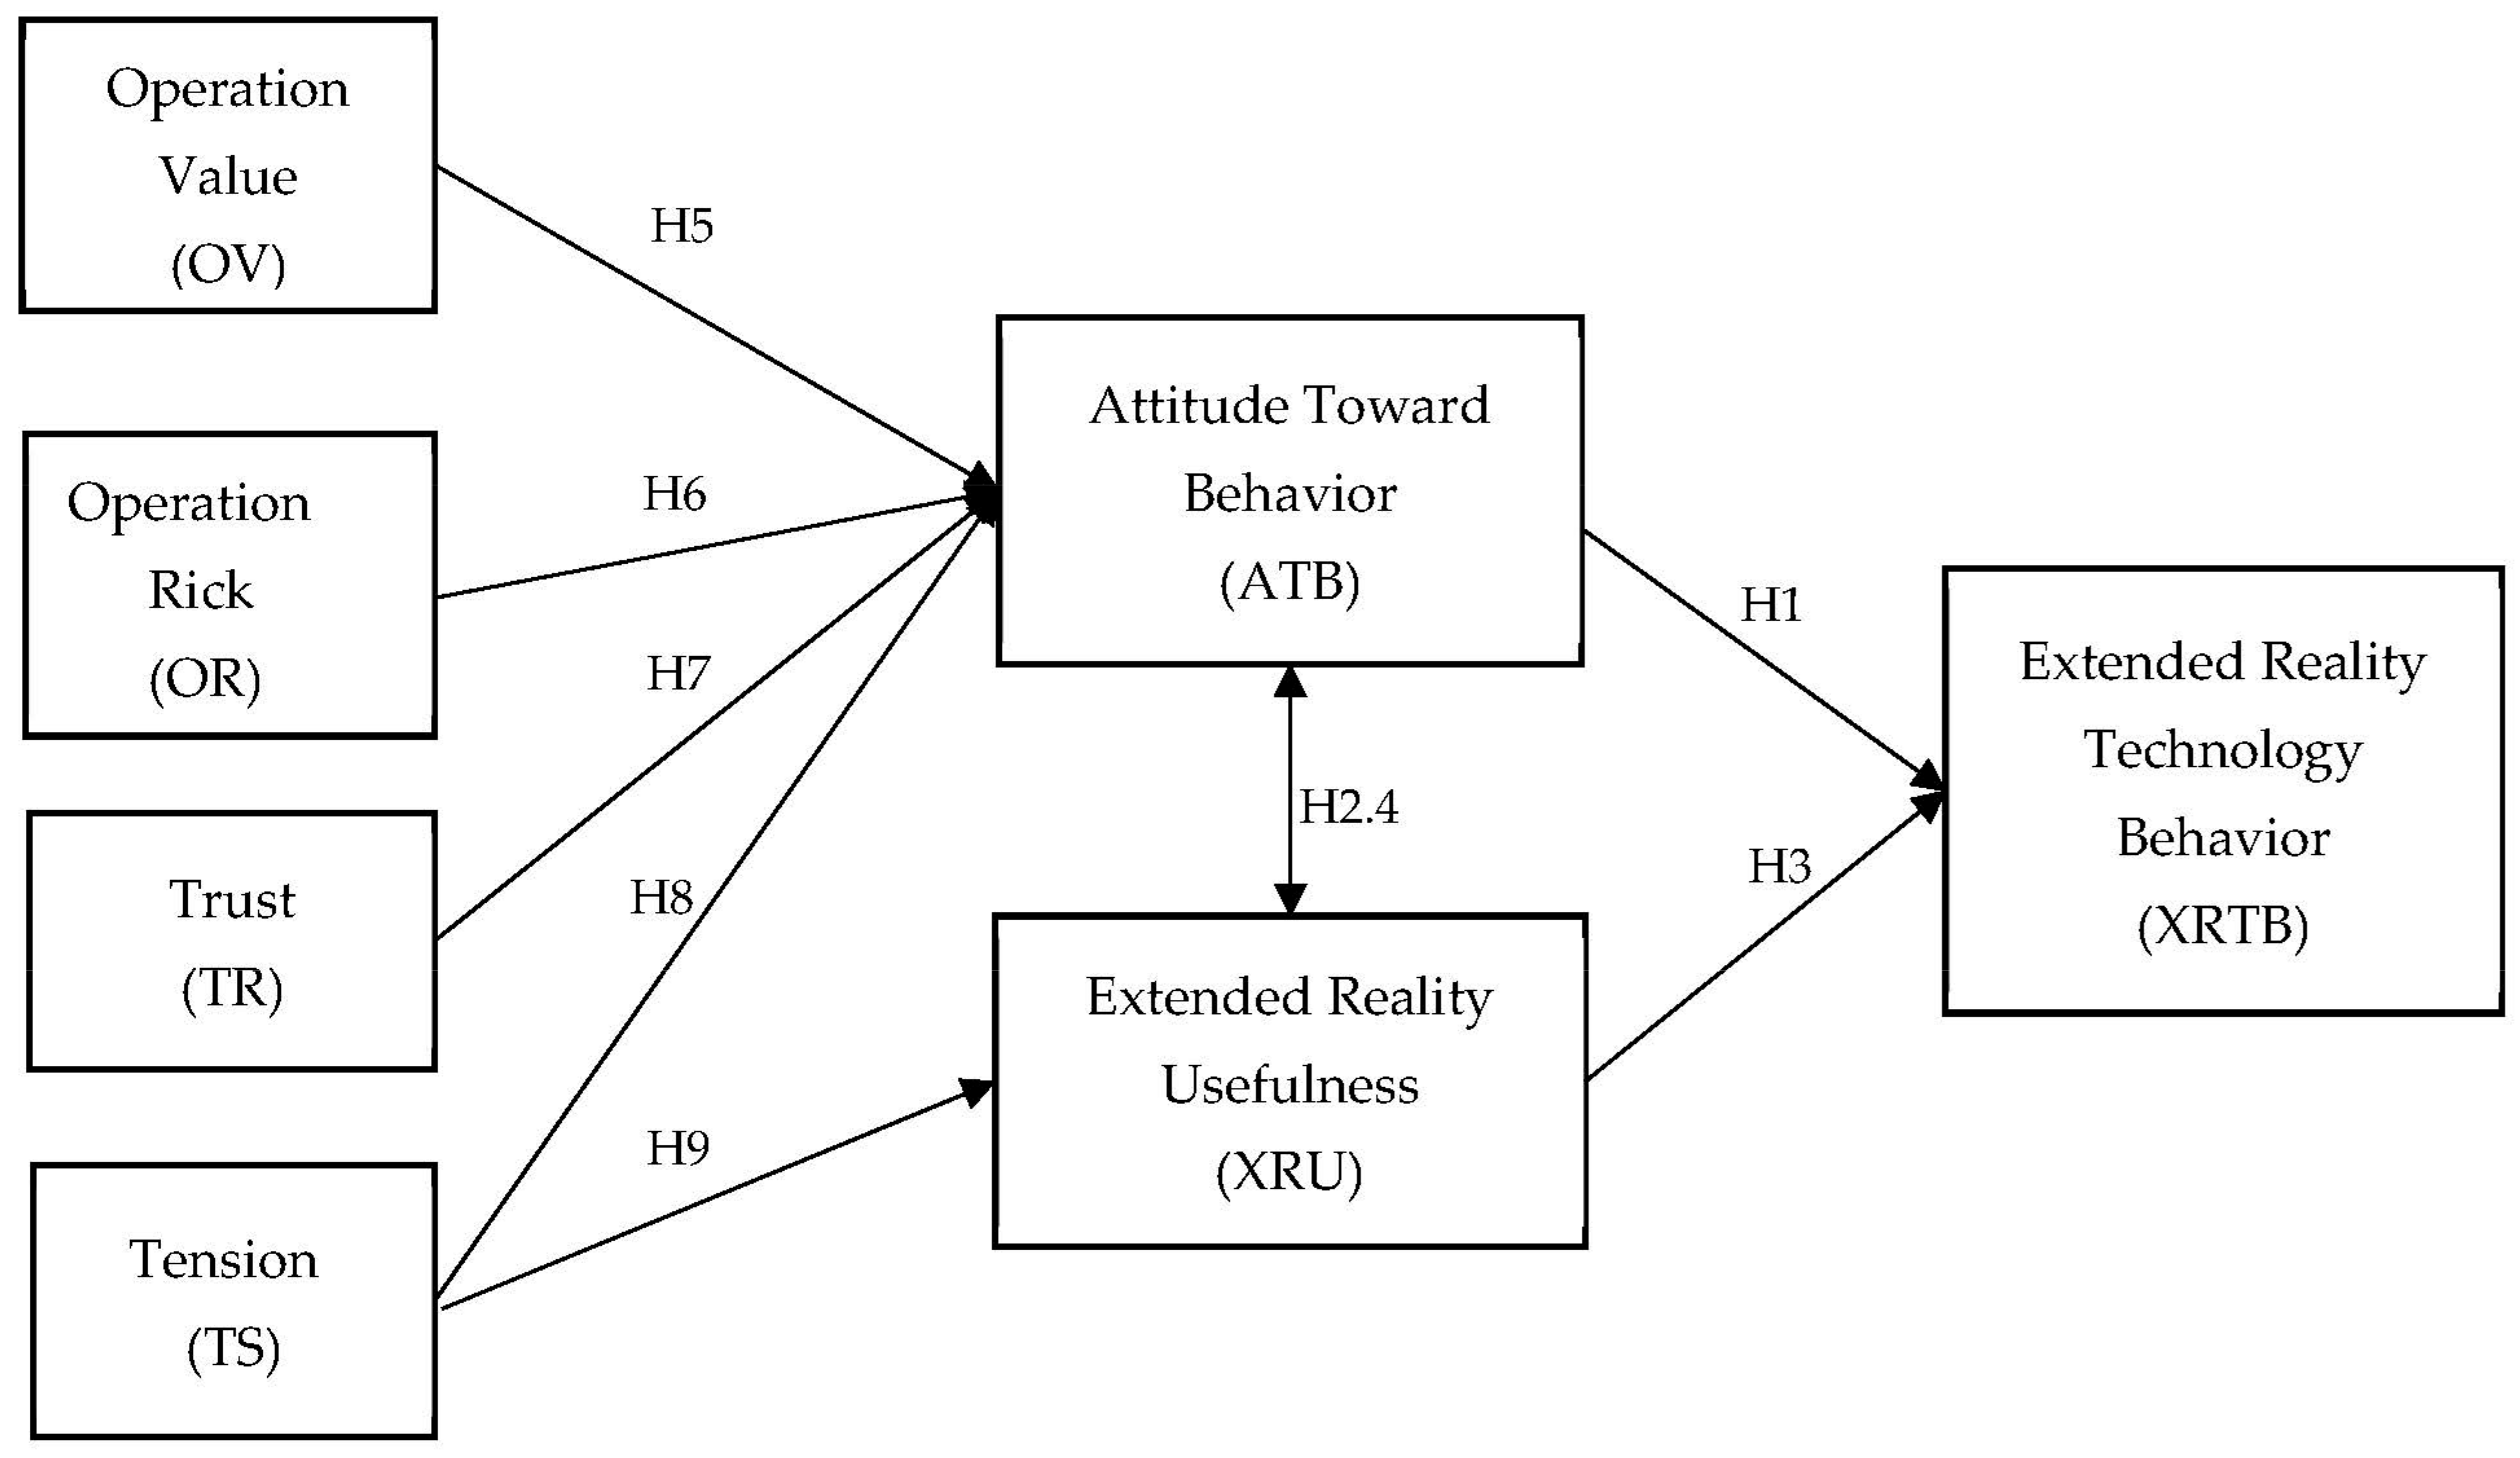
3.5. Theoretical Framework

According to the combination of the hypotheses mentioned above and the technical behavior model (TBM), the theoretical framework of this research was obtained, as shown in Figure 1.

4. Methodology

The research method is the decision-making stage of the research project, according to the particularity of the research objectives [54] and the limitations of the current research on XR technology. Due to its complexity, this study adopted a triangular mixed research method, including quantitative analysis suitable for data research (the research needs to collect primary data for analysis). Second, since there were no relevant references studying XR surgery from patient perspectives, this study adopted an exploratory research approach [55]. Finally, cross-sectional studies were used, which objectively reflect the association of patients with the disease over time [54]. The target population was medical patients, selected from the population base of the Malaysian population. To be able to simplify the collection time, convenience sampling was used in this study. A questionnaire was used to collect data, mainly online, through Facebook, email, and other relevant communication software, supplemented by on-site questionnaires at the hospital on weekends. The questionnaire was prepared based on the relevant literature on XRSG, combined with the actual needs of the patients. Due to the different literacy levels of the patients and the need to facilitate their understanding of the smart glasses, XR technology was mainly communicated to the patients through the doctors, as the doctors have a trusted relationship with the patients, and could facilitate the patients’ trust and recognition of the technology. The next step was to conduct pilot trials in relevant hospitals to gain the approval of patients or families through real experiences. Questionnaire responses were collected over a period of 1 month (Figure 2) and could only be filled out once per person.
Structural equation modeling (SEM) is widely used in social studies in scientific disciplines and is an advanced modeling approach which uses linear multivariate data [56]. There are two model methods, CB-SEM and PLS-SEM. CB-SEM focuses on explaining the establishment of theoretical models and the role of variance and covariance between variables [57]. Often, larger data are required. This study uses a new theoretical model, which needs to be evaluated. The data analysis was mainly carried out by PLS-SEM. PLS-SEM has a variety of research and analysis modes, which can conduct an in-depth analysis of internal and external influencing variables [58]. According to the diversity of research methods in this study, it is necessary to carry out a composite study of multiple regression to obtain accurate data analysis results and avoid unnecessary errors in the research process.

5. Data Analysis

Data were analyzed using the CB-SEM and PLS-SEM methods, and data were collected with an adequate sample size according to the study requirements [59]. However, due to some objective reasons, the number of valid questionnaires received was 300, of which 8 were invalid. This confirms that social sciences often have inevitable missing values in analytical studies that make it difficult to draw conclusion that truly reflect reality. The missing value should be less than 5%, and in this case, 2.67% was within the acceptable normal range. This is in line with the basic needs of research operations in PLS-SEM.

5.1. Demographic Analysis

The percentage of respondents was 54.67% male and 45.33% female, as shown in Table 1. Most of them were middle-aged or elderly patients. They tended to have resistance to surgery because of anxiety and trust issues. The high number of those with moderate income of MYR 5000–8000 reflected that they could afford the surgery.

5.2. Statistical Analysis

The study data were analyzed using SmartPLS 3.3.3 statistical analysis software. This software is the most commonly used SEM. The benefits of using this method are as follows: (1) the study uses an exploratory approach with uncertainty [60]—a comprehensive cross-sectional study of endogenous structural intrinsic relationships and extrinsic theories can be performed; (2) it is suitable for composite structural model studies—the study uses the new theoretical framework XRTBM and the triangulation research method, which makes the structure more mixed; (3) due to the large target number base, the questionnaire could not be sampled equally, which generates some unavoidable errors and is not suitable for conventional research. Unconventional studies facilitate the reduction in variance values. Therefore, the use of SEM facilitates the interlinked effect of each variable, and the multiple data results, such as internal and external structural analysis, impact factor, applicability, and validity through the software, can effectively respond to the study results.

5.2.1. Common-Method Bias

Since the experimental data were collected through an online questionnaire, the data collection method used was too homogeneous and required analysis of variance using common-method bias (CMB) [61]. This variance was generated by measuring the factor-induced variance of the model, which is distinct from the structure-induced variance. CMB was measured by the substance-factor composite and the method-factor composite, and was used mainly for respondents’ awareness and perceived behavior [62]. Table 2 shows that the variance of the substantive factor composite was 85:1 higher than the 39:1 mentioned in Hair’s study. The ratio of Ra2 to Rb2 was 92.6:1 higher than the method variance. This shows that the study data are not affected by CMB.

5.2.2. Assessing the Outer Measurement Model

When using SEM for quantitative studies, validity can be assessed more accurately than in qualitative studies [63]. In particular, there is a clear and large validity discriminant for conditional reflexive measurement models. The composite reliability, which takes into account the weight of differences in factors, is more suitable for reflecting the consistency reliability than the previous assessment using Cronbach’s alpha [64]. In addition, the external loadings, which are important indicators of convergent validity, are calculated based on the average variance extracted (AVE) for each structure of the model, with a threshold value > 0.708 [65]. As shown in Table 3, the composite reliability was higher than 0.94 and the lowest value of AVE was 0.84. In terms of validity studies, hetero trait–mono trait (HTMT) is most often used to judge the validity, as shown in Table 4, which shows a significant difference in interval effects between variables [66]. In line with the discriminant validity HTMT less than 0.85 [67], the data in the table are in line with normal values. The HTMT was inferred from 5000 runs with a confidence interval maximum value of 95% and a minimum value of 2.5% of the threshold [−1, 1]. The bias correction and acceleration (BCa) were wirelessly close to 0. There is an effective structure between the numerators of the dependent variables, as shown in Table 5.

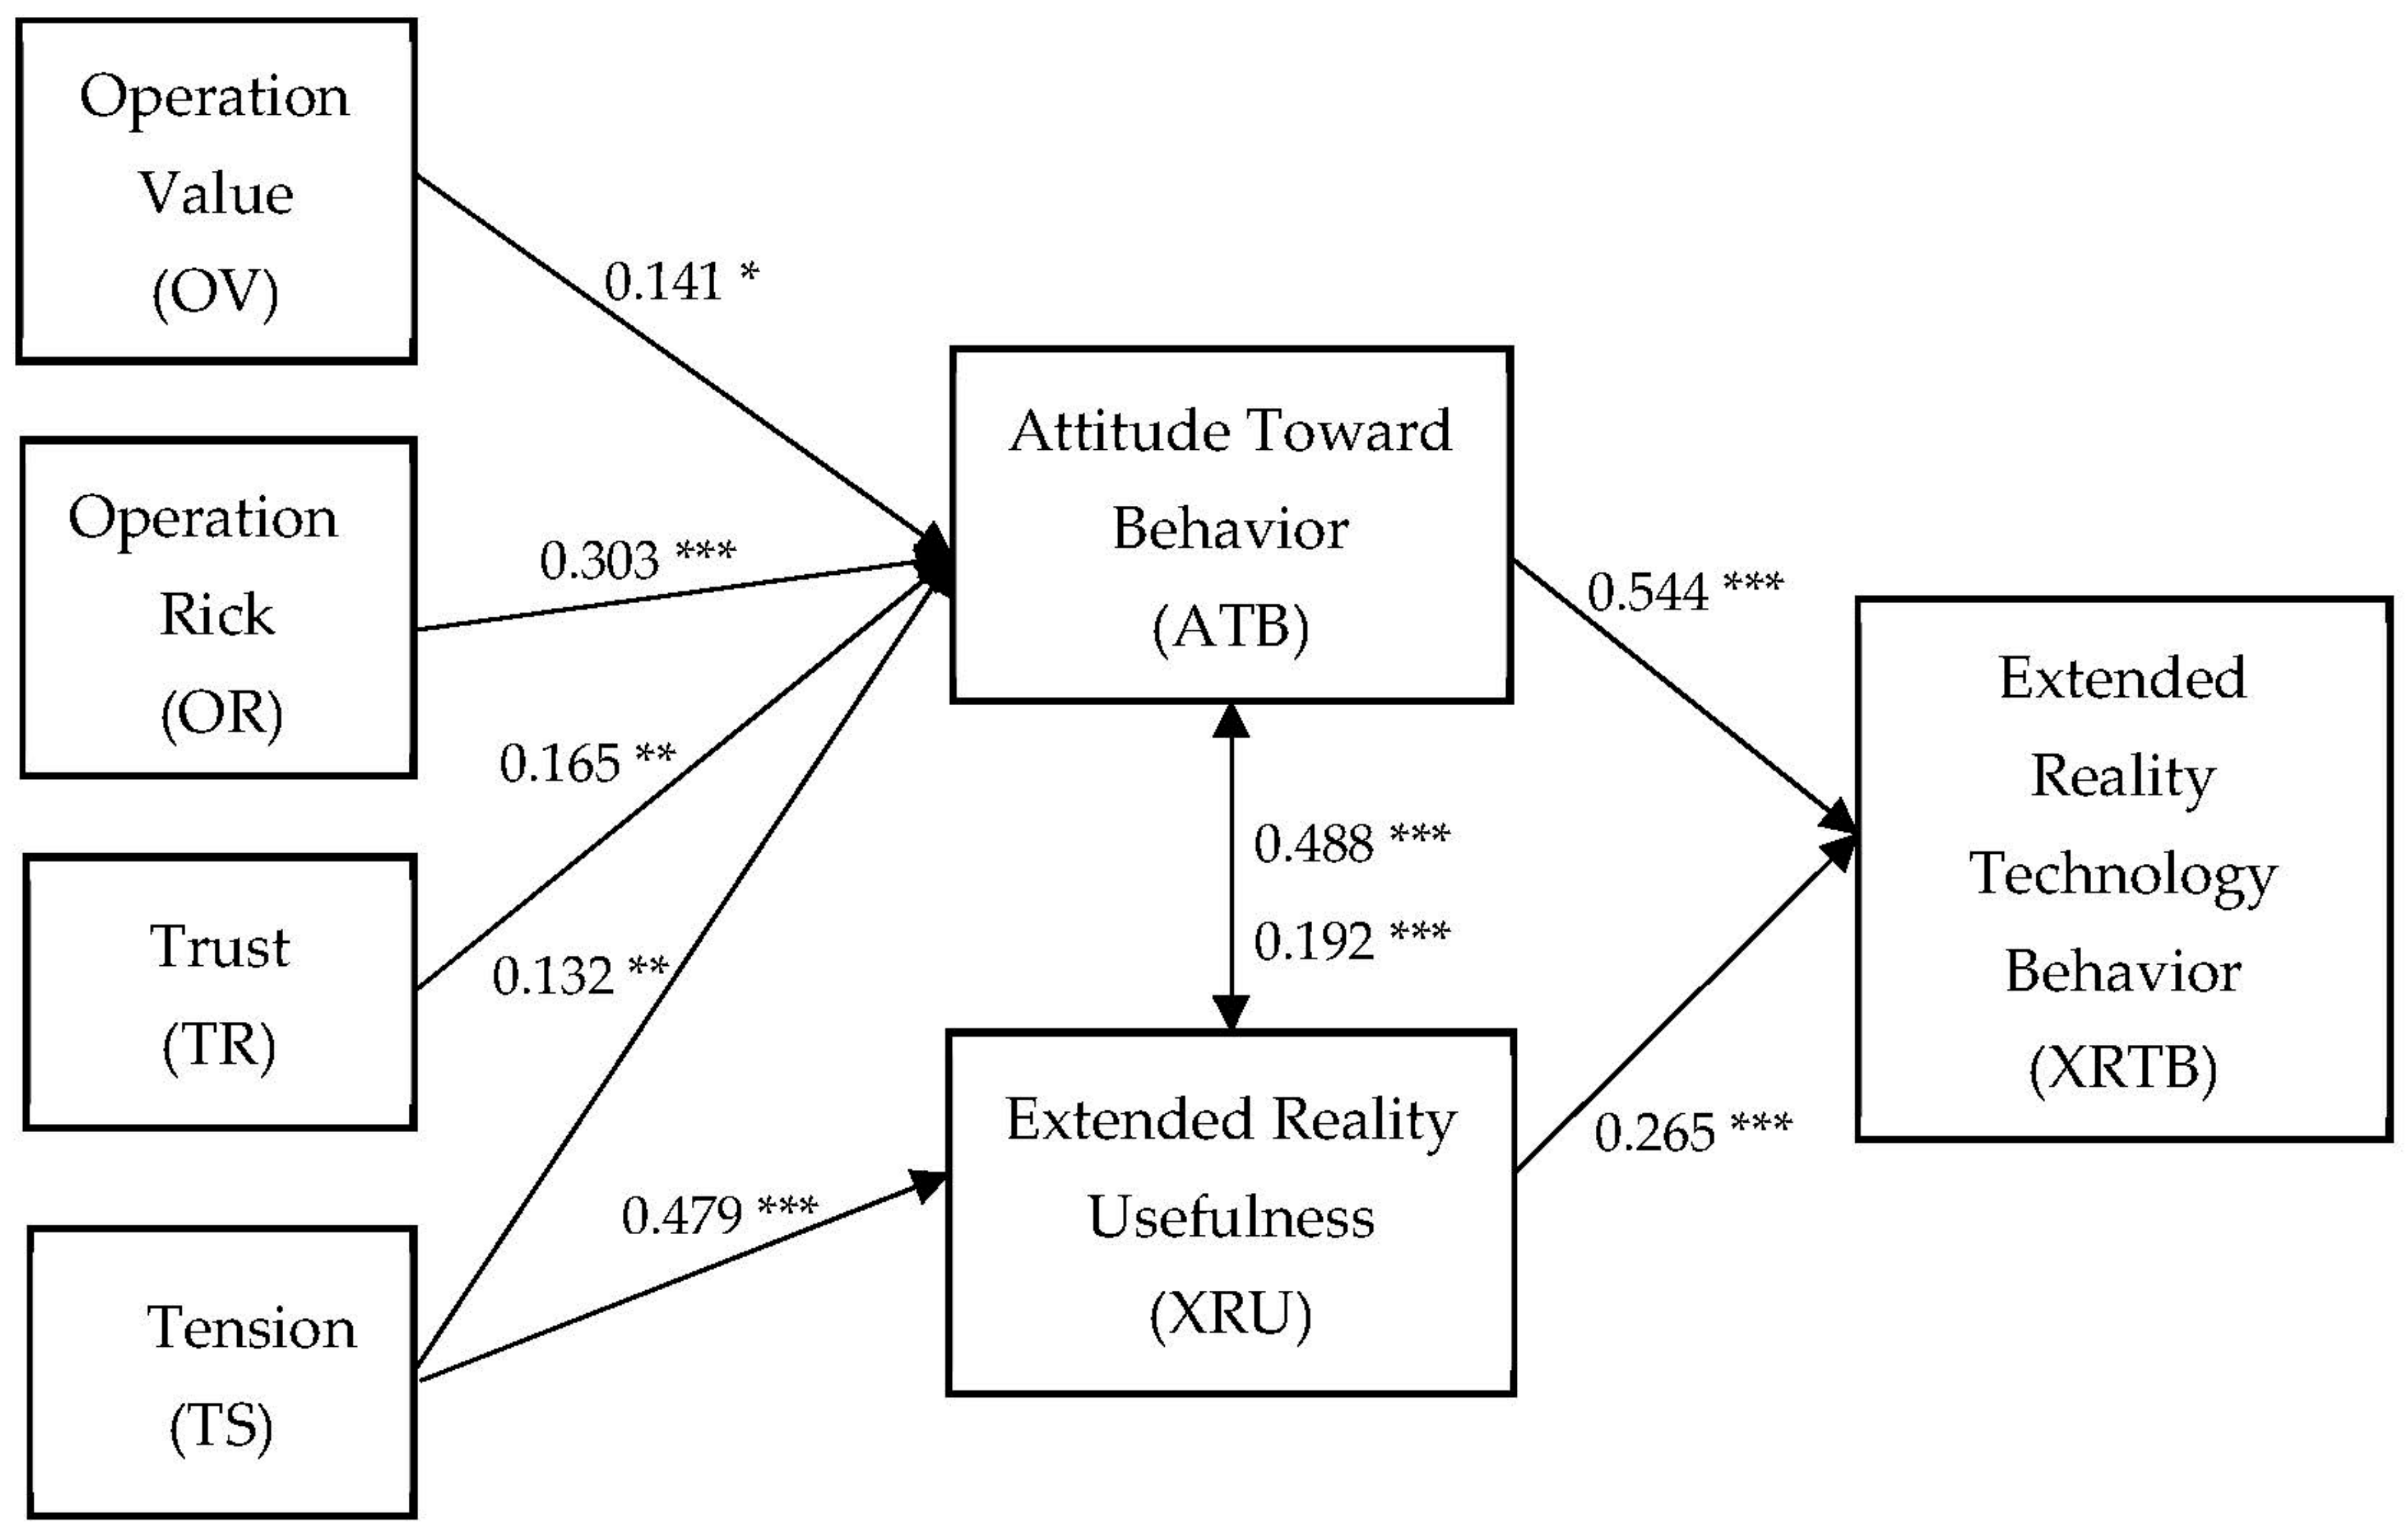
5.2.3. Structural Model

Standard Deviation is the evaluation of the magnitude of the deviation of the independent and response variables. As seen in Table 6, the variance values ranged from 0.048 to 0.064, all less than 0.1 [68]. indicating that the deviations between the structures were small and did not have a significant effect on the structural model. The confidence interval between structures 2.5% and 95% values are close to ±1. Significant differences at the time of the study of p-values to 0.05, 0.01, and 0.001, respectively. As seen in Table 6 and Figure 3, hypotheses of ATB (H1: B = 0.543, p < 0.001; H2: B = 0.488, p < 0.001) were positively related to XRU and AXRS. It was assumed that XRU (H3: B = 0.265, p < 0.001; H4: B = 0.192, p < 0.001) had an enhancing effect on ATB and AXRS. It was hypothesized that OV, OR, TR, and TS (H5: B = 0.141, p < 0.05, H6: B = 0.303, p < 0.001: H7: B = 0.165, p < 0.01; H8: B = 0.132, p < 0.01) had a positive effect on the change of patients’ behavioral attitudes.

5.2.4. Predictive Relevance and Effect Size

In addition to the study of the internal relationship of the model, the Stone–Geisserde Q value should also be tested, and is an important indicator for detecting the out-of-sample predictive power of a model [69]. When the PLS path is predictive, it can detect unused correlations in the data. A Q2 greater than 0 means that the path is predictive of the model [70]. Table 7 shows that Q2 is greater than 0, indicating that the proposed structural model is predictive of a certain endogenous structure. Two methods can usually be used for Q2 calculation (Table 8), namely the cross-validation commonality method and PLS-SEM. the quadratic operation can better ensure the predictiveness of Q2 and predict the eliminated data points.
In addition to assessing the endogenous structure of the Q2 value, the effect size was assessed to determine whether the omitted structure had a substantial effect on the endogenous structure [71]. The assessment score, f2, is the inclusion of exogenous variables and the criterion for judging—from large to small, these are 0.35, 0.15, and 0.02. When the effect of influence is less than 0.02, this means that the omitted data does not affect the endogenous structure [54]. From Table 9, it can be seen that, among the effects of the endogenous factor variables, the effect of OR on AXRS had the lowest effect of only 0.021, but this was above the threshold. The effect of ATB on XRU was very high, at 0.489.

5.2.5. Importance Performance Map

Importance performance map analysis (IPMA) is a special-value-representation tool for the impact assessment of potential variables on target variables [65]. PLS-SEM results were measured through path coefficients. The mean of the endogenous variables of the PLS path needs to be considered. IPMA relies on the total effect and the new endogenous latent variable scores. As can be seen in Table 10, the total effects were all greater than the threshold value of 0.02, where ATB had a positive effect on AXRS. In terms of performance value, the standard value was greater than 60, and the average latent variable mean value was 69.656.

6. Findings and Discussion

The results of the data analysis showed that behavioral attitudes and extended reality usefulness had a positive impact on patients’ choice to use the XR procedure, but the validity of the two effects differed. Extended reality usefulness is the practical benefit which is a tangible effect [18], and attitude toward a behavior is just a mindset [72]. In the study, it was found that patients’ attitudes towards behaviors had a higher impact than the usefulness of extended reality. The XR system allows patients to watch a video of a similar case surgery from a first-person view while simulating their procedure through a virtual surgery system. They can go through each step of the procedure with the surgeon’s explanation. The usefulness of XR surgery is directly felt by the patient in terms of reducing presurgical stress, as the virtual surgery experience allows the patient to understand the procedure and the associated risks more precisely [73,74]. It eliminates ignorance and anxiety about unknown things. It helps to keep the patient’s blood pressure stable and their heart rate normal before surgery [75]. These aspects provide a better physiological environment to ensure that the surgery is performed successfully. This shows that H1, H2, H3, and H4 are supported. In terms of operational value, XR technology can use external data and images combined with human medical graphics to construct three-dimensional images, which improves image visualization and facilitates surgical operations [76,77]. H5 is supported. The reduction in surgical risk lies in the ability of the surgical specialist to free their hands, keep them on the operating table, and focus their eyes. H6 is supported. The patient’s trust in XR surgery depends on passive trust, perceived judgment through experience, and results given by the surgeon [7]. Recognition of the value of XR surgery is a prerequisite for patients to undergo a given procedure. The data shows that patients are willing to accept the new smart surgery. This suggests that H7 is supported. It is clear from the data that the risk of surgery has a much greater impact on patients’ behavioral attitudes than the value and trust of the procedure. Patients are more focused on the reduction in the risk factor. The removal of tension is one way of ensuring that patients are physiologically balanced. In psychology, people feel tension within themselves about things that are not clear. Some patients can regulate their mental health through self-regulation, but others are over-stressed, which causes a physical stress response. This supports H8 and H9. Furthermore, in Kapikiran et al.’s study, head-mounted displays were effective in reducing anxiety in pretransplant patients, and video viewing with head-mounted displays was more effective than normal video viewing [52].
The present study has shown that the method of using VR/MR virtual surgery demonstrations combined with physician presentations is superior to traditional preoperative information, transforming cold, impotent verbal communication into actionable 3D image demonstrations, combined with physician presentations, for a more in-depth experience of the safety and feasibility of the procedure. Not only does this method dispel the patient’s concerns about surgery, but it also enhances the patient’s trust in the surgeon. It reflects the value of the operation together with trust. The avoidance of surgical risks lies in the simulation of surgery, the user of the unfamiliar equipment can use reminders, and can always be supervised in conducting surgery [78]. Through the first-person view presented by the video, the patient can observe the doctor’s operation, and can be assured that the operation will be carried out with the simultaneous monitoring of the system, as opposed to the doctor being the only one monitoring the surgery. This is like a student who is being observed both by an invigilator and by a camera for double monitoring during an exam, which greatly reduces the likelihood of cheating on the exam. Similarly, the probability of surgical risk is reduced [79]. There are two main reasons for changes in a patient’s mood: one is distrust in the doctor’s surgery capabilities, and the other is a lack of knowledge of the surgery. The enhancement of trust in the physician has been mentioned above. The lack of knowledge of the surgery can be improved indirectly through a doctor’s narration, without visualization; however, virtual technology solves this problem perfectly, and the immersive experience can bring the patient close to the real environment. So, the relationship between the variables is interactive, and has a positive effect on presurgical preparation.

7. Conclusions and Future Works

The focus of this study was to explore patients’ attitudes towards the use of XR surgery. Due to the scarcity of relevant information, a single study method was not appropriate. A triangulated mixed research method was used to better ensure the implementation of the experiment. The current study used the previously proposed technical behavioral model, which was built on the theoretical basis of the TAM and TPB. It can make up for the shortcomings of both models and is more suitable for research on technology-altered human behavior. The important contribution of the current study is in altering patient attitudes toward the use of the new technology for surgery, presenting a view of the impact of XR technology from patient perspectives. It provides patient perspectives on the future implementation of smart surgery. The limitations of this study are as follows: this study was limited by geography, and data collection was only conducted in Malaysia; patients experienced XR technology with only some skills of the technology and not the full functionality of the system; finally, extended reality surgery should be used in more detailed surgical studies in the future, in order to meet patients’ needs for surgery preparation.

Author Contributions

Conceptualization, P.S.J. and X.G.; methodology, X.G.; software, X.G.; validation, P.S.J. and X.G.; formal analysis, X.G.; investigation, X.G.; resources, X.G.; data curation, X.G.; writing—original draft preparation, X.G.; writing—review and editing, X.G.; visualization, X.G.; supervision, P.S.J.; project administration, X.G.; funding acquisition, P.S.J. All authors have read and agreed to the published version of the manuscript.

Funding

This research received no external funding.

Informed Consent Statement

Written informed consent has been obtained from the patients to publish this paper.

Data Availability Statement

Data are withheld for research purposes.

Conflicts of Interest

The authors declare no conflict of interest.

References

  1. Ayers, B.; Kilic, A. Extended Reality Platforms: A Technological Solution Still Finding the Right Problem. Ann. Thorac. Surg. 2022, 113, 691. [Google Scholar] [CrossRef] [PubMed]
  2. Costantino, A.; Caprioli, F.; Elli, L.; Roncoroni, L.; Stocco, D.; Doneda, L.; Nandi, N.; Conforti, F.S.; Noviello, D.; Penagini, R.; et al. Determinants of patient trust in gastroenterology televisits: Results of machine learning analysis. Inform. Med. Unlocked 2022, 29, 100867. [Google Scholar] [CrossRef]
  3. Klinker, K.; Wiesche, M.; Krcmar, H. Smart glasses in health care: A patient trust perspective. In Proceedings of the 53rd Hawaii International Conference on System Sciences, Maui, HI, USA, 7–10 January 2020. [Google Scholar]
  4. Cho, H.E.; Billig, J.I.; Byrnes, M.E.; Haase, S.C.; Waljee, J.F.; Chung, K.C. Trust and Distrust in Opioid Decision-Making: A Qualitative Assessment of Patient-Doctor Relationship. J. Hand. Surg. Am. 2022, 47, 151–159.e1. [Google Scholar] [CrossRef]
  5. Dario, P.; Hannaford, B.; Menciassi, A. Smart surgical tools and augmenting devices. IEEE Trans. Robot. Autom. 2003, 19, 782–792. [Google Scholar] [CrossRef]
  6. Gong, X.; JosephNg, P.S. Technology Behavior Model—Beyond Your Sight with Extended Reality in Surgery. Appl. Syst. Innov. 2022, 5, 35. [Google Scholar] [CrossRef]
  7. DePalma, L.J.; Olsen, L.D.; Evans, J.H. Patient narratives of hope in stem cell technologies: Trust in biomedicine and the body’s natural ability to heal itself. Health 2021, 13634593211046834. [Google Scholar] [CrossRef]
  8. Hu, H.; Gong, H.; Wu, X.; Wu, X. Effect of patient-provider communication on patient risk awareness: The moderating role of trust based on scenario experiment. Psych J. 2022. [Google Scholar] [CrossRef] [PubMed]
  9. Gagandeep, S.; Tejasvi, K.; Nihal, M.; Shubham, J.; Anatoliy, V.; Vadim, S.; Prateek, P.; Sunil, M. Long-term solutions in neurosurgery using extended reality technologies. Neurosurg. Focus 2021, 51, E2. [Google Scholar] [CrossRef]
  10. Lareyre, F.; Chaudhuri, A.; Adam, C.; Carrier, M.; Mialhe, C.; Raffort, J. Applications of Head-Mounted Displays and Smart Glasses in Vascular Surgery. Ann. Vasc. Surg. 2021, 75, 497–512. [Google Scholar] [CrossRef]
  11. Lin, T.; Huang, L.; Hannaford, B.; Tran, C.; Raiti, J.; Zaragoza, R.; Feng, T.; Wagner, L.; James, J. Empathics system. In Proceedings of the 13th ACM International Conference on PErvasive Technologies Related to Assistive Environments, Corfu, Greece, 30 June–3 July 2020; pp. 1–4. [Google Scholar]
  12. Lungu, A.J.; Swinkels, W.; Claesen, L.; Tu, P.; Egger, J.; Chen, X. A review on the applications of virtual reality, augmented reality and mixed reality in surgical simulation: An extension to different kinds of surgery. Expert. Rev. Med. Devices 2021, 18, 47–62. [Google Scholar] [CrossRef]
  13. Sadeghi, A.H.; Mathari, S.E.; Abjigitova, D.; Maat, A.; Taverne, Y.; Bogers, A.; Mahtab, E.A.F. Current and Future Applications of Virtual, Augmented, and Mixed Reality in Cardiothoracic Surgery. Ann. Thorac. Surg. 2022, 113, 681–691. [Google Scholar] [CrossRef] [PubMed]
  14. Pei, H.; Huang, X.; Ding, M. Image visualization: Dynamic and static images generate users’ visual cognitive experience using eye-tracking technology. Displays 2022, 73, 102175. [Google Scholar] [CrossRef]
  15. Korečko, Š.; Hudák, M.; Sobota, B.; Sivý, M.; Pleva, M.; Steingartner, W. Experimental Performance Evaluation of Enhanced User Interaction Components for Web-Based Collaborative Extended Reality. Appl. Sci. 2021, 11, 3811. [Google Scholar] [CrossRef]
  16. van der Linde-van den Bor, M.; Frans-Rensen, S.A.; Slond, F.; Liesdek, O.C.D.; de Heer, L.M.; Suyker, W.J.L.; Jaarsma, T.; Weldam, S.W.M. Patients’ voices in the development of pre-surgical patient education using virtual reality: A qualitative study. PEC Innov. 2022, 1, 100015. [Google Scholar] [CrossRef]
  17. Xi, N.; Bampouni, E.; Hamari, J. How Does Extended Reality Influence Consumer Decision Making? The Empirical Evidence from A Laboratory Experiment. In Proceedings of the 55th Hawaii International Conference on System Sciences, Maui, HI, USA, 4–7 January 2022. [Google Scholar]
  18. Mikami, B.S.; Hynd, T.E.; Lee, U.Y.; DeMeo, J.; Thompson, J.D.; Sokiranski, R.; Doll, S.; Lozanoff, S. Extended reality visualization of medical museum specimens: Online presentation of conjoined twins curated by Dr. Jacob Henle between 1844–1852. Transl. Res. Anat. 2022, 27, 100171. [Google Scholar] [CrossRef]
  19. Hu, L.; Chen, M.; Liu, P.X.; Xu, S. A vortex method of 3D smoke simulation for virtual surgery. Comput. Methods Programs Biomed. 2021, 198, 105813. [Google Scholar] [CrossRef]
  20. Klaib, A.F.; Alsrehin, N.O.; Melhem, W.Y.; Bashtawi, H.O.; Magableh, A.A. Eye tracking algorithms, techniques, tools, and applications with an emphasis on machine learning and Internet of Things technologies. Expert. Syst. Appl. 2021, 166, 114037. [Google Scholar] [CrossRef]
  21. Tesfamikael, H.H.; Fray, A.; Mengsteab, I.; Semere, A.; Amanuel, Z. Simulation of Eye Tracking Control based Electric Wheelchair Construction by Image Segmentation Algorithm. J. Innov. Image Proc. 2021, 3, 21–35. [Google Scholar] [CrossRef]
  22. Kapp, S.; Barz, M.; Mukhametov, S.; Sonntag, D.; Kuhn, J. ARETT: Augmented Reality Eye Tracking Toolkit for Head Mounted Displays. Sensors 2021, 21, 2234. [Google Scholar] [CrossRef]
  23. Qian, K.; Arichi, T.; Price, A.; Dall’Orso, S.; Eden, J.; Noh, Y.; Rhode, K.; Burdet, E.; Neil, M.; Edwards, A.D.; et al. An eye tracking based virtual reality system for use inside magnetic resonance imaging systems. Sci. Rep. 2021, 11, 16301. [Google Scholar] [CrossRef]
  24. Karargyris, A.; Kashyap, S.; Lourentzou, I.; Wu, J.T.; Sharma, A.; Tong, M.; Abedin, S.; Beymer, D.; Mukherjee, V.; Krupinski, E.A.; et al. Creation and validation of a chest X-ray dataset with eye-tracking and report dictation for AI development. Sci. Data 2021, 8, 92. [Google Scholar] [CrossRef] [PubMed]
  25. Dimigen, O.; Ehinger, B.V. Regression-based analysis of combined EEG and eye-tracking data: Theory and applications. J. Vis. 2021, 21, 3. [Google Scholar] [CrossRef] [PubMed]
  26. Palaniappan, P.; Meyer, S.; Radler, M.; Kamp, F.; Belka, C.; Riboldi, M.; Parodi, K.; Gianoli, C. X-ray CT adaptation based on a 2D-3D deformable image registration framework using simulated in-room proton radiographies. Phys. Med. Biol. 2022, 67, 045003. [Google Scholar] [CrossRef] [PubMed]
  27. Ge, Y.; Zhang, Q.; Sun, Y.; Shen, Y.; Wang, X. Grayscale medical image segmentation method based on 2D&3D object detection with deep learning. BMC Med. Imaging 2022, 22, 33. [Google Scholar]
  28. Miyashita, Y.; Sawahata, Y.; Komine, K. Perceptual Assessment of Image and Depth Quality of Dynamically Depth-compressed Scene for Automultiscopic 3D Display. IEEE Trans. Vis. Comput. Graph 2022, 1–15. [Google Scholar] [CrossRef]
  29. Ye, R.Z.; Noll, C.; Richard, G.; Lepage, M.; Turcotte, E.E.; Carpentier, A.C. DeepImageTranslator: A free, user-friendly graphical interface for image translation using deep-learning and its applications in 3D CT image analysis. SLAS Technol. 2022, 27, 76–84. [Google Scholar] [CrossRef]
  30. Dhou, S.; Alkhodari, M.; Ionascu, D.; Williams, C.; Lewis, J.H. Fluoroscopic 3D Image Generation from Patient-Specific PCA Motion Models Derived from 4D-CBCT Patient Datasets: A Feasibility Study. J. Imaging 2022, 8, 17. [Google Scholar] [CrossRef]
  31. Chen, Q.Q.; Sun, Z.H.; Wei, C.F.; Wu, E.Q.; Ming, D. Semi-supervised 3D Medical Image Segmentation Based on Dual-task Consistent joint Learning and Task-Level Regularization. IEEE/ACM Trans. Comput. Biol. Bioinform. 2022. [Google Scholar] [CrossRef]
  32. Jang, J.; Ko, Y.; Shin, W.S.; Han, I. Augmented Reality and Virtual Reality for Learning: An Examination Using an Extended Technology Acceptance Model. IEEE Access 2021, 9, 6798–6809. [Google Scholar] [CrossRef]
  33. Unal, E.; Uzun, A.M. Understanding university students’ behavioral intention to use Edmodo through the lens of an extended technology acceptance model. Br. J. Educ. Technol. 2020, 52, 619–637. [Google Scholar] [CrossRef]
  34. Yuen, K.F.; Cai, L.; Qi, G.; Wang, X. Factors influencing autonomous vehicle adoption: An application of the technology acceptance model and innovation diffusion theory. Technol. Anal. Strateg. Manag. 2020, 33, 505–519. [Google Scholar] [CrossRef]
  35. Murillo, G.G.; Novoa-Hernández, P.; Rodríguez, R.S. Technology Acceptance Model and Moodle: A systematic mapping study. Inf. Dev. 2020, 37, 617–632. [Google Scholar] [CrossRef]
  36. Alsharida, R.A.; Hammood, M.M.; Al-Emran, M. Mobile Learning Adoption: A Systematic Review of the Technology Acceptance Model from 2017 to 2020. Int. J. Emerg. Technol. Learn. 2021, 16, 147–162. [Google Scholar] [CrossRef]
  37. Alfadda, H.A.; Mahdi, H.S. Measuring Students’ Use of Zoom Application in Language Course Based on the Technology Acceptance Model (TAM). J. Psycholinguist. Res. 2021, 50, 883–900. [Google Scholar] [CrossRef]
  38. Fussell, S.G.; Truong, D. Using virtual reality for dynamic learning: An extended technology acceptance model. Virtual Real. 2022, 26, 249–267. [Google Scholar] [CrossRef]
  39. Ajzen, I. The theory of planned behavior: Frequently asked questions. Hum. Behav. Emerg. Technol. 2020, 2, 314–324. [Google Scholar] [CrossRef]
  40. Sok, J.; Borges, J.R.; Schmidt, P.; Ajzen, I. Farmer Behaviour as Reasoned Action: A Critical Review of Research with the Theory of Planned Behaviour. J. Agric. Econ. 2020, 72, 388–412. [Google Scholar] [CrossRef]
  41. McTaggart-Cowan, H.; Bentley, C.; Raymakers, A.; Metcalfe, R.; Hawley, P.; Peacock, S. Understanding cancer survivors’ reasons to medicate with cannabis: A qualitative study based on the theory of planned behavior. Cancer Med. 2021, 10, 396–404. [Google Scholar] [CrossRef]
  42. Bosnjak, M.; Ajzen, I.; Schmidt, P. The Theory of Planned Behavior: Selected Recent Advances and Applications. Eur. J. Psychol. 2020, 16, 352–356. [Google Scholar] [CrossRef]
  43. Fan, C.W.; Chen, I.H.; Ko, N.Y.; Yen, C.F.; Lin, C.Y.; Griffiths, M.D.; Pakpour, A.H. Extended theory of planned behavior in explaining the intention to COVID-19 vaccination uptake among mainland Chinese university students: An online survey study. Hum. Vaccin. Immunother. 2021, 17, 3413–3420. [Google Scholar] [CrossRef]
  44. JosephNg, P.S. EaaS Optimization: Available yet hidden information technology infrastructure inside medium size enterprise. Technol. Forecast. Soc. Chang. 2018, 132, 165–173. [Google Scholar] [CrossRef]
  45. Hagger, M.S.; Cheung, M.W.; Ajzen, I.; Hamilton, K. Perceived behavioral control moderating effects in the theory of planned behavior: A meta-analysis. Health Psychol. 2022, 41, 155–167. [Google Scholar] [CrossRef] [PubMed]
  46. Hall, P.A.; Sheeran, P.; Fong, G.T.; Cheah, C.S.L.; Oremus, M.; Liu-Ambrose, T.; Sakib, M.N.; Butt, Z.A.; Ayaz, H.; Jandu, N.; et al. Biobehavioral Aspects of the COVID-19 Pandemic: A Review. Psychosom. Med. 2021, 83, 309–321. [Google Scholar] [CrossRef] [PubMed]
  47. Shmueli, L. Predicting intention to receive COVID-19 vaccine among the general population using the health belief model and the theory of planned behavior model. BMC Public Health 2021, 21, 804. [Google Scholar] [CrossRef] [PubMed]
  48. Murillo, R.; Fernandez-Deaza, G.; Zuluaga, M.; Lewison, G.; Usgame-Zubieta, D.; Usgame-Zubieta, I.D.; Manrique, M.M. Cancer Research in the Time of COVID-19: A Colombian Narrative. Front. Public Health 2021, 9, 750755. [Google Scholar] [CrossRef]
  49. Pittig, A.; Hoyer, J.; Noack, R. Smart-Glass Guided Exposure for Anxiety Disorders: A Proof-of-Concept Study. Cogn. Behav. Pract. 2021, 28, 364–378. [Google Scholar] [CrossRef]
  50. Bai, L.; Li, Y.; Cen, M.; Hu, F. 3D Instance Segmentation and Object Detection Framework Based on the Fusion of Lidar Remote Sensing and Optical Image Sensing. Remote Sens. 2021, 13, 3288. [Google Scholar] [CrossRef]
  51. Baldoto Gava Chakr, V.C. Building up trust in the doctor-patient relationship. Andes Pediatr. 2021, 92, 480–482. [Google Scholar] [CrossRef]
  52. Kapikiran, G.; Bulbuloglu, S.; Saritas, S. The Effect of Video Training before Organ Transplant Surgery on Patient Satisfaction and Anxiety: Head Mounted Display Effect. Clin. Simul. Nurs. 2022, 62, 99–106. [Google Scholar] [CrossRef]
  53. Rutkowski, S.; Czech, O.; Wrzeciono, A.; Kiper, P.; Szczepanska-Gieracha, J.; Malicka, I. Virtual reality as a chemotherapy support in treatment of anxiety and fatigue in patients with cancer: A systematic review and meta-analysis and future research directions. Complement. Med. 2021, 61, 102767. [Google Scholar] [CrossRef]
  54. Basco, R.; Hair, J.F.; Ringle, C.M.; Sarstedt, M. Advancing family business research through modeling nonlinear relationships: Comparing PLS-SEM and multiple regression. J. Fam. Bus. Strategy 2021. [Google Scholar] [CrossRef]
  55. Low, M.P.; Cham, T.H.; Chang, Y.S.; Lim, X.J. Advancing on weighted PLS-SEM in examining the trust-based recommendation system in pioneering product promotion effectiveness. Qual. Quant. 2021, 1–30. [Google Scholar] [CrossRef] [PubMed]
  56. Hair, J.F.; Sarstedt, M.; Ringle, C.M.; Mena, J.A. An assessment of the use of partial least squares structural equation modeling in marketing research. J. Acad. Mark. Sci. 2011, 40, 414–433. [Google Scholar] [CrossRef]
  57. Dash, G.; Paul, J. CB-SEM vs PLS-SEM methods for research in social sciences and technology forecasting. Technol. Forecast. Soc. Chang. 2021, 173, 121092. [Google Scholar] [CrossRef]
  58. Yoo, W.; Yu, E.; Jung, J. Drone delivery: Factors affecting the public’s attitude and intention to adopt. Telemat. Inform. 2018, 35, 1687–1700. [Google Scholar] [CrossRef]
  59. Astrachan, C.B.; Patel, V.K.; Wanzenried, G. A comparative study of CB-SEM and PLS-SEM for theory development in family firm research. J. Fam. Bus. Strategy 2014, 5, 116–128. [Google Scholar] [CrossRef]
  60. Ali, S.; Javed, H.M.U.; Danish, M. Adoption of green IT in Pakistan: A comparison of three competing models through model selection criteria using PLS-SEM. Env. Sci. Pollut. Res. Int. 2021, 28, 36174–36192. [Google Scholar] [CrossRef]
  61. Min, J.; Iqbal, S.; Khan, M.A.S.; Akhtar, S.; Anwar, F.; Qalati, S.A. Impact of supervisory behavior on sustainable employee performance: Mediation of conflict management strategies using PLS-SEM. PLoS ONE 2020, 15, e0236650. [Google Scholar] [CrossRef]
  62. Manley, S.C.; Hair, J.F.; Williams, R.I.; McDowell, W.C. Essential new PLS-SEM analysis methods for your entrepreneurship analytical toolbox. Int. Entrep. Manag. J. 2020, 17, 1805–1825. [Google Scholar] [CrossRef]
  63. Li, Z.; Wei, Y.; Li, Y.; Wang, Z.; Zhang, J. China’s Provincial Eco-Efficiency and Its Driving Factors-Based on Network DEA and PLS-SEM Method. Int. J. Env. Res Public Health 2020, 17, 8702. [Google Scholar] [CrossRef]
  64. Hidayanto, A.N.; Anggorojati, B.; Abidin, Z.; Phusavat, K. Data modeling positive security behavior implementation among smart device users in Indonesia: A partial least squares structural equation modeling approach (PLS-SEM). Data Brief 2020, 30, 105588. [Google Scholar]
  65. Li, X.; Du, J.; Long, H. Mechanism for Green Development Behavior and Performance of Industrial Enterprises (GDBP-IE) Using Partial Least Squares Structural Equation Modeling (PLS-SEM). Int. J. Env. Res Public Health 2020, 17, 8450. [Google Scholar] [CrossRef] [PubMed]
  66. JosephNg, P. EaaS infrastructure disruptor for MSE. Int. J. Bus. Inf. Syst. 2019, 30, 373–385. [Google Scholar]
  67. Lin, L.; Huang, Z.; Othman, B.; Luo, Y. Let’s make it better: An updated model interpreting international student satisfaction in China based on PLS-SEM approach. PLoS ONE 2020, 15, e0233546. [Google Scholar] [CrossRef]
  68. Hair, J.F.; Astrachan, C.B.; Moisescu, O.I.; Radomir, L.; Sarstedt, M.; Vaithilingam, S.; Ringle, C.M. Executing and interpreting applications of PLS-SEM: Updates for family business researchers. J. Fam. Bus. Strategy 2021, 12, 100392. [Google Scholar] [CrossRef]
  69. Martínez, M.d.C.V.; Cervantes, P.A.M. (Eds.) Partial Least Squares Structural Equation Modeling (PLS-SEM) Applications in Economics and Finance; MDPI AG: Basel, Switzerland, 2021. [Google Scholar]
  70. Hair, J.F.; Hult, G.T.M.; Ringle, C.M.; Sarstedt, M. A Primer on Partial Least Squares Structural Equation Modeling (PLS-SEM), 3rd ed.; SAGE: Los Angeles, CA, USA, 2022. [Google Scholar]
  71. Hair, J.F., Jr.; Hult, G.T.M.; Ringle, C.M.; Sarstedt, M.; Danks, N.P.; Ray, S. Partial Least Squares Structural Equation Modeling (PLS-SEM) Using R: A Workbook, 1st ed.; Springer International Publishing: Cham, Switzerland, 2021. [Google Scholar]
  72. Anggraini, R.D.S.; Patricia, P. Pengaruh Attitude Toward Behavior, Perceived Behavioral Control, dan Subjective Norm terhadap Entrepreneurial Intention Mahasiswa Non-Ekonomi. Ekon. Dan Bisnis 2019, 5, 96–105. [Google Scholar] [CrossRef] [Green Version]
  73. Alizadehsalehi, S.; Hadavi, A.; Huang, J.C. From BIM to extended reality in AEC industry. Autom. Constr. 2020, 116, 103254. [Google Scholar] [CrossRef]
  74. Taylor, L.; Dyer, T.; Al-Azzawi, M.; Smith, C.; Nzeako, O.; Shah, Z. Extended reality anatomy undergraduate teaching: A literature review on an alternative method of learning. Ann. Anat. Anat. Anz. 2022, 239, 151817. [Google Scholar] [CrossRef]
  75. Gong, X.; Wong, A.H.; Daronovna, R.K.; JosephNg, P. Beyond Human Eye in Surgical Smart Glasses. In Proceedings of the 5th International Conference on Algorithms, Computing and Systems, Xi’an, China, 24–26 September 2021; pp. 135–139. [Google Scholar]
  76. Ratcliffe, J.; Soave, F.; Bryan-Kinns, N.; Tokarchuk, L.; Farkhatdinov, I. Extended Reality (XR) Remote Research: A Survey of Drawbacks and Opportunities. In Proceedings of the 2021 CHI Conference on Human Factors in Computing Systems, New York, NY, USA; 2021; pp. 1–13. [Google Scholar] [CrossRef]
  77. Kim, A.S.; Cheng, W.C.; Beams, R.; Badano, A. Color Rendering in Medical Extended-Reality Applications. J. Digit. Imaging 2021, 34, 16–26. [Google Scholar] [CrossRef]
  78. Tabrizi, S.; Trippa, L.; Cagney, D.; Aizer, A.A.; Tanguturi, S.; Ventz, S.; Fell, G.; Bellon, J.R.; Mamon, H.; Nguyen, P.L. Assessment of simulated SARS-CoV-2 infection and mortality risk associated with radiation therapy among patients in 8 randomized clinical trials. JAMA Netw. Open 2021, 4, e213304. [Google Scholar] [CrossRef]
  79. Turani, A.A.; Alkhateeb, J.H.; Alsewari, A.A. Students Online Exam Proctoring: A Case Study Using 360 Degree Security Cameras. In Proceedings of the 2020 Emerging Technology in Computing, Communication and Electronics (ETCCE), Dhaka, Bangladesh, 21–22 December 2020; pp. 1–5. [Google Scholar]
Figure 1. Hypotheses and TBM.
Applsci 12 05607 g001
Figure 2. Number of questionnaires collected over time.
Applsci 12 05607 g002
Figure 3. Result of hypotheses testing. * Significant at 5% level, p < 0.05. ** Significant at 1% level, p < 0.01. *** Significant at 0.1% level.
Applsci 12 05607 g003
Table 1. Demographic analysis.
Demographic CharacteristicOptionsCountsPercentage (%)
GenderMale16454.67%
Female13645.33%
Age20–35237.67%
36–456321.00%
46–559130.33%
Older than 5612341.00%
Marital statusSingle5217.33%
Married24882.77%
EducationJunior and lower113.67%
High school4715.67%
Undergraduate15351.00%
Postgraduate8929.67%
IncomeLess than MYR 300062.00%
MYR 3000–50008929.67%
MYR 5000–800011839.33%
MYR 8000–100005217.33%
More than MYR 10,0003511.67%
Table 2. Common-method bias factor.
Latent
Construct
IndicatorsSubstantive Factor Loading (Ra)Substantial
Variance Square
(Ra2)
Method Factor Loading (Rb)Method Variance Square
(Rb2)
ATBATB10.92590.8572910.09090.008263 ***
ATB20.92790.860998−0.14510.021054 **
ATB30.89640.8035330.04940.002440 NS
OROR10.92870.862484−0.05530.003058 NS
OR20.91730.8414390.24140.058274 *
OR30.93240.86937−0.18860.035570 **
OVOV10.89970.809460.03320.001102 ***
OV20.94040.8843520.02610.000681 NS
OV30.91060.829192−0.05990.003588 ***
TSTS10.92760.860442−0.07530.005670 ***
TS20.92490.855440.04970.002470 ***
TS30.90330.8159510.02550.000650 NS
AXRSAXRS10.89020.7924560.05880.003457 ***
AXRS20.93720.878344−0.12750.016256 **
AXRS30.93560.8753470.06770.004583 ***
TRTR10.93510.874412−0.00220.000005 NS
TR20.94610.895105−0.03090.000955 NS
TR30.92430.854330.03360.001129 ***
XRUXRU10.89920.808561−0.11050.012210 **
XRU20.91780.8423570.10670.011385 **
XRU30.94310.889438−0.00390.000015 NS
AVD 0.850491 0.009182 ***
Notes: ATB—attitude toward behavior; OR—operation risk; OV—operation value; TS—tension; AXRS—acceptance of extended reality smart glasses surgery; TR—trust; XRU—extended reality usefulness. *** p < 0.001; ** p < 0.01; * p < 0.05; NS—insignificant.
Table 3. Convergent validity and construct reliability.
Latent
Construct
ItemsLoadingsStandard
Deviation
RhoA (ρA)Composite
Reliability
Average Variance Extracted (AVE)
ATBATB10.9270.3640.9070.9400.840
ATB20.925
ATB30.898
OROR10.9300.360.9260.9470.857
OR20.923
OR30.924
OVOV10.9010.3630.9070.9410.841
OV20.941
OV30.909
TSTS10.9230.3630.9100.9420.844
TS20.922
TS30.910
AXRSAXRS10.8930.3620.9150.9440.848
AXRS20.933
AXRS30.937
TRTR10.9340.3560.9290.9540.875
TR20.945
TR30.927
XRUXRU10.8900.3620.9220.9430.846
XRU20.925
XRU30.944
Notes: ATB—attitude toward behavior; OR—operation risk; OV—operation value; TS—tension; AXRS—acceptance of extended Reality Smart Glasses Surgery; TR—trust; XRU—extended reality usefulness.
Table 4. Hetero trait–mono trait (HTMT).
Latent ConstructATBOROVTSAXRSTRXRU
ATB
OR0.743
OV0.6490.678
TS0.5970.6240.625
AXRS0.7720.6420.6540.684
TR0.6380.6650.5410.4360.601
XRU0.6620.6500.5700.5190.6420.622
Notes: ATB—attitude toward behavior; OR—operation risk; OV—operation value; TS—tension; AXRS—acceptance of extended reality smart glasses surgery; TR—trust; XRU—extended reality usefulness.
Table 5. Hetero trait–mono trait (HTMT inference).
Latent Construct Original Sample (O) Sample Mean (M) Bias2.50%97.50%
ATB -> AXRS0.6720.671−0.0010.5880.746
ATB -> XRU0.4880.4880.0000.3700.597
XRU -> ATB0.1920.192−0.0010.0920.298
OR -> ATB0.3500.348−0.0020.2450.466
OR -> AXRS0.2350.234−0.0010.1630.320
OR -> XRU0.1710.170−0.0010.1090.246
OV -> ATB0.1720.1720.0010.0520.287
OV -> AXRS0.1150.1160.0010.0360.200
OV -> XRU0.0840.0850.0010.0250.153
TS -> ATB0.1580.156−0.0020.0640.257
TS -> AXRS0.1630.1630.0000.0920.243
TS -> XRU0.2910.289−0.0020.1870.401
TR -> ATB0.2200.2240.0030.1230.322
TR -> AXRS0.1480.1500.0020.0820.219
TR -> XRU0.1080.1090.0020.0580.168
XRU -> AXRS0.2650.2660.0010.1360.389
Notes: ATB—attitude toward behavior; OR—operation risk; OV—operation value; TS—tension; AXRS—acceptance of extended reality smart glasses surgery; TR—trust; XRU—extended reality usefulness.
Table 6. Hypothetical structure model.
HypPLS PathsOriginal Sample (O)Sample Mean (M)Standard
Deviation (STDEV)
T Statistics (O/STDEV)p Values2.5%97.5%Remarks
H1ATB -> AXRS0.5430.5420.0618.9430.000 ***0.4180.656YES
H2ATB -> XRU0.4880.4880.0588.4170.000 ***0.3730.601YES
H3XRU -> AXRS0.2650.2660.0644.1520.000 ***0.1390.391YES
H4XRU -> ATB0.1920.1920.0533.6250.000 ***0.0900.296YES
H5OV -> ATB0.1410.1420.0562.5390.011 *0.0330.252YES
H6OR -> ATB0.3030.3020.0525.8020.000 ***0.2010.405YES
H7TR -> ATB0.1650.1670.0543.0630.002 **0.0640.275YES
H8TS -> ATB0.1320.1300.0482.7660.006 **0.0360.222YES
H9TS -> XRU0.4790.4770.0588.2790.000 ***0.3580.585YES
Notes: ATB—attitude toward behavior; OR—operation risk; OV—operation value; TS—tension; AXRS—acceptance of extended reality smart glasses surgery; TR—trust; XRU—extended reality usefulness. * Significant at 5% level, p < 0.05. ** Significant at 1% level, p < 0.01. *** Significant at 0.1% level, p < 0.001.
Table 7. Predictive relevance.
Endogenous
Construct
SSOSSEQ2 (=1−SSE/SSO)Predictive
Relevance
ATB3600.0001694.5720.529Q2 > 0
OR900.000298.1450.669Q2 > 0
OV900.000323.7520.640Q2 > 0
TS900.000319.0770.645Q2 > 0
AXRS6300.0003140.9990.501Q2 > 0
TR 900.000271.1900.699Q2 > 0
XRU5400.0002721.8100.496Q2 > 0
Notes: ATB—attitude toward behavior; OR—operation risk; OV—operation value; TS—tension; AXRS—acceptance of extended reality smart glasses surgery; TR—trust; XRU—extended reality usefulness.
Table 8. PLS prediction results.
AXRSPLS-SEMLinear Model Benchmark
Q2_PredictRMSEMAEQ2_PredictRMSEMAE
AXRS10.4430.7780.6520.5760.6780.549
AXRS30.4040.8330.6870.450.80.654
AXRS20.3840.7960.6630.5260.6980.579
Notes: AXRS—acceptance of extended reality smart glasses surgery.
Table 9. Effect size (f2).
Predictor Construct/
Dependent Construct
ATBOROVTSAXRSTRXRU
ATB 0.349 0.489
OR0.407 0.021
OV0.226 0.120
TS 0.266 0.213
TR0.221 0.120
XRU0.211 0.135
Notes: ATB—attitude toward behavior; OR—operation risk; OV—operation value; TS—tension; AXRS—acceptance of extended reality smart glasses surgery; TR—trust; XRU—extended reality usefulness.
Table 10. Importance performance map results.
Importance
(Total Effect)
Importance
(Total Effect)
Performances
(Index Value)
ATB0.54371.566
OR0.16576.395
OV0.07665.287
TS0.24965.264
TR0.09070.847
XRU0.36968.576
Mean Value0.24969.656
Notes: ATB—attitude toward behavior; OR—operation risk; OV—operation value; TS—tension; TR—trust; XRU—extended reality usefulness.
Publisher’s Note: MDPI stays neutral with regard to jurisdictional claims in published maps and institutional affiliations.

