Article

Study on the Effect of Different Transcranial Pulse Current Stimulation Intervention Programs for Eliminating Physical Fatigue

1
College of Sports Science, Nantong University, Nantong 226019, China
2
China Institute of Sport Science, Beijing 100061, China
*
Author to whom correspondence should be addressed.
Appl. Sci. 2022, 12(11), 5609; https://doi.org/10.3390/app12115609
Submission received: 1 April 2022 / Revised: 27 May 2022 / Accepted: 28 May 2022 / Published: 31 May 2022

Abstract

:
Previous studies have reported the effect of transcranial pulsed current stimulation (tPCS) on eliminating cognitive fatigue, but there is little research on optimizing the intervention program of tPCS. The purpose of this study was to explore the effect of different tPCS intervention programs on the elimination of physical fatigue in college athletes. Accordingly, 40 healthy college athletes were randomly divided into two groups of 20, denoted as A and B. Both groups exercised on treadmills. There were 15 subjects in group A who met the criteria of moderate physical fatigue, and 15 subjects in group B who met the criteria of severe physical fatigue. The subjects in each group were intervened with five different intervention programs of tPCS (intervention programs I, II, III, IV and V). The heart rate variability (HRV) and concentrations of oxygenated hemoglobin (HbO2) were measured before and after each intervention to judge the elimination effects of different intervention programs on different degrees of physical fatigue; the measurement indicators of the HRV include RMSSD, SDNN, HF and LF. The results indicated that tPCS intervention can eliminate both moderate and severe physical fatigue. Programs II, III, and IV had a significant effect on eliminating the moderate physical fatigue of athletes (p < 0.05), among which program II, with a stimulation time of 30 min and a stimulation intensity of sensory intensity, had the best effect. Programs I, II, III, and IV all had significant effects on eliminating the severe physical fatigue of athletes (p < 0.05), among which program I, with a stimulation time of 30 min and a stimulation intensity of sensory intensity + 0.2 mA, had the best effect. We conclude that different tPCS intervention programs can have different effects on the elimination of physical fatigue. The effects of the five intervention programs on the elimination of physical fatigue in athletes are as follows: program II is most suitable for moderate physical fatigue, and program I is most suitable for severe physical fatigue.

1. Introduction

Fatigue occurs because of exercise-induced limitations in skeletal muscles or in the nervous system [1]. Fatigue has a negative impact on social, professional and emotional functions and can seriously interfere with the overall quality of life; in the United States, tired workers cost employers $136.4 billion in productivity every year [2]. For individuals, fatigue can cause physical dysfunction; for example, it can affect sleep and cause pain [3,4]. Moreover, fatigue is associated with mental illness, especially depression [5]. The long-term existence of fatigue will evolve into chronic fatigue, which will affect the population’s immune system, causing effects such as cytokine imbalance, changes in the cellular immune system and virus infection, and seriously endanger human health [6]. Therefore, fatigue is increasingly becoming a public health problem that needs to be solved urgently.
In recent years, the application of transcranial electrical stimulation (TES) has provided a new method for the elimination of fatigue [7]. TES is a non-invasive brain stimulation (NIBS) technique that alters brain function and motor performance through electrical currents released by electrodes [8]. Approaches to TES include transcranial direct current stimulation (tDCS), transcranial pulsed current stimulation (tPCS), transcranial random noise stimulation (tRNS), and transcranial alternating current stimulation (tACS) [9]. Williams and Fresnoza demonstrated the elimination effects of tDCS and tACS on physical fatigue, respectively [10,11].
Both tDCS and tPCS affect brain function by releasing electric currents. The biggest difference is that tDCS is a direct current, while tPCS is a bipolar pulse, so there may be differences in the effect of fatigue elimination between them. When fatigue occurs, the discharge frequency of neurons in the brain decreases and the activation of neuronal activity is insufficient [12]. By stimulating the membrane potential of neurons, tDCS can depolarize the anode, reduce the threshold of action potential and improve the excitability of the anodic cortex. However, tPCS depolarizes the cell membrane repeatedly through current pulses, resulting in a cumulative effect in the depolarization process, so tPCS does not cause the same electrochemical side effects as tDCS, and can produce greater cortical excitability changes [13]. This means that the effect of tPCS on eliminating fatigue may be greater than that of tDCS. At present, although Morales et al. proved the ability of tPCS to eliminate cognitive fatigue [14], the research on the effect of tPCS intervention programs on eliminating physical fatigue is still in the blank stage, so it has high research value.
In fact, in actual sports training, the degree of physical fatigue produced by individuals is often different. However, the intervention program for tPCS is relatively fixed, meaning there is a lack of intervention programs for different degrees of physical fatigue [15]. The intervention program of TES usually includes stimulation intensity and stimulation time. Scholars studying the benefits of moderately increasing the current intensity of TES have concluded that different individuals should use different stimulus intensities [16,17]. The study of Workman shows that although the current intensity of 2 mA is generally considered to be relatively safe, no side effects are found under the stimulation of 4 mA, and subjects find it tolerable [18]. In addition, individual differences in hair, sebum content, and skull thickness can affect the current intensity, resulting in huge individual differences in the TES intervention effect [19,20,21]. According to Nitsche, the same stimulus intensity can cause long-term stimulation in children but long-term inhibition in adults [22], so the fixed stimulus intensity may be a “rigid choice”. Some studies have pointed out that the sensory intensity may be an appropriate current intensity. At this current intensity, there is a tremor at the root of the nose; moreover, acupuncture under the electrode can be tolerated, and other abnormal sensations such as dizziness and decreased visual perception are absent [23,24]. Several studies have shown that the stimulation of the 0.2 mA gradient may make subjects produce a large excitatory response [25,26]. According to the research of Yang et al., the intervention time of TES is usually 20 min or 30 min [27,28,29]. The overall effect of a TES stimulation program is often affected by the “stimulation dose”, which is determined by current stimulation intensity and stimulation time. Therefore, it is particularly important to explore more targeted intervention programs [30].
Functional near-infrared spectroscopy (fNIRS) is a brain imaging technology that measures changes in cerebral hemodynamics. It reflects fatigue status by monitoring changes in brain oxygenation [31,32]. Heart rate variability (HRV) is often used to reflect the vitality of the autonomic nervous system and has been widely used in fatigue monitoring due to its convenience, non-invasiveness, and high sensitivity [33]. Individual fatigue status can be monitored by analyzing the time domain and frequency domain indicators in HRV. Ravé et al. believed that the root mean square successive difference (RMSSD) of the interval between R peaks in the heartbeat cycle (RR interval) can better reflect the overall HRV [34], which is useful for monitoring the fatigue status of subjects.
This study attempts to analyze the changes in the HRV and concentrations of oxygenated hemoglobin (HbO2) after different tPCS intervention programs to distinguish which intervention programs have the greatest intervention effects on eliminating different degrees of physical fatigue. Based on the results, this study provides a strategy for the application of tPCS to eliminate different degrees of physical fatigue. At the same time, we explore new approaches regarding the application of tPCS to eliminate physical fatigue for improving the application effect. This study assumes that when intervening subjects with moderate physical fatigue, program III (stimulation time is 20 min and the stimulation intensity is the sensory stimulation intensity + 0.2 mA) is the best among the five intervention programs, while for subjects with severe physical fatigue, program I (stimulation time is 30 min and the stimulation intensity is the sensory intensity + 0.2 mA) is the best among the five intervention programs.

2. Materials and Methods
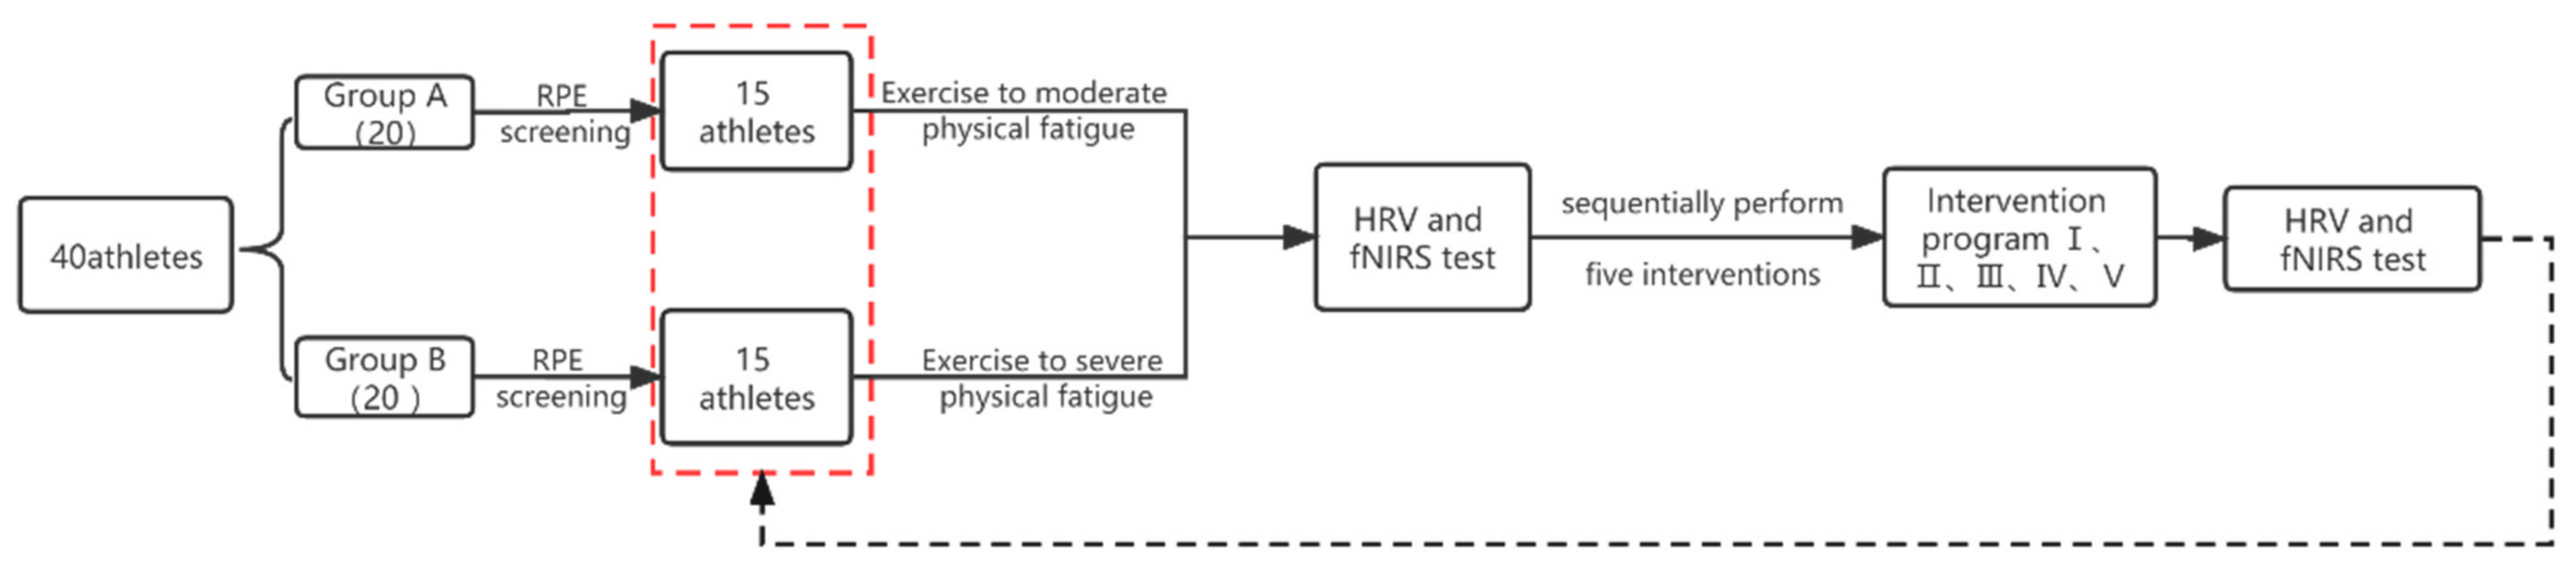
2.1. Participants

Forty healthy college athletes (no distinction between sports) were randomly divided into group A and group B, with 20 patients in each group. All subjects volunteered to participate in this study after learning about the intention and experimental process of the study. The subjects met the following inclusion criteria: no cardiovascular disease, no mental illness, no overtraining one week before the experiment, and no smoking, drinking, or other behaviors that affected the level of fatigue. This study strictly complies with the Helsinki Declaration and has been approved by the Academic and Ethics Committee of Nantong University. Before the formal intervention, all subjects in each group participated in rated perceived exertion (RPE) screening while running on a treadmill. After three rounds of screening, 30 subjects were approved to participate in the study, and ten subjects were excluded from the study because they did not meet the requirements of physical fatigue, had a large difference in RPE scores under the same exercise program, or had varying recovery times (after the first round, three subjects from group A and four from group B were excluded; after the second round, two subjects from group A and one from group B were excluded; after the third round, no subjects were excluded). Additional information on groups A and B is provided in Table 1.

2.2. Experimental Equipment

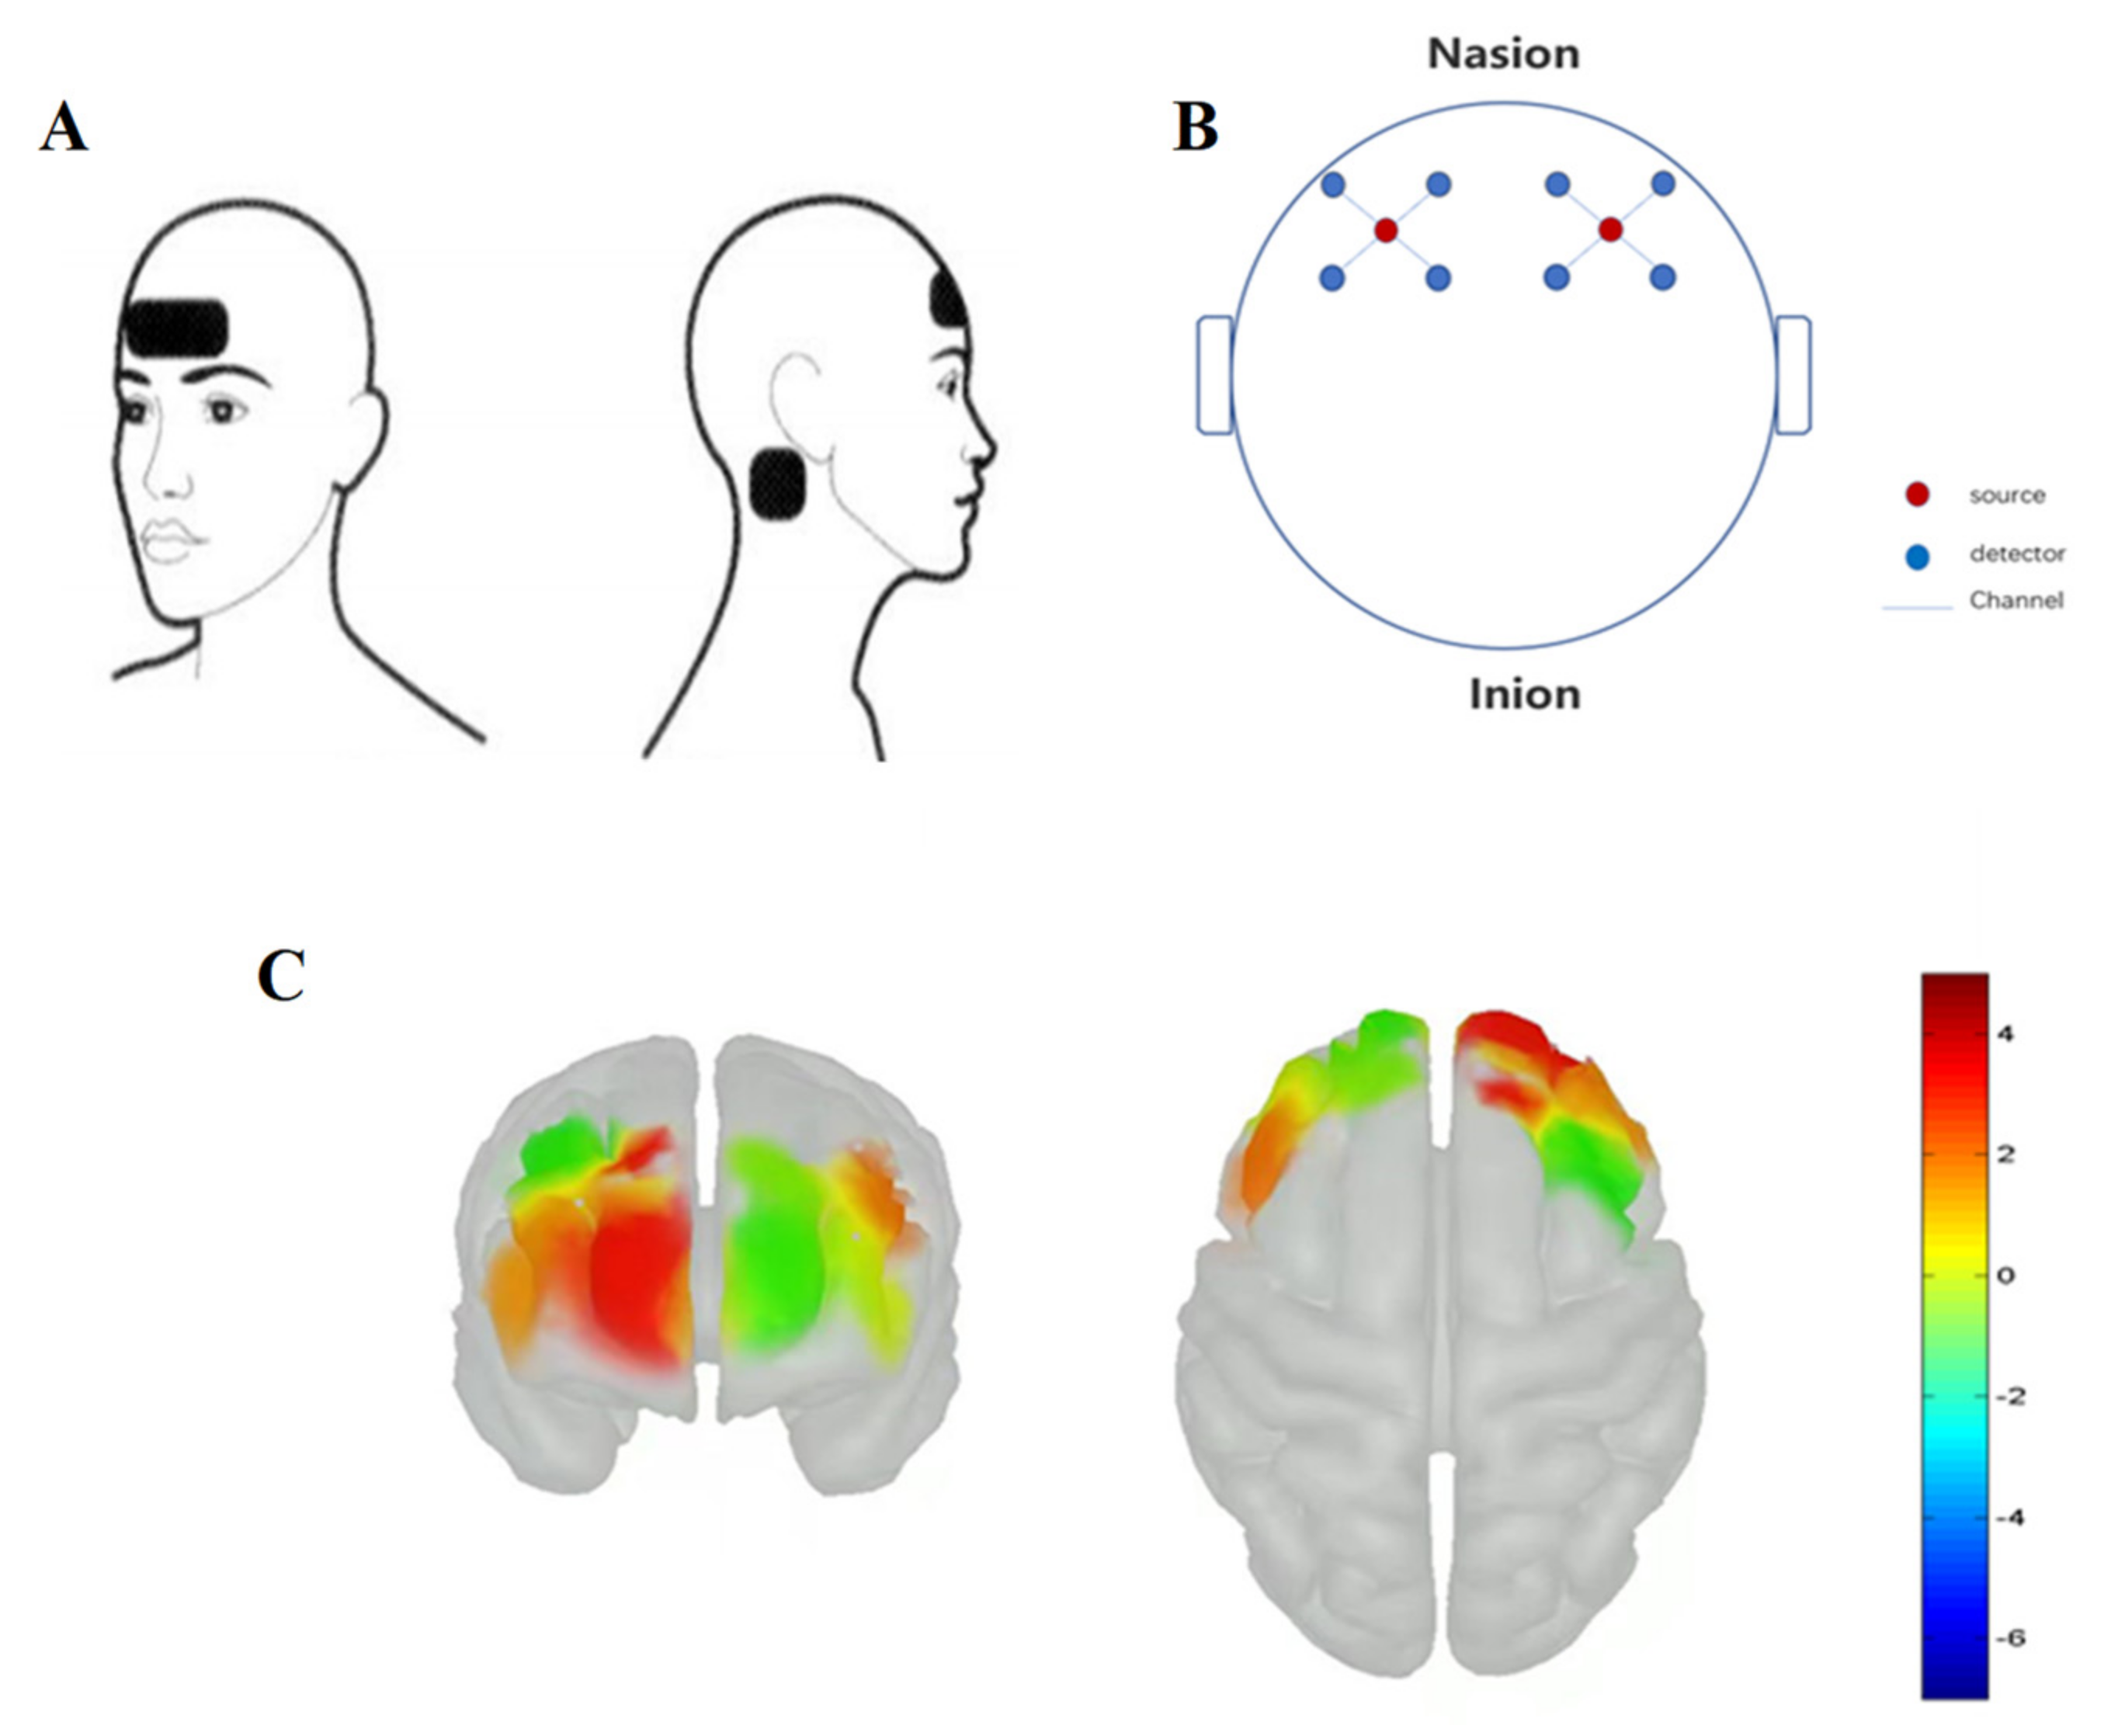
2.2.1. Transcranial Pulsed Current Stimulation

The tPCS instrument, developed by the National Key Technology R&D Program of China, is characterized as follows: the stimulation current is a bipolar current of 60–80 Hz, the pulse waveform is a square wave, the duty cycle is 29.7%, the stimulation intensity is in the range of 0–2 mA, and the stimulation time is determined by the experimental program. This product passed the national security certification on 17 April 2021 (report number CHTSM21040049).

2.2.2. HRV Test

Related indicators of HRV were tested by an HRV tester made in Finland (model: Firstbeat Sports).

2.2.3. Functional Near-Infrared Spectroscopy

The portable wireless fNIRS is manufactured by the company Artinis from the Netherlands and its model is OctaMon+ (Artinis, The Netherlands). OctaMon+ consists of eight light source emitters and two detectors. The light source emitters emit light waves at 760 nm and 850 nm, which are received by the detectors after passing through the cortex. The light source emitters are arranged in the frontal functional area at a distance of 3 cm, mainly covering the frontal eye movement area, the dorsolateral prefrontal cortex, the frontal pole area, and the orbitofrontal area (Figure 1). The sampling frequency of the detector is 50 Hz.

2.2.4. Treadmill

A German h/p/cosmos professional treadmill was used. The running area of the running platform was 150 cm long and 50 cm wide. The speed range was from 0 to 22.0 km/h (0 to 6.1 m/s), and it had a slope of 0 to 25.0% (0 to 14.0°).

2.2.5. RPE Questionnaire

According to the RPE questionnaire, a score of 5–7 corresponds to moderate physical fatigue, and a score of 8–10 corresponds to severe physical fatigue. The reliability of the RPE assessment for the degree of fatigue was verified, and the correlation coefficient between the groups is 0.71–0.90 [35,36].

2.3. tPCS Intervention Program

This experiment was a randomized double-blind experiment, using a two-factor mixture experimental design of 5 (intervention program) × 2 (measurement time). According to the method of Coventry and other scholars, the subjects were divided into two groups: a moderate physical fatigue group and a severe physical fatigue group [37]. The widely used RPE was used to measure the degree of physical fatigue in the subjects [38]. The formulation of the intervention program referred to the study of Yang et al. and had the following characteristics [25,26,27,39]: the stimulus intensity was set to three gradients, including no stimulation, sensory stimulus intensity, and sensory stimulus intensity + 0.2 mA, and the stimulation time was set as 20 or 30 min. As shown in Table 2, a total of five intervention programs were established. The tPCS instrument was operated by skilled personnel who did not participate in this study. To ensure the safety of the subjects, all operations followed the consensus reached at the Copenhagen Conference [40]. First, an electrode sheet with a size of 5 × 9 cm2 was placed in the orbitofrontal area, and two electrode sheets with a size of 5 × 5 cm2 were placed near the mastoids of both ears and fixed with elastic bandages. The current intensity of the stimulated group increased from 0 mA to the target intensity within 30 s after the stimulation started, and the target intensity consisted of sensory intensity and sensory intensity + 0.2 mA. The sensory intensity was the intensity at which the subject experienced nasal tremors, tolerable needling under the electrode, no dizziness, decreased visual perception, or other abnormal sensations during the intervention. At the end of the stimulation, the current was adjusted to 0 mA within 30 s, and all operations were performed by the same person. When using the sham stimulation, the group received the same stimulation time, stimulation intensity, and current acceleration process, but the current intensity was adjusted to 0 mA 30 s after the initial acceleration. All tPCS operators were told to stop the experiments immediately if the subjects experienced any adverse reactions (e.g., pain, dizziness). At the end of each stimulus, the subjects filled out a stimulus perception questionnaire to record their feelings.

2.4. Index Test

Both HRV and fNIRS tests were performed in a sitting position. The HRV test indicators include two time-domain indicators: the standard deviation of normal R-R intervals (SDNN), the root mean square of the successive differences (RMSSD) expressed in ms, and two frequency domain indicators (high frequency (HF) and low frequency (LF)) expressed in ms2. The fNIRS indicator is the concentration of HbO2, expressed in g/L. RMSSD and HF represent the parasympathetic modulation of the heart, SDNN represents the total power and LF represents parasympathetic and sympathetic modulation. When the fatigue degree decreases, RMSSD, SDNN, HF, and HbO2 increase and LF decreases.

2.5. Experimental Flow

Forty subjects were randomly divided into two groups, A and B, with 20 subjects in each group. Each group existed independently and had no link with the other. Based on the physical fatigue program of Quammen [41], both groups of subjects performed 3 min of adaptive running training at a constant speed of 4 m/s (no slope) on the treadmill, then the speed was increased by 1 km/min to 10 km/h after 6 min, and finally, the subjects ran to a predetermined level of fatigue at this speed. The subjects indicated their fatigue level every minute. The fatigue standard of group A was an RPE score of 5–7, and that of group B was an RPE score of 8–10. Fifteen subjects who met the fatigue requirements were screened from each of the groups for a total of 30 subjects. Then, the HRV test and fNIRS test were carried out immediately. Followed by the tests, both groups were treated with tPCS intervention program I. During the sham stimulation, HRV and fNIRS were measured 30 min after the start of the tPCS stimulation, and the measuring time is the same as that of the true stimulation group, i.e., 10 min for the HRV test and 5 min for the fNIRS test; all tests were performed at a resting state. To avoid the cumulative effect of fatigue, the above experimental steps were repeated after 48 h until all subjects eligible for RPE completed all five intervention programs (the implementation sequence of the five intervention programs was determined by a random scale) [42] (Figure 2). The average time for group A to reach moderate physical fatigue was 27.54 min, and the average time for group B to reach severe physical fatigue was 37.59 min.

2.6. Data Processing and Analysis

First, nirsLAB v. 2013.1 software (Version 14, Revision 2, NIRx Medizintechnik GmbH, Berlin, Germany) was used to convert the collected original data into MATLAB format data. Then, the differential function DIFF in MATLAB was used to observe whether there was a horizontal signal in the signal. If there were more than 25% invalid horizontal signals in the signal, we excluded the signal of this channel. Then, Butterworth filtering was used to reduce the interference of high-frequency noise (0.3 Hz respiration and 1 Hz heart rate) and low-frequency noise (metabolic tremor of less than 0.01 Hz) in the signal and improve the signal-to-noise ratio. Using the principal component analysis method proposed by Yücel to remove movement artifacts, the calculated monitoring time of the oxygenated hemoglobin concentration was 3 min [43]. Finally, the oxygenated hemoglobin concentration data of all subjects were calculated, and the change in the prefrontal lobe oxygenated hemoglobin concentration (HbO2) was calculated according to the improved Beer–Brown law. After the abnormal fluctuations and pseudo-error were eliminated by Polar software (Polar Precision Performance SW5.20, Polar Electro, Kempele, Finland), 5-min signal samples were selected for the HRV time domain and frequency domain analysis.
The statistical analysis was carried out using SPSS22.0 (SPSS Inc., Chicago, IL, USA) and Microsoft Excel 2019 (Microsoft Corporation, Redmond, WA, USA), and the results were expressed by mean ± standard deviation (M ± SD). The Shapiro–Wilk test was used to examine the normal distribution of the outcomes. Two-factor repeated measures analysis of variance (two-way ANOVA, SPSS22.0) was used to analyze the effects of experimental variables (intervention program × measurement time) on the HRV HbO2 in the moderate fatigue group and the severe fatigue group, respectively. The intra-group variable was the intervention program (denoted as programs I–V); the measurement time was recorded at two time points (pre- and post-intervention). Post-hoc analysis was used if a significance in the interaction was observed and corrected using Bonferroni correction. The significance level was set at p < 0.05, and the highest significance level was set at p < 0.01.

3. Results

3.1. The Results of the Time Domain Index

The ANOVA showed that, regarding RMSSD, there was no interaction between measurement time and intervention program, but there was a significant main effect for time (F(1,14) = 68.462, p = 0.000) in group A; there was no interaction between measurement time and intervention program, but there was a significant main effect for time (F(1,14) = 63.989, p = 0.000) in group B. According to intra-group statistics, the intervention effects of programs II, III, and IV in group A were significant, and the maximum change rate of program II was 25.375%; in group B, the intervention effects of programs I, II, III, and IV were significant, and the maximum change rate of program I was 32.595% (Table 3, Figure 3A and Figure 4A). Regarding SDNN, there was no interaction between the measurement time and the intervention program, but there was a significant main effect for time (F(1,14) = 53.266, p = 0.000) in group A; there was no interaction between the measurement time and the intervention program, but there was a significant main effect for time (F(1,14) = 50.603, p = 0.000) in group B. According to intra-group statistics, the intervention effects of programs II, III, and IV in group A were significant, and the maximum change rate of program II was 27.924%; in group B, the intervention effects of programs I, II, III, and IV were significant, and the maximum change rate of program I was 40.169% (Table 3, Figure 3B and Figure 4B).

3.2. The Results of the Frequency Domain Index

The ANOVA showed that, regarding LF, the interaction between the measurement time and intervention program of HF was significant (F(1,56) = 3.215, p = 0.025), and there was a significant main effect for time (F(1,14) = 39.344, p = 0.000) in group A; the interaction between the measurement time and intervention program of HF was significant (F(1,56) = 3.316, p = 0.000), and there was a significant main effect for time (F(1,14) = 103.179, p = 0.000) in group B. According to the post-hoc test, the intervention effects of programs II, III, and IV in group A were significant, and the maximum change rate of program II was −20.880%; in group B, the intervention effects of programs I, II, and III were significant, and the maximum change rate of program II was −23.528% (Table 3 and Figure 3C and Figure 4C). Regarding LF, there was no interaction between the measurement time and intervention program, but there was a significant main effect for time (F(1,14) = 58.706, p = 0.000) in group A; there was no interaction between the measurement time and intervention program, but there was a significant main effect for time (F(1,14) = 101.460, p = 0.000) in group B. According to intra-group statistics, the intervention effects of programs I, II, III, and IV in group A were significant, and the maximum change rate of program II was 20.616%; in group B, the intervention effects of programs I, II, III, and IV were significant, and the maximum change rate of program I was 32.631% (Table 3, Figure 3D and Figure 4D).

3.3. The Results of the HbO2

The ANOVA showed that there was no interaction between the measurement time and intervention program in group A, but there was a significant main effect for time (F(1,14) = 37.103, p = 0.000). There was no interaction between the measurement time and intervention program in group B, but there was a significant main effect for time (F(1,14) = 68.481, p = 0.000). According to intra-group statistics, the intervention effects of programs I, II, III, and IV in group A were significant (Table 3), and the maximum change rate of program II was −109.19%; in group B, the intervention effects of programs I, II, III, and IV were significant, and the maximum change rate of program I was 127.20% (Table 3 and Figure 3E and Figure 4E).

4. Discussion

4.1. Effects of Different tPCS Programs on Moderate Physical Fatigue

In this study, it was found that all five programs had effects on the elimination of moderate physical fatigue, although the effects of the five programs were different. For example, programs II, III, and IV had significant effects on multiple indicators of HRV and the concentration of HbO2; specifically, RMSSD, SDNN, HF, and HbO2 increased significantly after intervention, whereas LF decreased significantly after intervention. Program II (sensory intensity, 30 min) had the overall best effect, whereas program I (sensory intensity + 0.2 mA, 30 min) had the overall worst effect among all true stimulation programs (programs I–IV), although its effect was still significant. In contrast, program V (natural recovery) did not have significant effects. We speculate the reason may be that there is no significant decrease in cortical excitability in subjects with moderate fatigue, but long-term “high intensity” stimulation would reverse cortical excitability, so the intervention effect of program I is the worst and that of program II is the best; this is consistent with the study of Batsikadze et al. [44], who found that when non-invasive brain stimulation (NIBS) was used for intervention, the long-term high-intensity current would change the original intervention effect from facilitation to inhibition. Therefore, we conjecture that the effect of tPCS intervention intensity on the intervention effect may have an inverted U curve, and different stimulation times would accelerate or slow down the emergence of the inverted U curve. However, to verify this conjecture, further research is required.
At the same time, some studies have shown that when fatigue occurs [45], the individual’s feelings, cognition, and subjective comfort decrease to a certain extent, and the greater the degree of fatigue, the greater the degree of decline. Therefore, we believe that in moderate physical fatigue, because the decrease in the individual’s sensations is relatively small, a higher stimulus intensity would lead the individual to develop a stronger sense of stimulation, which exceeds the individual tolerance, thus lowering the intervention effect of tPCS. In contrast, in severe physical fatigue, the individual’s sensations decrease greatly, and the tolerance is higher, so the current intensity of sensory intensity + 0.2 mA is appropriate. Proske et al. [46] analyzed athletes’ perspectives on movement and sensation and found that the best performance of athletes depends on the best interaction between motor cortical impulses and sensory cortical processing. When the current is too large, it may produce higher cortical activity, but excessive stimulation causes skin tingling, numbness, pain, and other discomforts, thus suppressing subjective motivation through the frontal cortex. This leads to a poor exercise state and reduces sports performance [47]. In addition, Esmaeilour et al. also proved that raising the stimulus intensity cannot increase the effect of the intervention [17], and in fact, raising the stimulus intensity may turn the excitatory effect of stimulation into an inhibitory effect [47,48,49]. This is consistent with the synaptic modification theory proposed by Bienenstock et al. [50]. Therefore, we believe that the sensory intensity is appropriate for treating moderate physical fatigue.
In contrast to the above results, Vöröslakos et al. believe that a higher intensity of current stimulation (4–6 mA) may be needed to obtain enough current passing through the scalp [16,51], subcutaneous tissue, and skull to affect the excitability of nerves in the brain. The differences in the above studies may be caused by the baseline state of the subjects, the thickness of the skull, the density of hair, and the thickness of fat, which is consistent with the results of Horvath [19].

4.2. Effects of Different tPCS Intervention Programs on Severe Physical Fatigue

In severe physical fatigue, the best intervention program was intervention program I (sensory intensity + 0.2 mA), followed by programs II, III, IV, and V. Among all the true stimulation programs (programs I–IV), program IV (20 min) had the worst intervention effect, but the effect was still significant. Program V was a natural recovery program, and its effect was not significant. Among all the true stimulation programs, the current intensity of program I was the highest, and the intervention time was the longest, whereas the current intensity of program IV was the lowest and the intervention time was the shortest. This result is consistent with the study of Tergau [52], who speculated that there is a high correlation between fatigue and cortical excitability. When fatigue occurs, cortical excitability decreases, and the deeper the degree of fatigue, the lower the degree of activity. After exhaustive exercise, the decrease in cortical excitability is more significant, so a stronger current is needed for stimulation. This is supported by Moliadze [53], who showed that when using lower current stimulation (0.4 mA), the subjects do not produce activity and also have a very significant inhibition trend. This may be related to N-methyl-D-aspartic acid (NMDA). The “low”-intensity current of tPCS suppresses the effect of NMDA, and the effect of the NMDA receptor can be activated under the condition of severe physical fatigue. When the stimulation intensity of tPCS is higher, the activation of NMDA is stronger [54]. Workman et al. also found that when using tDCS for balance function intervention, the intervention effect of a current intensity of 4 mA is better than that of a current intensity of 2 mA [55]. The reason may be that a high current density can increase nerve activity in a state of severe physical fatigue. According to Priori et al. [56], a higher current density under the electrode would produce greater stimulation, so nerves would be more likely to be activated. In severe physical fatigue, the high-intensity current is tolerable for subjects, so when the current intensity is the sensory intensity + 0.2 mA, and the intervention time is longer, the better the intervention effect will be [57]. Some studies have concluded that the best stimulation program of tPCS is 2 mA within 20 min, stating that it increases the power of the α-band, strengthens the connection between brains, and has the most significant neurophysiological effect, which is different from the results of our study. The reason for this difference may be that the initial state of the brain of the subjects was different. In this study, before the intervention, all the subjects experienced the task of severe physical fatigue, and the brain excitability was low [58]. This suggests that the formulation of the intervention program of tPCS may need to take into account the stimulation parameters of tPCS and the activated state of the brain of the subjects. At the same time, we also speculate whether there is an optimal “stimulus unit” for the stimulation effect of tPCS, and the dose of the “stimulus unit” depends on the subject’s state, including the baseline state of brain activity and the tasks carried out. However, further research is needed to verify this conjecture.
In this study, the recovery range of severe physical fatigue was greater than that of moderate physical fatigue. Thus, there may be potential for the recovery of severe physical fatigue; a greater stimulus intensity and a longer stimulation time are needed to promote recovery. Dominguez found that longer stimulation may produce a more significant recovery [59], so when the subjects are experiencing severe physical fatigue, the effect of the intervention for 30 min is better than 20 min. The study of Terney et al. also supports this result [60], and found that when the intensity is held constant, changing the stimulation time can affect the stimulation effect to a great extent, and when the intensity is held constant, increasing the stimulation time improves the effect on subjects experiencing severe physical fatigue. This supports our finding that the intervention effect of program I was the greatest. However, for subjects experiencing moderate physical fatigue, increasing the stimulation time did not improve the intervention effect. The reason may be that high-intensity stimulation triggers the individual’s protective mechanism, so the longer the stimulation, the worse the intervention effect; thus, a 20-min tPCS intervention was better than 30 min [57], which is consistent with the results of our study. At present, increasing evidence shows that the effect of tDCS is highly variable, the response of the cortex to tDCS is specific, and different stimulation parameters (current intensity, electrode direction, stimulation time, electrodeposition) are needed to activate/inhibit different targets. Identifying the status of subjects plays an important role in the effect of tDCS [44,61]. As a kind of TES, tPCS is highly similar to tDCS; this suggests that our later studies should pay attention to the intervention scheme of tPCS, especially since there has been no research on this topic at present, and we should actively expand the research field of tPCS and enhance the intervention effect of tPCS.

4.3. Mechanism Exploration of tPCS Intervention on HRV and HbO2

In this study, fNIRS and HRV were used to monitor the effect of tPCS intervention on the elimination of different degrees of exercise-induced physical fatigue. It was found that the changes in the HRV and the concentration of HbO2 were similar in subjects with moderate and severe physical fatigue, which indicates that there may be some relationship between the change in the HRV and the change in the HbO2. Chaudhuri et al. found that the frontal lobe is located in the central area of the “fatigue network” [62]. When fatigue occurs, the neural connections between different brain regions decrease, especially between the frontal lobe and other brain regions, and the frontal lobe plays an important role in the regulation of physical fatigue [63]. Some scholars have found that the stimulation of tPCS in the frontal lobe can cause the change in the concentration of HbO2 in the frontal lobe [64]. It has also been proved that the frontal lobe is part of the sympathetic and parasympathetic pathway [65], which means that the stimulation of tPCS in the frontal lobe can affect the HRV and concentration of HbO2 at the same time, which makes it possible to explore the mechanism of tPCS intervention on the HRV and the concentration of HbO2. There have been studies on the combination of fNIRS and HRV as a means of fatigue monitoring, but few studies have combined them to analyze the mechanism.
When individuals experience physical fatigue, the concentration of HbO2 in the brain decreases, and the concentration of HbO2 in the brain is negatively correlated with the degree of physical fatigue [66]. Compared with the normal state, tired individuals find it more difficult to maintain their original exercise level, which would force the brain area to be in a state of high activation, so more blood oxygen supply is needed to combat fatigue. Nguyen proved this in experiments and further considered that the demand for oxygenated hemoglobin is positively related to the difficulty of the task. When the task is more difficult, the demand for oxygenated hemoglobin is higher, and when the task is simpler, the demand for oxygenated hemoglobin is lower [67,68]. Saavedra et al. found that the stimulation of tPCS in the frontal lobe can improve the excitability of the cerebral cortex, strengthen the connection between brain regions, and improve the blood oxygen transport capacity of the stimulated region [69,70]. Therefore, we speculate that this may be one of the reasons why tPCS can increase the concentration of HbO2 in the frontal lobe. At the same time, the stimulation of tPCS in the frontal lobe increased the overall level of HRV, which was consistent with the increase in the HbO2 concentration in the prefrontal lobe after stimulation. Gianaros et al. pointed out that the pathways involved in sympathetic and parasympathetic nerves include the frontal lobe, anterior cingulate gyrus, insular, hypothalamus, and brainstem [71]. The mediator of the cortical–subcortical pathway of the frontal parasympathetic nerves and sympathetic nervous system can effectively regulate HRV [72]. The prefrontal cortex, including the orbital prefrontal cortex and medial prefrontal cortex, inhibits the amygdala by connecting γ-aminobutyric acid (gamma-aminobutyric acid, GABA) neurons in the amygdala. The overactivation of the prefrontal cortex inhibits the sympathetic excitation circuit of the amygdala, and the amygdala nuclear energy regulates the output of autonomic nervous regulation through the hypothalamus–brainstem pathway, thus leading to changes in the HRV [73,74,75]. Applying tDCS stimulation above the prefrontal cortex increases parasympathetic activity and decreases sympathetic activity, and when parasympathetic activity increases, it affects HRV, especially RMSSD and HF indicators [76]. Some scholars have directly proved that when tDCS is used to stimulate the brain, it can enhance the activity of the parasympathetic nerves and increase HRV [77,78]. The parasympathetic nerve-mediated HRV effect can predict instantaneous emotional changes, especially the so-called “soothing” positive emotions, thus leading to overall changes in HRV [79]. This is consistent with the results of this study, namely that RMSSD and HF, which reflect parasympathetic activity, were significantly increased after tPCS stimulation. Due to the high similarity between tPCS and tDCS, we speculate that tPCS may have the following two pathways for fatigue elimination in the frontal lobe: (1) tPCS activates the cingulate cortex or insula after frontal lobe stimulation, which in turn affects sympathetic and parasympathetic nerves; (2) tPCS relieves amygdala nerve inhibition after frontal lobe stimulation and improves parasympathetic nerve activity (Figure 5).
This study tentatively analyzes the changes in HRV and the concentration of HbO2 after the tPCS stimulation of the frontal lobe and explores the possible pathway of tPCS affecting HRV and the concentration of HbO2. Ide et al. found that there was a strong correlation between cerebral blood flow and cardiac output [80], and González et al. found that the concentration of HbO2 in the brain decreased due to the decrease in the cerebral blood flow [81]. Cardiac output regulated by autonomic nerves affects cerebral blood flow; thus, it can be inferred that there is a correlation between the change in HRV and the change in HbO2 concentration.

5. Limitations

This study also has some limitations. First, there are few studies on the intervention program of tPCS at present, and there is a lack of research on stimulus intensity. Therefore, this study’s choice of the sensory intensity as the stimulus intensity lacks direct evidential support. Second, the sample size of this study is relatively small; it only focuses on the type of physical fatigue and does not include subjects of other types of fatigue into the group, such as cognitive fatigue. Therefore, it reduces the generality of the results and limits the application scenarios of tPCS, which means that future research can focus on other fatigue types to increase the application scenarios of tPCS.

6. Conclusions

In this study, it was found that different tPCS intervention programs had different effects on the elimination of physical fatigue in athletes. The effects of five intervention programs on the elimination of physical fatigue in athletes are as follows: For the elimination of moderate physical fatigue in athletes, the tPCS intervention program with a stimulation time of 30 min and stimulation intensity of sensory intensity had the best effect. For the elimination of severe physical fatigue in athletes, the tPCS intervention program with a stimulation time of 30 min and a stimulation intensity of sensory intensity + 0.2 mA had the best effect.

Author Contributions

Q.W.: Study concept and design of the clinical trial, data acquisition, the analysis and interpretation of the clinical trial, and manuscript writing. G.F.: Management and collection of some data. J.Z.: Management and auditing. J.L.: Proposing the topic of the paper, designing the experiment, and guiding the revision of the paper. All authors have read and agreed to the published version of the manuscript.

Funding

This research was funded by National Key Technology R&D Program of China grant number [2019YFF0301600] and Postgraduate Research & Practice Innovation Program of Jiangsu Province grant number [KYCX21_3069], the APC was funded by National Key Technology R&D Program of China.

Informed Consent Statement

Informed consent was obtained from all subjects involved in the study.

Data Availability Statement

The datasets generated and/or analyzed during the current study are available from the corresponding author on reasonable request.

Conflicts of Interest

The authors declare no conflict of interest.

References

  1. Taylor, J.L.; Amann, M.; Duchateau, J.; Meeusen, R.; Rice, C.L. Neural contributions to muscle fatigue: From the brain to the muscle and back again. Med. Sci. Sports Exerc. 2016, 48, 2294. [Google Scholar] [CrossRef] [PubMed]
  2. Ricci, J.A.; Chee, E.; Lorandeau, A.L.; Berger, J. Fatigue in the U.S. Workforce: Prevalence and Implications for Lost Productive Work Time. J. Occup. Environ. Med. 2007, 49, 1–10. [Google Scholar] [CrossRef] [PubMed]
  3. McCracken, L.M.; Iverson, G. Disrupted Sleep Patterns and Daily Functioning in Patients with Chronic Pain. Pain Res. Manag. 2002, 7, 75–79. [Google Scholar] [CrossRef] [PubMed]
  4. Geisser, M.E.; Donnell, C.S.; Petzke, F.; Gracely, R.H.; Clauw, D.J.; Williams, D.A. Comorbid Somatic Symptoms and Functional Status in Patients With Fibromyalgia and Chronic Fatigue Syndrome: Sensory Amplification as a Common Mechanism. J. Psychosom. Res. 2008, 49, 235–242. [Google Scholar] [CrossRef]
  5. Skapinakis, P.; Lewis, G.; Mavreas, V. Unexplained Fatigue Syndromes in a Multinational Primary Care Sample: Specificity of Definition and Prevalence and Distinctiveness from Depression and Generalized Anxiety. Am. J. Psychiatry 2003, 160, 785–787. [Google Scholar] [CrossRef]
  6. Bansal, A.; Bradley, A.; Bishop, K.; Kiani-Alikhan, S.; Ford, B. Chronic fatigue syndrome, the immune system and viral infection. Brain, Behav. Immun. 2012, 26, 24–31. [Google Scholar] [CrossRef]
  7. Angius, L.; Pascual-Leone, A.; Santarnecchi, E. Brain stimulation and physical performance. Prog. Brain Res. 2018, 240, 317–339. [Google Scholar] [CrossRef]
  8. Simonsmeier, B.A.; Grabner, R.; Hein, J.; Krenz, U.; Schneider, M. Electrical brain stimulation (tES) improves learning more than performance: A meta-analysis. Neurosci. Biobehav. Rev. 2018, 84, 171–181. [Google Scholar] [CrossRef]
  9. Guleyupoglu, B.; Schestatsky, P.; Edwards, D.; Fregni, F.; Bikson, M. Classification of methods in transcranial Electrical Stimulation (tES) and evolving strategy from historical approaches to contemporary innovations. J. Neurosci. Methods 2013, 219, 297–311. [Google Scholar] [CrossRef]
  10. Williams, P.S.; Hoffman, R.L.; Clark, B.C. Preliminary Evidence That Anodal Transcranial Direct Current Stimulation Enhances Time to Task Failure of a Sustained Submaximal Contraction. PLoS ONE 2013, 8, e81418. [Google Scholar] [CrossRef]
  11. Fresnoza, S.; Christova, M.; Feil, T.; Gallasch, E.; Körner, C.; Zimmer, U.; Ischebeck, A. The effects of transcranial alternating current stimulation (tACS) at individual alpha peak frequency (iAPF) on motor cortex excitability in young and elderly adults. Exp. Brain Res. 2018, 236, 2573–2588. [Google Scholar] [CrossRef] [PubMed]
  12. Enoka, R.M.; Stuart, D.G. Neurobiology of muscle fatigue. J. Appl. Physiol. 1992, 72, 1631–1648. [Google Scholar] [CrossRef] [PubMed]
  13. Ma, Z.; Du, X.; Wang, F.; Ding, R.; Li, Y.; Liu, A.; Wei, L.; Hou, S.; Chen, F.; Hu, Q.; et al. Cortical Plasticity Induced by Anodal Transcranial Pulsed Current Stimulation Investigated by Combining Two-Photon Imaging and Electrophysiological Recording. Front. Cell. Neurosci. 2019, 13, 400. [Google Scholar] [CrossRef] [PubMed]
  14. Morales-Quezada, L.; Cosmo, C.; Carvalho, S.; Leite, J.; Castillo-Saavedra, L.; Rozisky, J.R.; Fregni, F. Cognitive effects and autonomic responses to transcranial pulsed current stimulation. Exp. Brain Res. 2015, 233, 701–709. [Google Scholar] [CrossRef]
  15. Moreno-Duarte, I.; Gebodh, N.; Schestatsky, P.; Guleyupoglu, B.; Reato, D.; Bikson, M.; Fregni, F. Transcranial electrical stimulation: Transcranial direct current stimulation (tDCS), transcranial alternating current stimulation (tACS), transcranial pulsed current stimulation (tPCS), and transcranial random noise stimulation (tRNS). Stimul. Brain 2014, 35–59. [Google Scholar] [CrossRef]
  16. Vöröslakos, M.; Takeuchi, Y.; Brinyiczki, K.; Zombori, T.; Oliva, A.; Fernández-Ruiz, A.; Kozák, G.; Kincses, Z.T.; Iványi, B.; Buzsáki, G.; et al. Direct effects of transcranial electric stimulation on brain circuits in rats and humans. Nat. Commun. 2018, 9, 483. [Google Scholar] [CrossRef]
  17. Esmaeilpour, Z.; Marangolo, P.; Hampstead, B.M.; Bestmann, S.; Galletta, E.; Knotkova, H.; Bikson, M. Incomplete evidence that increasing current intensity of tDCS boosts outcomes. Brain Stimul. 2018, 11, 310–321. [Google Scholar] [CrossRef]
  18. Workman, C.D.; Kamholz, J.; Rudroff, T. Increased leg muscle fatigability during 2 mA and 4 mA transcranial direct current stimulation over the left motor cortex. Exp. Brain Res. 2020, 238, 333–343. [Google Scholar] [CrossRef]
  19. Horvath, J.C.; Forte, J.; Carter, O. Quantitative Review Finds No Evidence of Cognitive Effects in Healthy Populations from Single-session Transcranial Direct Current Stimulation (tDCS). Brain Stimul. 2015, 8, 535–550. [Google Scholar] [CrossRef]
  20. Opitz, A.; Falchier, A.; Yan, C.-G.; Yeagle, E.M.; Linn, G.S.; Megevand, P.; Thielscher, A.; Deborah, A.R.; Milham, M.P.; Mehta, A.D.; et al. Spatiotemporal structure of intracranial electric fields induced by transcranial electric stimulation in humans and nonhuman primates. Sci. Rep. 2016, 6, 31236. [Google Scholar] [CrossRef]
  21. Dmochowski, J.P.; Bikson, M.; Parra, L.C. The point spread function of the human head and its implications for transcranial current stimulation. Phys. Med. Biol. 2012, 57, 6459–6477. [Google Scholar] [CrossRef] [PubMed]
  22. Nitsche, M.A.; Cohen, L.G.; Wassermann, E.M.; Priori, A.; Lang, N.; Antal, A.; Paulus, W.; Hummel, F.; Boggio, P.S.; Fregni, F.; et al. Transcranial direct current stimulation: State of the art 2008. Brain Stimul. 2008, 1, 206–223. [Google Scholar] [CrossRef] [PubMed]
  23. Workman, C.; Kamholz, J.; Rudroff, T. The Tolerability and Efficacy of 4 mA Transcranial Direct Current Stimulation on Leg Muscle Fatigability. Brain Sci. 2019, 10, 12. [Google Scholar] [CrossRef] [PubMed]
  24. Antal, A.; Kincses, Z.T.; Nitsche, M.A.; Paulus, W. Manipulation of phosphene thresholds by transcranial direct current stimulation in man. Exp. Brain Res. 2003, 150, 375–378. [Google Scholar] [CrossRef]
  25. Chew, T.; Ho, K.-A.; Loo, C.K. Inter- and Intra-individual Variability in Response to Transcranial Direct Current Stimulation (tDCS) at Varying Current Intensities. Brain Stimul. 2015, 8, 1130–1137. [Google Scholar] [CrossRef] [PubMed]
  26. Herrmann, C.S.; Rach, S.; Neuling, T.; Strüber, D. Transcranial alternating current stimulation: A review of the underlying mechanisms and modulation of cognitive processes. Front. Hum. Neurosci. 2013, 7, 279. [Google Scholar] [CrossRef]
  27. Yang, D.; Shin, Y.-I.; Hong, K.-S. Systemic Review on Transcranial Electrical Stimulation Parameters and EEG/fNIRS Features for Brain Diseases. Front. Neurosci. 2021, 15, 274. [Google Scholar] [CrossRef]
  28. Vasquez, A.C.; Thibaut, A.; Morales-Quezada, L.; Leite, J.; Fregni, F. Patterns of brain oscillations across different electrode montages in transcranial pulsed current stimulation. NeuroReport 2017, 28, 421–425. [Google Scholar] [CrossRef]
  29. Vasquez, A.; Malavera, A.; Doruk, D.; Morales-Quezada, L.; Carvalho, S.; Leite, J.; Fregni, F. Duration Dependent Effects of Transcranial Pulsed Current Stimulation (tPCS) Indexed by Electroencephalography. Neuromodul. Technol. Neural Interface 2016, 19, 679–688. [Google Scholar] [CrossRef]
  30. Nitsche, M.A.; Fregni, F. Transcranial direct current stimulation-an adjuvant tool for the treatment of neuropsychiatric diseases? Curr. Psychiatry Rev. 2007, 3, 222–232. [Google Scholar] [CrossRef]
  31. Subudhi, A.W.; Miramon, B.R.; Granger, M.E.; Roach, R. Frontal and motor cortex oxygenation during maximal exercise in normoxia and hypoxia. J. Appl. Physiol. 2009, 106, 1153–1158. [Google Scholar] [CrossRef] [PubMed]
  32. Liu, T.; Pelowski, M.; Pang, C.; Zhou, Y.; Cai, J. Near-infrared spectroscopy as a tool for driving research. Ergonomics 2016, 59, 368–379. [Google Scholar] [CrossRef]
  33. Schmitt, L.; Regnard, J.; Desmarets, M.; Mauny, F.; Mourot, L.; Fouillot, J.-P.; Coulmy, N.; Millet, G. Fatigue Shifts and Scatters Heart Rate Variability in Elite Endurance Athletes. PLoS ONE 2013, 8, e71588. [Google Scholar] [CrossRef] [PubMed]
  34. Ravé, G.; Zouhal, H.; Boullosa, D.; Doyle-Baker, P.K.; Saeidi, A.; Ben Abderrahman, A.; Fortrat, J.-O. Heart Rate Variability is Correlated with Perceived Physical Fitness in Elite Soccer Players. J. Hum. Kinet. 2020, 72, 141–150. [Google Scholar] [CrossRef] [PubMed]
  35. Skinner, J.S.; Hutsler, R.; Bergsteinová, V.; Buskirk, E.R. The validity and reliability of a rating scale of perceived exertion. Med. Sci. Sports 1973, 5, 94–96. [Google Scholar] [CrossRef]
  36. Stamford, B.A. Validity and Reliability of Subjective Ratings of Perceived Exertion during Work. Ergonomics 1976, 19, 53–60. [Google Scholar] [CrossRef]
  37. Coventry, E.; O’Connor, K.M.; Hart, B.A.; Earl, J.E.; Ebersole, K.T. The effect of lower extremity fatigue on shock attenuation during single-leg landing. Clin. Biomech. 2006, 21, 1090–1097. [Google Scholar] [CrossRef]
  38. Borg, G. Borg’s Perceived Exertion and Pain Scales; Human Kinetics: Champaign, IL, USA, 1998. [Google Scholar]
  39. Ambrus, G.G.; Paulus, W.; Antal, A. Cutaneous perception thresholds of electrical stimulation methods: Comparison of tDCS and tRNS. Clin. Neurophysiol. 2010, 121, 1908–1914. [Google Scholar] [CrossRef]
  40. Antal, A.; Alekseichuk, I.; Bikson, M.; Brockmöller, J.; Brunoni, A.R.; Chen, R.; Cohen, L.; Dowthwaite, G.; Ellrich, J.; Flöel, A.; et al. Low intensity transcranial electric stimulation: Safety, ethical, legal regulatory and application guidelines. Clin. Neurophysiol. 2017, 128, 1774–1809. [Google Scholar] [CrossRef]
  41. Quammen, D.; Cortes, N.; Van Lunen, B.L.; Lucci, S.; Ringleb, S.I.; Onate, J. Two Different Fatigue Protocols and Lower Extremity Motion Patterns during a Stop-Jump Task. J. Athl. Train. 2012, 47, 32–41. [Google Scholar] [CrossRef]
  42. Xia, Z. Research on the effect of background interference in children’s motor skills learning. Sports Sci. 2014, 34, 39–51. [Google Scholar]
  43. Yücel, M.A.; Selb, J.; Cooper, R.; Boas, D.A. Targeted principle component analysis: A new motion artifact correction approach for near-infrared spectroscopy. J. Innov. Opt. Health Sci. 2014, 7, 1350066. [Google Scholar] [CrossRef] [PubMed]
  44. Batsikadze, G.; Moliadze, V.; Paulus, W.; Kuo, M.-F.; Nitsche, M.A. Partially non-linear stimulation intensity-dependent effects of direct current stimulation on motor cortex excitability in humans. J. Physiol. 2013, 591, 1987–2000. [Google Scholar] [CrossRef]
  45. Gamboa, O.L.; Antal, A.; Moliadze, V.; Paulus, W. Simply longer is not better: Reversal of theta burst after-effect with prolonged stimulation. Exp. Brain Res. 2010, 204, 181–187. [Google Scholar] [CrossRef]
  46. Proske, U.; Allen, T. The neural basis of the senses of effort, force and heaviness. Exp. Brain Res. 2019, 237, 589–599. [Google Scholar] [CrossRef]
  47. Xu, J.; Zhang, B.; Wang, X. Research progress on the role of tight-fitting sports equipment in sports. Chin. J. Sports Med. 2021, 40, 402–416. [Google Scholar]
  48. Schmidt, L.; Cléry-Melin, M.-L.; LaFargue, G.; Valabregue, R.; Fossati, P.; Dubois, B.; Pessiglione, M. Get Aroused and Be Stronger: Emotional Facilitation of Physical Effort in the Human Brain. J. Neurosci. 2009, 29, 9450–9457. [Google Scholar] [CrossRef]
  49. Blakemore, R.L.; Neveu, R.; Vuilleumier, P. How emotion context modulates unconscious goal activation during motor force exertion. NeuroImage 2017, 146, 904–917. [Google Scholar] [CrossRef]
  50. Bienenstock, E.L.; Cooper, L.N.; Munro, P.W. Theory for the development of neuron selectivity: Orientation specificity and binocular interaction in visual cortex. J. Neurosci. 1982, 2, 32–48. [Google Scholar] [CrossRef]
  51. Vitor-Costa, M.; Okuno, N.M.; Bortolotti, H.; Bertollo, M.; Boggio, P.S.; Fregni, F.; Altimari, L.R. Improving Cycling Performance: Transcranial Direct Current Stimulation Increases Time to Exhaustion in Cycling. PLoS ONE 2015, 10, e0144916. [Google Scholar] [CrossRef]
  52. Tergau, F.; Geese, R.; Bauer, A.; Baur, S.; Paulus, W.; Reimers, C.D. Motor cortex fatigue in sports measured by transcranial magnetic double stimulation. Med. Sci. Sports Exerc. 2000, 32, 1942–1948. [Google Scholar] [CrossRef] [PubMed]
  53. Moliadze, V.; Atalay, D.; Antal, A.; Paulus, W. Close to threshold transcranial electrical stimulation preferentially activates inhibitory networks before switching to excitation with higher intensities. Brain Stimul. 2012, 5, 505–511. [Google Scholar] [CrossRef]
  54. Nitsche, M.A.; Fricke, K.; Henschke, U.; Schlitterlau, A.; Liebetanz, D.; Lang, N.; Henning, S.; Tergau, F.; Paulus, W. Pharmacological Modulation of Cortical Excitability Shifts Induced by Transcranial Direct Current Stimulation in Humans. J. Physiol. 2003, 553, 293–301. [Google Scholar] [CrossRef] [PubMed]
  55. Workman, C.D.; Fietsam, A.C.; Uc, E.Y.; Rudroff, T. Cerebellar Transcranial Direct Current Stimulation in People with Parkinson’s Disease: A Pilot Study. Brain Sci. 2020, 10, 96. [Google Scholar] [CrossRef] [PubMed]
  56. Priori, A.; Berardelli, A.; Rona, S.; Accornero, N.; Manfredi, M. Polarization of the human motor cortex through the scalp. NeuroReport 1998, 9, 2257–2260. [Google Scholar] [CrossRef]
  57. Morales-Quezada, L.; Castillo-Saavedra, L.; Cosmo, C.; Doruk, D.; Sharaf, I.; Malavera, A.; Fregni, F. Optimal random frequency range in transcranial pulsed current stimulation indexed by quantitative electroencephalography. NeuroReport 2015, 26, 747–752. [Google Scholar] [CrossRef]
  58. Morales-Quezada, L.; Saavedra, L.C.; Rozisky, J.; Hadlington, L.; Fregni, F. Intensity dependent effects of transcranial pulsed current stimulation on interhemisphericconnectivity: A high-resolution qEEG, sham-controlled study. NeuroReport 2014, 25, 1054–1058. [Google Scholar] [CrossRef]
  59. Dominguez, A.; Socas, R.; Marrero, H.; Leon, N.; Llabres, J.; Enriquez, E. Transcranial Direct Current Stimulation improves word production in Conduction Aphasia: Electroencephalographic and behavioral evidences. Int. J. Clin. Health Psychol. 2014, 14, 240–245. [Google Scholar] [CrossRef]
  60. Terney, D.; Chaieb, L.; Moliadze, V.; Antal, A.; Paulus, W. Increasing human brain excitability by transcranial high-frequency random noise stimulation. J. Neurosci. 2008, 28, 14147–14155. [Google Scholar] [CrossRef]
  61. Naegel, S.; Biermann, J.; Theysohn, N.; Kleinschnitz, C.; Diener, H.-C.; Katsarava, Z.; Obermann, M.; Holle, D. Polarity-specific modulation of pain processing by transcranial direct current stimulation—A blinded longitudinal fMRI study. J. Headache Pain 2018, 19, 99. [Google Scholar] [CrossRef]
  62. Chaudhuri, A.; Behan, P.O. Fatigue and basal ganglia. J. Neurol. Sci. 2000, 179, 34–42. [Google Scholar] [CrossRef]
  63. Okada, T.; Tanaka, M.; Kuratsune, H.; Watanabe, Y.; Sadato, N. Mechanisms underlying fatigue: A voxel-based morphometric study of chronic fatigue syndrome. BMC Neurol. 2004, 4, 14. [Google Scholar] [CrossRef] [PubMed]
  64. Dissanayaka, T.; Zoghi, M.; Farrell, M.; Egan, G.; Jaberzadeh, S. The effects of a single-session cathodal transcranial pulsed current stimulation on corticospinal excitability: A randomized sham-controlled double-blinded study. Eur. J. Neurosci. 2020, 52, 4908–4922. [Google Scholar] [CrossRef] [PubMed]
  65. dos Santos FR, M.; Bazán, P.R.; Balardin, J.B.; de Aratanha, M.A.; Rodrigues, M.; Lacerda, S.; Negi, L.T.; Kozasa, E.H. Changes in Prefrontal fNIRS Activation and Heart Rate Variability during Self-Compassionate Thinking Related to Stressful Memories. Mindfulness 2022, 13, 326–338. [Google Scholar] [CrossRef]
  66. Merzagora, A.C.; Izzetoglu, M.; Polikar, R.; Weisser, V.; Onaral, B.; Schultheis, M.T. Functional Near-Infrared Spectroscopy and Electroencephalography: A Multimodal Imaging Approach. In International Conference on Foundations of Augmented Cognition; Springer: Berlin/Heidelberg, Germany, 2009; pp. 417–426. [Google Scholar]
  67. Tomasi, D.; Ernst, T.; Caparelli, E.C.; Chang, L. Common deactivation patterns during working memory and visual attention tasks: An intra-subject fMRI study at 4 Tesla. Hum. Brain Mapp. 2006, 27, 694–705. [Google Scholar] [CrossRef]
  68. Nguyen, T.; Ahn, S.; Jang, H.; Jun, S.C.; Kim, J.G. Utilization of a combined EEG/NIRS system to predict driver drowsiness. Sci. Rep. 2017, 7, 43933. [Google Scholar] [CrossRef]
  69. Saavedra, L.C.; Morales-Quezada, L.; Doruk, D.; Rozinsky, J.; Coutinho, L.; Faria, P.; Perissinotti, I.; Wang, Q.-M.; Fregni, F. QEEG indexed frontal connectivity effects of transcranial pulsed current stimulation (tPCS): A sham-controlled mechanistic trial. Neurosci. Lett. 2014, 577, 61–65. [Google Scholar] [CrossRef]
  70. Gao, N.; Jiang, J.-J.; Gu, S.-H.; Lu, J.-Z.; Xu, L. Morphological Detection and Functional Assessment of Regenerated Nerve after Neural Prosthesis with a PGLA Nerve Conduit. Sci. Rep. 2017, 7, 46403. [Google Scholar] [CrossRef]
  71. Gianaros, P.J.; Van Der Veen, F.M.; Jennings, J.R. Regional cerebral blood flow correlates with heart period and high-frequency heart period variability during working-memory tasks: Implications for the cortical and subcortical regulation of cardiac autonomic activity. Psychophysiol. 2004, 41, 521–530. [Google Scholar] [CrossRef]
  72. Nikolin, S.; Boonstra, T.W.; Loo, C.K.; Martin, D. Combined effect of prefrontal transcranial direct current stimulation and a working memory task on heart rate variability. PLoS ONE 2017, 12, e0181833. [Google Scholar] [CrossRef]
  73. Barbas, H.; Saha, S.; Rempel-Clower, N.; Ghashghaei, T. Serial pathways from primate prefrontal cortex to autonomic areas may influence emotional expression. BMC Neurosci. 2003, 4, 25. [Google Scholar] [CrossRef] [PubMed]
  74. Shekhar, A.; Sajdyk, T.J.; Gehlert, D.R. The amygdala, panic disorder, and cardiovascular responses. Ann. N. Y. Acad. Sci. 2003, 985, 308–325. [Google Scholar] [CrossRef] [PubMed]
  75. Shaffer, F.; McCraty, R.; Zerr, C.L. A healthy heart is not a metronome: An integrative review of the heart’s anatomy and heart rate variability. Front. Psychol. 2014, 5, 1040. [Google Scholar] [CrossRef] [PubMed]
  76. Berger, R.D.; Saul, J.P.; Cohen, R.J. Transfer function analysis of autonomic regulation. I. Canine atrial rate response. Am. J. Physiol. Heart Circ. Physiol. 1989, 256, H142–H152. [Google Scholar] [CrossRef] [PubMed]
  77. Lang, N.; Siebner, H.R.; Ward, N.S.; Lee, L.; Nitsche, M.A.; Paulus, W.; Rothwell, J.C.; Lemon, R.N.; Frackowiak, R.S. How does transcranial DC stimulation of the primary motor cortex alter regional neuronal activity in the human brain? Eur. J. Neurosci. 2005, 22, 495–504. [Google Scholar] [CrossRef]
  78. Jo, H.; Song, C.; Ikei, H.; Enomoto, S.; Kobayashi, H.; Miyazaki, Y. Physiological and Psychological Effects of Forest and Urban Sounds Using High-Resolution Sound Sources. Int. J. Environ. Res. Public Health 2019, 16, 2649. [Google Scholar] [CrossRef]
  79. Saul, J. Beat-To-Beat Variations of Heart Rate Reflect Modulation of Cardiac Autonomic Outflow. Physiology 1990, 5, 32–37. [Google Scholar] [CrossRef]
  80. Ide, K.; Boushel, R.; Sørensen, H.M.; Fernandes, A.; Cai, Y.; Pott, F.; Secher, N.H. Middle cerebral artery blood velocity during exercise with beta-1 adrenergic and unilateral stellate ganglion blockade in humans. Acta Physiol. Scand. 2000, 170, 33–38. [Google Scholar] [CrossRef]
  81. González-Alonso, J.; Dalsgaard, M.K.; Osada, T.; Volianitis, S.; Dawson, E.; Yoshiga, C.C.; Secher, N.H. Brain and central haemodynamics and oxygenation during maximal exercise in humans. J. Physiol. 2004, 557, 331–342. [Google Scholar] [CrossRef]
Figure 1. Functional near−infrared channel layout. Note: (A) the placement of the electrode sheet; (B) the placement of fNIRS over the DLPFC, FPA, and orbitofrontal area; (C) the changes in the oxygenated hemoglobin in the frontal lobe stimulated by tPCS.
Applsci 12 05609 g001
Figure 2. Experimental testing process.
Applsci 12 05609 g002
Figure 3. Comparison of the effects of tPCS intervention programs on the indicators of HRV and HbO2 after physical fatigue. Note: Applsci 12 05609 i001 means moderate physical fatigue; Applsci 12 05609 i002 means severe physical fatigue. (A) Difference of different tPCS intervention programs on RMSSD before and after intervention. (B) Difference of different tPCS intervention programs on SDNN before and after intervention. (C) Difference of different tPCS intervention programs on LF before and after intervention. (D) Difference of different tPCS intervention programs on HF before and after intervention. (E) Difference of different tPCS intervention programs on HbO2 before and after intervention.
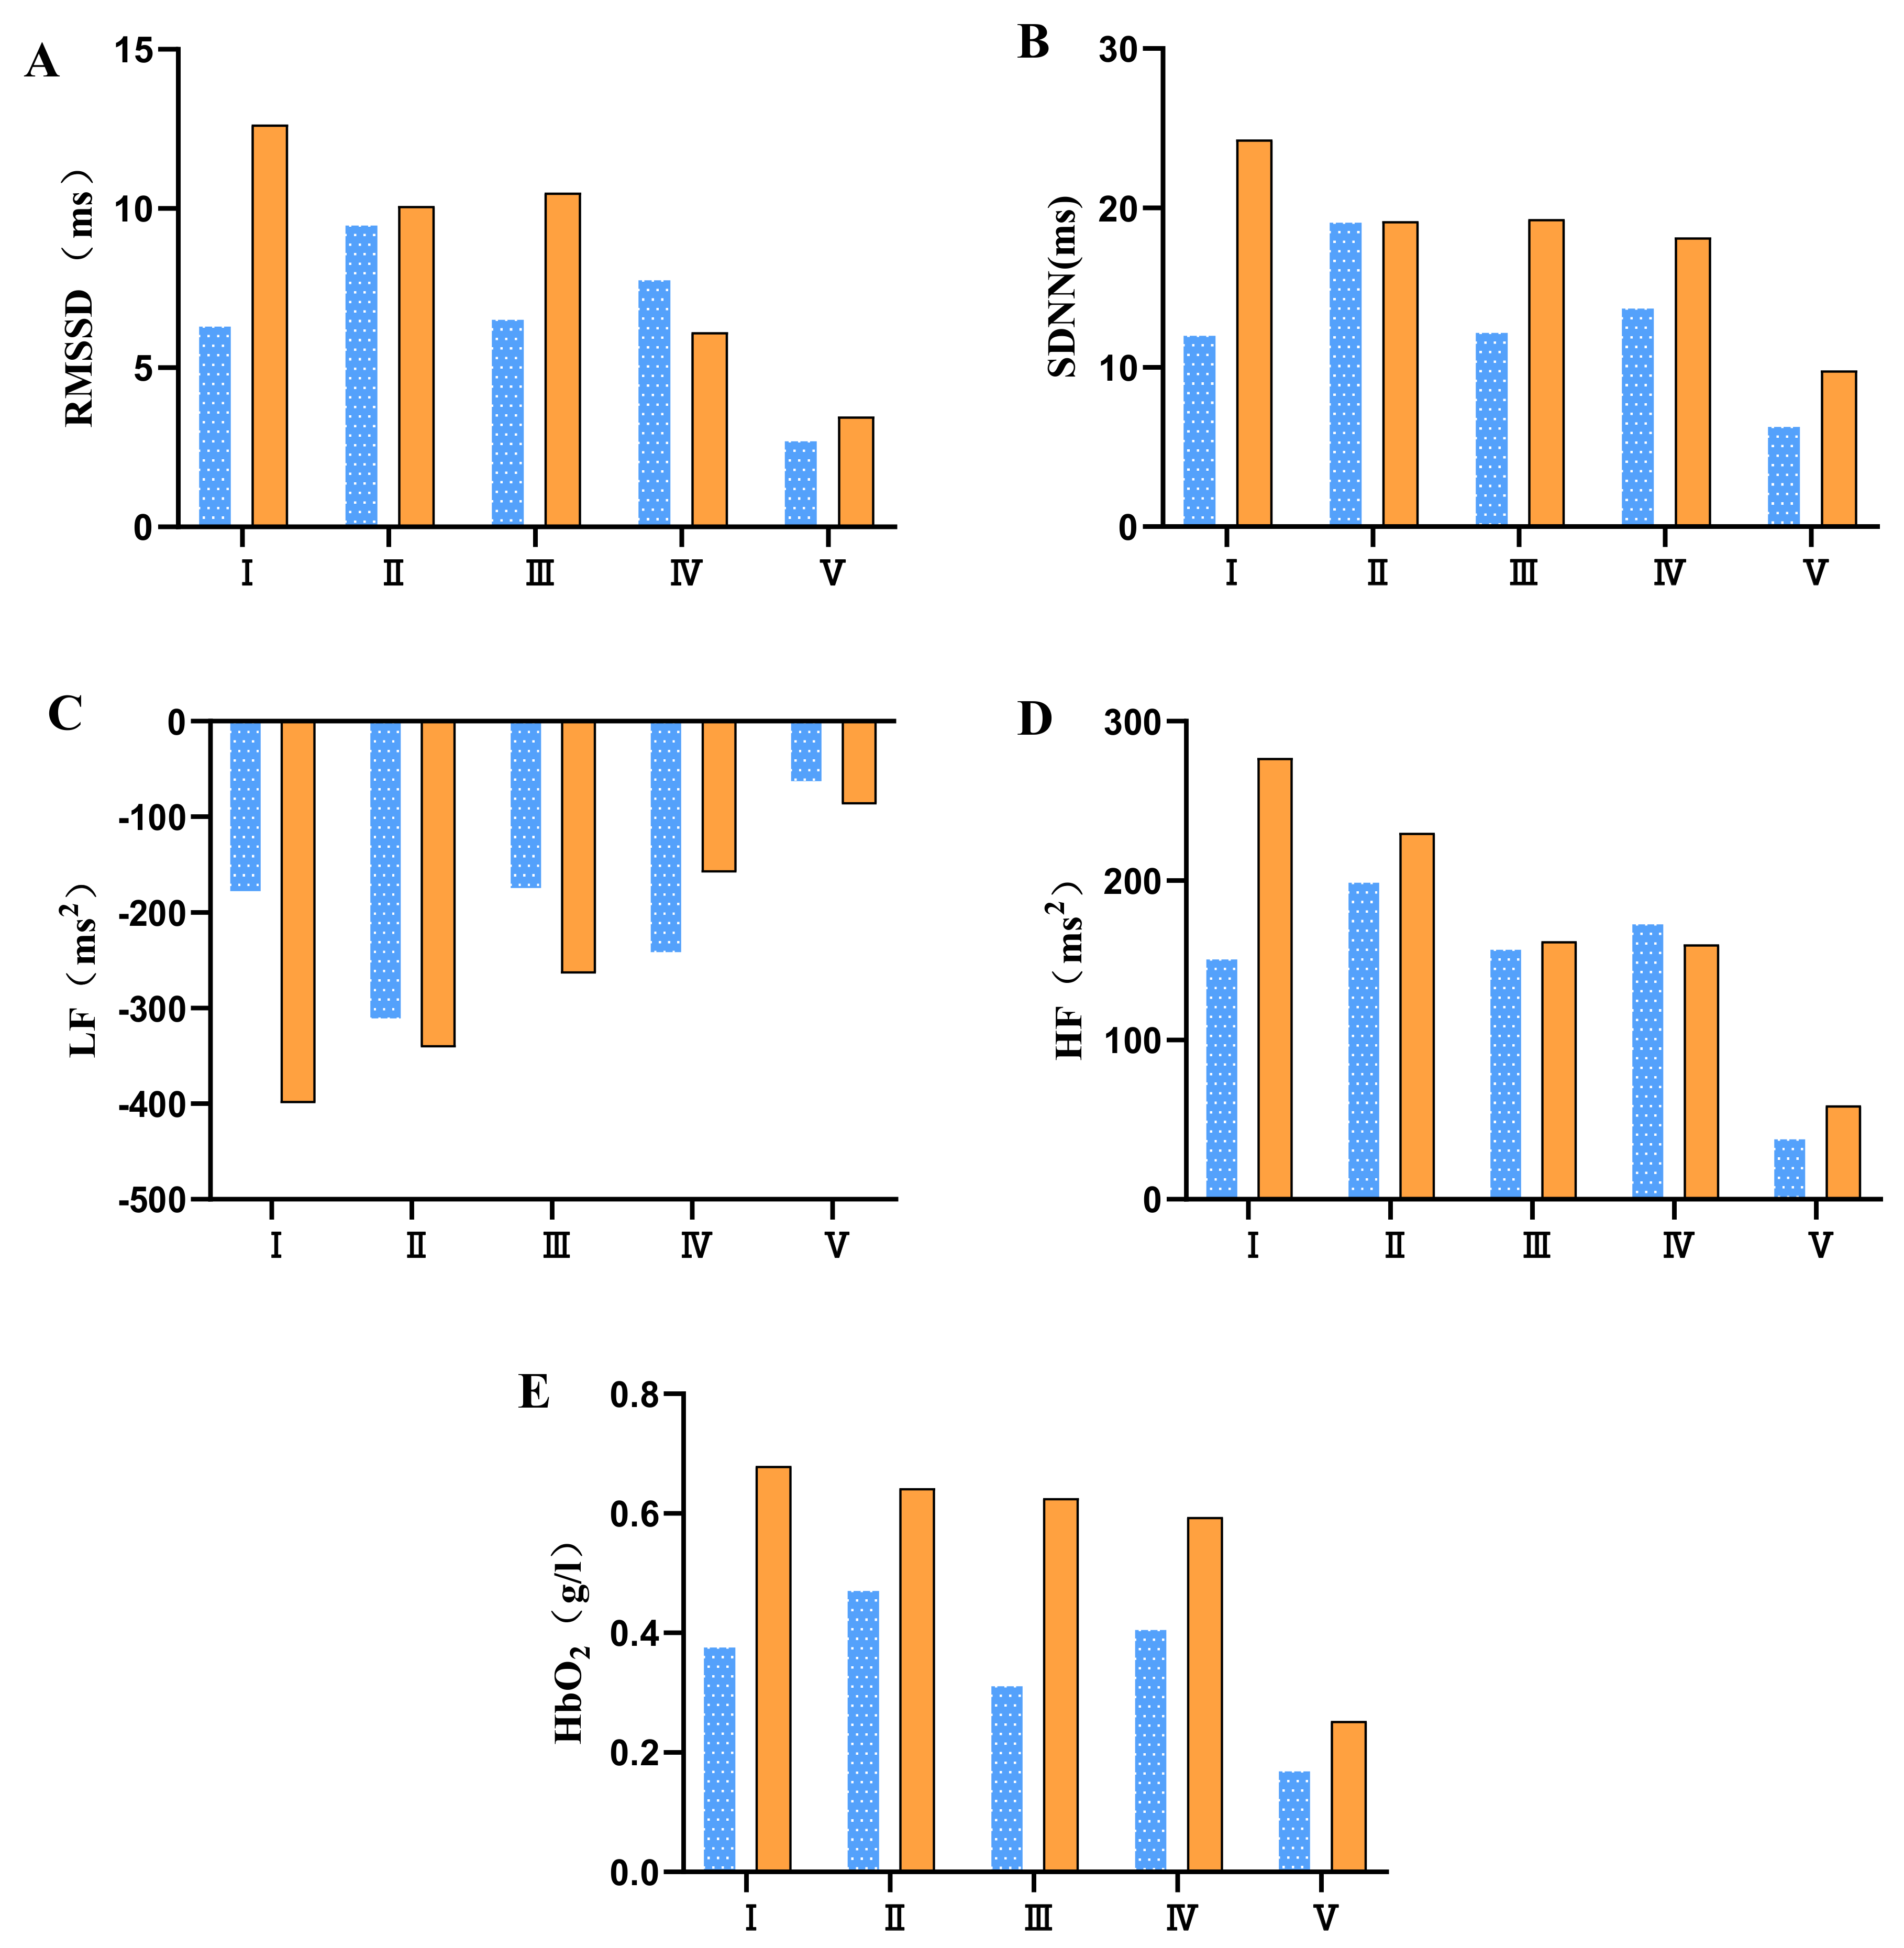
Applsci 12 05609 g003
Figure 4. Effects of tPCS intervention programs on the indicators of HVR and HbO2 after physical fatigue. Note: (A) Effects of tPCS intervention on RMSSD. (B) Effects of tPCS intervention on SDNN. (C) Effects of tPCS intervention on LF. (D) Effects of tPCS intervention on HF. (E) Effects of tPCS intervention on HbO2. ** represents p < 0.05; *** represents p < 0.01; Applsci 12 05609 i003 means before intervention; Applsci 12 05609 i002 means after intervention; 1 means moderate physical fatigue (group A); 2 means severe physical fatigue (group B).
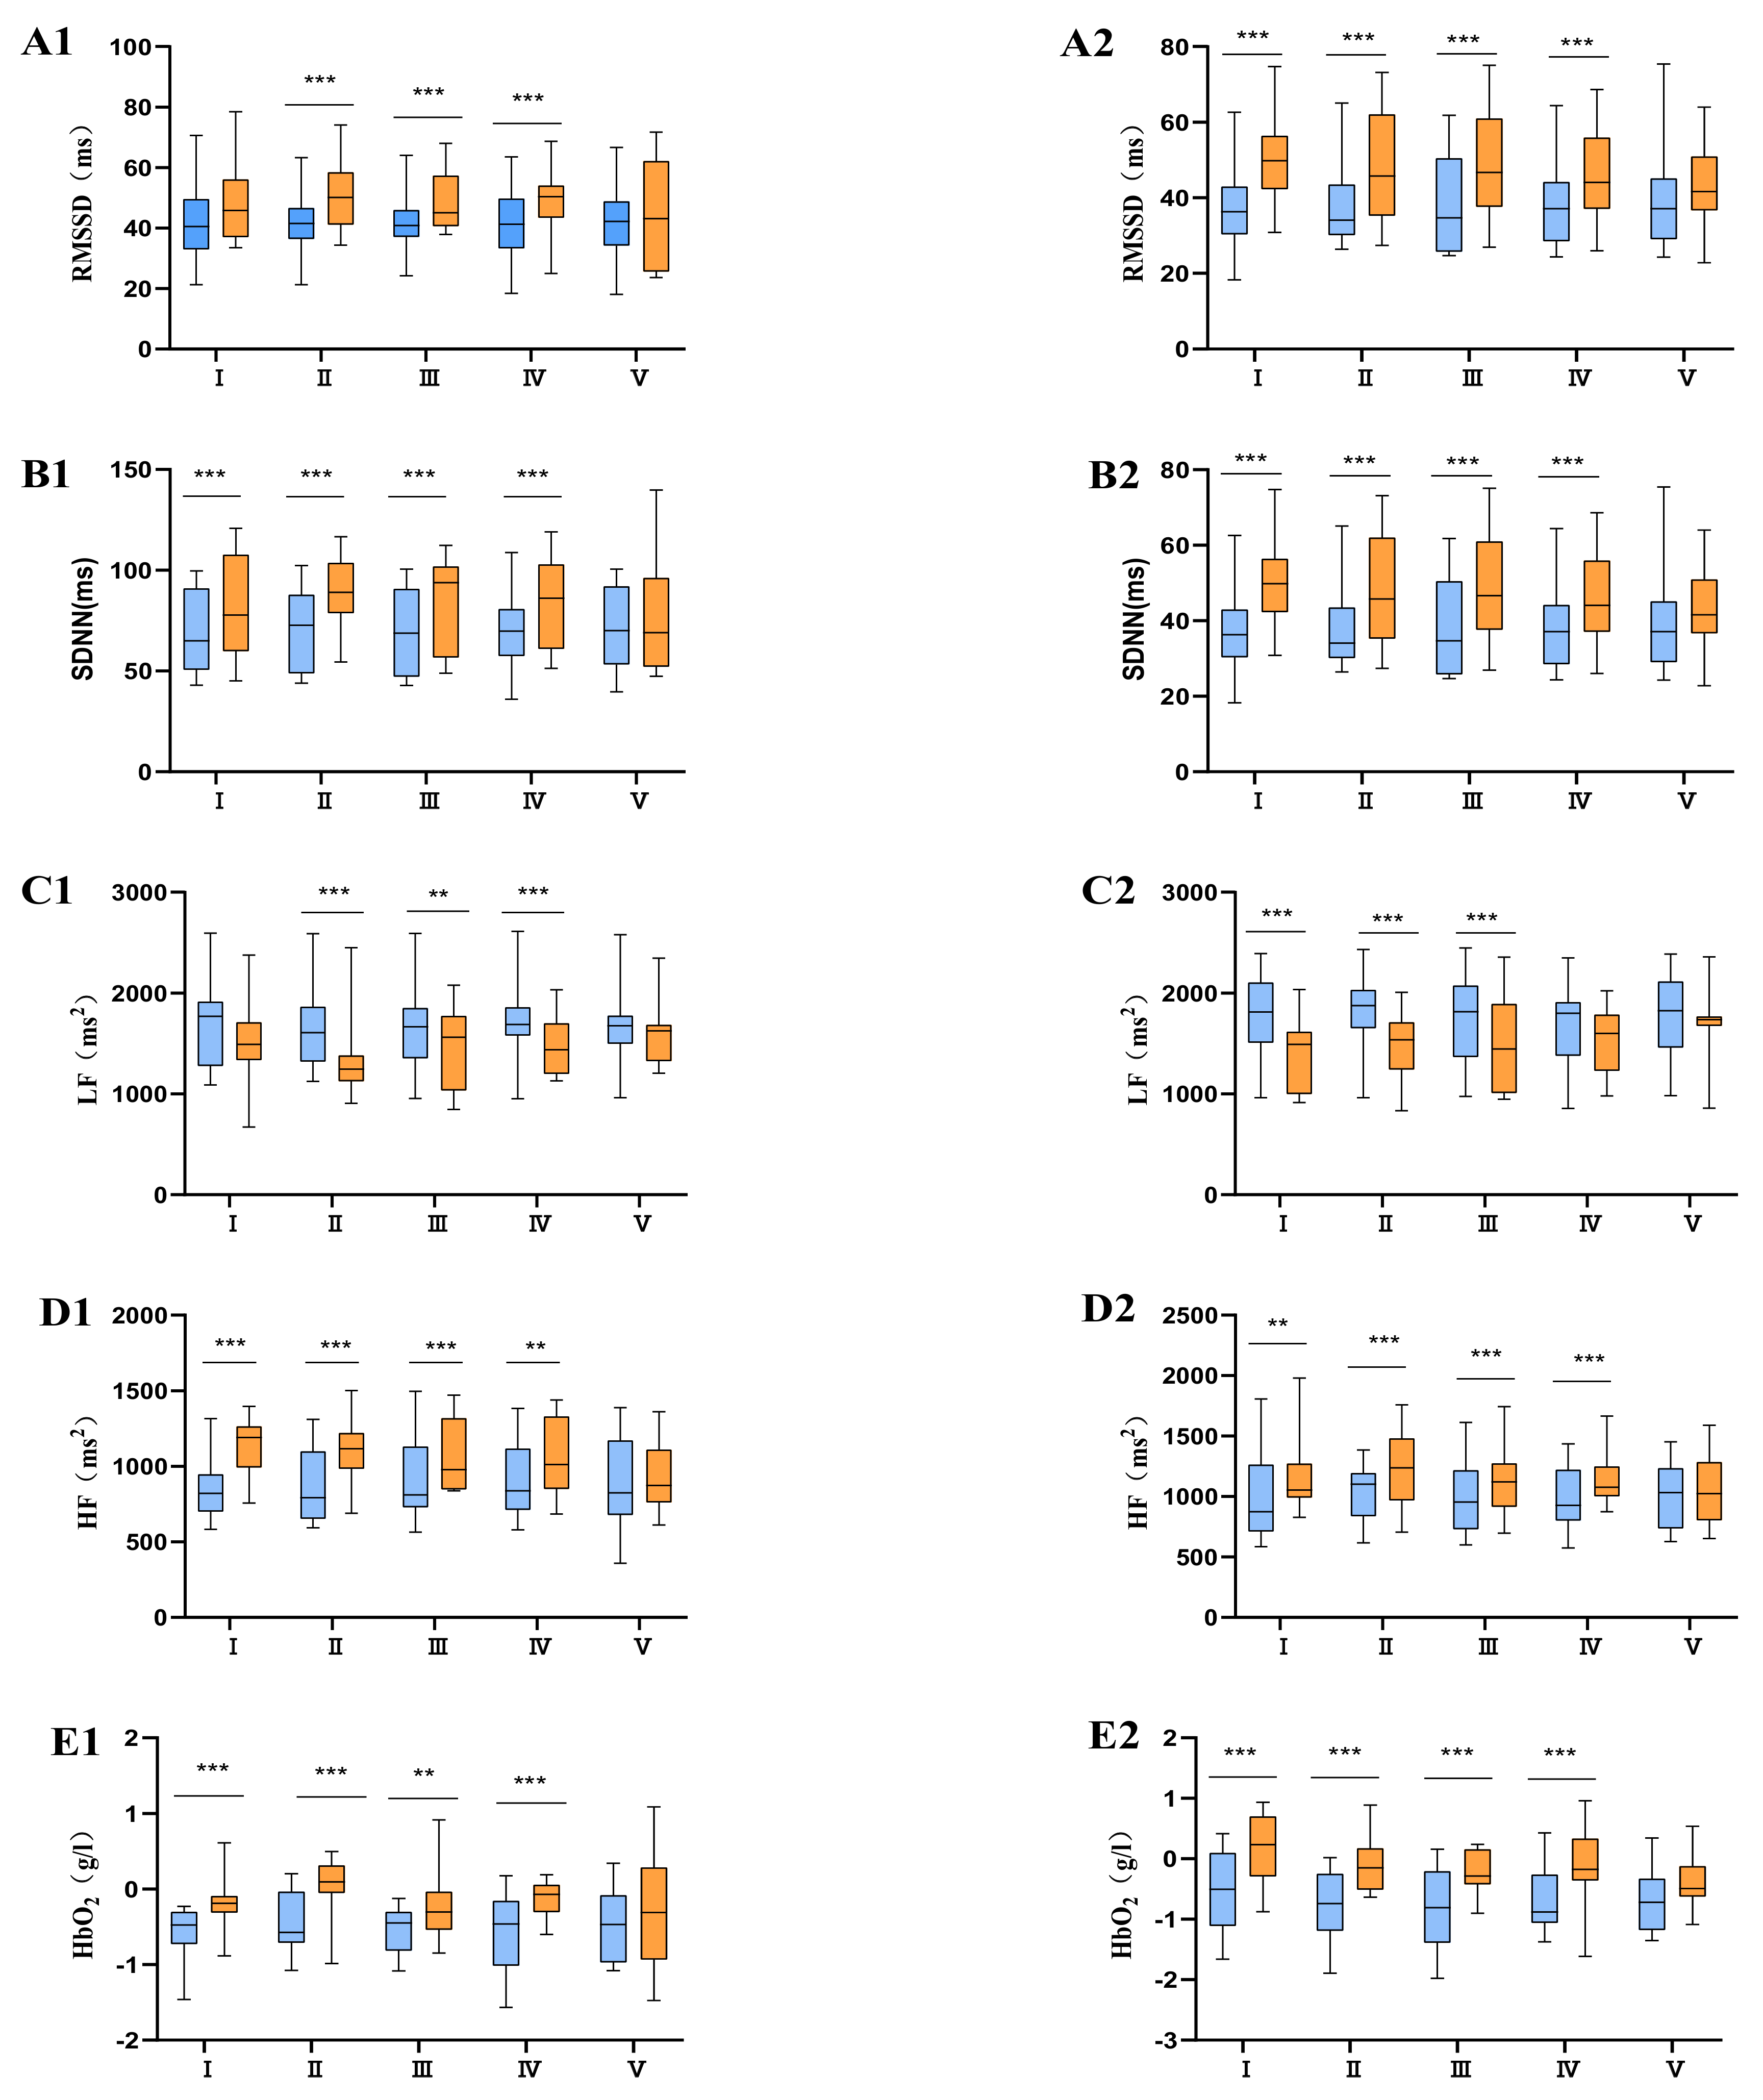
Applsci 12 05609 g004
Figure 5. The path of action of tPCS on HRV.
Applsci 12 05609 g005
Table 1. Basic information of participants.
Age/YearsHeight/cmWeight/kgTraining Years/YearsNumber of MalesNumber of Females
Group A19.87 ± 1.25172.20 ± 4.3072.87 ± 7.856.13 ± 0.83123
Group B19.53 ± 1.24170.47 ± 4.1772.00 ± 7.016.20 ± 0.5696
Table 2. Intervention programs of tPCS.
ProgramIntensity of InterventionTime of Intervention
Isensory intensity + 0.2 mA30 min
IIsensory intensity30 min
IIIsensory intensity + 0.2 mA20 min
IVsensory intensity20 min
Vsham stimulation0 min
Table 3. Effects of tPCS intervention on physiological indexes after different degrees of physical fatigue.
IndicatorsProgramModerate Physical FatigueSevere Physical Fatigue
TpRate (%)TpRate (%)
RMSSDI−1.4050.18212.1−6.3940.00032.6
II−5.0500.00025.4−3.4070.00424.6
III−3.9590.00118.3−3.3620.00526.1
IV−3.4830.00417.5−3.7060.00214.9
V−0.7850.4467.7−1.0820.2987.6
SDNNI−3.6170.00314.8−4.9070.00040.2
II−5.6890.00027.9−5.2450.00032.1
III−3.1750.00717.2−3.6070.00333.1
IV−3.2840.00519.0−3.9480.00130.7
V−1.7050.1109.6−1.8730.08215.2
LFI2.0350.061−8.14.7510.000−22.5
II5.4010.000−19.85.1200.001−23.5
III2.3470.034−10.44.0130.001−14.7
IV4.5270.000−20.92.0330.061−10.3
V1.1030.289−4.51.2890.218−4.5
HFI−2.3930.03112.3−5.5290.00032.6
II−3.6520.00320.6−5.2830.00027.2
III−4.0460.00116.2−3.2700.00618.1
IV−3.3400.00515.9−2.9330.01116.4
V−0.7210.4833.5−0.9940.3375.7
HbO2I−3.255 0.006 −59.0−11.4990.000−127.2
II−6.492 0.000 −109.2−4.218 0.001 −85.6
III−2.245 0.041 −54.8−4.0350.001 −68.5
IV−4.392 0.001 −70.7−4.136 0.001 −84.2
V−1.615 0.129 −32.8−1.966 0.069 −30.8
Publisher’s Note: MDPI stays neutral with regard to jurisdictional claims in published maps and institutional affiliations.

