Abstract
Construction engineering projects are costly and require large amounts of labor, physical, and financial resources. The failure of a construction engineering project typically brings huge losses. Previous studies have focused on the identification of risks, but insufficient attention has been given to strategic resource allocation for risk management after risk identification. Statistics show that most construction engineering project failures are caused by common risks. Common risks are called gray rhino risks. This metaphor illustrates that many risks are obvious but dangerous. This study was motivated by the challenge of efficiently managing gray rhino risks with limited inputs. The literature suggests that gray rhino risks are abundant in construction engineering projects and that there are mutual eliciting relationships between them, which make it difficult for the manager to devote enough resources to the prevention of key risks. Considerable resources are wasted on unimportant risks, resulting in key risk occurrence and failure of construction engineering projects. Therefore, this study describes an innovative multi-criteria decision making (MCDM) technique for ranking risks based on the strength of the eliciting relationships between them. This study used the fuzzy technique and created an interference fuzzy analytical network process (IF-ANP) method. By employing the IF-ANP alongside a decision-making trial and evaluation laboratory (DEMATEL) approach, the subjectivity can be effectively reduced and the accuracy improved during expert risk evaluation for construction engineering projects. IF-ANP was used to quantify eliciting relationships between risks and DEMATEL was used to rank risks based on the IF-ANP result. An empirical study was done to meticulously rank five risks that were selected from the gray rhino risks in the Chengdu–Chongqing Middle Line High-speed Railway construction engineering project. They are capital chain rupture, decision failure, policy and legal risk, economic downturn, and stakeholder conflict. The results showed that the policy and legal risk was the source of other risks, and that these other risks were symptoms rather than the disease.
1. Introduction
Statistically, more than 92% of construction engineering projects in China are influenced by risks such as broken capital chains, decision-making errors, and changes in the economic or political environment, leading to negative consequences such as scheduling delays, budget overruns, and substandard quality. These risks are obvious but do not receive enough attention, which ultimately leads to large losses. Risks with common and dangerous characteristics are metaphorically described as gray rhino risks. Ineffective management of gray rhino risks has become one of the major reasons that prevent projects from achieving their desired goals. In construction projects, significant resources have been devoted to risk management, but gray rhino risks still occur and negatively influence project outcomes. This mismatch between risk management inputs and risk management effectiveness motivated this study.
As construction technology and productivity continue to improve, construction projects are becoming more large-scale and complex. As a result, construction projects are characterized by longer construction cycles, more stakeholders, and more complex interactions with the external environment. Traditional risk research has several shortcomings when dealing with these evolving circumstances. First, insufficient attention has been given to handling obvious risks. Risk identification is always considered the most important stage of risk management [1], and significant effort has been invested in the identification and analysis of the risk factors in construction engineering projects. As such, the scope of risk recognition is constantly expanding [2,3,4]. However, recurrent failures to effectively address these risks have resulted in the continued occurrence of such risks, which has caused preventable project failures [5,6]. While risk identification remains a necessary task, though not a difficult one, construction engineering management must also consider strategies to effectively control risks that are already obvious in order to achieve the desired project goals. Second, few studies evaluate construction project risks from a system perspective. There are often mutualistic relationships between different construction project risks. Risks and relationships constitute a network structure of mutual influence, and evaluation of project risks from an isolated perspective will ignore the types of risks that are prone to secondary risks but do not cause much damage themselves [7]. This results in the frequent occurrence of secondary risks in engineering projects. Third, the risk evaluation process ignores the impact of complex systems on the accuracy of expert evaluation data. Existing research approaches mostly consider the fuzziness of the collected data at the computational stage and attempt to reduce its effect on the results using specific data processing methods. Few studies have reduced data ambiguity from the data collection process. Unfortunately, reducing the adverse effects of data subjectivity through a complex calculation process has limited effect. When the evaluation object is the relationship between construction project risks, a new method of data collection is required to improve the data quality.
The current work is motivated by these research gaps and combines innovation relating to both theory and methodology. In terms of theoretical innovation, this study attempts to consider engineering project risks as a network system. The risk weights are evaluated by calculating the ability of the risk to elicit other risks in the network system. This is more consistent with engineering reality, where project risks exist as interacting systems rather than as independent events. In terms of methodology innovation, this research incorporates the idea of interference into the MCDM method to create an interference-MCMD method. The interference-MCDM replaces the traditional one-time direct evaluation of risk relationships with a two-time indirect evaluation of risk relationships under different risk assumptions. The eliciting relationships among risks are reflected by the difference between these two sets of indirect evaluations. This method is closer to the essence of risks and causes subjectivity in expert survey data to cancel each other out. The data processing result shows that data calculated by the interference fuzzy analytical network process (IF-ANP, one of the interference-MCDM methods combined with the fuzzy technique) have much better credibility than traditional MCDM methods.
The remainder of this paper is organized as follows: Section 2 is a review of the existing literature related to this work. Section 3 clarifies the study framework, offers a brief introduction to factor analysis fuzzy measure, the IF-AHP method, and the DEMATEL method, and constructs the construction engineering risk analysis model. In Section 4, empirical experiments of the Chengdu–Chongqing Middle Line High-speed Railway construction engineering project are studied using the proposed model. The analysis result is shown in Section 5. Section 6 presents the conclusions obtained through the research results. The conclusions are discussed in Section 7.
2. Literature Review
2.1. Gray Rhino Risks in Construction Engineering Projects
Gray rhino risks are obvious risks that are inadequately acknowledged and ultimately lead to serious damage and great loss [8]. This metaphor illustrates that many risks are obvious but dangerous. In the field of construction engineering projects, gray rhino risks are common [9]. Xiang investigated 30 megaprojects that failed to achieve expected goals. The study found that the five most common reasons for the failures were (1) a break in the capital chain, which includes insufficient financing and cost overrun (eight projects), (2) decision-making mistakes caused by the chief company’s poor management skills and inexperience (seven projects), (3) contract changes due to business problems of the contracting award company (five projects), (4) legal risks and policy changes (five projects), and (5) stakeholder conflict (four projects) [10]. Utama et al. studied 26 papers concerning megaproject risks. They summarized 31 risks pointed out by 26 experts that may hinder the implementation of megaprojects [11]. The risks found in Xiang’s research were also recognized by these authors. Among the 26 experts, risk 1 was recognized by 22, risk 2 by 14, risk 3 by 14, risk 4 by 15, and risk 5 by 17. These risks were considered likely to hinder megaprojects from reaching their intended goals. Hence, in these two studies, the experts demonstrate an accurate understanding of the risks of megaprojects. Risk types with high recognition have a greater probability of leading to the failure of megaprojects. Whereas experts can accurately evaluate the probability and loss of various risk events, this still cannot prevent these risk events or reduce the losses after they occur.
An important reason for the phenomenon that obvious risks cause many construction engineering project failures is that the number of obvious risks is too large to allocate sufficient resources to managing each risk. Many resources are wasted on unnecessary risks, which results in insufficient investment in the prevention of key risks [12]. An effective risk ranking method for screening key risks is necessary to manage gray rhino risks in construction engineering projects. The complex eliciting relationships among gray rhino risks also make it difficult to manage them effectively. Goldratt presented the theory of constraints, which suggests that the whole concept should be regarded as a system, and the efficiency of the system can be maximized only when the relationship between each part of the system is accurately grasped and handled properly [13]. Common methods for ranking risks are based on the probability of risk occurrence and the expected loss caused by the risk [14,15]. Based on these traditional methods, more resources are put into preventing risks that have a high probability of occurrence or cause high loss. However, the occurrence of a risk event usually leads to a variety of other risks at the same time, and all risk probabilities will change [16]. Common risk ranking methods rarely consider eliciting relationships between risks. When risk prevention is carried out from an isolated perspective while ignoring the impact of other related risks, it is difficult to achieve desired holistic results [17]. Therefore, it is necessary to design a method that can consider the eliciting relationships among risks for assessing gray rhino risks in construction engineering projects.
2.2. MCDM Methods for Construction Engineering Project Risk Evaluation
Because of its simplicity and flexibility, the MCDM method is widely used to assess problems and has been successfully implemented in many research fields [18,19]. The gray rhino risks of construction engineering projects can be characterized by several ranking criteria and managers in construction engineering projects need to convert these numerous criteria into a tangible risk prevention plan. The problem of risk ranking based on several criteria has already been identified as an MCDM problem by different researchers [20,21]. Many MCDM methods have been able to rank the factors based on their interrelationships, such as decision-making trial and evaluation laboratory (DEMATEL), distance-based approximate (DBA), complex proportional assessment (COPRAS), etc. However, the risks in construction engineering projects and their relationship network constitute a complex system, which makes it difficult for experts to directly provide clear judgments on relationships among risk factors [22]. The greater the complexity of the evaluation object, the stronger the subjectivity of expert evaluation results; hence, MCDM methods for construction engineering project risk evaluation often require additional techniques to reduce subjectivity in expert survey data [23]. Fuzzy theory has been used to reduce the influence of human cognition fuzziness. For example, Yan used the fuzzy-ANP to evaluate risks in the process of engineering construction, Yucesan and Kahraman used the fuzzy-ANP to manage risks in hydropower plant construction operation projects, and Maria and Reinhard used the fuzzy-AHP to analyze risks in energy projects [24,25]. Many fuzzy number transfer techniques such as triangle fuzzy number, trapezoid fuzzy number, fuzzy sets (type-1 and 2), and spherical fuzzy sets have been successfully used to reduce subjectivity in expert scoring [26,27]. The current work also used the fuzzy technique to deal with the complexity of construction engineering projects.
However, while fuzzy technology can remedy the subjective influence in survey data, it cannot improve the credibility of survey data itself. As research objects become more complex, further reductions in subjectivity require more complex fuzzy sets [28]. Yet the complexity of fuzzy sets used to reduce subjectivity in expert survey data has already reached the technical limits. Many studies have demonstrated that there is little difference between using different fuzzy sets in the same study; in some cases, simple fuzzy sets performed even better than complex ones [29,30]. Fuzzy technology has limited effects on the subjectivity of expert valuation when the valued object is a construction engineering risk system [31]. Other methods that can directly increase the credibility of survey data are needed to improve the accuracy of MCDM methods.
2.3. Methods to Improve the Accuracy of MCDM Methods
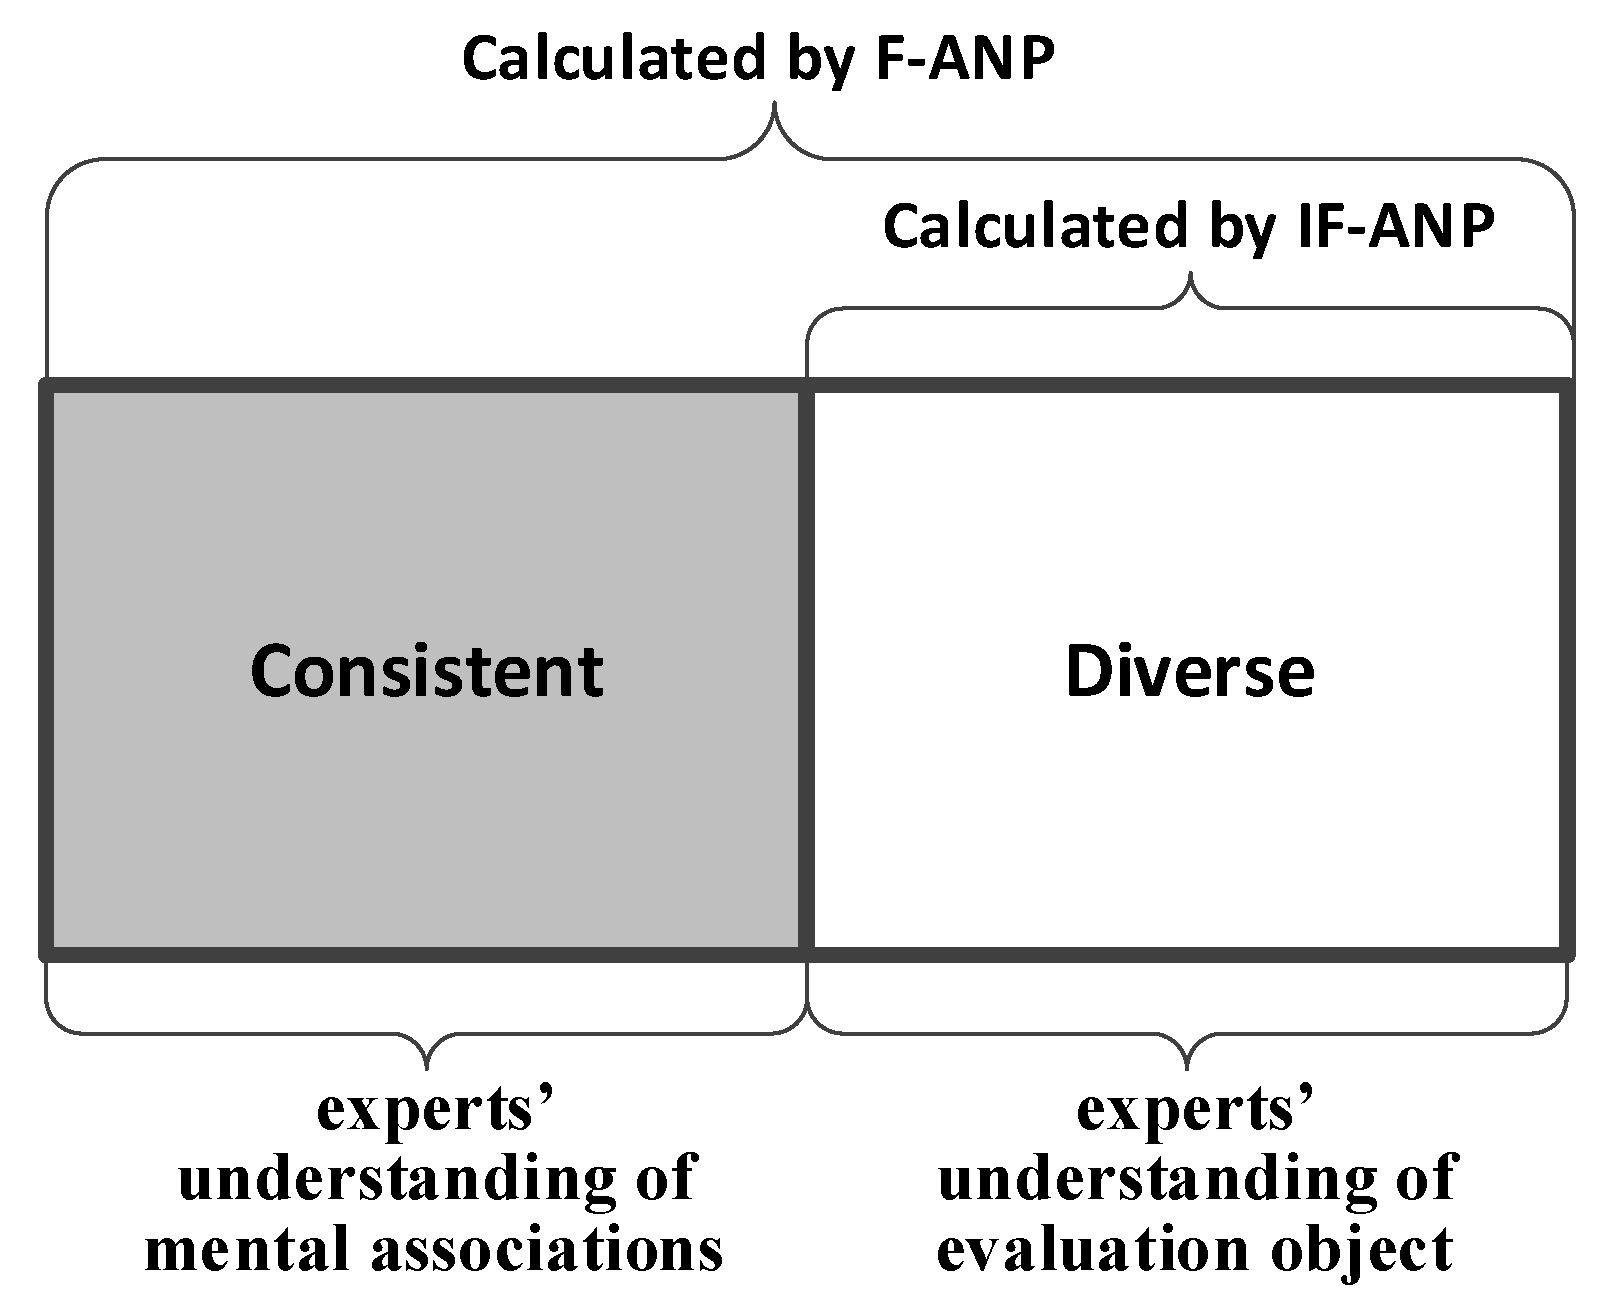
Knowledge of the sources of subjectivity is necessary to improve the credibility of expert survey data. Wang argued that risks are objective and cannot be eliminated, so managers in a construction engineering project need to anticipate risks and prepare a suitable risk prevention plan. A more appropriate prevention plan can better minimize risk loss [32]. The essence of the construction engineering project risk is the difference between the manager’s prediction of the future situation and the actual future situation. This difference can lead to the risk prevention plan not working as expected, resulting in the project failure [33]. There are two parts that comprise the human understanding of the object: the understanding of the object itself and the understanding of mental associations generated by the object [34]. To achieve a high-quality expert survey, the experts’ understanding of the research object should be consistent and their mental associations generated by the research object should be diverse [35]. These two different modes of understanding are mixed in the survey data and have different values in different studies. For cognitive studies and evaluation studies, the experts’ understanding of the evaluation object is necessary information, while the subjectivity generated by the experts’ mental associations is the noise; hence, many methods are used to reduce subjectivity [36]. However, for exploratory studies and optimization studies, innovation is hidden within the mental associations, but relatively less value is placed on the understanding of the object itself [37]. The risk assessment method should be curated to capture the essence of the risk, and lower subjectivity in the risk assessment indicates better evaluation results that accurately reflect the evaluated objects.
Most traditional MCDM methods, such as ANP, DEMATEL, and TOPSIS, require experts to directly evaluate relationships among risks [38]. The expert survey data collected by such methods always combine many experts’ understanding of mental associations with their understanding of the essence of risks, producing data that is volatile and subjective. As construction engineering project risk management emphasizes risk cognition, the experts’ understanding of construction engineering risks is more important than their mental associations [39]. To further reduce the experts’ mental associations during the valuation of construction engineering project risks, a novel method for extracting experts’ knowledge of the essence of risk is valuable for this study.
3. Research Method
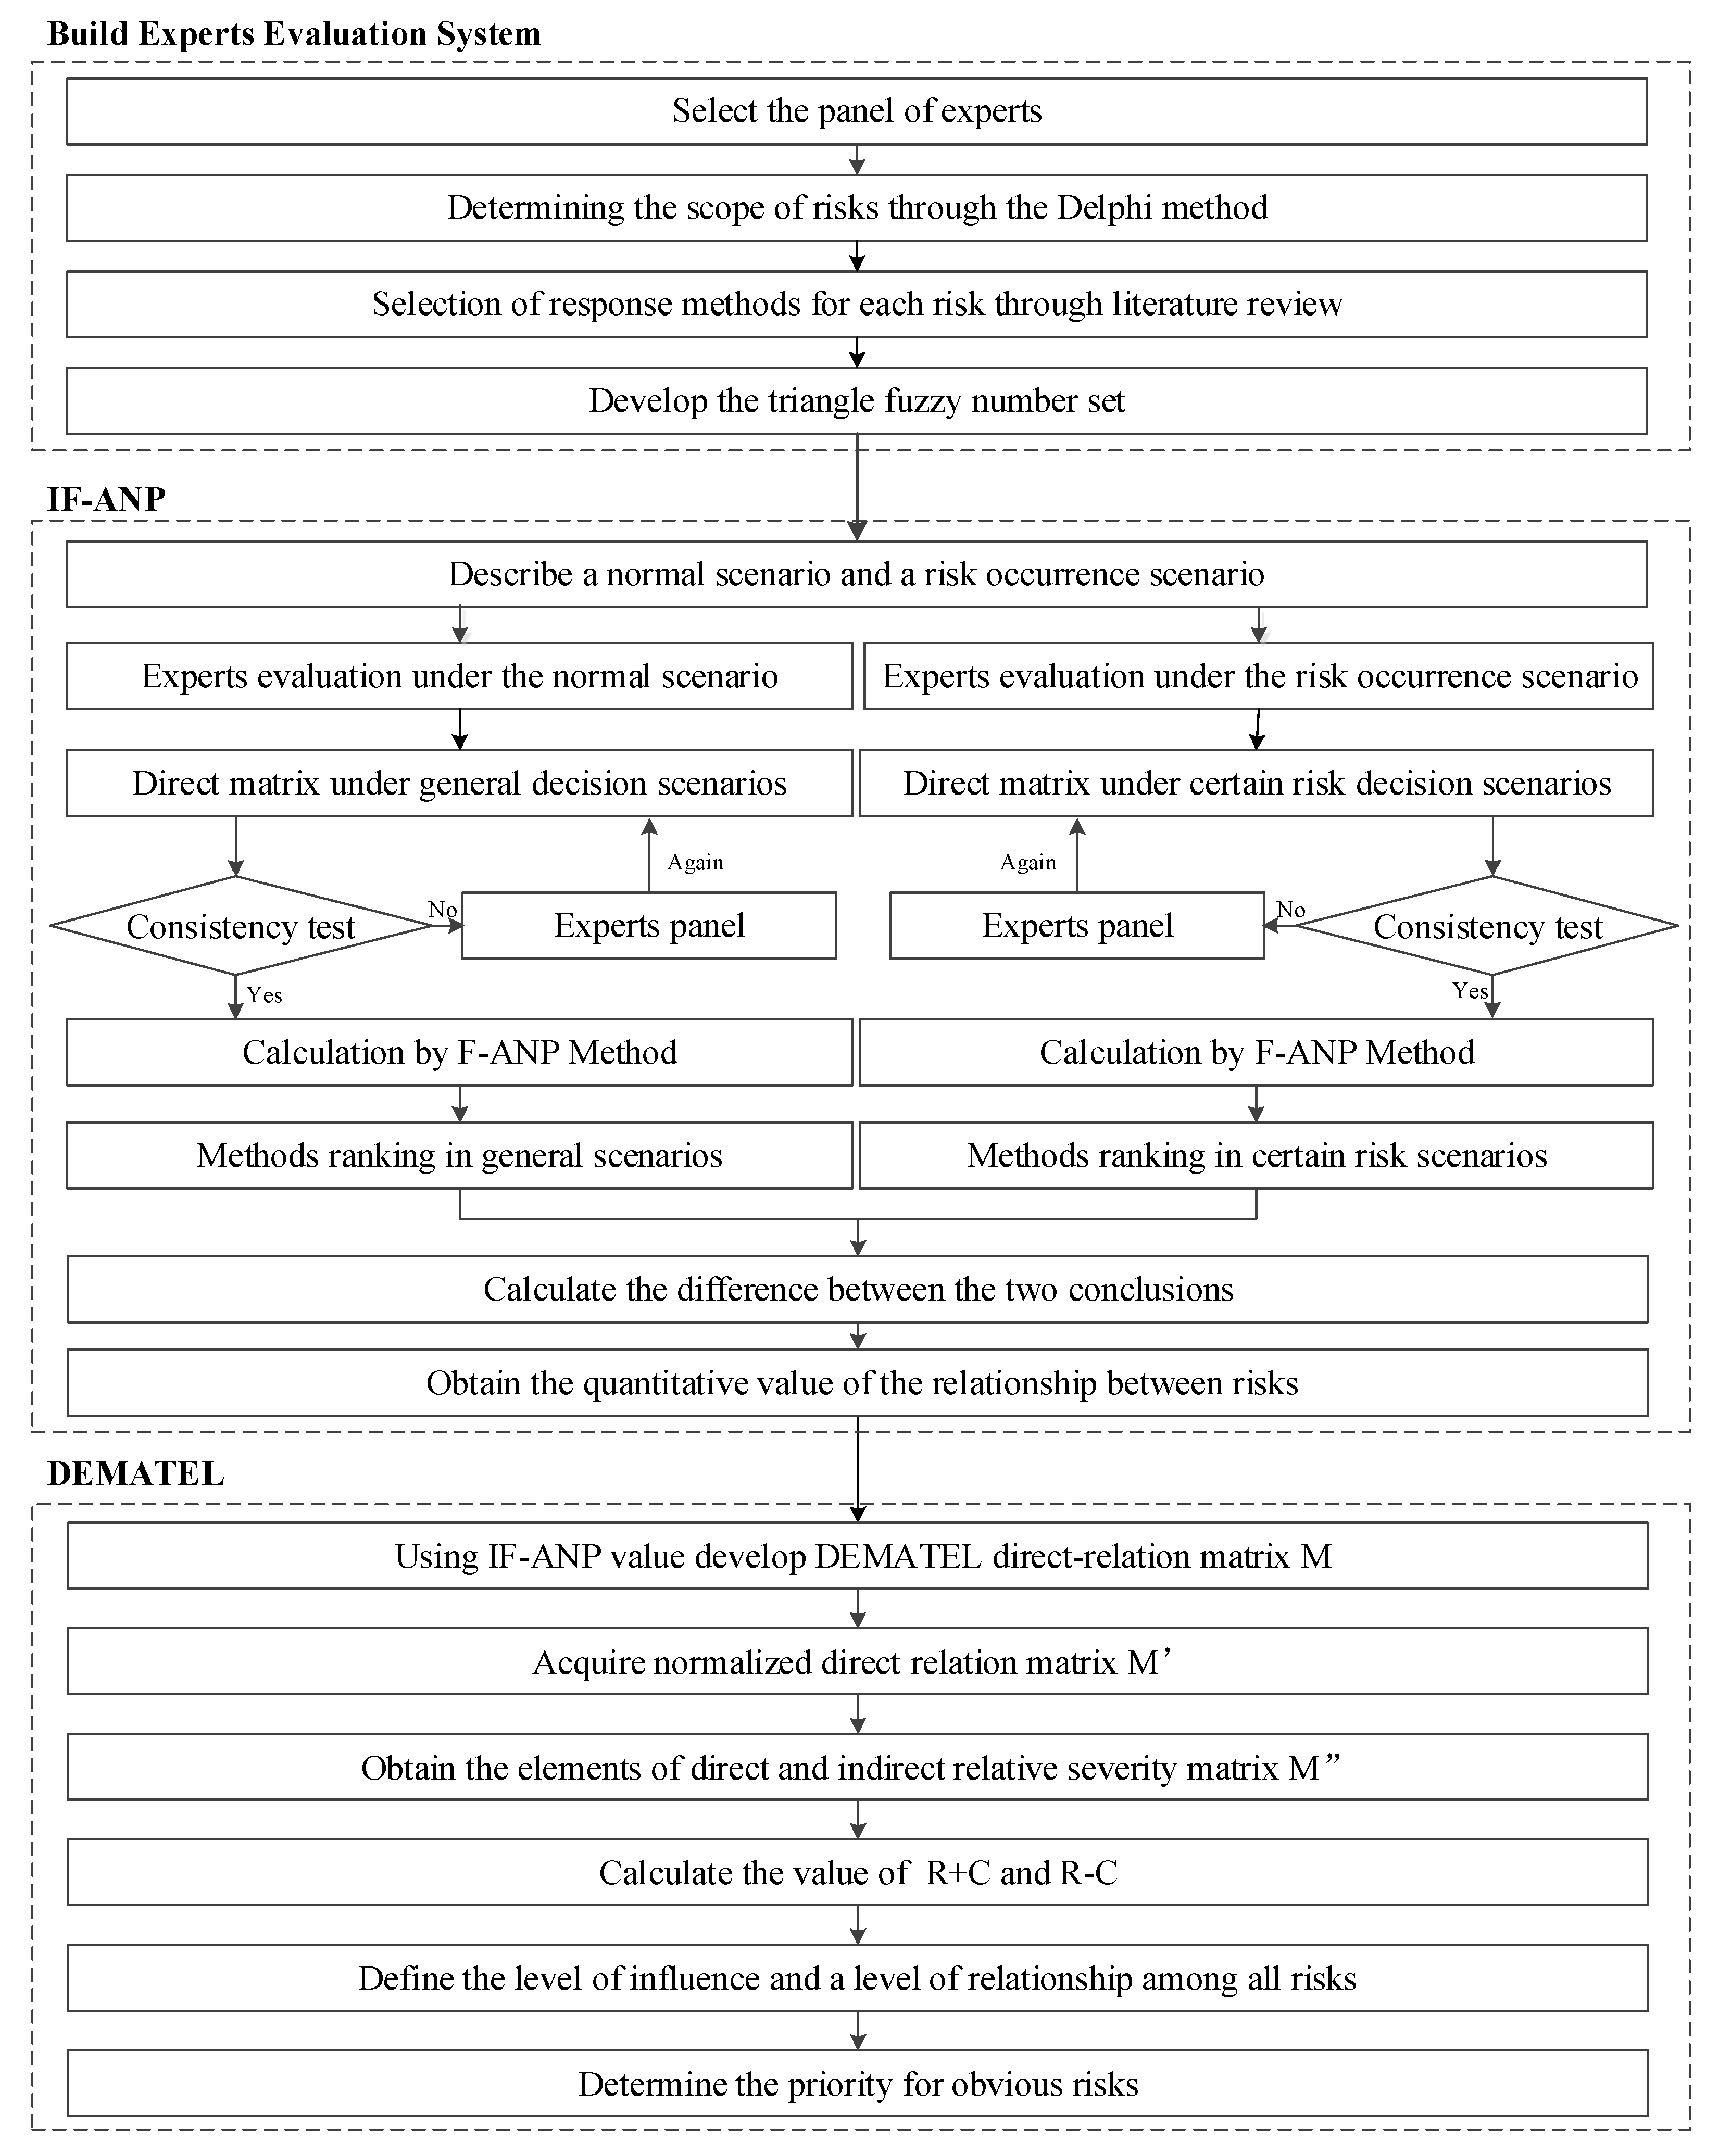
The innovative MCDM methods proposed in this work and the research framework are presented in Figure 1. First, experts who meet the requirements are invited to participate in the study. Experts then help delineate the scope of risks. A literature review is conducted to cull prevention plans for the risks in the scope. Second, expert interviews and questionnaires are conducted to collect data. Based on the data collected, the interrelationships among risks are assessed using IF-ANP. Third, in association with the interrelationship values calculated by IF-ANP, the DEMATEL method is used to rank risks.
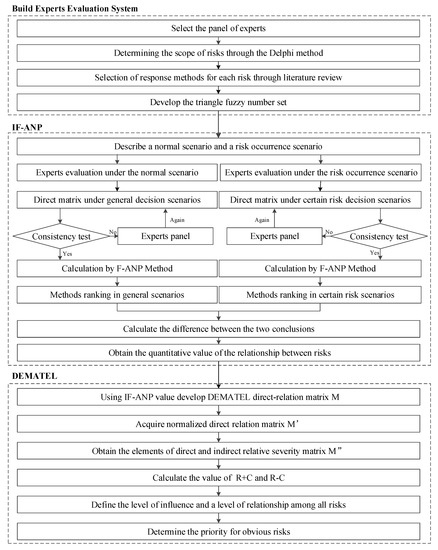
Figure 1.
The framework of this study.
3.1. Building the Expert Evaluation System
Expert-guided risk evaluation for construction projects is suitable for advising risk management tasks in the early stage of the project when there is very little information and data on project risks. Therefore, successful risk management in a construction engineering project requires the wisdom of experts. To better utilize expert advice, this study constructs an expert evaluation system based on interviews and questionnaires.
3.1.1. Step 1: Select the Team of Experts and Organize Questionnaires
Several experts in the field of construction engineering project risk management should be invited to participate in the research. The invited experts should work in government departments, construction companies, insurance companies, financial companies, and other related industries, and possess sufficient experience in their area.
This study ranks risks based on interrelationships among them and used the IF-ANP method for calculation. To determine the number of questionnaires, consider the following example. Two different questionnaires are required to calculate the influence of α risk on β risk to evaluate the change in the β risk prevention plan when α risk occurs. One questionnaire is used to establish a β risk prevention plan under a normal scenario while the other is used to prepare a β risk prevention plan under α risk occurrence. If is the number of risks that must be ranked, then the number of questionnaires that each expert is required to fill out is . To ensure that expert assessments of risk are not affected by previous investigations, questionnaires in groups should be sent to each expert over weeks, one group at a time. Since experts will need to spend considerable time and effort engaged in this process, they should be appropriately paid.
3.1.2. Step 2: Delineate the Risk Ranking Scope
Gray rhino risks are abundant in a construction engineering project. The meticulous ranking of all gray rhino risks in a construction engineering project would waste a lot of human and material resources. Fortunately, construction project engineering risks have relatively strict eliciting relationships with each other, the number of source risks is small, and most of the risks are secondary risks arising from the occurrence of the source risks [40]. This allows experts to easily weed out unimportant risks, which can reduce the number of risks that need to be meticulously ranked and greatly reduce the difficulty of gray risk management. The scope of the gray rhino risks that are needed to be meticulously ranked will be delineated through the Delphi method in this study.
3.1.3. Step 3: Risk Response Methods Options
The interference fuzzy-analytic network process (IF-ANP) is an innovative MCDM method that is proposed in this work. The IF-ANP method requires experts to evaluate the importance of the risk response methods in the general decision scenarios and in specific risk scenarios. A risk response plan consists of several risk response methods ranging from conservative to aggressive. In different risk response plans, risk response methods are given different priorities. With the IF-ANP method, two different risk response plans for the general decision scenarios and under certain risk scenarios can be obtained. By comparing the differences between these two risk response plans, the interrelationship between the risks can be found. The greater the difference, the less adequate the response plan, and the greater the effect of the risk on other risks.
The IF-ANP changes the conventional practice where experts provide evaluation values directly. It can reduce the effect of subjectivity and improve the reliability and validity of the assessments. The IF-ANP requires researchers to assign groups of risk response methods as expert evaluation objects, thus the literature review may be used to identify risk response methods for the risks in the ranking scope.
3.1.4. Step 4: Develop Fuzzy Linguistic Scales
Because of the subjective nature of human thinking in the decision-making process, the evaluating criteria and alternatives are often challenged by uncertain and fuzzy circumstances. In practice, construction engineering risk evaluation is affected by uncertainty as well as other decision-making problems. In these cases, the theory of fuzzy sets is the most commonly used for dealing with uncertainty. Although this study incorporates the idea of interference, the theory of fuzzy sets is also inherited in this work.
A major contribution of fuzzy set theory is its ability to represent vague data. The theory also allows the application of mathematical operators and programming to the fuzzy domain. In the process of fuzzy operation, if a symbol represents a fuzzy set, a tilde “~” is placed above it. A triangular fuzzy number (TFN) is denoted simply as (l,m,u). The parameters l, m, and u denote the smallest possible value, the most promising value, and the largest possible value, respectively, that describe a fuzzy event. Z = (l,m,u) on X is a TFN if its membership function follows
Here, we use five basic linguistic scale terms: “Equal”, “Weakly important”, “More important”, “Strongly more important”, and “Absolutely more important”. Table 1 shows the relative importance of factors that were evaluated with this fuzzy-level scale.

Table 1.
Basic linguistics and TFN.
3.2. Interference Fuzzy Analytical Network Process
The ANP enables complicated interdependencies among the decision levels and evaluation factors (attributes) [41]. This research incorporated the idea of interference into the fuzzy-analytic network process (F-ANP) method and created IF-ANP. This work determined the extent to which one risk influences another using a traditional F-ANP method [42]. This approach is commonly used for deriving weights under uncertain environments because its mathematical foundation is straightforward and fuzzy. While the traditional IF-ANP method involves only one direct evaluation, IF-ANP involves two indirect evaluations, making the MCDM method more suitable for construction engineering project risk management. The direct judgments and proofs given by experts were calculated using the following steps:
3.2.1. Step 1: Build General Decision Scenarios and Decision Scenarios under Certain Risk
Consider the example of the effect of the α risk on the β risk calculation. To cope with the β risk that may occur during a construction engineering project, a risk response plan must be formulated in the early stages of the project. However, if the α risk occurs during the construction stage, the response plan to deal with the β risk may not adapt to this new situation. To quantify this influence, this study calculates the differences between two risk response plans designed to deal with the β risk under both general scenarios and the α risk occurrence scenarios. The larger this difference was, the more likely the α risk leads to the β risk. The calculation process includes these steps:
First, a questionnaire was sent to the kth expert among the experts that we invited. The questionnaire contained three parts: (1) A detailed description of the construction engineering project that was taken as the research object; (2) n risks response methods to deal with the β risk; and (3) a direct comparison matrix that the expert was required to fill out. The expert did pairwise comparisons using the TFN linguistic scale. Thus, the relative importance of an element alternative measures the ith risk response method over jth risk response method by the expert and is represented as in Equation (2).
where .
Second, another questionnaire was sent to the expert after one week or longer. This questionnaire added a detailed description of the α risk in the project. The expert again performed pairwise comparisons using the TFN linguistic scale. Thus, the relative importance of the element alternative measures the ith risk response method over the jth risk response method by the expert under the conditions of α risk occurrence, which is represented as in Equation (3).
where .
Two matrices were tested for consistency using the equation CR = CI/RI, where CI is the consistency index and RI is the random consensus index. The CI can be calculated using Equation (4), and RI = 0.89, 1.12, 1.26… when the matrix is of an order of 5, 6, 7… [43]. This manuscript set the standard CR value to 0.2. If the conditions were such that CR exceeded 0.2, experts were asked about the cause of the inconsistency.
3.2.2. Step 2: Calculate the Value of the Fuzzy Synthetic Extent
The value of , the fuzzy synthetic extent (fuzzy weights), with respect to the fuzzy extent values of dimensions for each element i (i = 1, 2, …, n) in is defined by Equation (5).
where came from in Equation (2).
3.2.3. Step 3: Calculate the Degree of Probability
The is the degree of probability of , defined in Equation (6).
which can be expressed equivalently as Equation (7).
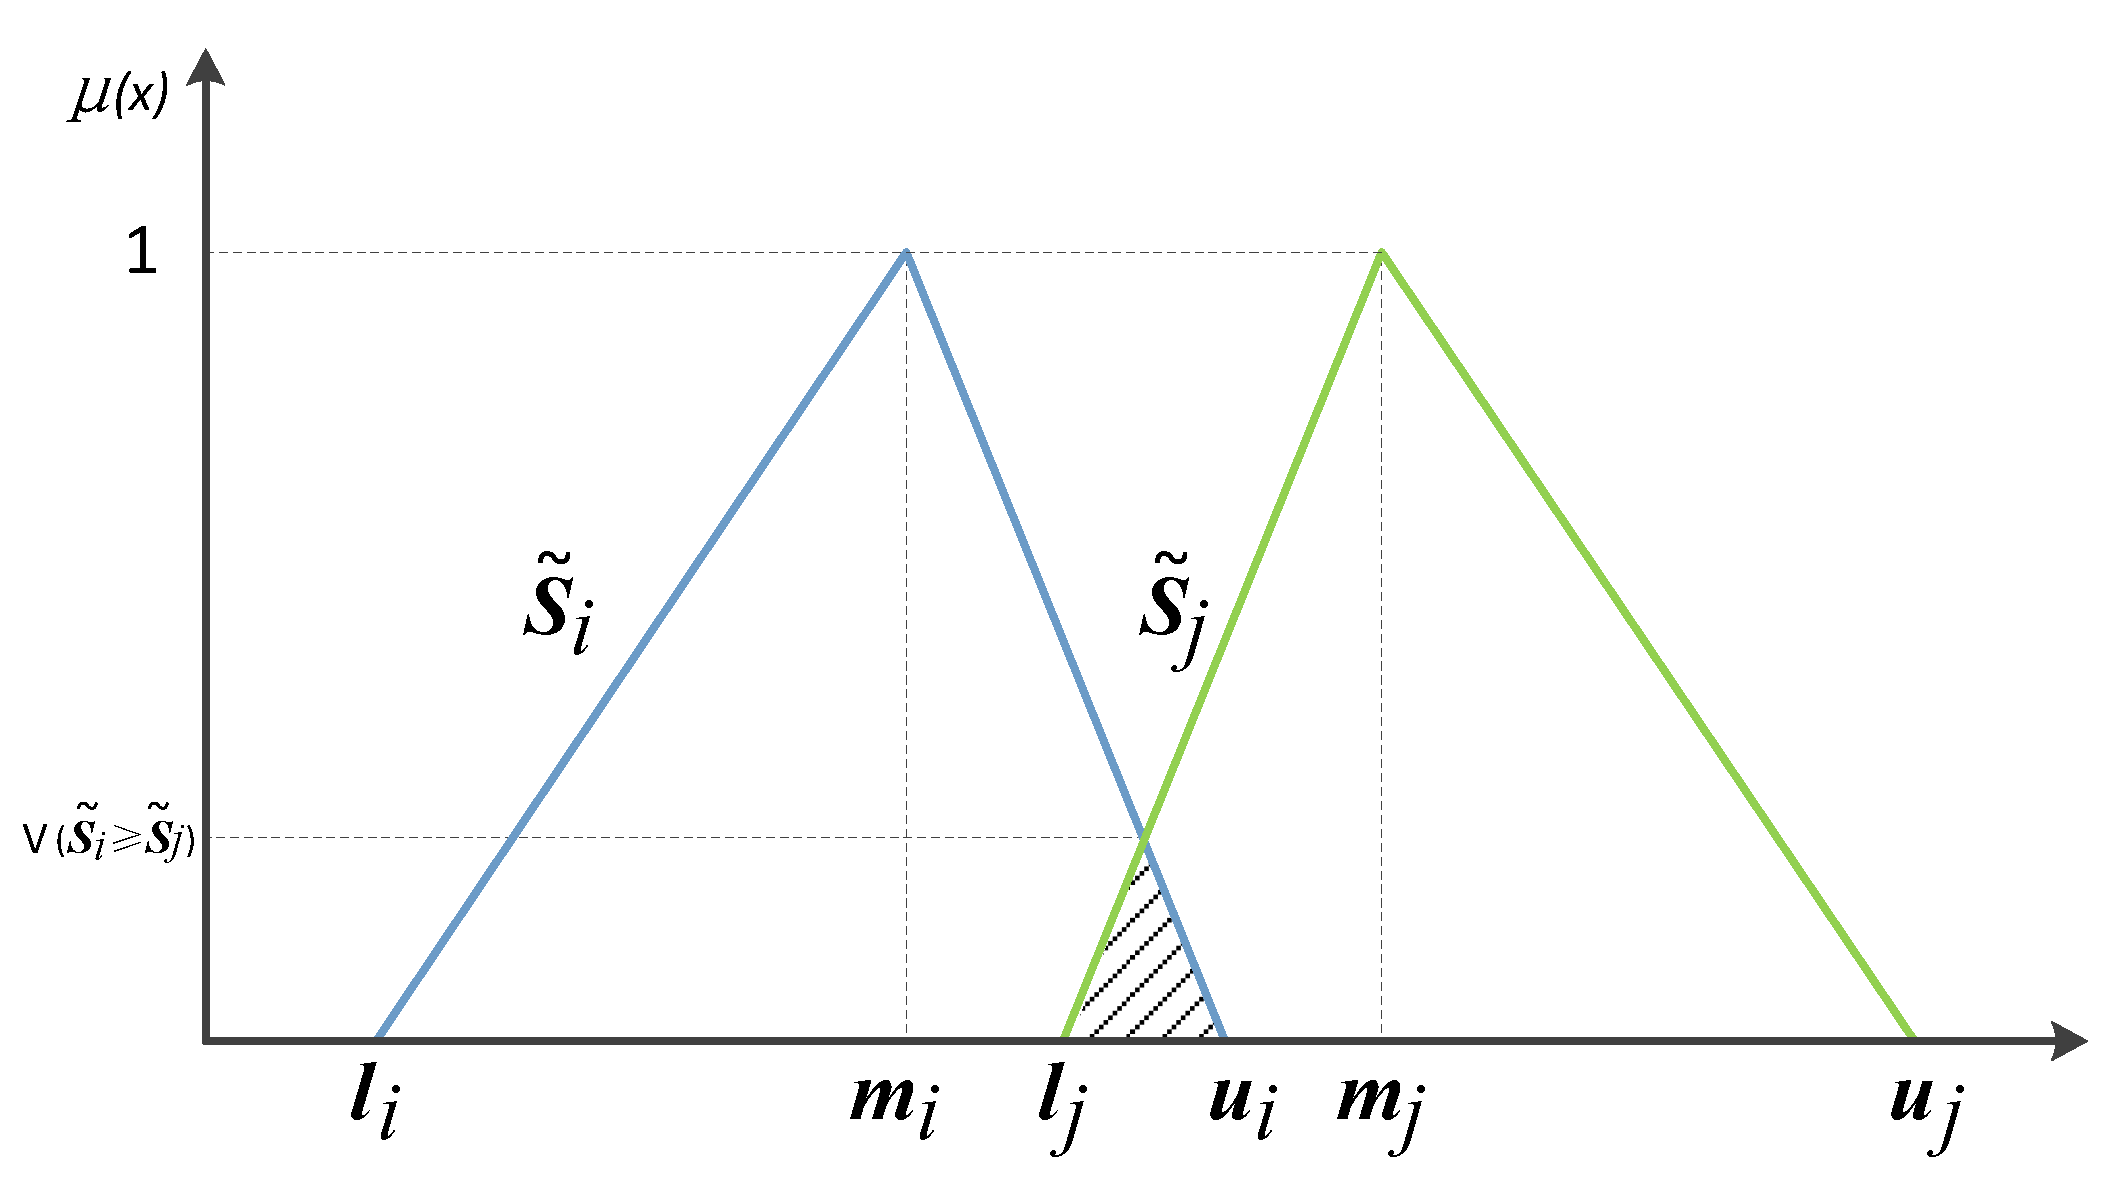
A reason for using sup instead of Max in Equation (6) is that in the case of (), the value of is 1, which is greater than . The value of the latter is between 0 and 1, but the value of is 1 for this special case. From Figure 2, the value of is the ordinate of the highest intersection of and .

Figure 2.
Degree of probability of .
3.2.4. Step 4 Calculate the Priority Vector
The value of is the degree of probability that a convex fuzzy number is greater than all the other n − 1 convex fuzzy numbers . can be defined by Equation (8).
represents the contrast importance of the ith risk response method for the construction engineering project evaluated by the kth expert using fuzzy-ANP.
3.2.5. Step 5: Calculate the Influence between Two Risks
As an example, this work determined the preferences for a β risk response plan of the kth expert in the general scenarios. The weight vector was . Then, the preferences for the β risk response plan of this expert were determined under conditions of α risk occurrence; the vector was . Generally, the kth expert would invest more money and attention in a risk response method in a risk research plan with a higher w value. The difference between WC and WDC represents the reliability of the β risk response plan when the α risk occurs. A small difference between WC and WDC indicates that the original plan for dealing with the β risk is valid when α risk occurs and that the α risk has little influence on the β risk. The quantified value of this relationship is and can be calculated by Equation (9).
3.2.6. Step 6: Calculate the Mean Value of All Experts
This manuscript also calculates the evaluations of other experts in the same way. All expert evaluation results were divided into two groups. By the F test method, the p value for the difference between these two groups was calculated. If the p value was greater than 0.05, these two groups of data had no significant difference and the expert evaluation results had acceptable consistency.
The geometric mean is used to aggregate the conclusions of the team members, following
Effects among other risks would be determined in the same way.
3.3. Decision-Making Trial and Evaluation Laboratory Model
This work determined the priority weights of alternative measures using the DEMATEL method [44]. This method is often used to calculate the weight of each factor in a network structure because its mathematical foundation is structured and explicable. The main advantage of this approach is that it can transform the interrelationships among factors in the network structure into the factors’ weights. The steps of this method are as follows:
3.3.1. Step 1: Form a Direct-Relation Matrix
Eliciting relationships among other risks are also calculated by IF-ANP. Following Equation (11) the corresponding positions of the direct-relation matrix M are filled with all the quantitative affecting values that are calculated by IF-ANP:
3.3.2. Step 2: Form a Normalized Direct-Relation Matrix
To unify the range of variables, the matrix M is normalized using Equation (12). The normalized matrix M′ is thus obtained.
3.3.3. Step 3: Form a Direct and Indirect Relative-Severity Matrix
Using Equation (13), the elements of the direct and indirect relative-severity matrix (M″) are obtained:
3.3.4. Step 4: Rank the Risks
Using Equation (14), the value of R + C and the value of R − C are calculated. R is the number of rows and C is the number of columns in M″. R + C indicates the extent of the relationship for each alternative. Alternatives with high values of R + C have more relations with others, while those with low R + C values have few relations with others. R − C indicates the extent of influence for each alternative. Large values of R − C indicate a greater influence on another risk; these risks are assumed to have higher priority as have a higher probability of triggering other risks. Such risks should be given greater attention in risk management.
4. Empirical Research
4.1. Background and Introduction
The Chengdu–Chongqing Middle Line High-speed Railway is the second high-speed railroad linking Chengdu City and Chongqing Municipality. At present, the main channel between Chengdu and Chongqing is the Chengdu-Chongqing high-speed railway, which is designed for 100 return pair/day and has been operating nearly return trips pairs. Therefore, space for further operation has been very limited. The Chengdu-Chongqing high-speed railway line will be saturated in the next three to five years, which will limit the travel of the citizens and the economic development of the cities along the line.
The total length of the Chengdu–Chongqing Middle Line High-speed Railway is about 292 km, with 100.749 km in Chongqing Municipality and 191.283 km in Sichuan Province and a speed target value of 350 km/h. After the high-speed railway is completed, the travel time between Chongqing and Chengdu will be shortened to only 55 min. The total investment in the high-speed railway is expected to be about 69.273 billion yuan, of which 40.896 billion yuan is construction investment. The bridge-tunnel ratio will be similar to the Chengdu-Chongqing high-speed railway, with the bridge length accounting for 50% of the main line length and the tunnel length accounting for 16%. It is expected that the annual passenger volume will reach 32 million after completion.
The Chengdu–Chongqing Middle Line High-speed Railway is scheduled to start construction in 2022 with completion of construction in 2027. This construction engineering project has huge investments and long construction cycles, and managers face large numbers of risks during the project. However, the resources that can be devoted to risk prevention are limited, and hence a key issue in this project is the preparation of a strategy to make the best use of these resources. Therefore, the Chengdu-Chongqing Central Line high-speed railroad construction project was selected as the case study for empirical study in this paper.
4.2. Expert Evaluation System
Thirty experts were invited to participate in our study. All were civil engineers and project managers in building and construction companies and had over 10 years of experience in this field. This work used the Delphi method research paradigm proposed by Skulmoski [45]. A questionnaire containing information about the Chengdu–Chongqing Central Railway was sent to each expert via email. The experts were asked to suggest 20 risks that the project may face during construction, based on their experience. After questionnaire collection was completed, the 15 most frequently mentioned risks were sent to the experts as a new questionnaire. The experts were asked to select the 10 risks that were most likely to lead to project failure out of the 15. After all the questionnaires were collected again, the five most frequently mentioned risks were selected as the scope. Finally, five risks were selected for meticulous ranking: capital chain rupture, decision failure, economic downturn, policy and legal risks, and stakeholder conflict.
These five gray rhino risks in the Chengdu–Chongqing Middle Line High-speed Railway construction project have captured the greatest attention of the experts. In this study, the common project risk response methods proposed in the existing studies will be calculated and divided into the five dimensions. Based on these risk response methods, IF-ANP can calculate the quantitative value of relationships among these risks. The risk prevention methods for these five risks are shown in Table 2.
Table 2.
The risks prevention methods for gray rhino risks for the Chengdu–Chongqing Middle Line High-speed Railway construction project.
4.3. IF-ANP
This study then applied the IF-ANP to determine the interrelationships between the gray rhino risks and their effect on the Chengyu Middle Line High-speed Railway construction project.
Taking the fifth expert’s evaluation of the effect of decision failure risk on the capital chain rupture calculation as an example, data calculated from the fifth expert was used to obtain the aggregated direct-relation fuzzy matrix and the interference relation fuzzy matrix as shown in Table 3 and Table 4, respectively.
Table 3.
Direct comparison matrix in a normal situation .
Table 4.
Direct comparison matrix under conditions of decision failure occurrence .
Next, the priority of various plans to deal with capital chain rupture risks were obtained. The fuzzy synthetic extent values were first calculated from Equation (5):
The values of were calculated from Equation (7). The results are shown in Table 5.
Table 5.
Values of .
Therefore, the fifth expert’s priorities for planning to deal with the capital chain rupture risk under a general scenario were calculated using Equation (8). Through the same calculation process, the planning priorities for a decision failure risk scenario were also calculated. The results are shown in Table 6.
Table 6.
Priorities of plans in two situations.
The difference between the two sets of data was calculated using Equation (9). In the end, this study obtained I(5)(D→C) = 0.668, the quantitative value of the fifth expert’s evaluation of the influence of the risk of decision failure on the risk of a capital chain rupture.
Using the same steps, evaluation results of the other 29 experts were acquired. The expert evaluation results were randomly divided into two groups and the F test was used to verify the validity of the data. F value was 0.62 and the p value was 0.44. Since the p value was greater than 0.05, there was no significant difference between the two groups of data. This indicates high consistency among the expert evaluation results for the effect of decision failure risk on the risk of capital chain rupture.
Based on Equation (10), the value of was calculated. Through the same calculation steps, quantitative values for the interactions between other risks were also calculated. Combining the results of the quantitative calculation of the interrelationships among all risks, a risk interference relation map was drawn, as shown in Figure 3.
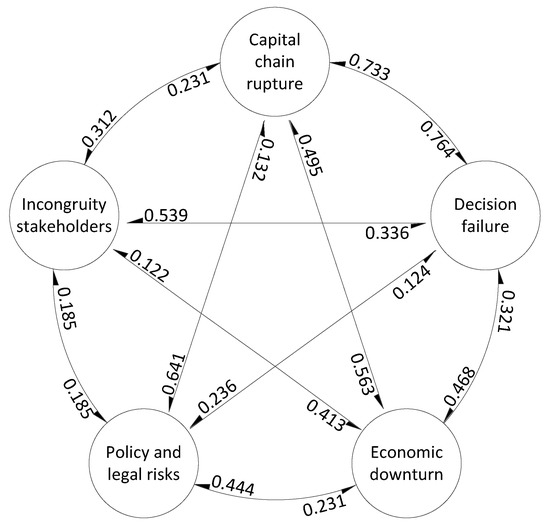
Figure 3.
Risk interference relation map.
4.4. DEMATEL
DEMATEL was applied to transform the interrelationship among the risks into the risk weights in the Chengdu–Chongqing Middle Line High-speed Railway construction project. By applying Equation (11), the values in the risk interference relation map can be filled in by the direct-relation matrix M; the results are shown in Table 7.
Table 7.
Direct-relation matrix M.
Next, following Equation (12), normalization of M was performed to attain M′; the results are shown in Table 8.
Table 8.
Normalized direct-relation matrix M′.
Following Equation (13), the elements of the direct and indirect relative-severity matrix M″ were obtained; the results are shown in Table 9.
Table 9.
Elements of direct and indirect relative-severity matrix M′′.
Based on Equation (14), the values of R + C and R − C were obtained; the results are shown in Table 10.
Table 10.
Prioritization of alternatives in DEMATEL method.
5. Results
5.1. Result of Gray Rhino Risk Ranking in Empirical Research
The relation between R + C and R − C is shown in Figure 4, wherein the values of R − C are ranked as capital chain rupture > decision failures > economic downturn > stakeholder conflict > policy and legal risks. This result shows that the capital chain rupture risk is the most easily triggered and has the highest probability of occurrence in the Chengdu–Chongqing Middle Line High-speed Railway project. By combining this with the result of the risks influence ranking (policy and legal risks > economic downturn > stakeholder conflict > decision failures > capital chain rupture), it becomes evident that the occurrence of policy and legal risks is most likely to be the cause of other risks. Decision-making errors and breaks in the capital chain, which may occur several times during the Chengdu–Chongqing Middle Line High-speed Railway construction project, are merely consequences of the risks of policy and legal problems, stakeholder conflict, and economic downturn.
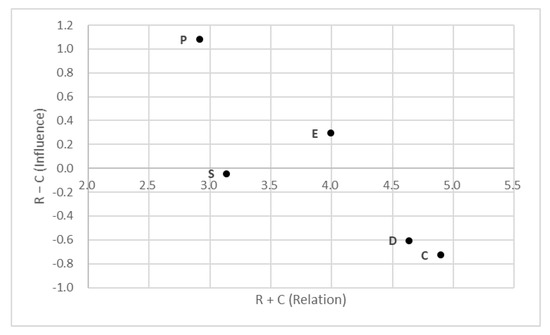
Figure 4.
R − C influences for various R + C relations. Where P is policy and legal risks; E is economic downturn; S is stakeholder conflict; D is decision failures; C is capital chain rupture.
5.2. Calculation of the Difference between IF-ANP and F-ANP
To compare the difference between the IF-ANP and the F-ANP, this study also invited experts to make a direct judgment on the extent to which a decision-making error could lead to a break in the capital chain using scales ranging from 1 (no influence) to 5 (strong influence). Table 11 shows the standardized results of the evaluation values given by the 30 experts through the IF-ANP and direct evaluation methods. The standard deviation of the evaluation value calculated by the IF-ANP was 0.074 and by direct evaluation was 0.308. Therefore, the IF-ANP method effectively solves the influence of subjectivity in experts’ judgment for construction engineering projects.
Table 11.
Normalized I(k) (D→C) values given by the IF-ANP and by direct evaluation.
6. Discussion
6.1. Discussion for the Risk Ranking in Empirical Research
In the Chengdu–Chongqing Middle Line High-speed Railway construction project, economic downturn, stakeholder conflict, and policy and legal risks are external risks, while project and decision failures and capital chain rupture are internal risks of the project. External risks are related to the national macroeconomic environment and regional cultural environment. As it is difficult for the external risks to be affected by the project itself, economic downturn, stakeholder conflicts, and policy and legal risks have lower values of R + C. In contrast, decision failures and capital chain rupture have lower values of R − C. Compared with external risks, internal risks are more easily affected by the external environment. When the external environment in which the project is located is full of uncertainties, the probability of internal risks occurring will increase. Since the occurrence of economic downturn, stakeholder conflict, and policy and legal risks can elicit decision failures and capital chain rupture, the occurrence of economic downturn, stakeholder conflict, and policy and legal risks have higher values of R − C, while decision failure and capital chain rupture have higher values of R + C.
This result explains why gray rhino risks in construction engineering projects recur and eventually lead to project failure. Faced with many common risks, managers tend to invest more resources in preventing more frequent risks that have historically directly led to more project failures. However, those risks are often only a manifestation of deeper risks. Similarly, almost all construction engineering projects face the risk of insufficient funds, but the causes of these shortfalls are various. If managers invest resources to cope with only the risk of insufficient funds and disregard deeper reasons such as policy changes, economic downturns, adverse public opinion, and other issues, the lack of funds will become more and more serious, and eventually cause the project to fail.
6.2. Discussion for the Difference between IF-ANP and F-ANP
As shown in Figure 5, if the experts were directly asked about the quantitative value of interrelations among risks, the survey data calculated from the experts contained much subjectivity. Since the F-ANP method cannot directly reduce the subjectivity of the survey data itself, the credibility of its conclusion has much room for improvement. With the IF-ANP method, by comparing two sets of indirect survey data, subjectivity in the expert survey data cancel each other out, thus improving the consistency of the risk evaluation values given by the experts. Therefore, expert survey data calculated by the IF-ANP has higher credibility.

Figure 5.
Difference between the IF-ANP and direct evaluations.
Even though IF-ANP has the advantage of higher accuracy, IF-ANP has disadvantages compared to F-ANP. The most important limitation of the IF-ANP method is that the research process is complex. When IF-ANP and DEMATEL methods are combined, each expert has to fill in large numbers of comparison matrixes. This requires researchers to invest much time and money in the process of collecting and calculating data.
7. Conclusions
The overall resilience of construction projects can be enhanced by the suitable allocation of risk prevention resources such that sufficient resources are allocated to each risk. This is key to achieving the goal of the construction engineering project. This paper presents an empirical study of the Chengdu–Chongqing Middle Line High-speed Railway project that corroborated the following conclusions.
First, gray rhino risks are present in large numbers in construction engineering projects. Therefore, it is very difficult to identify key risks. In conducting the empirical study, 30 experts were invited to participate. The experts were asked to propose risks that would adversely affect the Chengdu–Chongqing Middle Line High-speed Railway. The 30 experts proposed 74 risks. If risk prevention funds were evenly allocated to these risks, it would create a problem of inadequate investment in each risk, resulting in frequent project risk occurrence.
Second, the results of IF-ANP and DEMATEL calculations demonstrate complex relationships of mutualistic influence between the gray rhino risks of construction projects. Although gray rhino risks are present in large numbers in construction engineering projects, the number of source risks is manageable. For the Chengdu–Chongqing Middle Line High-speed Railway construction project, policy and legal risk, economic downturn, and stakeholder conflict are sources of other risks. Optimizing these source risks can achieve better results when risk prevention resources are limited.
Third, the experts’ evaluation of construction project risks will be influenced by subjectivity, and reducing this influence through effective means will improve the accuracy of the research results. This study compared the data collected by the F-ANP method with the data collected by the IF-ANP method. The results showed that reducing the effect of subjectivity at the data collection stage is superior to reducing it at the calculation stage. When the evaluation object is complex, appropriate means should be used to improve the quality of the collected data.
Based on those conclusions, this study makes the following main contributions to construction engineering risk management.
First, this study proposed the innovative MCDM method. MCDM and fuzzy theory have been widely used in the field of construction engineering risk management. However, complexity is an important feature of construction engineering projects, where risks and the relations between them constitute a complex system. Because complex systems have serious nonlinear characteristics, solely using the fuzzy-MCDM to study the risks in construction engineering projects results in considerable subjectivity, which compromises the credibility of the results. In contrast, the current study presents a method that effectively eliminates the interference of subjectivity on the accuracy of risk assessment, and that expert evaluation values collected through the IF-ANP are more consistent. This new method is valuable for future engineering construction project risk management research because it can overcome the problem of subjectivity, which could not be solved by the previous fuzzy-MCDM methods.
Second, this study innovatively combines the IF-ANP research method with the DEMATEL research method. The IF-ANP allows project managers to process expert opinions more accurately, so they can derive conclusions that were difficult to obtain in previous studies. Existing research generally ranks risks by two factors: their probability of occurrence and the severity of the resultant loss. However, this incorrectly assumes that the probability of risk occurrence is fixed. By combining the IF-ANP and DEMATEL, the mutual influences of the risks are considered, resulting in more credible conclusions. Future risk management research can also apply this method to improve research effectiveness.
Third, this study also suggests a possible reason for the occurrence of gray rhino risks in construction engineering projects. Project managers are more inclined to invest resources in the prevention of direct risks because statistical data show that these risks have led to more project failures. However, this study shows that direct risks are only a manifestation of some deeper risks. Because these deeper risks have not received enough attention, they are constantly manifested in the form of direct risks. This explains why gray rhino risks keep emerging—when a gray rhino risk occurs, simply dealing with the risk itself cannot prevent the risk from happening again. Underlying reasons must be found, and effective actions should be taken.
Last, an empirical study was performed on the Chengdu–Chongqing Middle Line High-speed Railway project. Results show that the risk of breaks in the capital chain and decision-making errors have the highest probability of occurrence. However, the policy and legal risk is the deeper reason for the other risks. This means that managers in that railway project should pay more attention to the policy and legal risk and maintain regular communications with the government. Effective management of policy and legal risks can reduce the probability of other risks.
Author Contributions
Data curation, Y.L.; Methodology, J.G.; Writing – original draft, J.G.; Writing—review & editing, P.X. and Y.L. All authors have read and agreed to the published version of the manuscript.
Funding
This research was funded by the General Project of Chongqing Natural Science Foundation, grant number cstc2020jcyj-msxmX0107 and the Graduate Research and Innovation Foundation of Chongqing, grant number CYS21034.
Institutional Review Board Statement
Not applicable.
Informed Consent Statement
Informed consent was obtained from all subjects involved in the study.
Data Availability Statement
Some or all data, model, or code that support the findings of this study are available from the corresponding author upon reasonable request. We have made raw data available and openly accessible at Open Science Framework (https://osf.io/8y6av/), accessed on 1 March 2022.
Conflicts of Interest
We wish to confirm that there is no known conflict of interest associated with this publication.
References
- Sanchez-Cazorla, A.; Alfalla-Luque, R.; Irimia-Dieguez, A.I. Risk identification in megaprojects as a crucial phase of risk management, a literature review. Proj. Manag. J. 2016, 47, 75–93. [Google Scholar] [CrossRef] [Green Version]
- Ameyaw, E.E.; Chan, A.P.C. Risk ranking and analysis in PPP water supply infrastructure projects, an international survey of industry experts. Facilities 2015, 33, 48. [Google Scholar] [CrossRef] [Green Version]
- Hwang, B.G.; Zhao, X.; Yu, G.S. Risk identification and allocation in underground rail construction joint ventures, Contractors’ perspective. J. Civ. Eng. Manag. 2016, 22, 758–767. [Google Scholar] [CrossRef] [Green Version]
- Guo, F.; Chang-Richards, Y.; Wilkinson, S.; Li, T.C. Effects of project governance structures on the management of risks in major infrastructure projects, a comparative analysis. Int. J. Proj. Manag. 2014, 32, 815–826. [Google Scholar] [CrossRef]
- Dziadosz, A.; Rejment, M. Risk analysis in construction project-chosen methods. Procedia Eng. 2015, 122, 258–265. [Google Scholar] [CrossRef] [Green Version]
- Paweł, S. Risk management in construction projects. Procedia Eng. 2017, 208, 174–182. [Google Scholar] [CrossRef]
- Siraj, N.B.; Fayek, A.R. Risk identification and common risks in construction: Literature review and content analysis. J. Constr. Eng. Manag. 2019, 145, 03119004. [Google Scholar] [CrossRef]
- Wucker, M.; Gilbert, T. You Are What You Risk; Pegasus Books: New York, NY, USA, 2021; pp. 145–169. [Google Scholar]
- Altshuler, A.; Luberoff, D. Mega-Projects, the Changing Politics of Urban Public Investment, Plano; Brookings Institution Press: Washington, DC, USA, 2003; pp. 67–69. [Google Scholar]
- Xiang, P.; Li, J. Research on system vulnerability of interregional large-scale construction projects. Syst. Eng. Theory Pract. 2016, 36, 2383–2390. [Google Scholar] [CrossRef]
- Utama, W.P.; Chan, A.P.C.; Zahoor, H.; Gao, R.; Jumas, D.Y. Making decision toward overseas construction projects: An application based on adaptive neuro fuzzy system. Eng. Constr. Archit. Manag. 2019, 2, 285–302. [Google Scholar] [CrossRef]
- de Wit, J. Black swans or gray rhinos on the runway? The role of uncertainty in airport strategic planning. Air Transp. Ind. 2022, 10, 225–245. [Google Scholar] [CrossRef]
- Goldratt, E.M. Theory of Constraints; North River: New York, NY, USA, 1990; pp. 1–18. [Google Scholar]
- Jebari, K. Existential risks, exploring a robust risk reduction strategy. Sci. Eng. Ethics 2015, 21, 541–554. [Google Scholar] [CrossRef] [PubMed]
- Dikmen, I.; Birgonul, M.T.; Ozorhon, B.; Sapci, N.E. Using analytic network process to assess business failure risks of construction firms. Eng. Constr. Archit. Manag. 2010, 17, 369–386. [Google Scholar] [CrossRef]
- Zhao, M.; Sun, Z.; Zeng, Y. Exploring urban risk reduction strategy based on spatial statistics and scenario planning. J. Clean. Prod. 2020, 264, 121668. [Google Scholar] [CrossRef]
- Chen, F.; Wang, H.; Xu, G.; Ji, H.; Ding, S.; Wei, Y. Data-driven safety enhancing strategies for risk networks in construction engineering. Reliab. Eng. Syst. Saf. 2020, 197, 106806. [Google Scholar] [CrossRef]
- Chatterjee, K.; Zavadskas, E.K.; Tamošaitienė, J.; Adhikary, K.; Kar, S. A hybrid MCDM technique for risk management in construction projects. Symmetry 2018, 10, 46. [Google Scholar] [CrossRef] [Green Version]
- Garg, R. E-learning website evaluation and selection using multi-attribute decision making matrix methodology. Comput. Appl. Eng. Educ. 2017, 25, 938–947. [Google Scholar] [CrossRef]
- Büyüközkan, G.; Çifçi, G. A novel hybrid MCDM approach based on fuzzy DEMATEL, fuzzy ANP and fuzzy TOPSIS to evaluate green suppliers. Expert Syst. Appl. 2012, 39, 3000–3011. [Google Scholar] [CrossRef]
- Mavi, R.K.; Standing, C. Critical success factors of sustainable project management in construction, a fuzzy DEMATEL-ANP approach. J. Clean. Prod. 2018, 194, 751–765. [Google Scholar] [CrossRef]
- Klanšek, U. Mixed-integer nonlinear programming model for nonlinear discrete optimization of project schedules under restricted costs. J. Constr. Eng. Manag. 2016, 142, 04015088. [Google Scholar] [CrossRef]
- Garbuzova-Schlifter, M.; Madlener, R. AHP-based risk analysis of energy performance contracting projects in Russia. Energy Policy 2016, 97, 559–581. [Google Scholar] [CrossRef]
- Yucesan, M.; Kahraman, G. Risk evaluation and prevention in hydropower plant operations, a model based on Pythagorean fuzzy AHP. Energy Policy 2019, 126, 343–351. [Google Scholar] [CrossRef]
- Li, J.; Zou, P.X. Fuzzy AHP-based risk assessment methodology for PPP projects. J. Constr. Eng. Manag. 2011, 12, 1205–1209. [Google Scholar] [CrossRef]
- Guo, J.; Chen, Y.; Hao, D.; Zhang, L. A multi-criteria decision-making approach to help resource-exhausted areas choose suitable transformation templates—The example of Wansheng in Chongqing, China. Ain Shams Eng. J. 2022, 13, 101709. [Google Scholar] [CrossRef]
- Ashraf, S.; Abdullah, S.; Mahmood, T.; Fazal, G.; Tariq, M. Spherical fuzzy sets and their applications in multi-attribute decision making problems. J. Intell. Fuzzy Syst. 2019, 36, 2829–2844. [Google Scholar] [CrossRef]
- Abdullah, L.; Najib, L. A new preference scale mcdm method based on interval-valued intuitionistic fuzzy sets and the analytic hierarchy process. Soft Comput. 2016, 20, 511–523. [Google Scholar] [CrossRef]
- Coppolino, L.; Romano, L.; Scaletti, A.; Sgaglione, L. Fuzzy set theory-based comparative evaluation of cloud service offerings: An agro-food supply chain case study. Technol. Anal. Strateg. Manag. 2021, 33, 900–913. [Google Scholar] [CrossRef]
- Chen, L.H.; Lu, H.W. The preference order of fuzzy numbers. Comput. Math. Appl. 2002, 44, 1455–1465. [Google Scholar] [CrossRef] [Green Version]
- Chen, T.Y.; Ku, T.C. Importance-Assessing Method with Fuzzy Number-Valued Fuzzy Measures and Discussions on TFNs and TrFNs. Int. J. Fuzzy Syst. 2008, 10, 92–103. [Google Scholar]
- Wang, S.Q.; Dulaimi, M.F.; Aguria, M.Y. Risk management framework for construction projects in developing countries. Constr. Manag. Econ. 2004, 22, 237–252. [Google Scholar] [CrossRef]
- Yu, X.; Mou, R. System Modeling and Risk Analysis of the Sichuan–Tibet Railway Project. J. Transp. Eng. Part A Syst. 2021, 147, 04021094. [Google Scholar] [CrossRef]
- Marković, V.; Stajić, L.; Stević, Ž; Mitrović, G.; Novarlić, B.; Radojičić, Z. A novel integrated subjective-objective mcdm model for alternative ranking in order to achieve business excellence and sustainability. Symmetry 2020, 12, 164. [Google Scholar] [CrossRef] [Green Version]
- Pieroni, M.P.P.; McAloone, T.C.; Borgianni, Y.; Maccioni, L.; Pigosso, D.C.A. An expert system for circular economy business modelling, Advising manufacturing companies in decoupling value creation from resource consumption. Sustain. Prod. Consum. 2021, 27, 534–550. [Google Scholar] [CrossRef]
- Lin, S.S.; Shen, S.L.; Zhou, A.; Xu, Y.-S. Risk assessment and management of excavation system based on fuzzy set theory and machine learning method. Autom. Constr. 2021, 122, 103490. [Google Scholar] [CrossRef]
- Sukhov, A.; Sihvonen, A.; Netz, J.; Magnusson, P.; Olsson, L.E. How experts screen ideas, the complex interplay of intuition, analysis and sensemaking. J. Prod. Innov. Manag. 2021, 38, 248–270. [Google Scholar] [CrossRef]
- Yan, L.; Xinyu, W. Risk assessment for public-private partnership projects: Using a fuzzy analytic hierarchical process method and expert opinion in China. J. Risk Res. 2016, 8, 952–973. [Google Scholar] [CrossRef]
- Ghorabaee, M.K. Developing an MCDM method for robot selection with interval type-2 fuzzy sets. Robot. Comput.-Integr. Manuf. 2016, 37, 221–232. [Google Scholar] [CrossRef]
- Zhao, X.; Hwang, B.G.; Yu, G.S. Identifying the critical risks in underground rail international construction joint ventures, Case study of Singapore. Int. J. Proj. Manag. 2013, 31, 554–566. [Google Scholar] [CrossRef]
- Dağdeviren, M.; Yüksel, İ. A fuzzy analytic network process (ANP) model for measurement of the sectoral competititon level (SCL). Expert Syst. Appl. 2010, 37, 1005–1014. [Google Scholar] [CrossRef]
- Chang, D.-Y. Applications of the extent analysis method on fuzzy AHP. Eur. J. Oper. Res. 1996, 95, 649–655. [Google Scholar] [CrossRef]
- Tadić, S.; Zečević, S.; Krstić, M. A novel hybrid MCDM model based on fuzzy DEMATEL, fuzzy ANP and fuzzy VIKOR for city logistics concept selection. Expert Syst. Appl. 2014, 41, 8112–8128. [Google Scholar] [CrossRef]
- Seyed-Hosseini, S.M.; Safaei, N.; Asgharpour, M.J. Reprioritization of failures in a system failure mode and effects analysis by decision making trial and evaluation laboratory technique. Reliab. Eng. Syst. Saf. 2006, 91, 872–881. [Google Scholar] [CrossRef]
- Skulmoski, G.J.; Hartman, F.T.; Krahn, J. The Delphi method for graduate research. J. Inf. Technol. Educ. Res. 2007, 6, 1–21. Available online: https://www.learntechlib.org/p/111405/ (accessed on 1 March 2022). [CrossRef]
- Flyvbjerg, B. Curbing optimism bias and strategic misrepresentation in planning, Reference class forecasting in practice. Eur. Plan. Stud. 2008, 16, 3–21. [Google Scholar] [CrossRef]
- Vinodh, S.; Sai Balagi, T.S.; Patil, A. A hybrid MCDM approach for agile concept selection using fuzzy DEMATEL, fuzzy ANP and fuzzy TOPSIS. Int. J. Adv. Manuf. Technol. 2016, 83, 1979–1987. [Google Scholar] [CrossRef]
- Islam, M.S.; Nepal, M.P.; Skitmore, M.; Kabir, G. A knowledge-based expert system to assess power plant project cost overrun risks. Expert Syst. Appl. 2019, 136, 12–32. [Google Scholar] [CrossRef]
- Capony, A.; Muresan, B.; Dauvergne, M.; Auriol, J.-C.; Ferber, V.; Jullien, A. Monitoring and environmental modeling of earthwork impacts, a road construction case study. Resour. Conserv. Recycl. 2013, 74, 124–133. [Google Scholar] [CrossRef] [Green Version]
- Serpella, A.F.; Ferrada, X.; Howard, R.; Rubio, L. Risk management in construction projects, a knowledge-based approach. Procedia-Soc. Behav. Sci. 2014, 119, 653–662. [Google Scholar] [CrossRef] [Green Version]
- Siemiatycki, M. The making and impacts of a classic text in megaproject management, the case of cost overrun research. Int. J. Proj. Manag. 2018, 36, 362–371. [Google Scholar] [CrossRef]
- Keshk, A.M.; Maarouf, I.; Annany, Y. Special studies in management of construction project risks, risk concept, plan building, risk quantitative and qualitative analysis, risk response strategies. Alex. Eng. J. 2018, 57, 3179–3187. [Google Scholar] [CrossRef]
- Wang, T.; Gao, S.; Li, X.; Ning, X. A meta-network-based risk evaluation and control method for industrialized building construction projects. J. Clean. Prod. 2018, 205, 552–564. [Google Scholar] [CrossRef]
- Park, K.; Lee, H.W.; Choi, K.; Lee, S.-H. Project risk factors facing construction management firms. Int. J. Civ. Eng. 2019, 17, 305–321. [Google Scholar] [CrossRef]
- Ahmadabadi, A.A.; Heravi, G. Risk assessment framework of PPP-megaprojects focusing on risk interaction and project success. Transp. Res. Part A Policy Pract. 2019, 124, 169–188. [Google Scholar] [CrossRef]
- Ma, S.; Jiang, Z.; Liu, W. A design change analysis model as a change impact analysis basis for semantic design change management. Proc. Inst. Mech. Eng. Part C J. Mech. Eng. Sci. 2017, 231, 2384–2397. [Google Scholar] [CrossRef]
- He, X.; Hou, L. Research on behavioral risk of participants in construction project based on the theory of stakeholders. In Proceedings of the International Conference on Future Information Technology and Management Engineering, Changzhou, China, 9 October 2010. [Google Scholar]
- Shen, L.Y.; Wu, G.W.; Ng, C.S. Risk assessment for construction joint ventures in China. J. Constr. Eng. Manag. 2001, 1, 76–81. [Google Scholar] [CrossRef]
- Collinge, W. Stakeholder engagement in construction: Exploring corporate social responsibility, ethical behaviors, and practices. J. Constr. Eng. Manag. 2020, 3, 04020003. [Google Scholar] [CrossRef] [Green Version]
- Russell, J.S.; Hanna, A.; Bank, L.C.; Shapira, A. Education in construction engineering and management built on tradition: Blueprint for tomorrow. J. Constr. Eng. Manag. 2007, 9, 661–668. [Google Scholar] [CrossRef]


Publisher’s Note: MDPI stays neutral with regard to jurisdictional claims in published maps and institutional affiliations. |
© 2022 by the authors. Licensee MDPI, Basel, Switzerland. This article is an open access article distributed under the terms and conditions of the Creative Commons Attribution (CC BY) license (https://creativecommons.org/licenses/by/4.0/).