1. Introduction
During geodetic services, especially by using multi-sensor systems, numerous factors can affect the final surveying accuracy and limit their appropriate implementation. The error sources existing in practice may relate to external conditions, instrumental errors, as well as personal imperfections [
1]. Such influence can be largely eliminated by utilizing forced instrument centering or introducing special instrumental modules—e.g., automatic target recognition (ATR) or servo motors enabling robotic measurement [
2]. Instrumental errors should be regularly determined, and the instrument itself should be subjected to periodic service inspections. An important problem is an impact of external conditions on the measurement result—both atmospheric and weather, as well as other factors such as dust, vibration, or the presence of heat sources (machines and industrial installations). This is particularly important in geodetic deformation monitoring systems [
3]—both industrial and natural facilities [
4,
5]. The need to ensure not only highly accurate but also reliable measurements performed by using total stations is particularly evident in the case of large areas subject to monitoring, e.g., in high mountains [
6,
7]. The cited authors analyzed data on monitoring the glacier valley in the Swiss Alps using robotic total stations. The emerging problems here concern both long targets, often exceeding 1 km, as well as the impact on the results of measuring changing weather conditions. Moreover, an important role is played by, in this case, refraction—particularly vertical temperature and humidity gradient related to significant height differences between individual control points. In addition, a significant obstacle in the case of utilizing geodetic instruments on similar objects is the ambiguity of identifying the correct reference system. The solution to this problem may be employing an appropriate instrumental system [
8] or a computational strategy [
9,
10]. The issue was also presented and thoroughly analyzed in the publication [
11]. The authors reported and summarized many years of measurement works in the form of a reliable case study of geometric changes in the glacier in Antarctica.
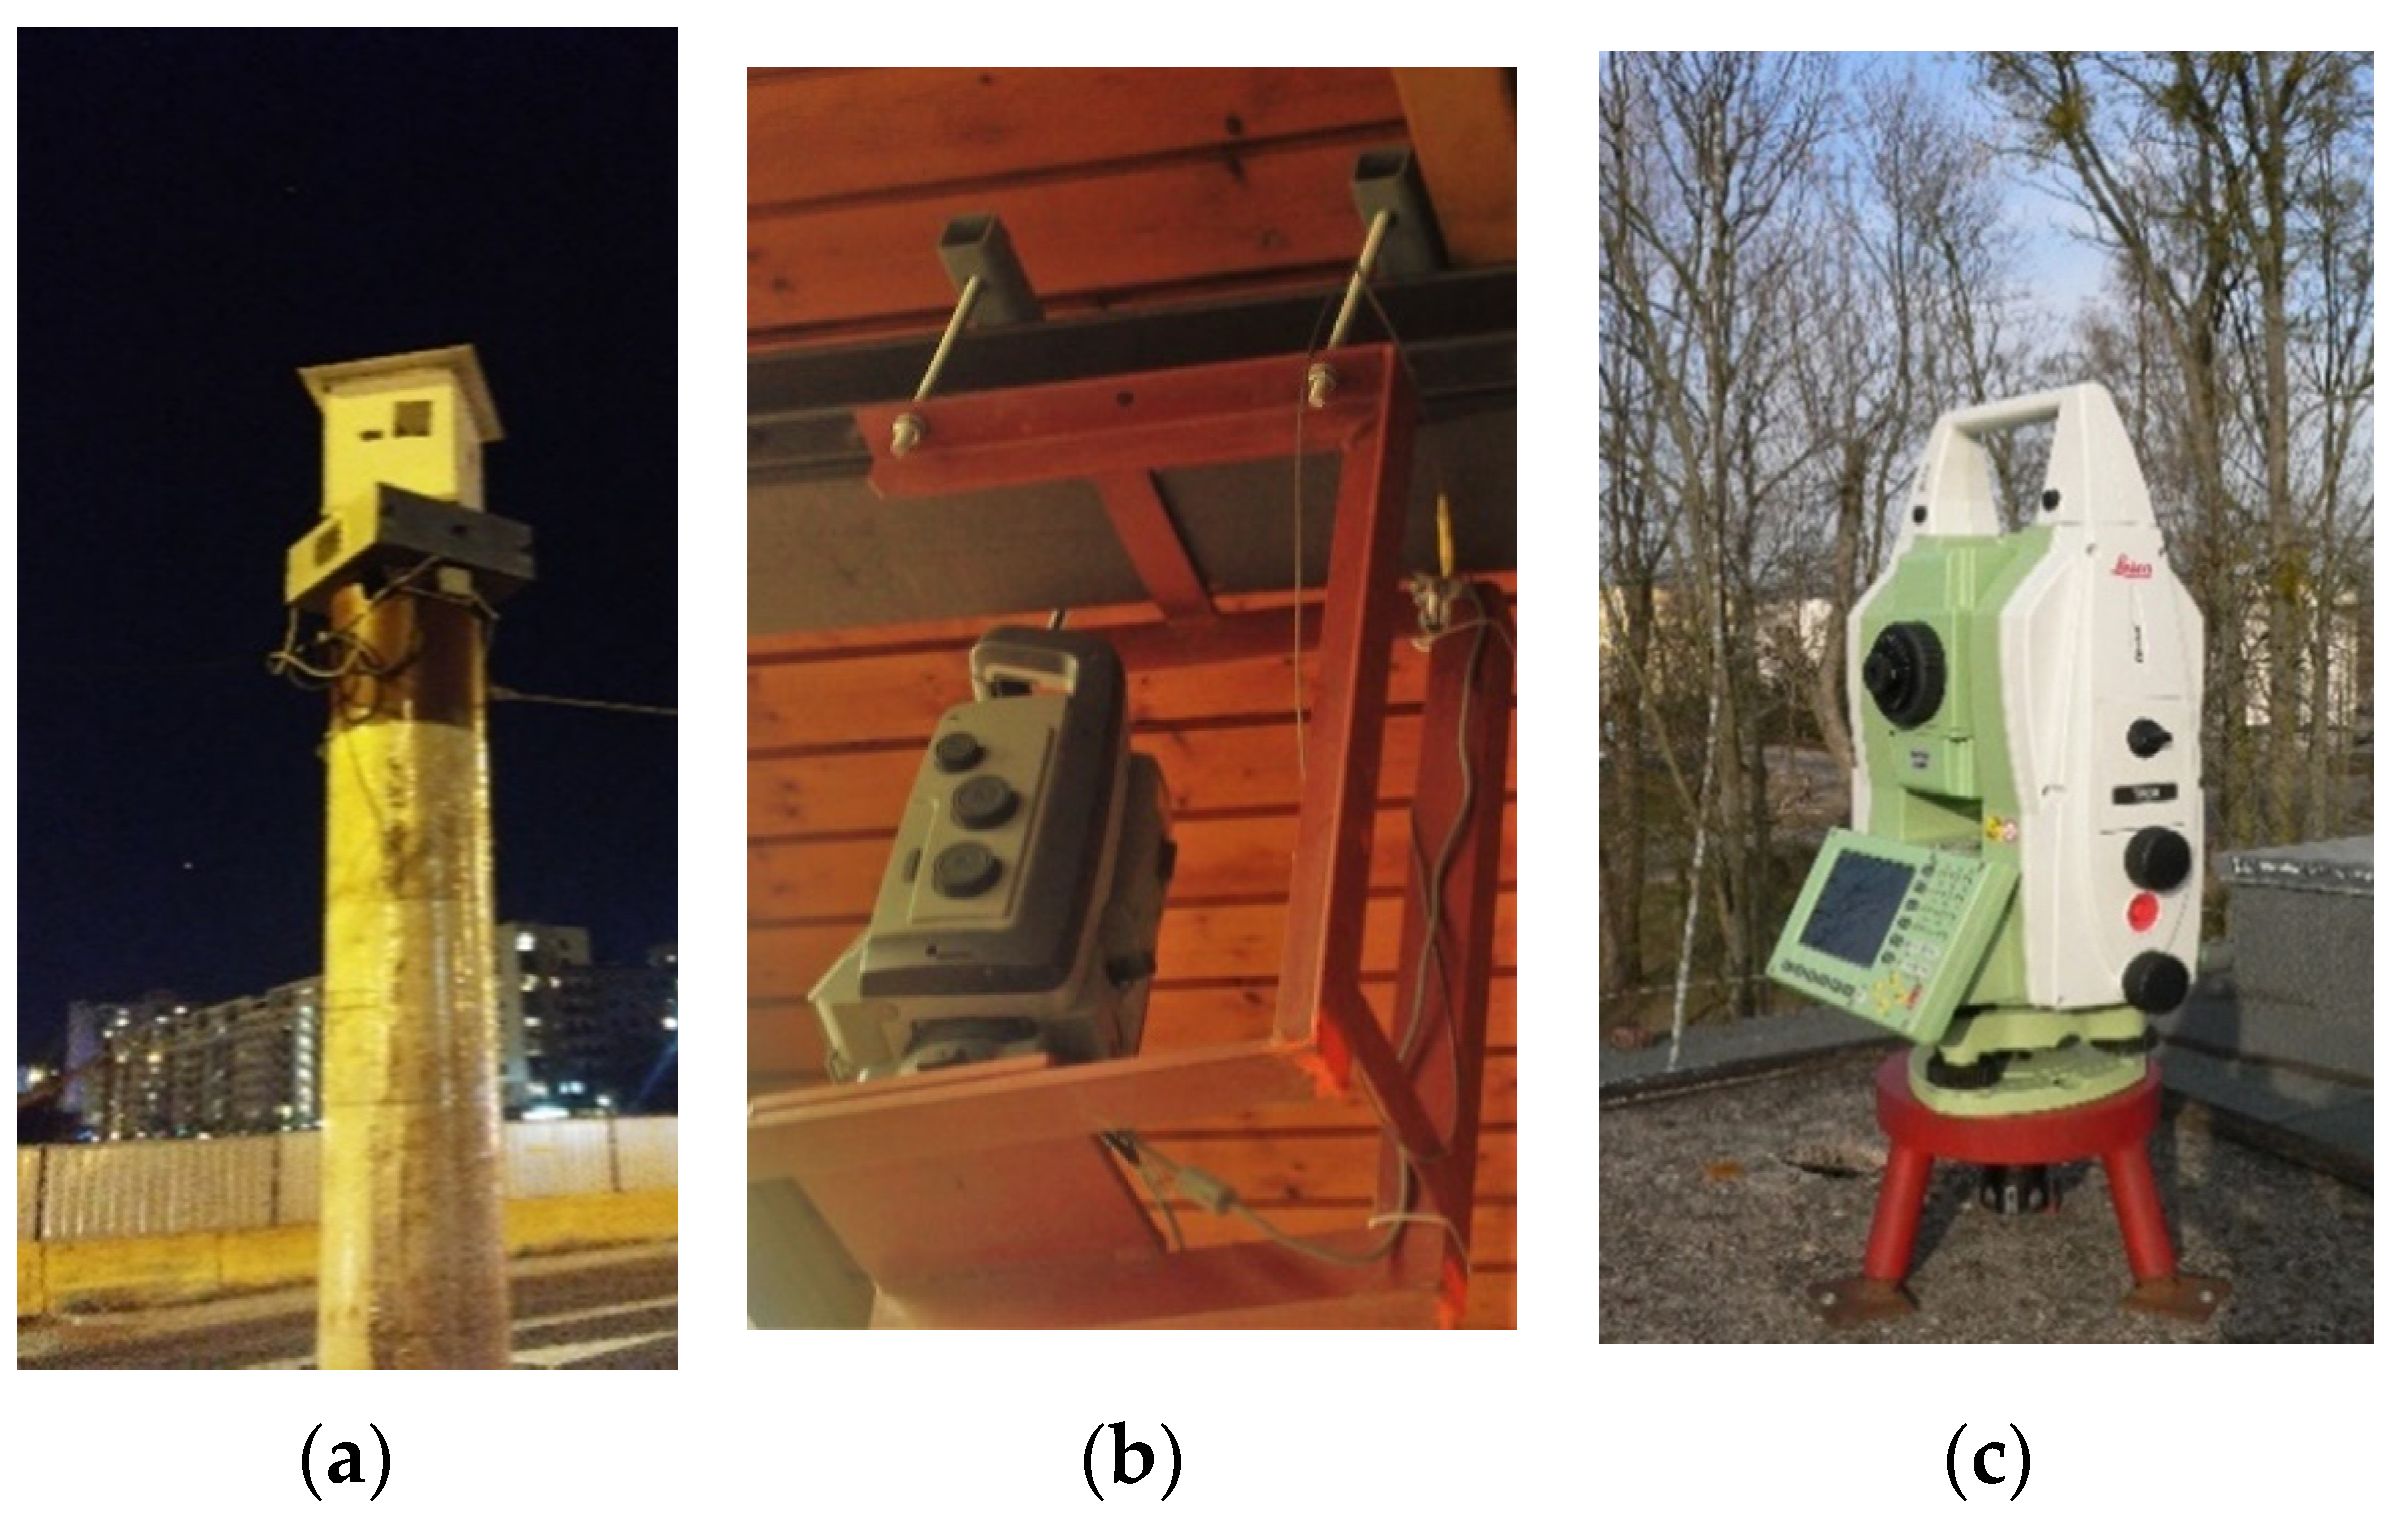
When conducting geodetic monitoring, the aspect of securing and ensuring the stability of the measuring station is particularly important. The solutions existing on the market utilize various types of protection shelters—from glazed (entirely closed) or completely open containers and covers, to smaller housings with holes through which the appropriate telescope aiming is ensured (as exampled in
Figure 1).
For example, articles [
12,
13] demonstrate a classic measuring container used—in this case—to monitor geometric movements in landslides. However, such installations are not entirely optimal, e.g., in tunnel projects [
14] or on regular construction sites, especially in cities. In such cases, the already mentioned, smaller structures are established [
15,
16]. Until now, such protections were performed in a non-standard manner, and the new forms obtained were rarely subjected to comprehensive research and functional assessments [
17]. This time, the authors presented multi-variant functional analyses regarding the selection of the optimal measuring standpoint of a robotic total station for structural monitoring purposes. They proved that using fully glazed protective shelters for instruments retrieves no satisfactory results. Furthermore, a significant dispersion of recorded data is then obtained, which significantly reduces the measurement reliability. The solution is to enable an uninterrupted course of the line-of-sight axis of the total station telescope. It should be added that both the acrylic and classic glass covers can contribute to many errors. They also significantly impede the proper operation of the ATR module. Therefore, to enable the efficient operation of robotic total stations employed in deformation monitoring systems, it is necessary to ensure the proper construction of the survey station, adapted to the best possible extent to local conditions and the geometry of the control network. The observation system is determined mainly by the spatial distribution of reference points and controlled, stabilized on the monitored object.
Current geoinformation technology, dynamic progress in the field of robotics, and 3D printing allow for the development of optimal solutions for the construction and operation of geodetic deformation monitoring systems. In particular, thanks to the possibility of printing even significant structural objects [
18,
19], the use of 3D printers is becoming commonplace. One can even talk about the technologically advanced new generation of civil engineering [
20,
21]. Recent developments in this field are also subject to that termed Industry 4.0 [
22], which has come to dominate the manufacturing. Such a philosophy utilizes web-based and often artificial intelligence (A.I.)-oriented solutions, employing the Internet of Things (IoT). All this makes it possible to work autonomously, in a standardized, repeatable, and predictable way [
23]. What is more, the presented issues are widely used by different industries—from civil engineering to aerospace.
Depending on the material used, the 3D printing process can be lengthy and tedious. Therefore, it is necessary to properly select both the material from which the print will be made, as well as optimize the product shape. For this purpose, it is necessary to develop an efficient methodology—a specific technological line supported by conceptual modeling. Formalizing the process will therefore play a key role in automating the design and implementation work [
24].
In this article, the authors described their own development of an automated technological line supporting the construction of dedicated protective housings for robotic total stations used in geodetic deformation monitoring. The designed solution allows for achieving the highest possible accuracies with the maximal protection of the instruments exposed to harsh field conditions. At the same time, the dedicated housing is light and pouring water resistible. This concept was formalized in the form of the unified markup language (UML) modeling [
25]. To describe the concept of both the service of the 3D print of the protective housing and the web application serving that service, the Unified Modeling Language (UML) and the ISO 19100 geographic information standards [
26,
27] were used. As conceptual modeling is the process of creating an abstract description of some portion of the universe of discourse and a set of related concepts, the conceptual models are representations of how tasks should be carried out and are used as a way of systematizing processes. The conceptual models in this study are presented as UML active, sequence, and class diagrams. A more detailed description is developed in
Section 2. As a result, a ready-made prototype of a dedicated 3D housing was elaborated based on the conceptual modeling. The modeling process and formal diagrams are demonstrated in
Section 3. Next—
Section 4 contains the discussion, while the final conclusions are presented in
Section 5.
2. Materials and Methods
Our basic assumption for the technological line manufacturing online dedicated total station housings was to allow for the online development of a total station-based structural monitoring network with all instruments protected by specialized containers. Such elements need to be adapted to the unique geometric and ambient conditions prevailing in the measured area. The diagram illustrating the assumption is shown in
Figure 2.
The procedure begins with setting an electronic total station on the standpoint (e.g.,
Figure 1). The monitoring project (control network design, standpoint deployment, measuring cycles, etc.) must be designed and implemented before starting our surveys. The types of prisms and target plates used for this purpose play an important role here, although, in this case, they are not the subject of our further considerations. Similarly, we will neither assess the control network geometry nor the location of observation pillars. Additionally, the instrument types used for monitoring are not the subject of our studies. The only assumption we need to make is to conduct surveying with robotic total stations, which is a prerequisite in the case of automatic measurement systems. Considering standard instrument dimensions (for example—length 248 mm, width 228 mm, height 351 mm), we aimed at producing an oval housing fitting a universal total station (design values—perimeter 250 mm and height 360 mm).
Furthermore, after the appropriate instrument orientation is performed in a local, Cartesian coordinate system, we measure all points—both reference and control—determining their spatial coordinates XYZ. The calculated directions are then projected onto the point of the telescope rotation axis so that the measuring beam runs from the rotation point laying on the vertical axis and through the line of sight. This data set is sent for additional office development. After the preliminary free station geometry analysis, a decision is made about the final step of 3D model printing. In this case, the criterion is the correct placement of the line-of-sight holes and the size of the protective housing adjusted to a given type of instrument. The horizontal angles Hz and vertical V determined based on spatial coordinates, determining the geometry of a given free station, are subject to a detailed assessment. If these parameters are correct, a prototype 3D model of the housing is built using the dedicated SOLIDWORKS software scripts (
https://www.solidworks.com accessed on 12 May 2022). After the final approval and quality control, the final 3D printing procedure is launched (Selective Laser Sintering technology [
28] that relies on bonding plastic powders using a laser beam—3D laser printer EOS P396 [
29] utilizing polyamide type PA2200). Schematically, this is demonstrated in
Figure 3.
In the next step, the housing is covered with hydrophobic paint (agent Ultra Ever Dry
®), preventing water deposition and supporting its immediate outflow. Except for an inconvenient impact of the humidity on optical and mechanical parts (although contemporary total stations are characterized by relatively high integrity-protection rate IP), precipitation lets dust particles and other substances get between the moving parts of the instrument, causing failures of the servo motors and damaging the optics. The freezing precipitation causes erroneous readings, which hinders precise aiming at prisms. To enable regular outflow of a liquid from the inner part of the housing, a unique stand pad equipped with a hole for attaching the total station tribrach to the centering head is also subjected to modeling and 3D printing. Details are shown in
Figure 4.
To reduce the instrument’s absorption of enormous heat, we used a white color specimen reflecting sunlight radiation. In addition, to protect the total station against adverse thermal conditions and to ensure its relatively constant temperature, the protective housing was printed in two layers with a 5mm gap between them. The aiming holes are also covered by small roofs, enabling free drainage of water, and protecting the instrument against precipitation (
Figure 5).
The housing assembly process is designed so that it can take place without dismantling the total station from the observation station. In the first step of the installation, the base of the housing is mounted, which is fixed with a screw between the pad and the instrument. This solution also allows for leveling the entire total station-housing system, which is essential in the orientation process of the whole set. Secondly, the upper part of the housing is adjusted to the bottom, and hence, it can be oriented correctly in the surveying site. This process runs using a telescope directed at a selected prism observed by the total station. The demonstrator uses a unique sight with a front and rear aiming mark (
Figure 6).
3. Results
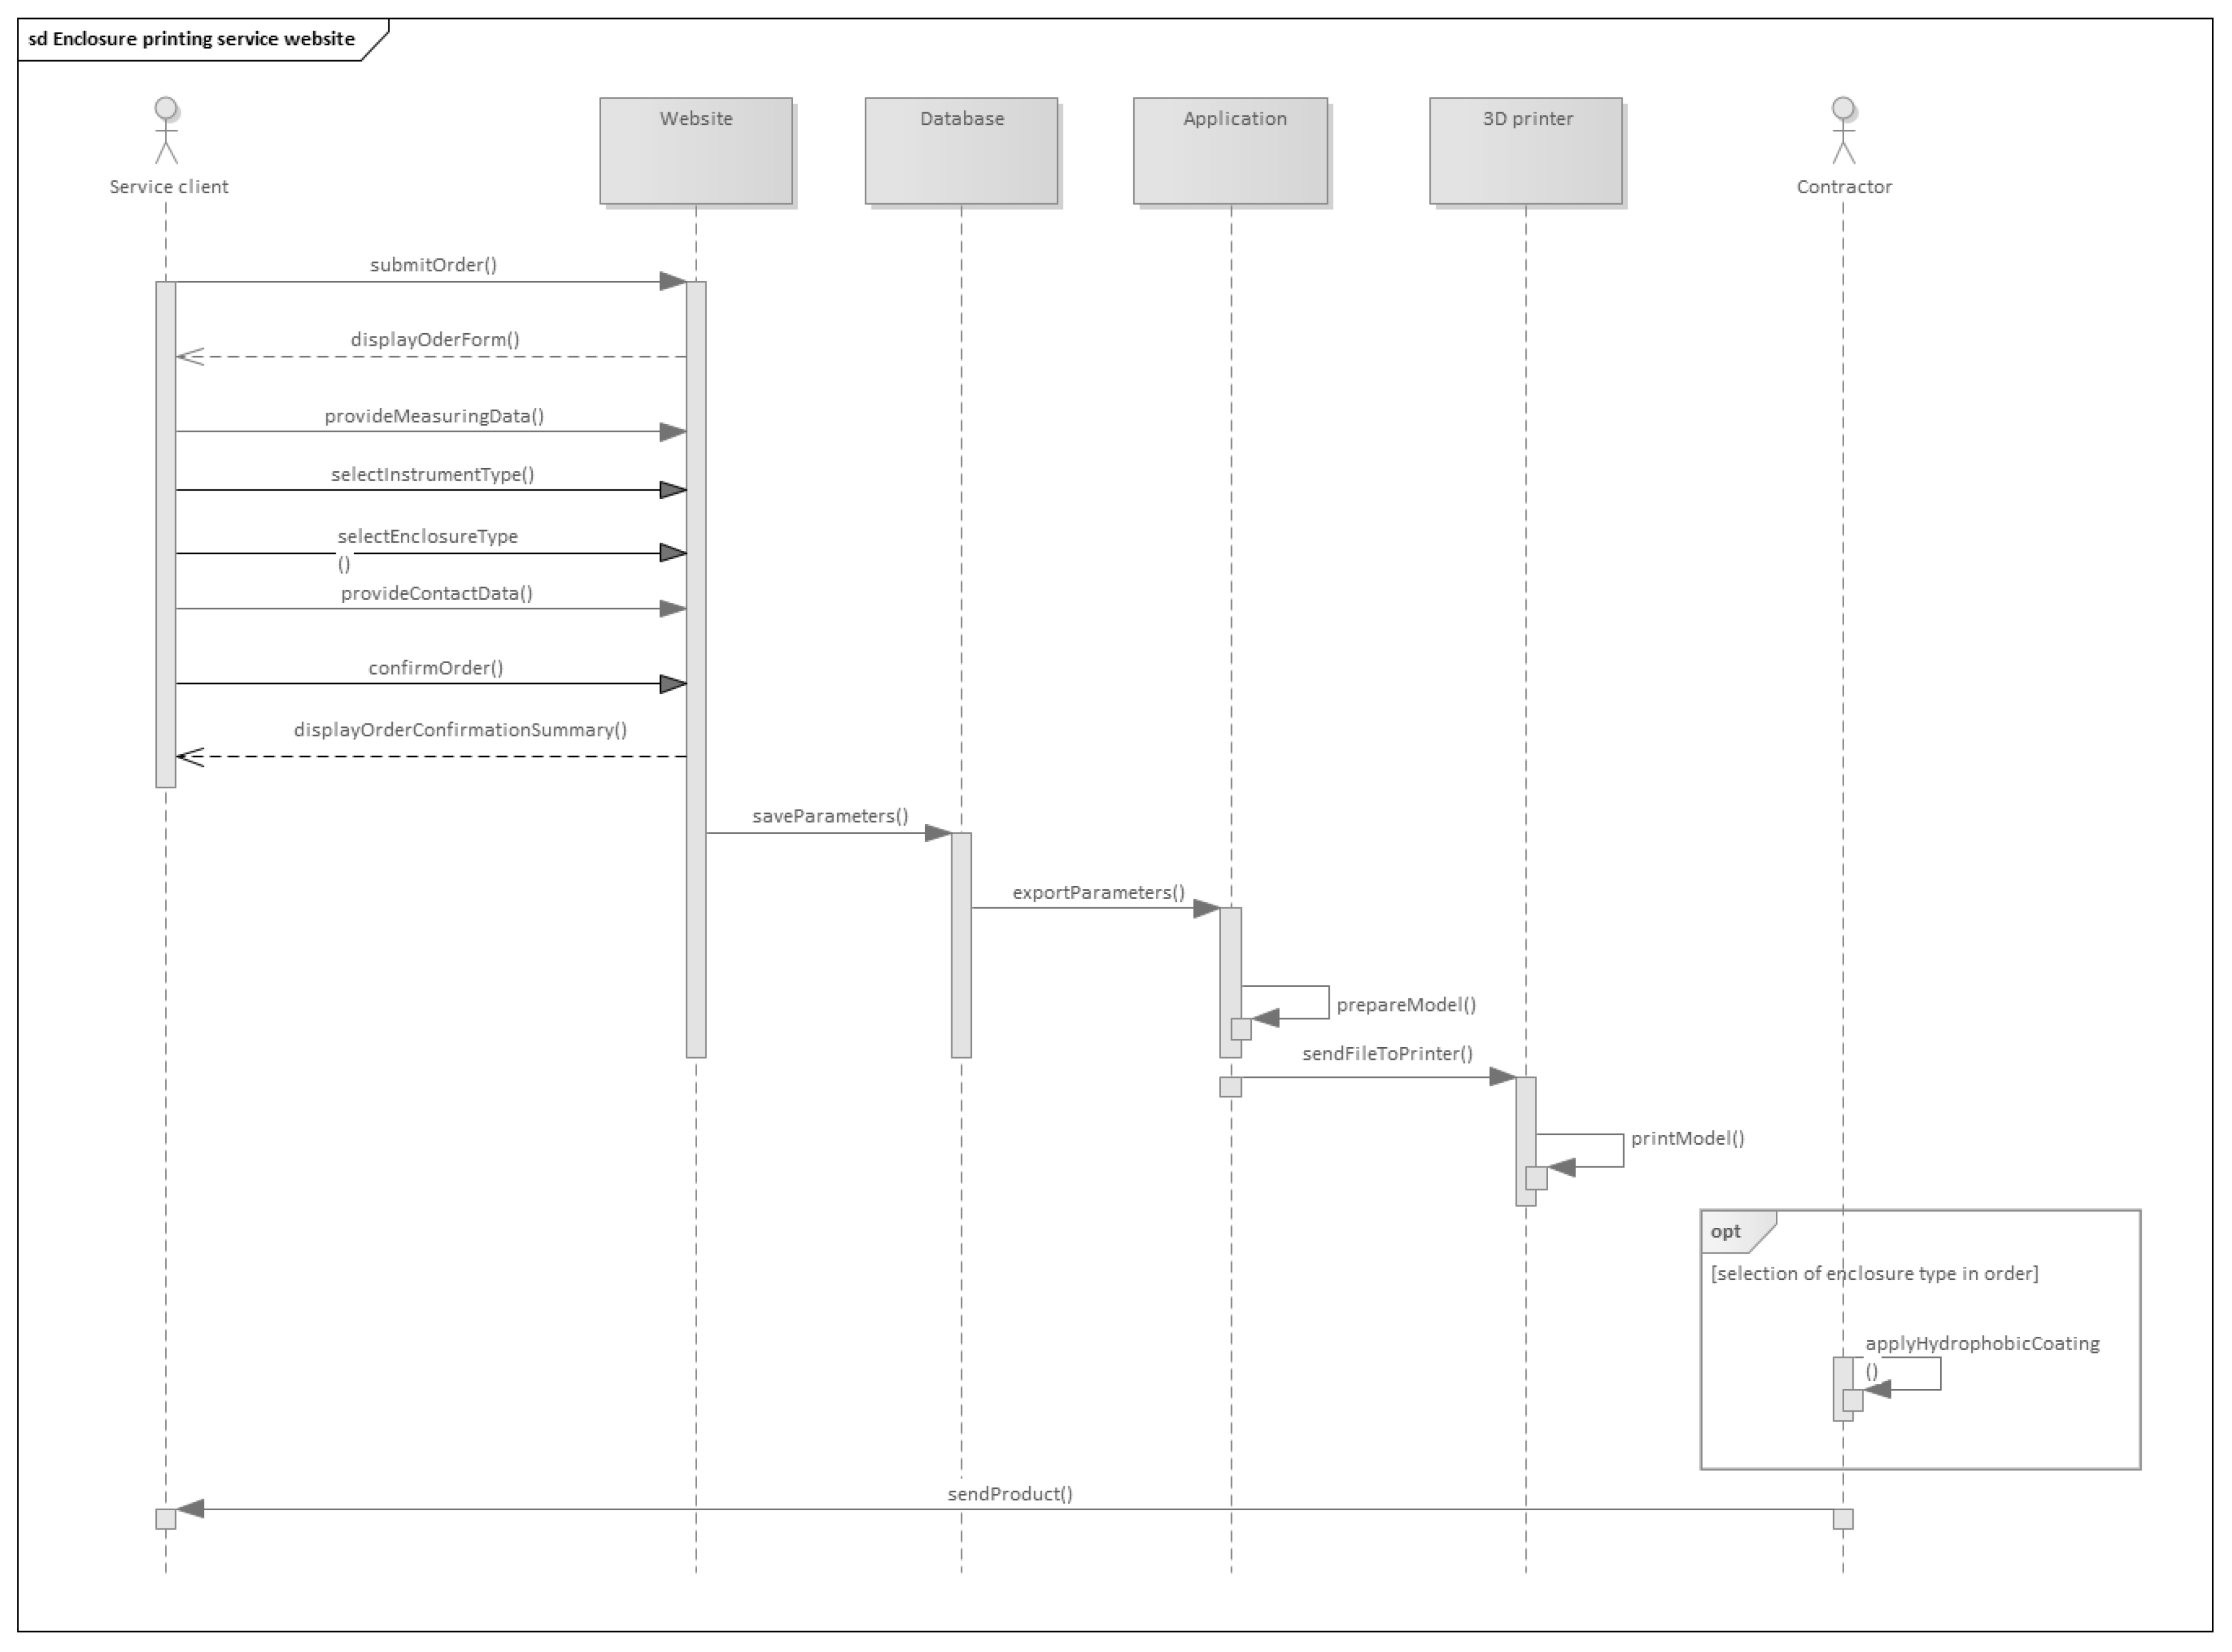
As a result of conceptual work, the developed technological workflow was modeled in the form of appropriate UML notations. To develop the UML diagrams, we used Sparx System’s Enterprise Architect software. The environment allows for project documentation for IT solutions in various methodologies and standards. As the reference for preparing the UML activity diagram, we practically implemented the assumptions presented in
Section 2. After performing a series of laboratory tests with a total station and examining its station stability, we decided to describe the entire technological process, divided into individual stages, in a standardized form.
The modeling process complemented the research work, ensuring the repeatability of the process and transferring it successfully into a fully web-based environment. Regarding that, it became necessary to automate the approach according to ISO standards [
30,
31]. It seems to be crucial considering the quality control of the production process. Notably, the consistency of operations is essential in Industry 4.0, so there was needed to develop unified and standardized manufacturing [
32]. What is more, the modeling process itself was the subject of scientific research. Further, the service includes the following components: a database, a dedicated application, and a 3D printer. The printing service ends with covering the newly produced total station housing with the hydrophobic coating. In the last phase, the product is delivered to a client. The initial UML diagram is presented in
Figure 7.
Compared to the general sketch already demonstrated in
Figure 1, the workflow run is now coherent with Geographic Information Standards ISO 19100. The procedure refers, then, to the role and relation classes of the service client/contractor on the dedicated printing website (
Figure 8).
Finally, a coherent data model is established, as demonstrated in
Figure 9.
The modeling process was verified in practice by referring to the following procedure:
The validation test was performed by utilizing the infrastructure of The Military University of Technology in Warsaw, Poland. The instrument setup took place using a concrete pillar with forced centering (see
Figure 6a), as the surrounding selected 7 target points (
Figure 10a) were marked by precisely manufactured steel ball prisms with a reflective foil (
Figure 10b). We assumed that both horizontal and vertical angles observed by the total station should be diversified to consider a random deployment pattern of the control points.
The ball prisms of such kind are mostly used for precise surveys, especially for structural monitoring purposes or laser-tracker applications [
33]. Using such precise targets significantly reduces or even eliminates most of the systematic and personal errors [
34]. The target distances varied from 4.029 m to 8.299 m. The instrument covered by the new manufactured housing was then run in a continuous surveying mode using Leica GeoMoS as the total station steering software [
35,
36]. Precise point targeting was executed by utilizing an ATR mode, as already explained.
Figure 11 presents a schematic sketch of the measuring process.
The obtained survey precision is shown in
Table 1. Sigma values σX, σY, and σZ exemplify the surveying resolution along with the local coordinate exes XYZ and come from the Leica GeoMoS database.
As one can see, the achieved precision practically coincides either with 0 or near 0 values and does not go beyond 1.2 mm. Such a value represents the surveying precision using the total station with the ATR module [
35] or even the statistical noise coming from adjustment computations.
4. Discussion
The results achieved in the laboratory test confirm the high stability of the tested instrument targeting control points directly from the new manufactured housing. The effectiveness of the developed technological line allowing for the automatic designing of total station housings for use in automated deformation monitoring systems has also been confirmed. The results obtained in the laboratory confirmed the consistency of the instrument readings. The manufactured product demonstrated no negative impact on the tested total station. During similar applications on various engineering objects, practitioners encounter many problems that sometimes significantly degrade the measurements. Here, one can mention the impact of atmospheric conditions on the total station (ice caps or dust stains on glasses of protective containers, instrument overheating by a constant solar exposure) and other error sources typical for quantity surveying. A particular problem may be the interference with the total station laser beam track caused by the container glasses. Here, we encounter the phenomenon of the refraction typical for light beams passing through different environments (e.g., air–glass–air) and its dispersion caused by glare. This problem mainly concerns deformation monitoring systems because the electronic total stations used for such tasks are equipped with automatic target recognition modules as standard. In such cases, the changing lighting conditions characteristic of different media interfere with the operation of the scan engines. This often leads to the incorrect identification of prisms or complete dysfunction of such modules. When designing our solution, we wanted to avoid such situations while being aware of the adverse impact of other factors on the instrument. The effect of conceptual modeling and the obtained test results confirm the fulfillment of the requirements set for contractors of surveying works, especially on construction sites.
Due to conceptual modeling using UML diagrams, we have obtained a standardized procedure for automating the design process of structural monitoring systems. It is crucial in Industry 4.0, characterized by high standardization and automation of manufacturing. Such an approach will be used mainly in the case of hardly accessible objects located in endangered areas. The construction works are often executed in the impacting zone of various adverse factors caused by human activity or natural phenomena. Hence, the organizational design of measuring and control systems should proceed accurately, and the surveys should be started rapidly. By operating in near real-time, each measuring cycle needs to run reliably. The automated surveying systems directly refer to the safety of people and infrastructural integrity. Numerous similar problems occur during the construction of tunnels, metro lines, roads, motorways, or high-rise buildings. Correspondingly, the study of natural objects such as rock massifs or glacial valleys requires ensuring the durability and reliability of the instruments used. In many cases, possible multiple inspection visits to facilities may be enormously complicated. Due to that, there is a need to develop an accurate and reliable solution supporting the implementation of automated measurement systems.
Utilizing geodetic instruments—especially electronic total stations—is usually expensive and requires proper handling. Nevertheless, optical measurement methods are very susceptible to the refraction index related to the course of the line of sight running through air layers of different characteristics. In this context, the instruments should be set up in stable conditions, and there should be no obstacles along the laser beam track. In such a sense, our newly developed housing model meets high requirements in terms of quality assurance and appropriate measurement accuracy. Exceptional protection against the effects of water—especially precipitation—will also be a hydrophobic coating covered with the printed material. Hence, the lightweight, reflective solar dual-layer housing protects the total station optimally.
The developed UML diagrams successfully allowed for verifying the methodological assumptions. Such an approach made it possible to assess the correctness of the technological process. The developed conceptual models expressed in UML stand as an inevitable aspect of project documentation in terms of software engineering and implementing web-based services. What is more, potential modifications in technological procedures can be easily implemented using UML. The relevant diagrams exemplifying contextual modeling can freely be altered and extended, providing flexibility in change management.
5. Conclusions
As revealed, the developed methodology based on conceptual modeling allows for accurate and repeatable 3D printing of a dedicated total station protective housing. The measurement results obtained during the laboratory test confirm the correctness of the total station readings taken to the control prisms. The obtained precision remains at the millimeter level, which fully meets the expectations of surveyors and civil engineers regarding automated deformation monitoring systems. The obtained deviation values σX, σY, and σZ represent longitudinal, traverse, and height displacements in the geodetic monitoring system. Such values expressed on the submillimeter level indicate the impact of random errors related to common ambient conditions. They are entirely acceptable in geodetic deformation monitoring and illustrate the correctness of the measurements made. However, the authors are aware of some limitations of the proposed solution needing further investigation. First of all, as part of the project, a specific prototype solution was developed, requiring additional tests in different conditions. The studies need to be continued regarding other highly urbanized and rural areas. Undoubtedly, the prototype should also be tested in pure industrial states, such as factories, power plants, or mines. Deformation monitoring is essential in mining areas, which is why all development works should also consider factors related to the typically occurring damages, the impact of aggressive substances, etc. Secondly, the developed technological line should be commercialized in order to reduce the cost of manufacturing the final product. In the current phase, 3D printing itself is relatively expensive and time-consuming, so using it on a massive scale is still a significant limitation. Nevertheless, the authors are conducting further research to streamline and optimize the proposed process.


