
Near-Nature Ecological Technique for Pier Scour Countermeasure in a Submerged Overfall


Abstract
:Featured Application
Abstract
1. Introduction
2. Concept of Artificial Water Weeds and Its Protective Effect against Pier Scouring
- Parts of strip are cut with different length La for tests.
- The cross-section of each strip is measured.
- A smooth and moist glass is used as an experiment platform (Figure 3).
- The strip is submerged into water and then placed on the platform after it absorbs water fully.
- A thin strip is used to roll forward from the center of the strip so that the strip deflects due to the viscosity of water and friction of the glass.
- The bent width, Lw, is measured after the bent arc of the strips stabilizes.
3. Experimentation and Methodology
3.1. Experimental Setup
3.2. Experimental Procedure
4. Results and Discussions
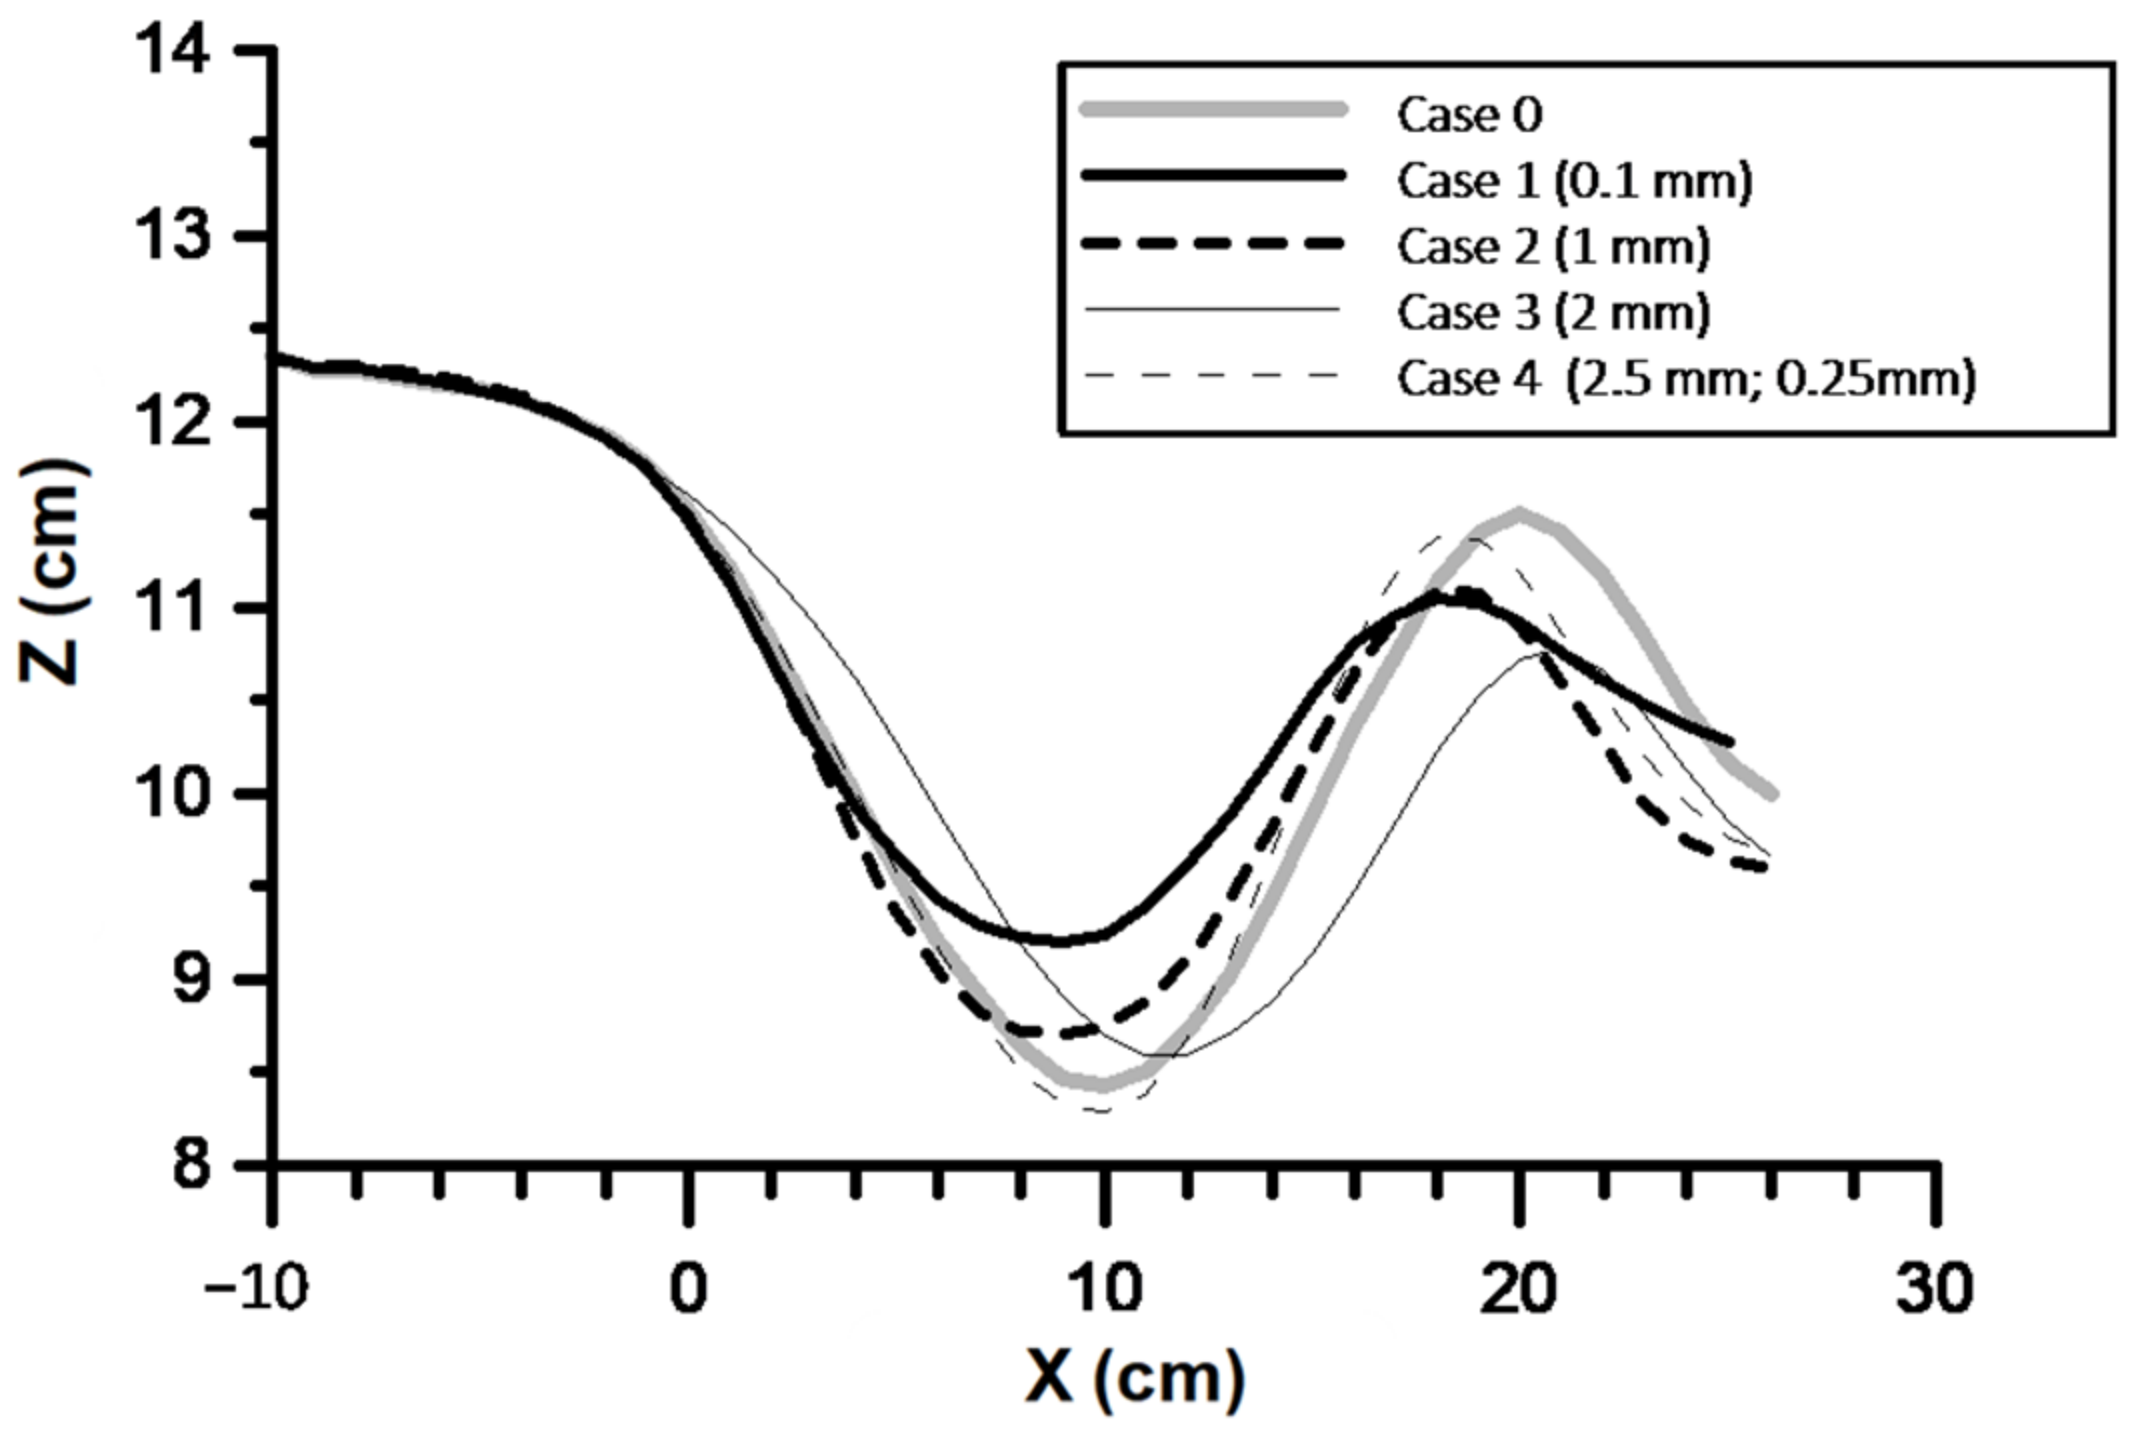
4.1. Protective Effect Due to the Size of Strips of CKAW
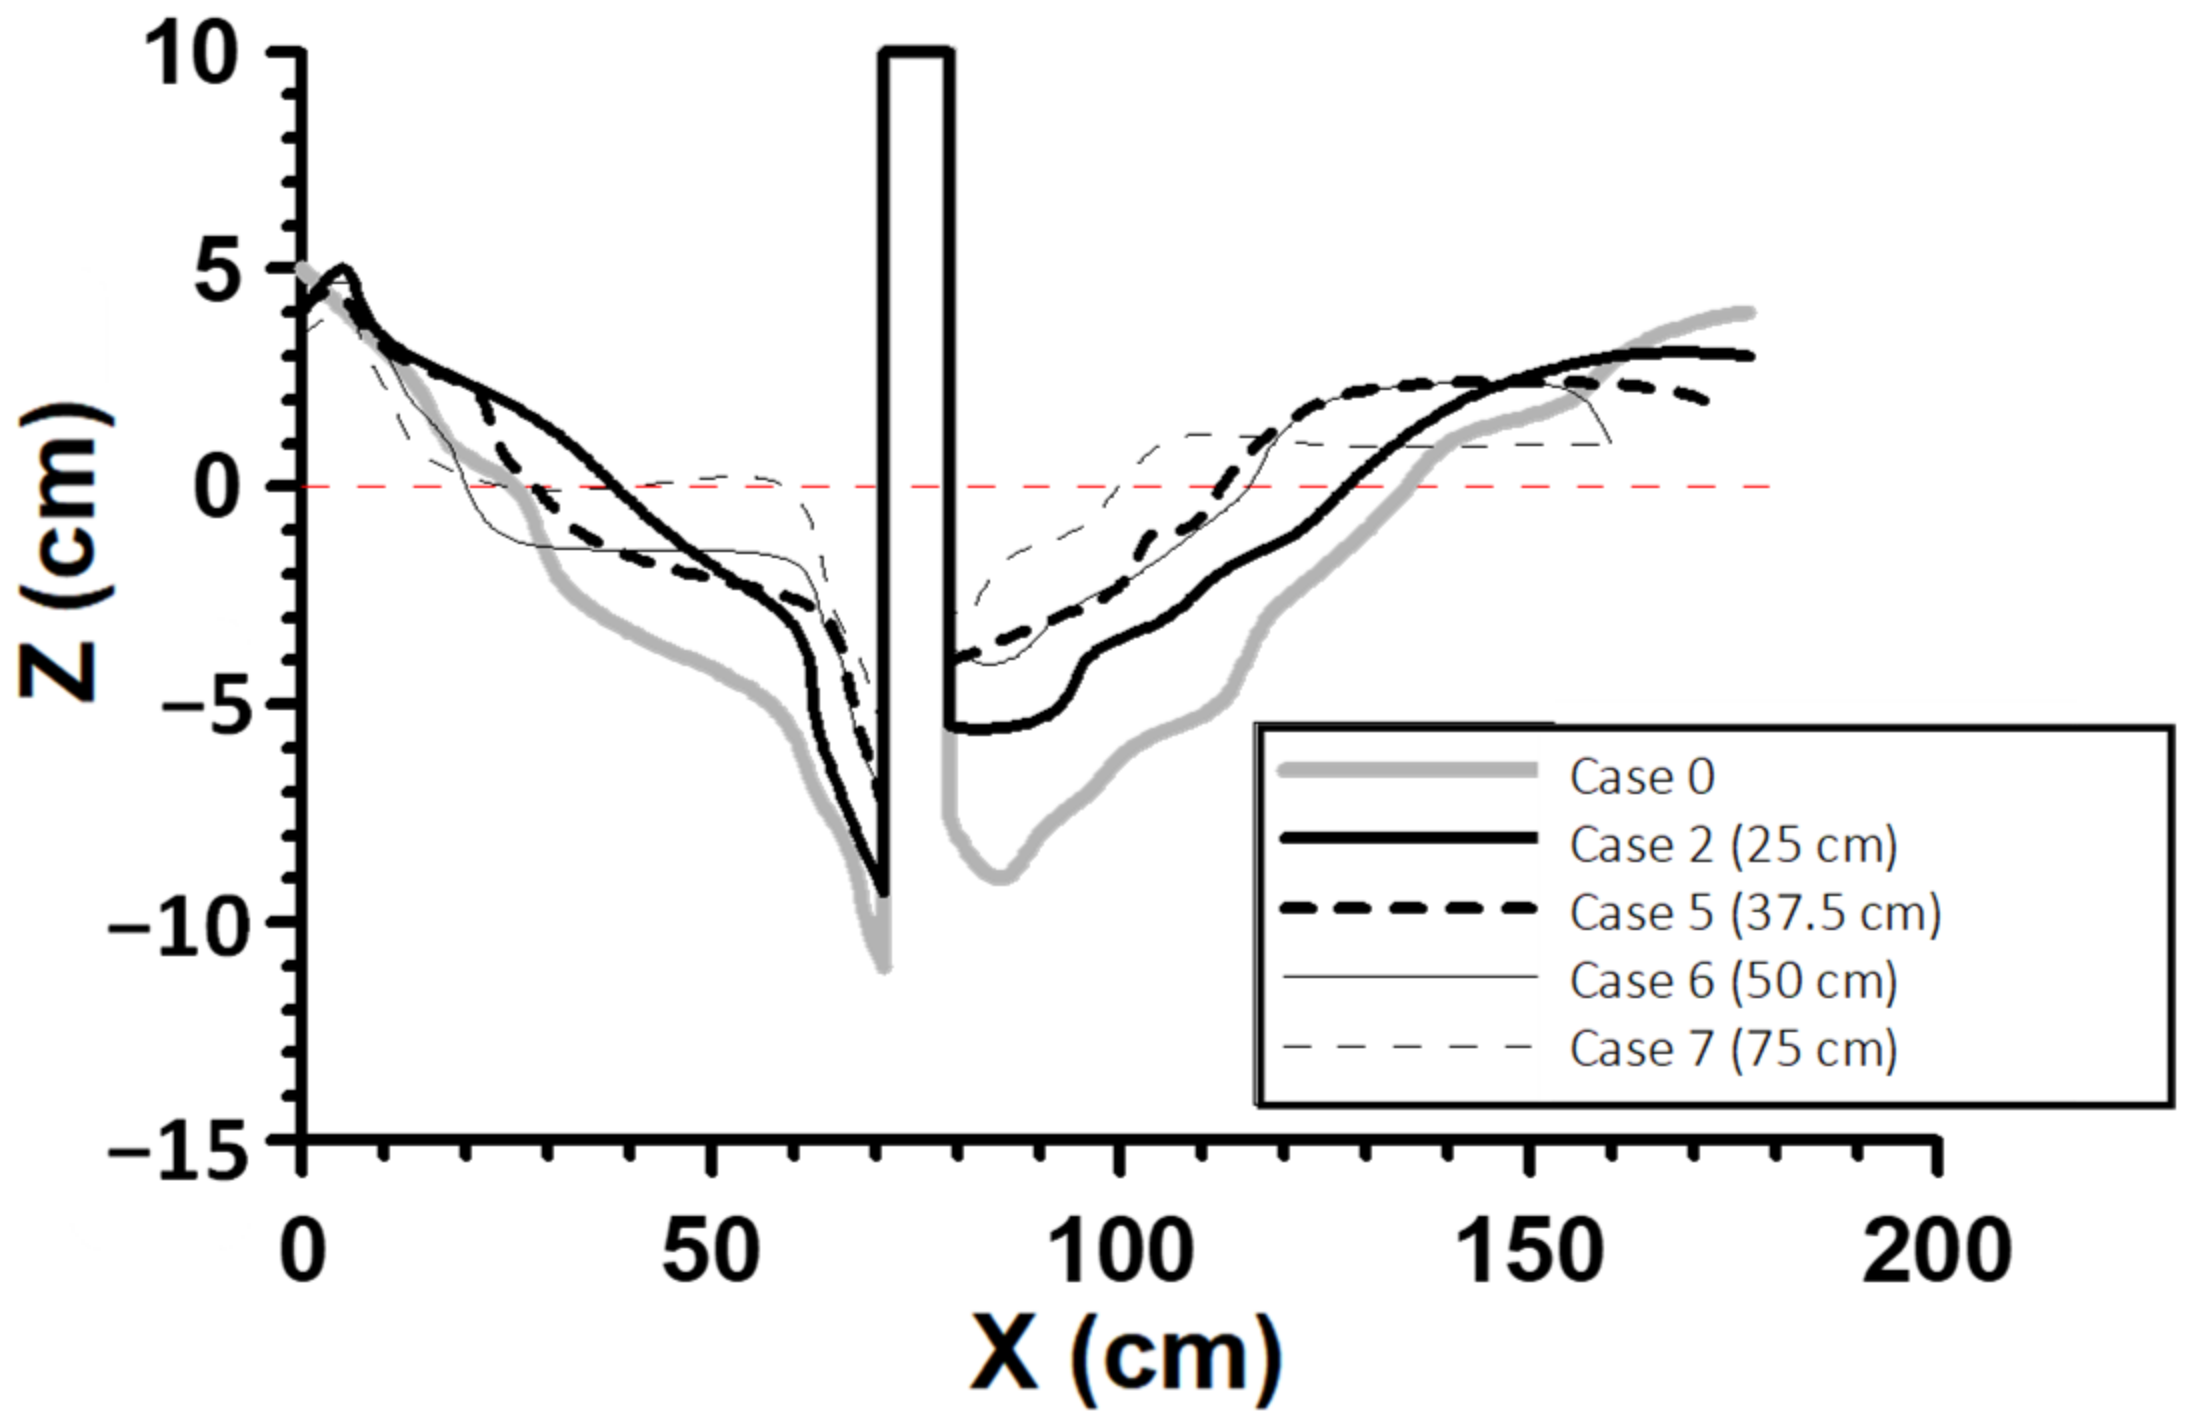
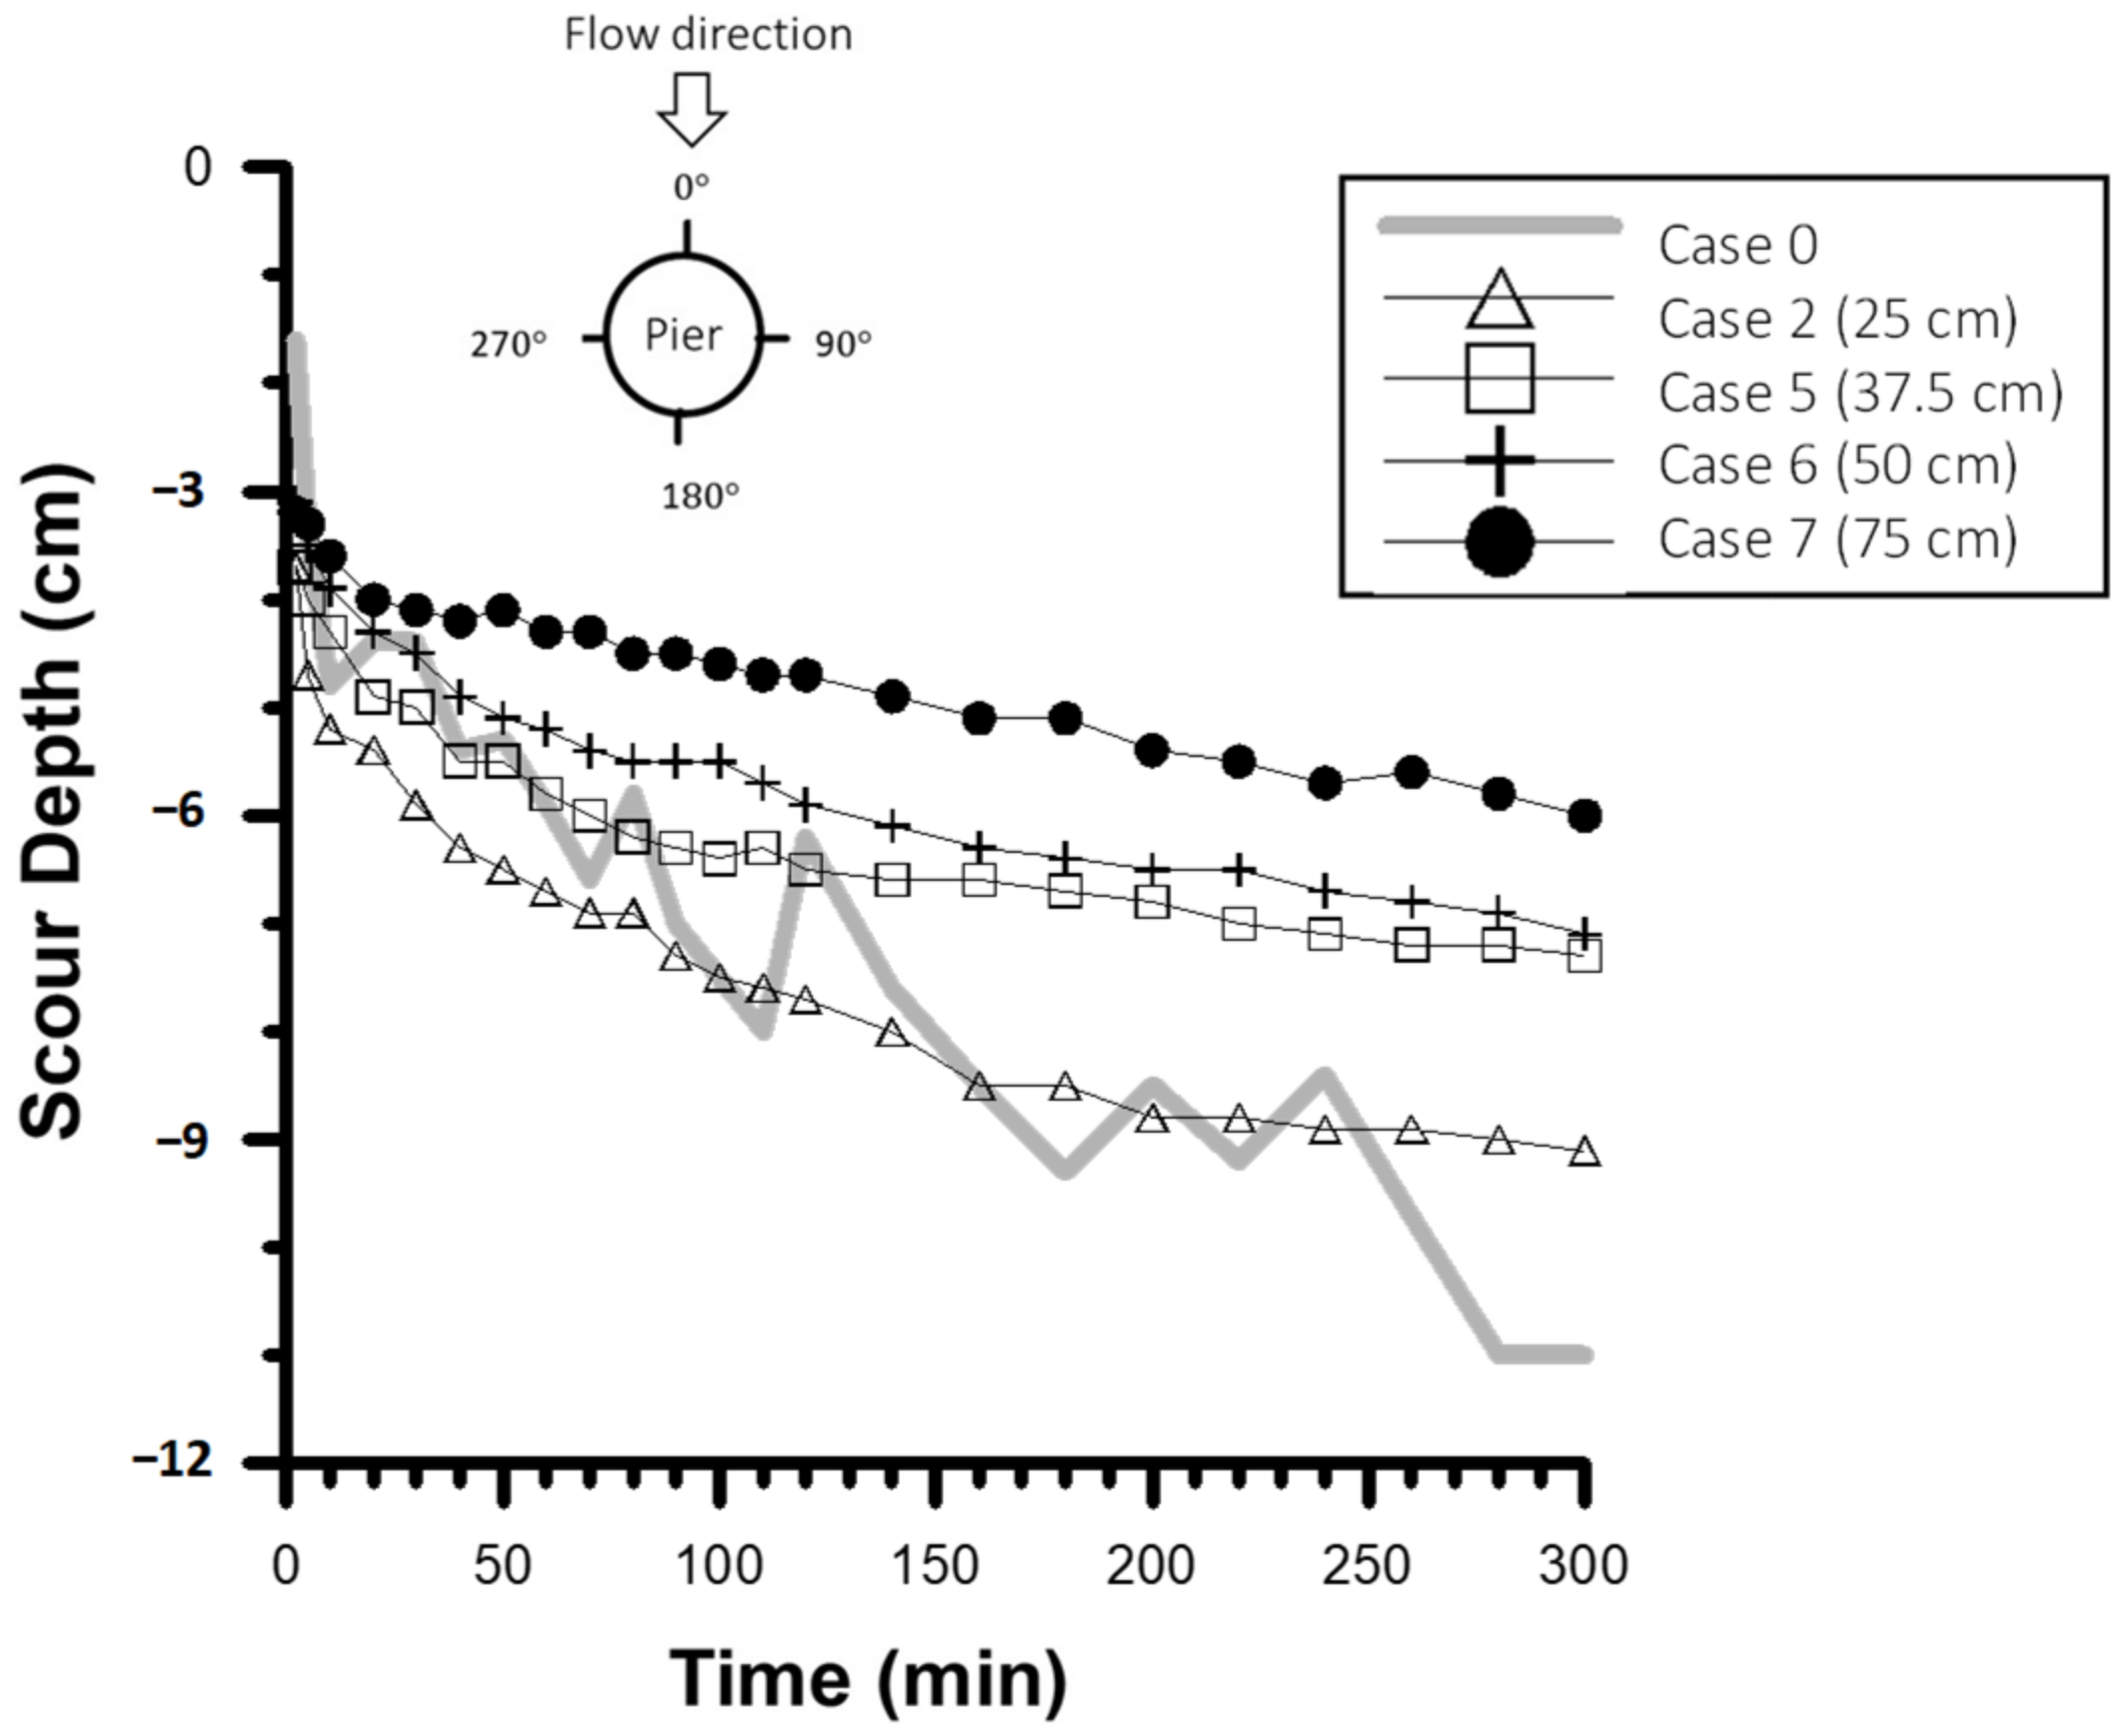
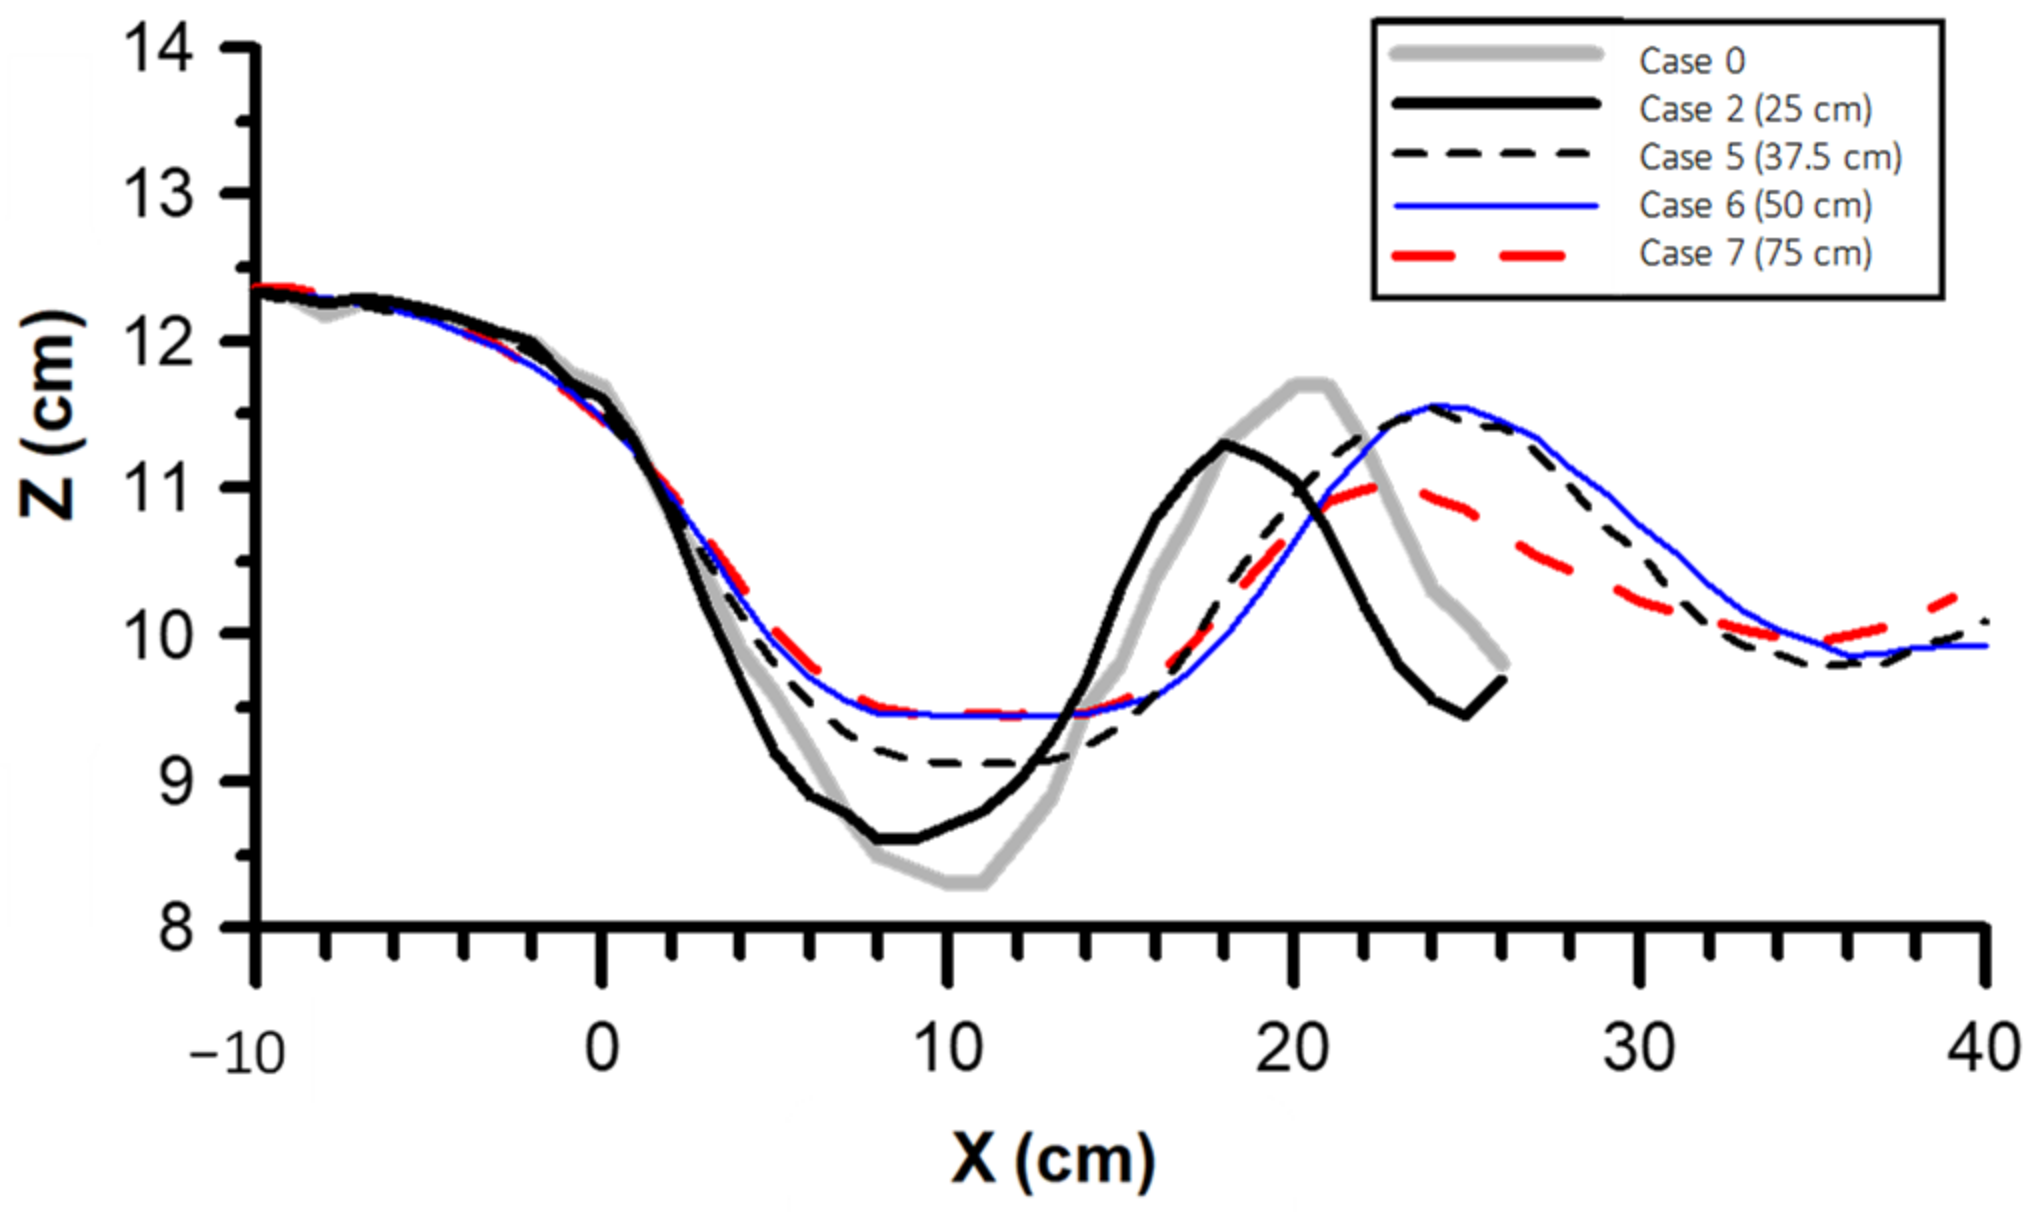
4.2. Protective Effect Due to Length of Strips of CKAW
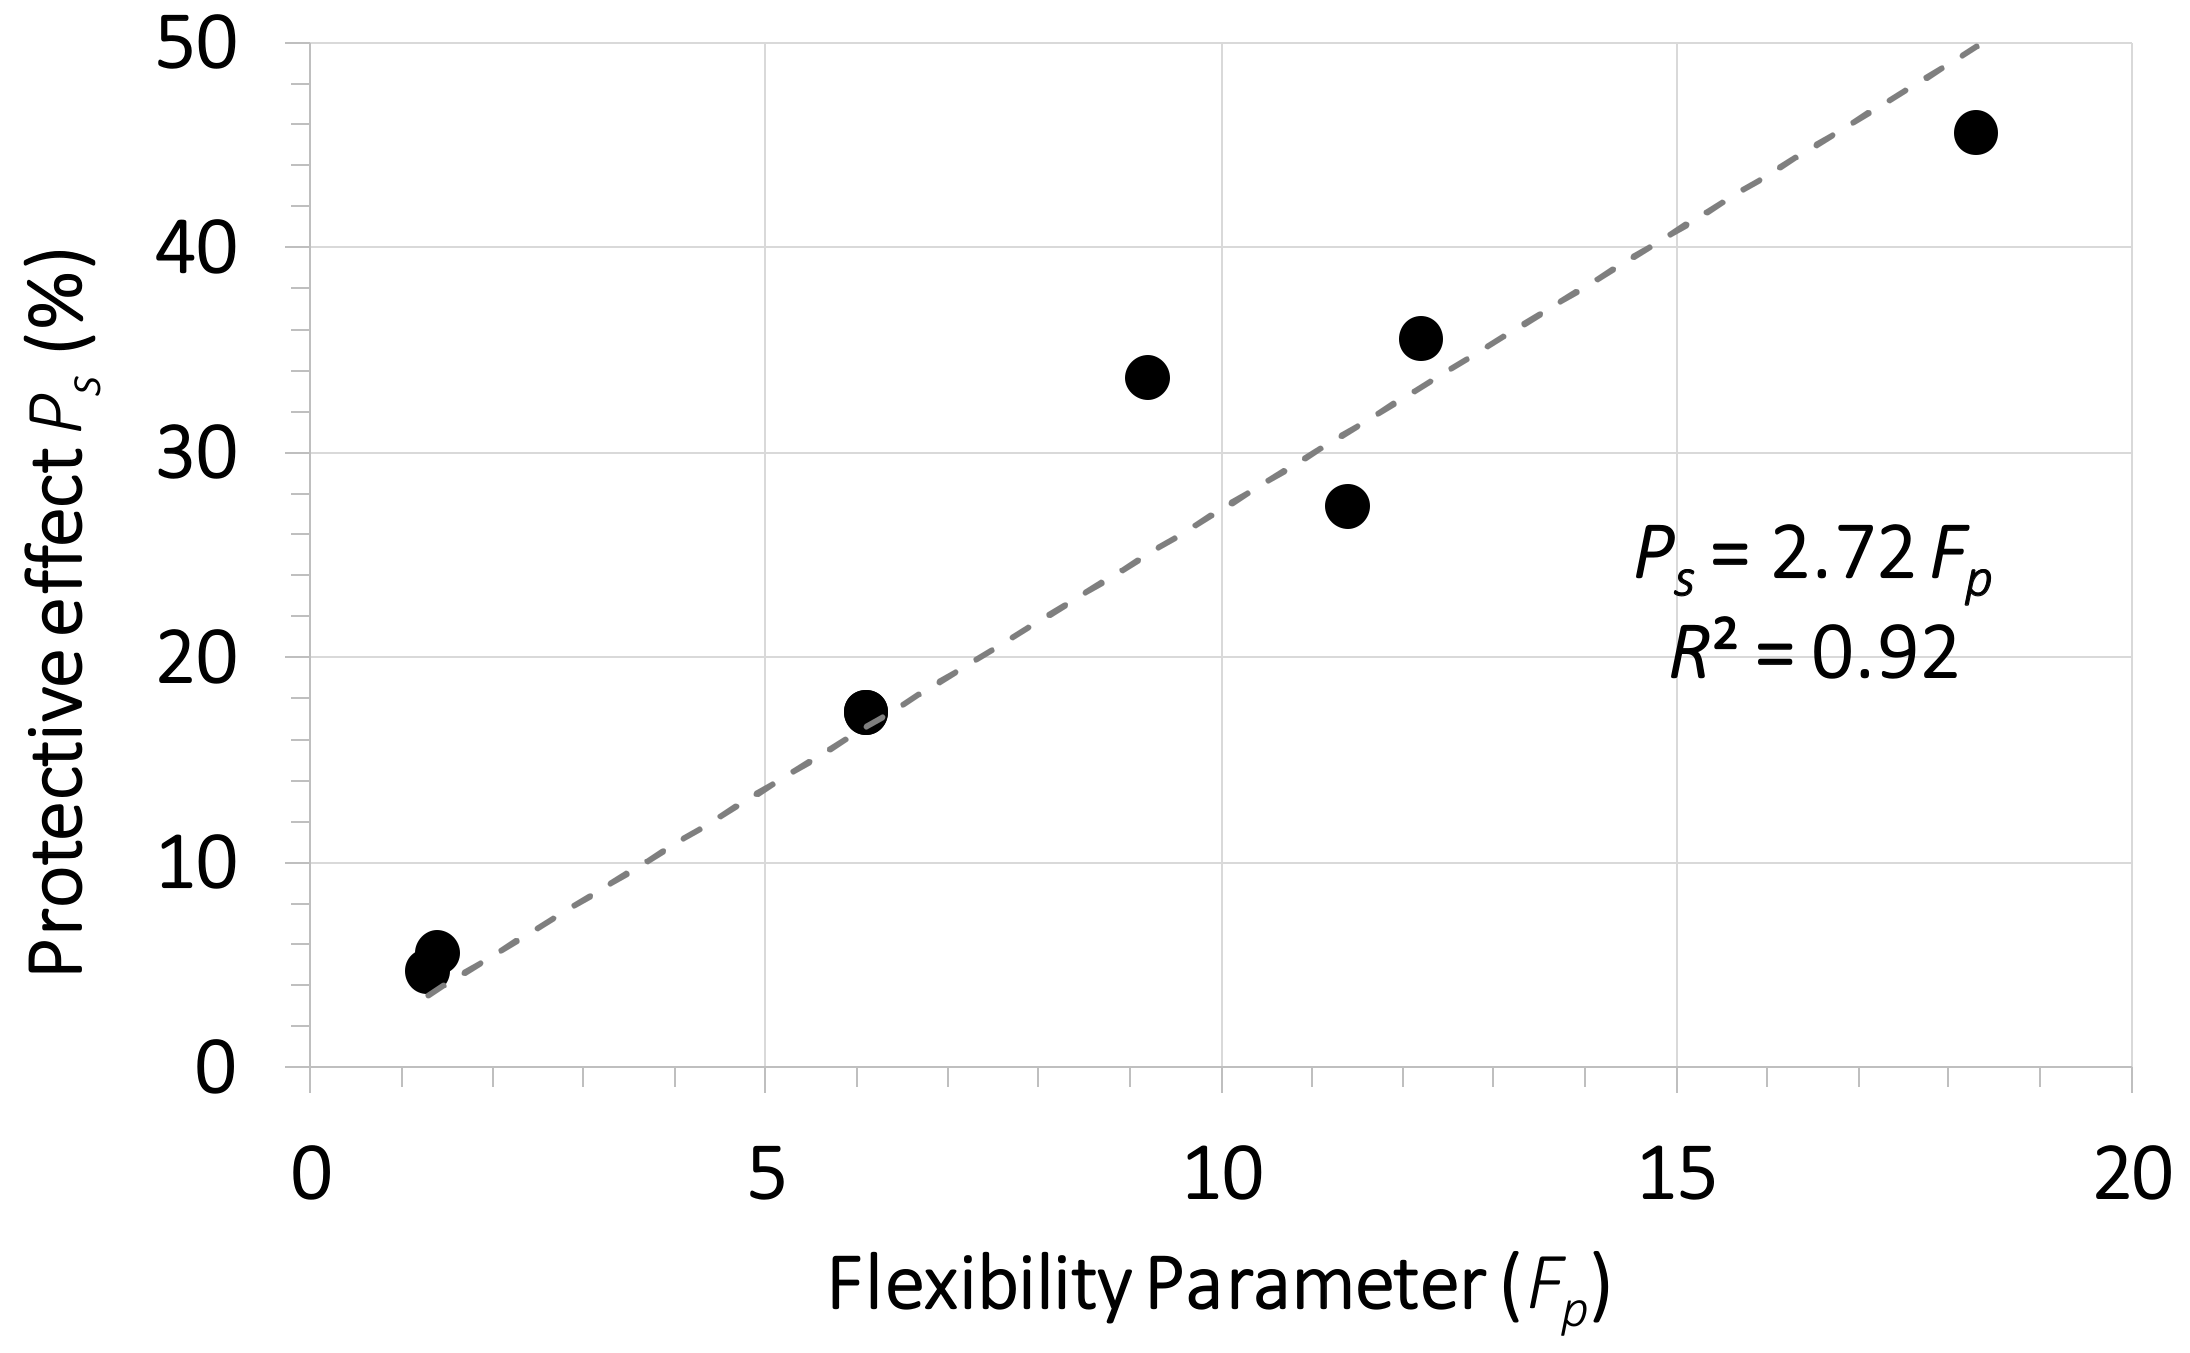
4.3. Protective Effect Due to Flexibility of CKAW
5. Conclusions
Author Contributions
Funding
Institutional Review Board Statement
Informed Consent Statement
Data Availability Statement
Conflicts of Interest
References
- Bormann, N.E.; Julien, P.Y. Scour downstream of grade-control structures. J. Hydraul. Eng. 1991, 117, 579–594. [Google Scholar] [CrossRef] [Green Version]
- Gaudio, R.; Marion, A.; Bovolin, V. Morphological effects of bed sills in degrading rivers. J. Hydraul. Res. 2000, 38, 89–96. [Google Scholar] [CrossRef]
- Lenzi, M.A.; Marion, A.; Comiti, F.; Gaudio, R. Local scouring in low and high gradient streams at bed sills. J. Hydraul. Res. 2002, 40, 731–739. [Google Scholar] [CrossRef]
- Abdelhaleem, F.S.F. Effect of semi-circular baffle blocks on local scour downstream clear-overfall weirs. Ain Shams Eng. J. 2013, 4, 675–684. [Google Scholar] [CrossRef] [Green Version]
- Schoklitsch, A. Kolkbildung unter Uverfallstrahlen. In Wasserwirtschaft 24; Springer: Vienna, Austria, 1932. [Google Scholar]
- Moore, W.L. Energy loss at the base of a free overfall. Trans. Am. Soc. Civ. Eng. 1943, 108, 1343–1360. [Google Scholar] [CrossRef]
- Little, W.C.; Murphey, J.B. Model study of low drop grade control structures. J. Hydraul. Div. 1982, 108, 1132–1146. [Google Scholar] [CrossRef]
- Chen, J.Y.; Hong, Y.M. Characterisitics of check dam scour hole by free over-fall flow. J. Chin. Inst. Eng. 2001, 24, 673–680. [Google Scholar] [CrossRef]
- Huang, C.K.; Chang, C.J. Characteristics of pier scour at downstream of overfall. J. Chin. Soil Water Conserv. 2003, 34, 251–259. Available online: http://www.cswcs.org.tw/Center/Journal/EachJournalList.aspx?SendVol=34&SendNo=3&SendPreview=765 (accessed on 24 April 2022).
- D’Agostino, V.; Ferro, V. Scour on alluvial bed downstream of grade-control structures. J. Hydraul. Eng. 2004, 130, 24–37. [Google Scholar] [CrossRef]
- Hoffmans, I.G.J.C.M. Closure problem to jet scour. J. Hydraul. Res. 2009, 47, 100–109. [Google Scholar] [CrossRef]
- Comiti, F.; Lenzi, M.A.; Mao, L. Local scouring at check dams in mountain rivers. In Check Dams, Morphological Adjustments and Erosion Control in Torrential Streams; Nova Science Publishers: Hauppauge, NY, USA, 2010; pp. 263–282. Available online: https://www.researchgate.net/publication/286118230_Local_scouring_at_check-dams_in_mountain_rivers (accessed on 24 April 2022).
- Yager, E.M.; Dietrich, W.E.; Kirchner, J.W.; McArdell, B.W. Prediction of sediment transport in step-pool channels. Water Resour. Res. 2012, 48, W01541. [Google Scholar] [CrossRef] [Green Version]
- Melville, B.W. Scour at various hydraulic structures: Sluice gates, submerged bridges and low weirs. Australas. J. Water Resour. 2014, 18, 101–117. [Google Scholar] [CrossRef]
- Lee, W.L.; Lu, C.W.; Huang, C.K. A study on interaction between overfall types and scour at bridge piers with a moving-bed experiment. Water 2021, 13, 152. [Google Scholar] [CrossRef]
- Melville, B.W.; Hadfield, A.C. Use of sacrificial piles as pier scour countermeasures. J. Hydraul. Eng. 1999, 125, 1221–1224. [Google Scholar] [CrossRef]
- Lee, W.L.; Lu, C.W.; Huang, C.K. Application of a single porous basket as a pier scour countermeasure. Water 2021, 13, 3052. [Google Scholar] [CrossRef]
- Chiew, Y.M. Scour protection at bridge piers. J. Hydraul. Eng. 1992, 118, 1260–1269. [Google Scholar] [CrossRef]
- Lauchlan, C.S. Countermeasures for Pier Scour. Ph.D. Thesis, University of Auckland, Auckland, New Zealand, 1999. Available online: https://trid.trb.org/view/855383 (accessed on 24 April 2022).
- Huang, C.K.; Tang, C.J.; Kuo, T.Y. Use of surface guide panels as pier scour countermeasures. Int. J. Sediment Res. 2005, 20, 117–128. [Google Scholar]
- Tafarojnoruz, A.; Gaudio, R.; Dey, S. Flow-altering countermeasures against scour at bridge piers: A review. J. Hydraul. Res. 2010, 48, 441–452. [Google Scholar] [CrossRef]
- Khaple, S.; Hanmaiahgari, P.R.; Gaudio, R.; Dey, S. Splitter plate as a flow-altering pier scour countermeasure. Acta Geophys. 2017, 65, 957–975. [Google Scholar] [CrossRef]
- Wu, H.L.; Feng, Z.Y. Ecological engineering methods for soil and water conservation in Taiwan. Ecol. Eng. 2006, 28, 333–344. [Google Scholar] [CrossRef]
- Evette, A.; Labonne, S.; Rey, F.; Liebault, F.; Jancke, O.; Girel, J. History of bioengineering techniques for erosion control in rivers in Western Europe. Environ. Manag. 2009, 43, 972–984. [Google Scholar] [CrossRef] [PubMed]
- Sanches Fernandes, L.F.; Sampaio Pinto, A.A.; Salgado Terêncio, D.P.; Leal Pacheco, F.A.; Vitor Cortes, R.M. Combination of ecological engineering procedures applied to morphological stabilization of estuarine banks after dredging. Water 2020, 12, 391. [Google Scholar] [CrossRef] [Green Version]
- Xu, J.; Li, Z. A review on ecological engineering based engineering management. Omega 2012, 40, 368–378. [Google Scholar] [CrossRef]
- Müller, W.W.; Saathoff, F. Geosynthetics in geoenvironmental engineering. Sci. Technol. Adv. Mater. 2015, 16, 034605. [Google Scholar] [CrossRef] [PubMed] [Green Version]
- Koerner, R.M. Emerging and future developments of selected geosynthetic applications. J. Geotech. Geoenviron. Eng. 2000, 126, 293–306. [Google Scholar] [CrossRef]
- Theisen, M.S. The role of geosynthetics in erosion and sediment control: An overview. Geotext. Geomembr. 1992, 11, 535–550. [Google Scholar] [CrossRef]
- Cancelli, A.; Monti, R.; Rimoldi, P. Comparative study of geosynthetics for erosion control. In Proceedings of the 4th International Conference Geotextiles and Geomembranes and Related Products, The Hague, The Netherlands, 28 May–1 June 1990; Volume 1, pp. 403–408. [Google Scholar]
- Calhoun, C.C. Development of Design Criteria and Acceptance Specifications for Plastic Cloth; Technical Report S-72-7; U.S. Army, Corps of Engineers, Commonwealth of Virginia, Waterways Experiment Station: Vicksburg, MS, USA, 1972; pp. 6–55.
- Carroll, R.G. Geotextiles filter criteria. In Transportation Research Record; Transportation Research Board: Washington, DC, USA, 1983; pp. 46–53. [Google Scholar]
- Aguda, R.E. Use of Different Geofibres in Erosion Control on Road Embankments. Bachelor’s Thesis, Federal University of Technology Owerri, Ihiagwa, Nigeria, 1995. [Google Scholar]
- Etminan, V.; Lowe, R.J.; Ghisalberti, M. Canopy resistance on oscillatory flows. Coast. Eng. 2019, 152, 103502. [Google Scholar] [CrossRef]
- D’Ippolito, A.; Lauria, A.; Alfonsi, G.; Calomino, F. Investigation of flow resistance exerted by rigid emer-gent vegetation in open channel. Acta Geophys. 2019, 67, 971–986. [Google Scholar] [CrossRef]
- Liu, C.; Shan, Y.; Sun, W.; Yan, C.; Yang, K. An open channel with an emergent vegetation patch: Predict-ing the longitudinal profiles of velocities based on exponential decay. J. Hydrol. 2020, 582, 124429. [Google Scholar] [CrossRef]
- D’Ippolito, A.; Calomino, F.; Alfonsi, G.; Lauria, A. Drag coefficient of in-line emergent vegetation in open channel flow. Int. J. River Basin Manag. 2021, 1–11. [Google Scholar] [CrossRef]
- D’Ippolito, A.; Calomino, F.; Alfonsi, G.; Lauria, A. Flow resistance in open channel due to vegetation at reach scale: A review. Water 2021, 13, 116. [Google Scholar] [CrossRef]
- Lou, S.; Chen, M.; Ma, G.; Liu, S.; Wang, H. Sediment suspension affected by submerged rigid vegetation under waves, currents and combined wave–current flows. Coast. Eng. 2022, 173, 104082. [Google Scholar] [CrossRef]
- Reidenbach, M.A.; Timmerman, R. Interactive effects of seagrass and the microphytobenthos on sediment suspension within shallow coastal bays. Estuaries Coasts 2019, 42, 2038–2053. [Google Scholar] [CrossRef]
- Walter, R.K.; O’Leary, J.K.; Vitousek, S.; Taherkhani, M.; Geraghty, C.; Kitajima, A. Large-scale erosion driven by intertidal eelgrass loss in an estuarine environment. Estuarine. Coast. Shelf Sci. 2020, 243, 106910. [Google Scholar] [CrossRef]
- Dey, S.; Barbhuiya, A.K. Clear-water scour at abutments in thinly armored beds. J. Hydraul. Eng. 2004, 130, 622–634. [Google Scholar] [CrossRef]
- Tafarojnoruz, A.; Gaudio, R.; Calomino, F. Evaluation of flow-altering countermeasures against bridge pier scour. J. Hydraul. Eng. 2012, 138, 297–305. [Google Scholar] [CrossRef]
- Melville, B.W.; Coleman, S.E. Bridge Scour; Water Resources Publication: Littleton, CO, USA, 2000. [Google Scholar]
- Dey, S. Three-dimensional vortex flow field around a circular cylinder in a quasi-equilibrium scour hole. Sadhana 1995, 20, 871–885. [Google Scholar] [CrossRef] [Green Version]
- Oliveto, G.; Hager, W.H. Further results to time-dependent local scour at bridge elements. J. Hydraul. Eng. 2005, 131, 97–105. [Google Scholar] [CrossRef]
- Melville, B.W.; Sutherland, A.J. Design method for local scour at bridge piers. J. Hydraul. Eng. 1988, 114, 1210–1226. [Google Scholar] [CrossRef]
- Melville, B.W.; Chiew, Y.M. Time scale for local scour at bridge piers. J. Hydraul. Eng. 1999, 125, 59–65. [Google Scholar] [CrossRef]


| Material Composition and Application | Diameter Da (mm) | Correlation Coefficient R2 | Flexibility Index Fi | ||
|---|---|---|---|---|---|
| Cotton dressmaking | 0.1 | 2.5276 | −0.01305 | 0.9226 | 248 |
| Cotton dressmaking | 1.0 | 1.4780 | −0.05840 | 0.9212 | 46 |
| Nylon craft use | 1.5 | 3.2063 | −0.01618 | 0.9950 | 211 |
| Silk and satin Chinese knots | 2.0 | 1.7109 | −0.02562 | 0.9789 | 110 |
| Discharge | Water Depth Upstream | Water Depth Downstream | Velocity Upstream | Velocity Downstream | Flume Bed Difference 1 | Water Table Difference 1 |
|---|---|---|---|---|---|---|
| m3/s | m | m | m/s | m/s | m | m |
| 0.0247 | 0.051 | 0.125 | 0.484 | 0.198 | 0.08 | 0.006 |
| Cases | 0 | 1 | 2 | 3 | 4 | 5 | 6 | 7 |
|---|---|---|---|---|---|---|---|---|
| Shape of strip 1 | N/A | C | C | C | R | C | C | C |
| Diameter of strips Da (mm) | N/A | 0.1 | 1 | 2 | ba = 25 bs = 0.25 | 1 | 1 | 1 |
| Density of strips (g/cm3) | N/A | 1.141 | 1.141 | 1.120 | 1.063 | 1.141 | 1.141 | 1.141 |
| Flexibility index Fi | N/A | 248 | 46 | 110 | 69 | 46 | 46 | 46 |
| Length of strips L (cm) | N/A | 25 | 25 | 25 | 25 | 37.5 | 50 | 75 |
| L/ | N/A | 2821 | 282 | 141 | 100 | 423 | 564 | 846 |
| Flexibility parameter Fp | N/A | 11.4 | 6.1 | 1.3 | 1.4 | 9.2 | 12.2 | 18.3 |
| 2L/Ld | N/A | 1/3 | 1/3 | 1/3 | 1/3 | 1/2 | 2/3 | 1 |
| Composition and application of the material | N/A | Cotton dress | Cotton dress | Silk & satin Chinese knots | Cotton ribbon | Cotton dress | Cotton dress | Cotton dress |
| Group | Case 0 | Case 1 | Case 2 | Case 3 | Case 4 |
|---|---|---|---|---|---|
| Strip size (mm) | N/A | 0.1 | 1 | 2 | ba = 25 bs = 0.25 |
| Flexibility index Fi | 248 | 46 | 110 | 69 | |
| Flexibility parameter Fp | 11.4 | 6.1 | 1.3 | 1.4 | |
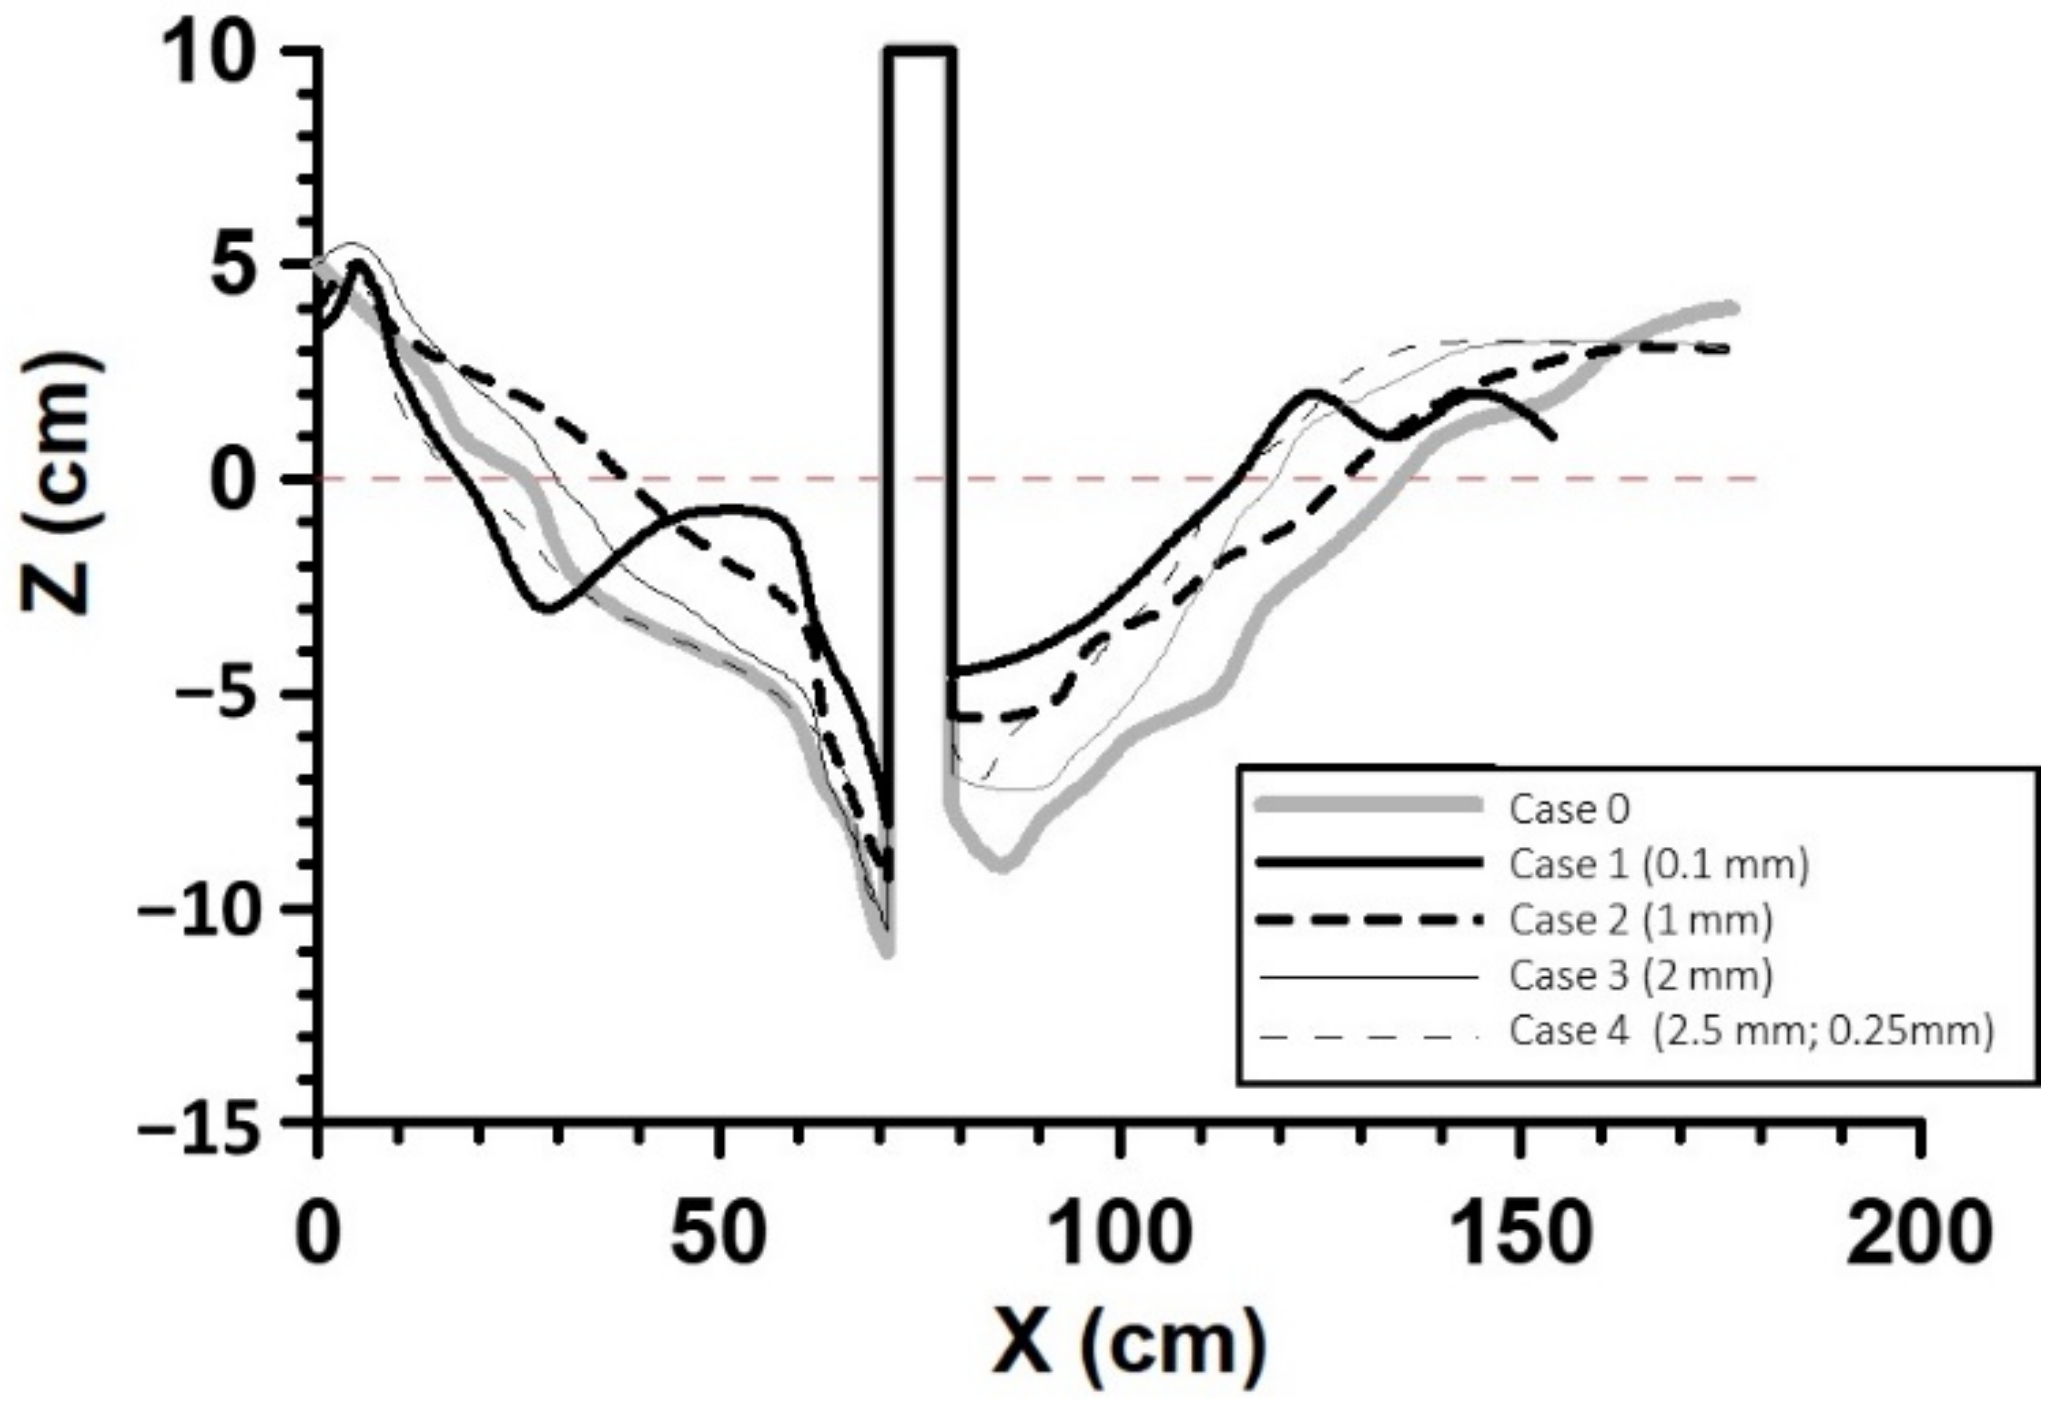
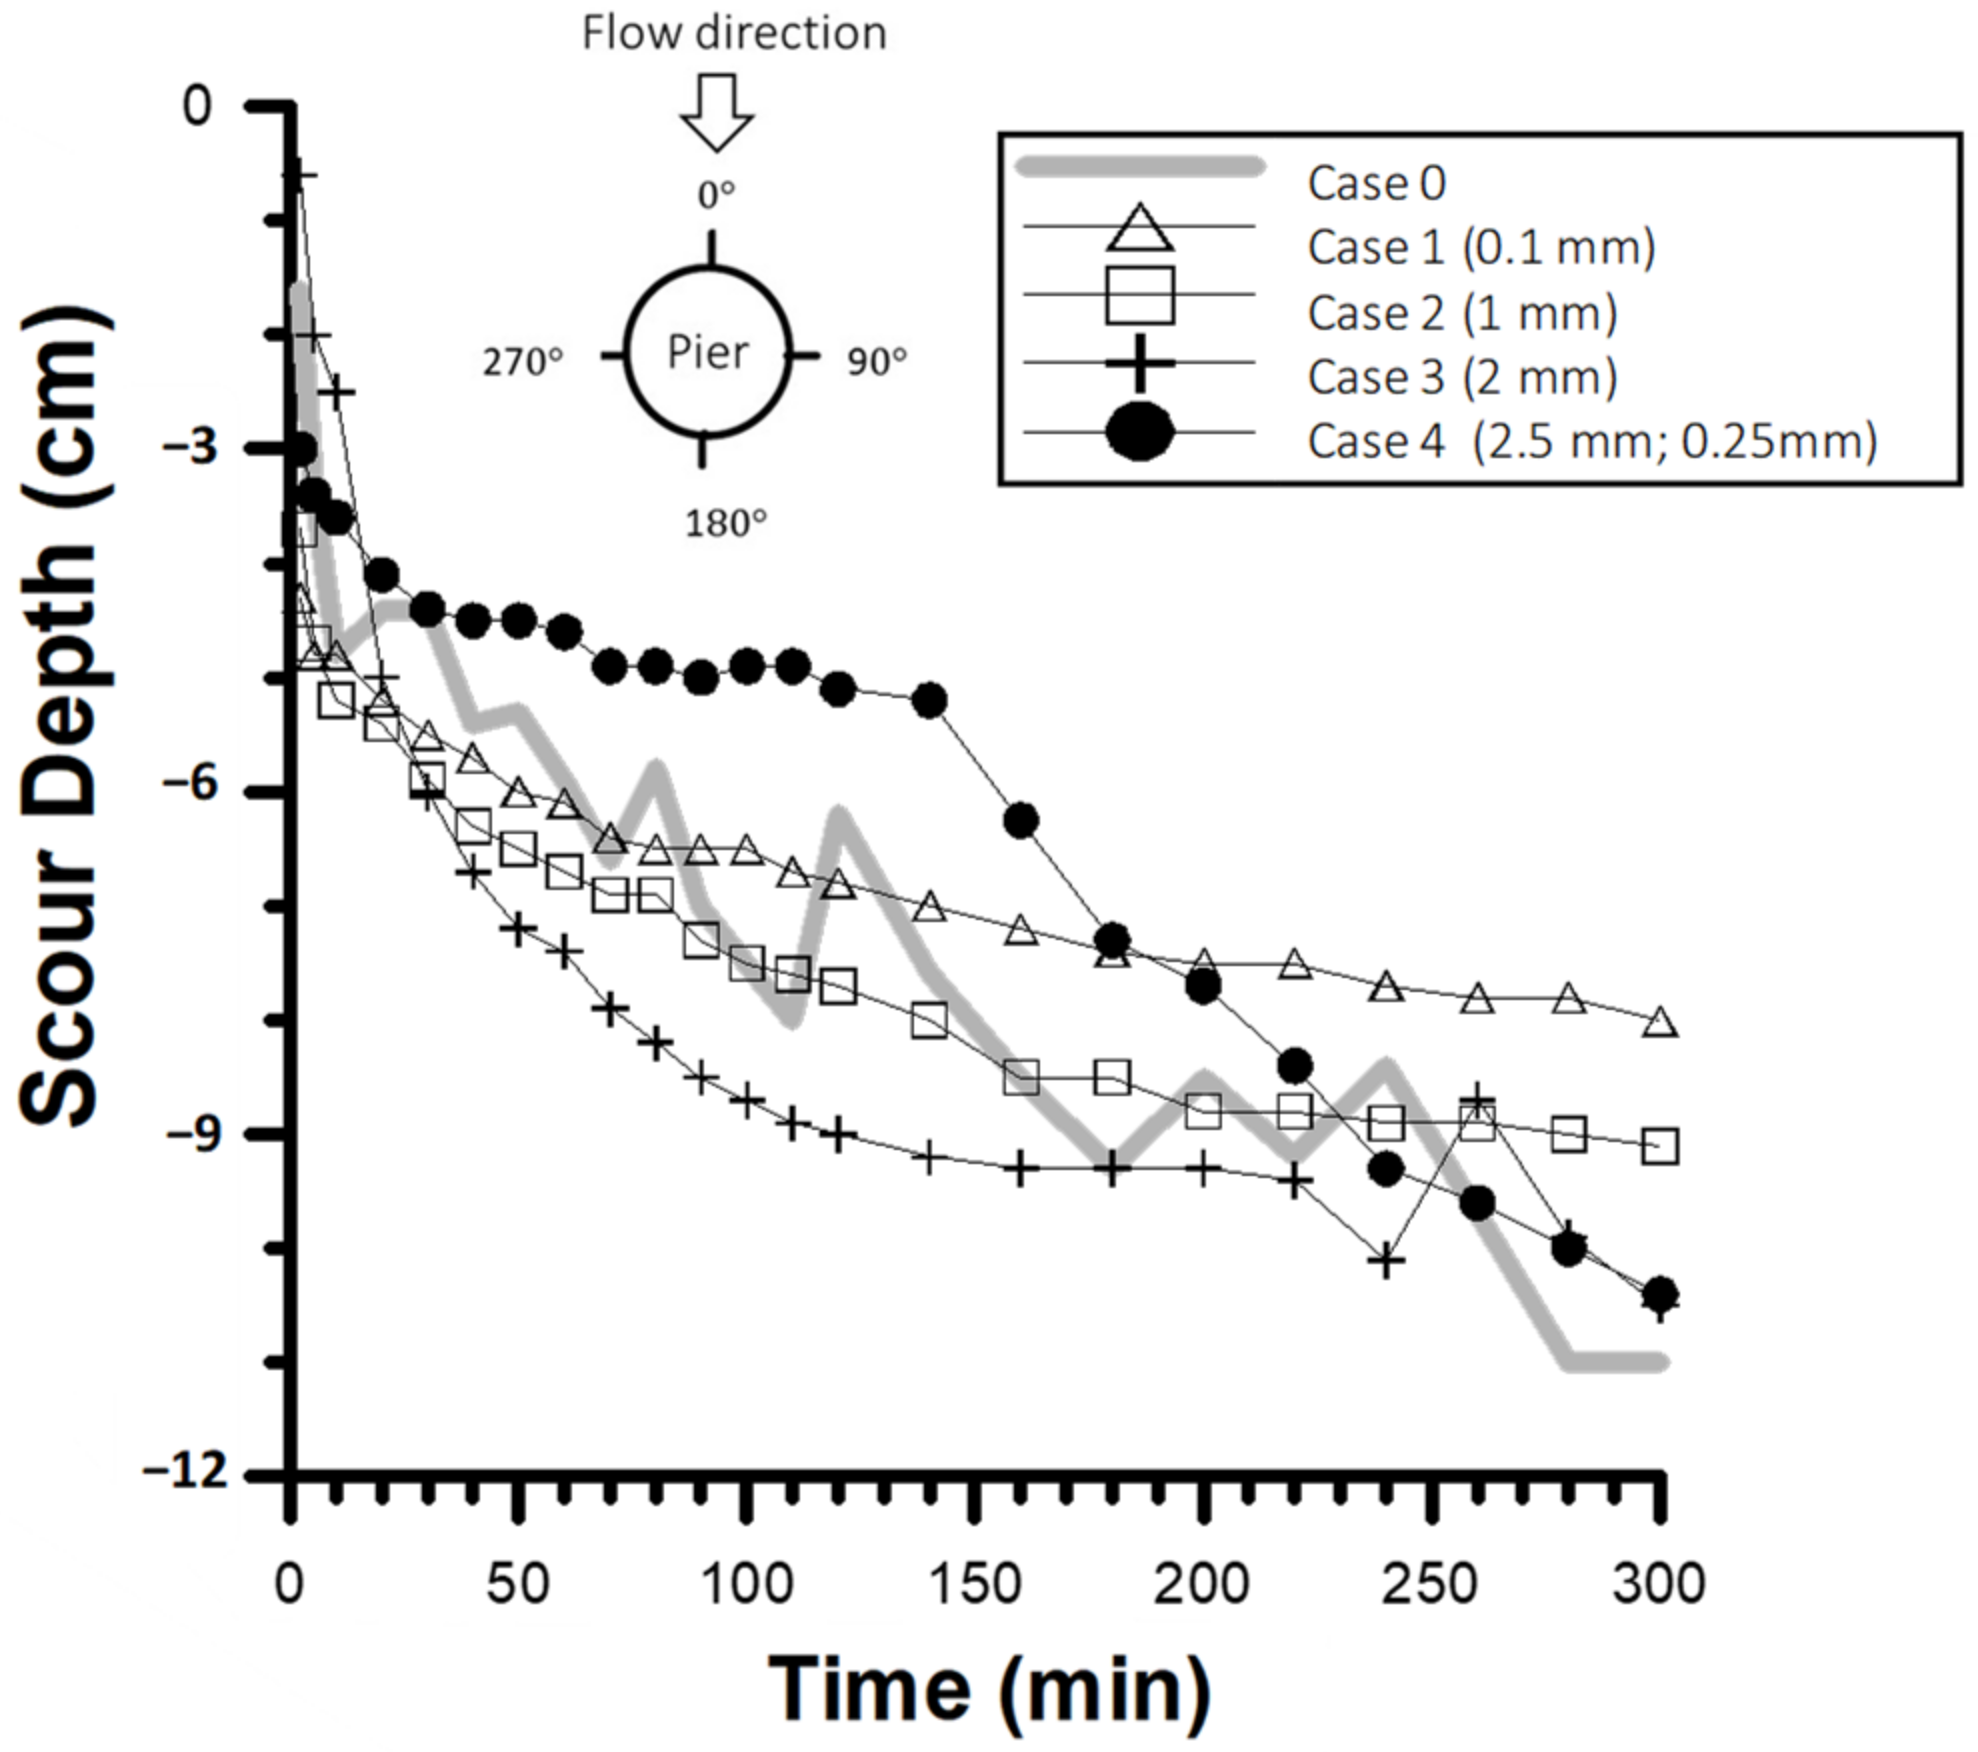
| Maximum scour depth at pier ds (cm) | −11.0 | −8.0 | −9.1 | −10.5 | −10.4 |
| Protective effect of scour depth at pier Ps (%) | -- | 27.3 | 17.3 | 4.6 | 5.5 |
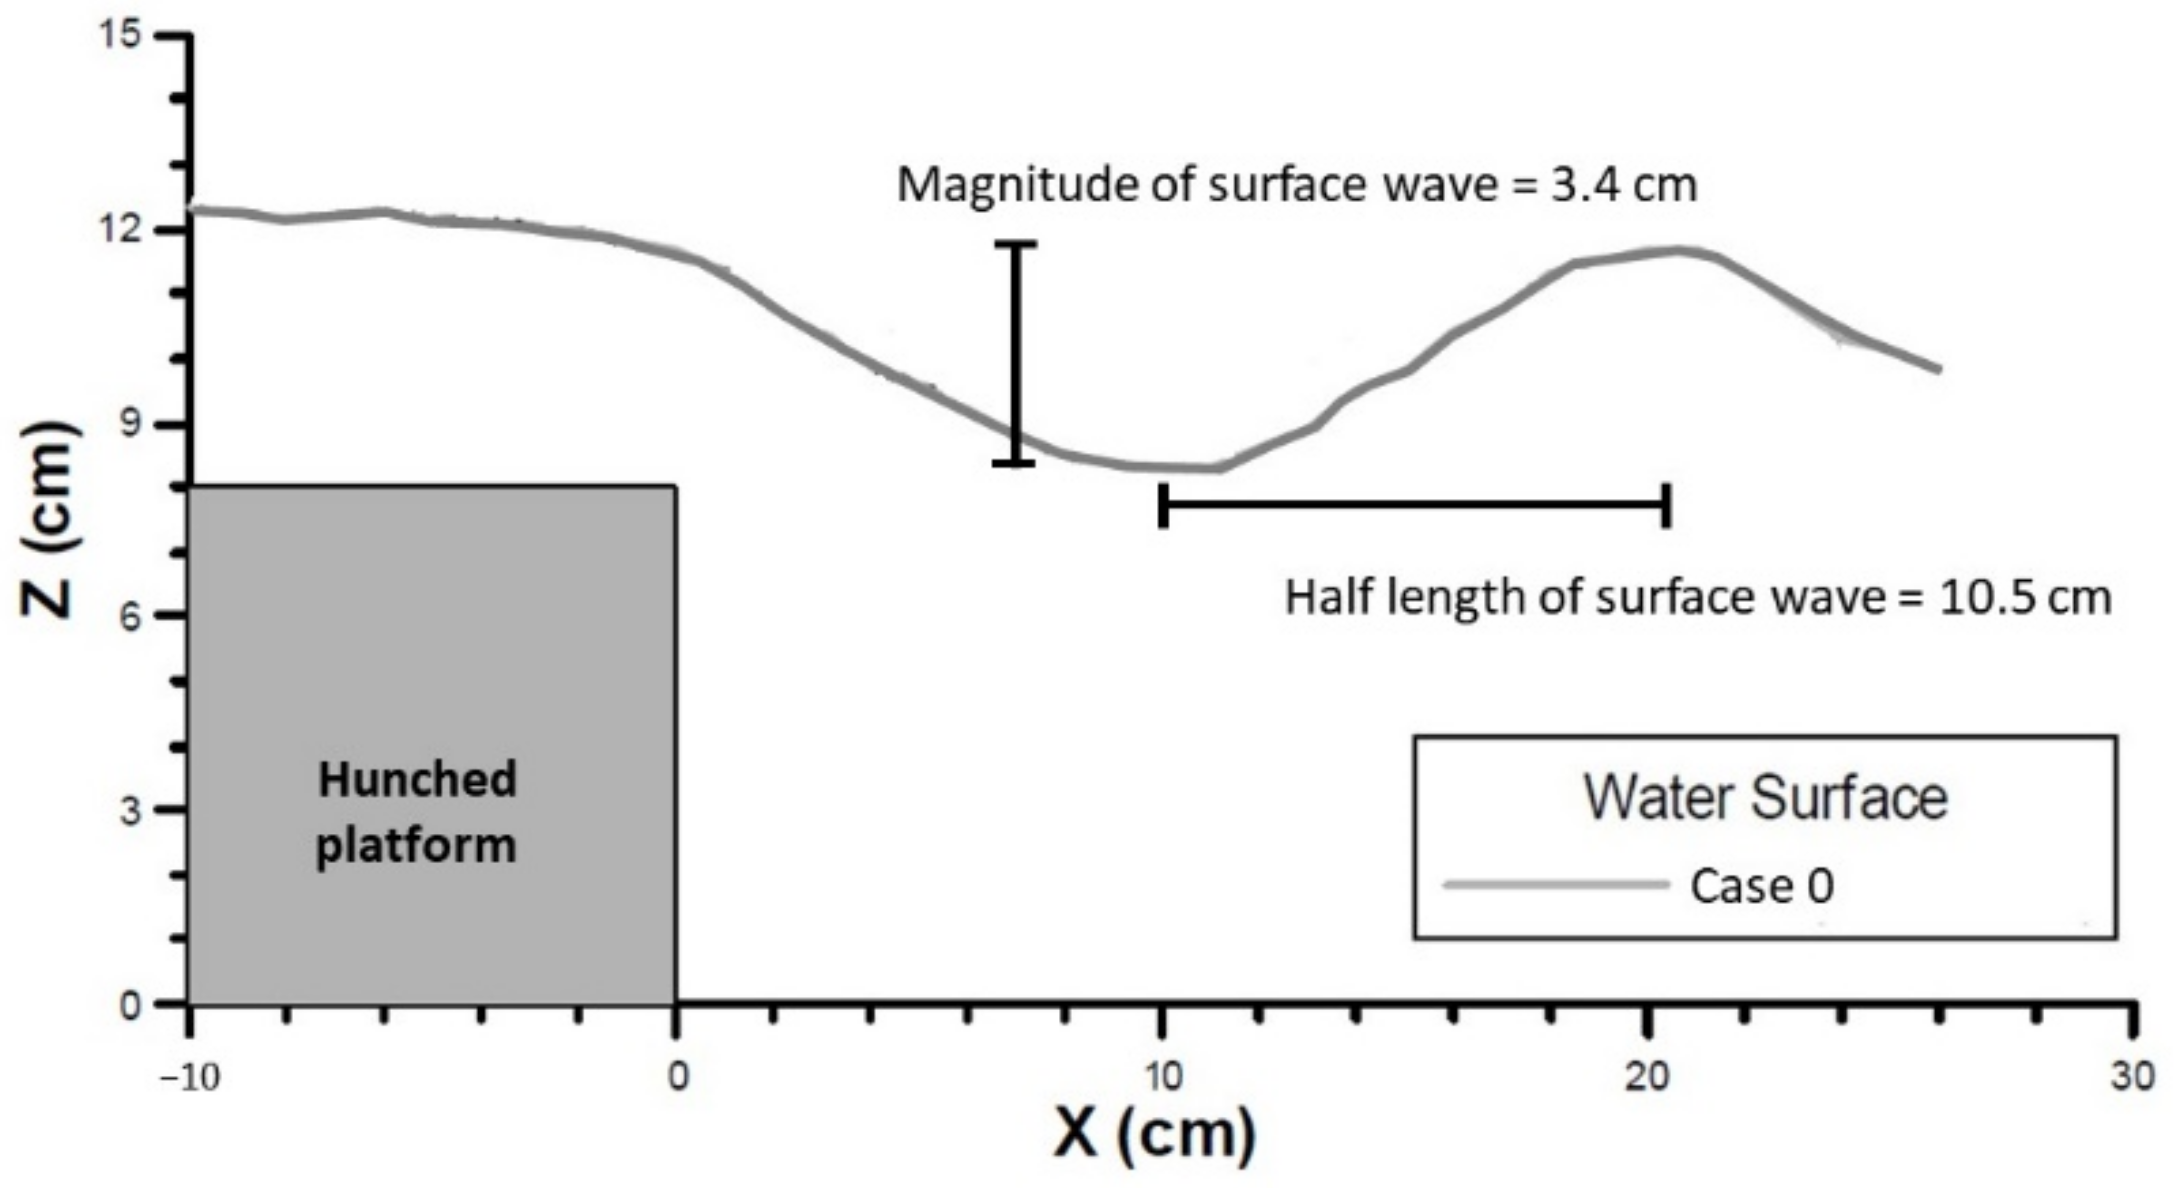
| Half length of surface wave (cm) | 10.5 | 9.5 | 9.5 | 9.0 | 9.0 |
| Protective effect of surface wave’s half length Pl (%) | -- | 9.5 | 9.5 | 14.3 | 13.3 |
| Magnitude of surface wave (cm) | 3.4 | 2.1 | 2.7 | 2.4 | 3.4 |
| Protective effect of surface wave’s magnitude Pm (%) | -- | 38.2 | 20.6 | 29.4 | 0 |
| Group | Case 0 | Case 2 | Case 5 | Case 6 | Case 7 |
|---|---|---|---|---|---|
| Length of strip (cm) | N/A | 25 | 37.5 | 50 | 75 |
| Flexibility index Fi | 46 | 46 | 46 | 46 | |
| Flexibility parameter Fp | 6.1 | 9.2 | 12.2 | 18.3 | |
| Maximum scour depth at pier ds (cm) | −11.0 | −9.1 | −7.3 | −7.1 | −6.0 |
| Protective effect of scour depth at pier Ps (%) | -- | 17.3 | 33.6 | 35.5 | 45.5 |
| Half length of surface wave (cm) | 10.5 | 9.5 | 13.5 | 11.5 | 11.0 |
| Protective effect of surface wave’s half length Pl (%) | -- | 9.5 | −28.6 | −9.5 | −4.8 |
| Magnitude of surface wave (cm) | 3.4 | 2.7 | 2.4 | 2.1 | 1.7 |
| Protective effect of surface wave’s magnitude Pm (%) | -- | 20.6 | 29.4 | 38.2 | 50 |
Publisher’s Note: MDPI stays neutral with regard to jurisdictional claims in published maps and institutional affiliations. |
© 2022 by the authors. Licensee MDPI, Basel, Switzerland. This article is an open access article distributed under the terms and conditions of the Creative Commons Attribution (CC BY) license (https://creativecommons.org/licenses/by/4.0/).
Share and Cite
Lee, W.-L.; Lu, C.-W.; Huang, C.-K. Near-Nature Ecological Technique for Pier Scour Countermeasure in a Submerged Overfall. Appl. Sci. 2022, 12, 6367. https://doi.org/10.3390/app12136367
Lee W-L, Lu C-W, Huang C-K. Near-Nature Ecological Technique for Pier Scour Countermeasure in a Submerged Overfall. Applied Sciences. 2022; 12(13):6367. https://doi.org/10.3390/app12136367
Chicago/Turabian StyleLee, Wei-Lin, Chih-Wei Lu, and Chin-Kun Huang. 2022. "Near-Nature Ecological Technique for Pier Scour Countermeasure in a Submerged Overfall" Applied Sciences 12, no. 13: 6367. https://doi.org/10.3390/app12136367