Article

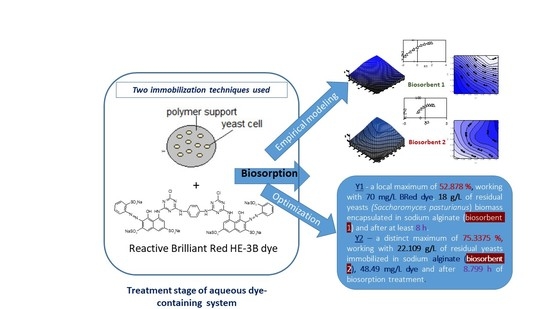
Empirical Modeling and Optimization by Active Central Composite Rotatable Design: Brilliant Red HE-3B Dye Biosorption onto Residual Yeast Biomass-Based Biosorbents

1
Department of Environmental Engineering and Management, “Cristofor Simionescu” Faculty of Chemical Engineering and Environmental Protection, “Gheorghe Asachi” Technical University of Iasi-Romania, No. 73A, 700050 Iasi, Romania
2
Department of Organic, Biochemical and Food Engineering, “Cristofor Simionescu” Faculty of Chemical Engineering and Environmental Protection, “Gheorghe Asachi” Technical University of Iasi-Romania, No. 73A, 700050 Iasi, Romania
*
Authors to whom correspondence should be addressed.
Appl. Sci. 2022, 12(13), 6377; https://doi.org/10.3390/app12136377
Submission received: 8 June 2022 / Revised: 18 June 2022 / Accepted: 20 June 2022 / Published: 23 June 2022
(This article belongs to the Special Issue Pollution Control Chemistry II)

Abstract

:

Featured Application

An empirical model using an active central composite rotatable design of 23 order was studied, and the optimum values of all variables involved in the mathematical model were found by classical optimization method for obtaining the maximum removal of reactive Brilliant Red HE-3B dye onto residual Saccharomyces pastorianus yeast biomass encapsulated and/or immobilized in sodium alginate.

Abstract

(1) Introduction: Natural polymers can be successfully used as a matrix to immobilize residual yeast-based biomass in a form that is easy to handle and can be used as biosorbent capable of removing persistent polluting species from different aqueous systems such as reactive azo dyes. (2) Experimental: Two types of new biosorbents were prepared based on residual Saccharomyces pastorianus yeast biomass immobilized in sodium alginate (using two different practice techniques) and studied in the biosorption process of reactive Brilliant Red HE-3B dye using certain experimental planning matrices according to the active central composite rotatable design of 23 order. The experimental data obtained under certain selected working conditions were processed considering the influence of three independent variables (biosorbent concentration—X1, initial dye concentration—X2 and biosorption time—X3) onto the dependent variable (Y = f(X1,X2,X3)) expressing the performance of reactive dye biosorption onto the new prepared biosorbents (i.e., dye removal degree, %). (3) Results: Two mathematical models were proposed for each prepared biosorbent. The maximum dye removal was 52.878% (Y1) when 18 g/L biosorbent 1 (micro-encapsulated form) was applied in 70 mg/L dye-containing solution for at least 8 h, and 75.338% (Y2) for 22.109 g/L biosorbent 2 (immobilized form) in 48.49 mg/L dye-containing solution for at least 8.799 h. (4) Discussion: The optimal values achieved for the two tested biosorbents were compared, and we investigated the possibility of using this residual biomass as a biosorbent for the reactive dye removal, supported by the experimental results with the recommended variation domains of each influencing variable. The results are sufficient to permit performing dye removal higher than 50% (biosorbent 1) or 70% (biosorbent 2), working with more than 18–22 g/L biosorbent after at least 8 h (as an exchange at work). (5) Conclusions: The proposed models are in good agreement with the experimental data and permit the prediction of dye biosorption behavior onto the experimental variation domain of each independent variable.

Graphical Abstract

1. Introduction

Among the new biotechnologies for environmental protection, biosorption remains an open subject for researchers and specialists in the field. Biosorption is based on a process of retaining persistent chemical pollutants on biological or natural materials as biosorbents. It is a method achieved through extracellular and intracellular bonding, interactions that depend on the nature of organic compound, on the structure of adsorptive materials, on microbial metabolism and on transport process. Similar to the biodegradation of organic compounds, biosorption sometimes implies the breakage and formation of new chemical bonds, which degrades the origin molecular structure of the pollutants [1,2,3,4,5].
Experimental research shows the expansion of a new category of biosorbents with a fairly high efficiency in the process of retaining/removing persistent chemical pollutants. This relates to capitalizing/valorization of residual biomass, including microbial biomass, industrial and agricultural biomass (wood waste, fruit, plants or shells, which contain cellulose, hemicellulose, pectin and lignin), in free form [5,6,7]. In order to improve the ease of handling of residual microbial biomass, it has been immobilized by various techniques (especially two practice techniques, i.e., encapsulation and immobilization) in polysaccharide matrices [7,8,9].
Transposing the process from the laboratory scale to the real world, industrial systems require studies of the sorption equilibrium, thermodynamic and process kinetics, and the application of optimization models and algorithms, in order to obtain adequate mathematical models for further technological and mathematical optimization [8].
Brilliant Red HE-3B is a reactive dye and its biosorption from wastewater resulting from the process of dyeing textiles, by using a residual Saccharomyces pastorianus yeast (available at large scale, easy and safe to use) immobilized in sodium alginate (using two different practice techniques) as biosorbent has been analyzed and reported, as corresponding to a maximum biosorption capacity of around 224.47–555.55 mg/g [10,11]. The process is influenced by some operating factors: temperature, pH, S/L phases contact time (biosorption time period), biosorbent and adsorbate concentration and other particular characteristics such as the diameters of the biosorbent granules depending on the immobilization techniques used. In order to select the best operating process conditions, a modeling and optimization procedure is beneficial, as it could provide the scientific basis for biosorption scaling-up.
The validated biosorption process of the studied reactive dye onto immobilized residual biomass is mathematically modelled considering some specific variation domains of three important independent variables with significant influence on the biosorption efficiency, i.e., biosorbent concentration, dye concentration and biosorption contact time. In this sense, different experimental modeling design methods can be applied for empirical modeling, but we selected an active central composite rotatable design of 23 order in association with the maximum finding by the classical optimization methodology. The optimum values performed for two new prepared biosorbents were compared, and the possibility was investigated of using the residual encapsulated and/or immobilized biomass as biosorbent for the studied reference reactive dye sustained with the performed experimental results.
The main goal of this paper is to propose pertinent mathematical empirical models for the biosorption process of reactive Brilliant Red HE-3B dye onto the two new prepared biosorbents based on residual biomass of Saccharomyces pastorianus immobilized/encapsulated in sodium alginate. To this purpose, the biosorption will be studied according to the specific experiments’ planning design, by analyzing the experimental data related to three important influencing variables and dye biosorption performance, and also considering the reported analysis of specific adsorption isotherms, and thermodynamic and kinetic models in association with the predicted biosorption mechanism and its controlling rate [9,10]. Moreover, the prepared biosorbent material was commonly physico-chemically characterized before and after the biosorption process of the reactive Brilliant Red HE-3B dye to demonstrate that dye biosorption takes place and to underline the biosorption progress and efficiency. These experimental data were already reported in previous authors’ articles [10,11].
For the modeling of experimental data a well-known design was used, based on an active empirical design applied in numerous scientific reports [12,13,14,15,16,17,18,19,20,21]. This mathematical model is obviously required for each technological process to estimate the final result, if some variations of operating parameters take place, and to anticipate the best value when multiple operating variables are considered, or to remediate some technical operating problems in order to maintain acceptable process results.

2. Materials and Methods

2.1. Materials

Biomass. In the brewing processes, a few by-products are formed, which are available in large amounts, e.g., residual Saccharomyces pastorianus yeasts (Saccharomycetaceae family) [11]. We tested the residual Saccharomyces pastorianus biomass at the finishing of brewing process organized at an industrial company (Albrau, Onești, Romania). The residual yeast-based biomass was separated by centrifugation (8000 rpm), dried at 80 °C and then immobilized in sodium alginate (using two different practice techniques) [10,11].
Biosorbent. The two biosorbent types used in the experimental biosorption studies are based on the immobilization of residual biomass (Saccharomyces pastorianus) in sodium alginate, using two techniques: (1) a Buchi microencapsulator technique application (encapsulation for preparation of biosorbent 1) and (2) a simple dropping technique application (immobilization for preparation of biosorbent 2) following the methodologies presented in our previous paper [10,11].
Adsorbate. A reactive dye, Brilliant Red HE-3B (BRed) (MW = 1430 g/mol, λmax = 530 nm, from Bezema) with chemical structure showed in Figure 1, is selected as chemical polluting species (reference model of reactive dye) of aqueous system for this study.
It was used the commercial form of reactive dye (powder) for preparation of a stock dye solution (500 mg dye/L) and further of the working solutions by adequate dilution of stock solution with distilled water.

2.2. Experimental Methods

2.2.1. Batch Biosorption Method

The biosorption experiments were developed after the contact of an established amounts of new prepared biosorbent (biosorbent 1—by micro-encapsulation, and biosorbent 2—by a simple dropping technique, in sodium alginate of the residual biomass of Saccharomyces pastorianus (5% dry matter (d.w.), after the traces of calcium chloride were removed by washing with distilled water) with 25 mL of dye solution with different initial concentrations (in the range 10.88–174.08 mg/L for biosorbent 1, and 10.64–170.24 mg/L for biosorbent 2). The pH values were adjusted with 0.1N HCl solution at the value of pH = 3 (measured with waterproof Combo pH/EC/TDS Testers, Hanna Instruments Inc.) for the BRed dye biosorption (highest adsorption capacities were preliminarily obtained at pH 3) [10,11]. The working temperature (kept constant) was that of the room environment, around 25 °C, and the contact time of the phases was varied by no more than 10 h. The remaining dye concentration in the aqueous solution was determined using the spectrophotometer-based method at the maximum dye wavelength of 530 nm, using the MeterTech SP-830 Plus spectrophotometer (MeterTech Inc., version 1.06). The values of dye removal (R, or Y, (%)), or biosorption efficiency (q, (mg/g)) were calculated with the Equations (1a) and (1b):
R   ( o r   Y ) = C 0 C t C 0 100
q = C 0 C G V
where C0 and Ct—the initial and remaining dye (at t biosorption time) concentration in the aqueous solution (mg/L), G—the biosorbent amount (g) and V—the aqueous solution volume (L).

2.2.2. Empirical Modeling and Optimization of Biosorption Process

In all biosorption experiments of BRed reactive dye onto residual biomass (immobilized in sodium alginate), the independent variables were considered to be the following: the biosorbent concentration (Z1, (g/L)), BRed dye concentration (Z2, (mg/L)) and biosorption contact time (Z3, (h)). As the decision/response function (dependent variable), also considered as an optimization criterion, the dye removal was chosen (Y, or R, (%)). The mathematical biosorption model was proposed by application of the empirical modeling using an active central composite rotatable design of 23 order which is based on specific experimental planning matrices with imposed values for all coded variables (Xi).
The proposed mathematical model was of “b = 3” independent variables, which was found after the experimental biosorption testing according to the specific experimental planning matrix, and is expressed by the Equation (2) [12,13,14,15,16,17,18,19,20,21].
Y = b0 + ∑bixi + ∑biixi2 + ∑bijxixj
where Y represents the decision/response function, or optimization criterion; xi, xj, xii, xij—the coded independent variables of the biosorption-based treatment system, and b0, bi, bj, bij—the model coefficients (i, j = 1, 2, 3).
The model coefficients were calculated using statistical analysis based on the least square fitting model obtained in the experimental design points [12,13,14,21]. In all biosorption experiments values (levels) were attributed to each independent variable Zi, in accordance with its basic value (Zi0) and imposed variation step (ΔZi0) corresponding to the coded variable values (Xi = 0, ±1, or α = ±1.682). The Fisher constant (F), multiple correlation coefficient (RYx1x2x3), or Fisher test (FC), defined by well-known statistic relations, were calculated for establishment of the correlation between the decision/response function (Y) and the three coded independent variables (Xi) as in the relation 2 [12,13,14]. The dispersion of all experiments and coefficients were also statistically evaluated. The mean deviation between the calculated and experimental data must be in the range of −10% and +10% for a very good accordance.
The model validation was carried out by an appropriate analysis of variance, consisting of: (1) the calculation of the F constant and its comparison with the statistical value to underline the significance of all independent variable vs. experimental errors; (2) the calculation of the RYx1x2x3 to establish the correlation between the dependent variable (Y) and the three independent variables (Xi) as a whole; (3) the determination of the coefficient’s significance using the Student t-test, for a certain significance level (p = 0.05) and degrees of freedom (ν1 = n − 1 = 19 and ν2= k − 1) [12,13,14,21]; (4) the calculation of Fc value to compare with its statistical value; and (5) the calculation of mean/ average deviation (A) between the model-calculated data and the experimental ones (for a very good data agreement, A must be between +10% and −10%).
The mathematical model optimization was permitted by classical method application for finding the maximum of response function/optimization criterion, Y* = f(X1*,X2*,X3*). In this sense, the optimization method consists of the finding of the optimum values of all independent variables related to maximum value of the dependent response function/optimization criterion (Y*, %), i.e., the maximum dye removal by biosorption onto residual biomass, meaning the corresponding values of X1*z1*, X2*z2*, X3*z3*. Graphical representations (3D surface and 2D contour) of response function (Y) variation vs. two or one independent variables (Xi) (all other variables considered at their basic values) were illustrated using WinSurf and Excel programs.

3. Results

3.1. Biosorption Process Performance

The principal influencing factors of reactive Brilliant Red-HEB 3B dye biosorption onto residual biomass of Saccharomyces pastorianus immobilized in sodium alginate by using a Buchi micro-encapsulator (with biosorbent 1) and/or by a simple dropping technique (with biosorbent 2) were studied and reported related to the significant dye removal efficiencies and highest dye biosorption capacities (i.e., q > 80–220 mg of dye/g biosorbent in the case of simple dropping technique, or 312.5–2500 mg dye/g biosorbent in the case of encapsulation with Buchi micro-encapsulator) [10,11]. For the best experimental biosorption results, the operating conditions that must be considered are as follows: pH 3, temperature of 25–30 °C with a biosorbent concentration of minimum 2.60 g/L or 3.2 g/L (with 5% d.w.) according to the diameter of the biosorbent granules (in this case, 4 mm for biosorbent granules obtained by a simple dropping technique, and 1500 μm for biosorbent granules obtained by using a Buchi micro-encapsulator), and an S/L phases contact time for biosorption of at least 7.4 h or 12 h at a dye concentration in the aqueous solution of 10.64–170.24 mg/L and 16.88–174.08 mg/L, respectively [10,11]. All biosorption experiments were performed according to the experimental planning matrix (of the active central compositional rotatable design of 23 order).
In our previous papers, it was concluded that the mechanism of biosorption process, referring the biosorption energy value (E) (8.28–11.23 KJ/mol) (biosorbent 1) [11] and (8.45–13.61 KJ/mol) (biosorbent 2) [10], is based on physical bonding established between the positively charged surface of the biosorbent and the functional groups of reactive Red Brilliant HE-3B dye.
A few new experimental data of studied dye biosorption in a static working regime were selected in Figure 2 after the S/L phases contact period of 24 h (biosorption equilibrium attained) but the reference experimental data were reported in our previous works, in which it was demonstrated by advanced analytical analysis (SEM, FTIR-EDX) that the dye was retained in the molecular structure of both biosorbents [10,11]. In the present modeling and optimization study, the dye biosorption was evaluated at pH 3 for a period of no more than 10 h, referring to the biosorption capacity and efficiency in retaining of reactive BRed dye onto residual immobilized biomass.
High BRed dye biosorption capacities were performed for dye concentrations more than 75 mg/L, i.e., >130.56 mg/L for biosorbent 1 (3.2 g/L of biosorbent) and >127.68 mg/L for biosorbent 2 (2.60 g/L of biosorbent). The highest dye biosorption capacity was performed at the highest dye concentration of around 130 mg/L of BRed dye (Figure 2a), i.e., a dye biosorption capacity of around 83.275 mg/g for biosorbent 1 and around 213.870 mg/g for biosorbent 2.
As shown in Figure 2b, for the initial dye concentration of 31.95 mg/L, the dye biosorption capacity varied in the range of around 29.23–33.06 mg/g working with biosorbent 1 and 19.505–35.313 mg/g working with biosorbent 2, considering the biosorbent amount of 0.00285–0.00915 g d.w. (d.w.—dry mass of biosorbent per 25 mL of dye solution), corresponding to a biosorbent concentration of 2.4–3.2 g/L.
Better results were performed for higher reactive BRed dye concentration in the aqueous system (>45–50 mg/L) working with the biosorbent concentration of more than 12 g/L in the same operating conditions of pH 3 and T = 20–30 °C (causing the residual biomass degradation to be easily controllable).

3.2. Empirical Experimental Modeling

The basic values, real (Zi0) and coded (Xi0) values, for the three tested independent variables of the reactive dye biosorption process onto the two prepared biosorbents (encapsulated and/ or immobilized yeast biomass in sodium alginate) are presented in Table 1, in association with their variation steps (∆Zi0).
The reactive dye solution samples of 25 mL were contacted with different amounts of residual immobilized biomass at adequate pH (pH = 3), room temperature (25 °C), under initial continuous stirring (30 rpm) of 1–3 min, and analyzed after a specific biosorption time (t, (h)) of static biosorption for finding the dye removal efficiency/performance, based on the experimental planning design presented in Table 1.
The proposed mathematical models for reactive BRed dye biosorption onto residual encapsulated yeast biomass (biosorbent 1) (Y1) and residual immobilized yeast biomass (biosorbent 2) (Y2) are as follows:
Y1 = 27.3415 + 7.008X1 + 8.5806X3 − 1.4085X12 + 1.0799X22 + 0.6971X32 − 0.7284X1X2 + 2.7969X1X3 +
1.8257X2X3
Y2 = 60.6002 + 9.3796X1 + 5.6881X2 + 10.1079X3 − 3.3381X12 − 6.461X22 − 4.5396X32 + 1.3353X1X3 − 4.6628X2X3
without X2 term (specifically, the term of ‘+0.0772X2’) in relation (3) and without X1X2 term (term of “+0.1548X1X2”) in relation (4) found as insignificant after the application and results analysis of the Student’s t-test. The model coefficients were calculated with the well known statistical formula reported in other authors’ reports [11,12,13].
The correlation between the experimental and modelled data is presented in Table 2 for BRed dye biosorption onto biosorbent 1 and Table 3 for Bred dye biosorption onto biosorbent 2.
Mathematical model analysis. The value of Fisher constant is found to be F = 9269 for Y1 (BRed dye removal onto biosorbent 1) and, respectively, F = 2438 for Y2 (Bred dye removal onto biosorbent 2), and the statistic value (from table) is Ftab = 4.60 (for α = 99, ν1 = n − 1 = 19, ν2 = b − 1 = 2, where n is the number of experiments (n = 20), and b is the number of independent variables (b = 3)). This is because both values of F > Ftab, the deviation of experimental data (Yei) referring to the average experimental value ( Y e i ¯ ), are due to the influence of independent variables towards the decision/response function, not of the experimental errors.
The value of the multiple correlation coefficient is found to be RYX1X2X3 = 0.9257 for Y1 (BRed dye removal onto biosorbent 1) and RYX1X2X3 = 0.9232 for Y2 (Bred dye removal onto biosorbent 2) closed to the unity; thus, the high importance of all independent variables (Xi) is demonstrated in the variation of decision/response function (Bred dye removal) for the experimental variation field of each variable Zi or coded Xi.
The calculated Fisher test value is FC = 31.92545 for Y1 (BRed dye removal onto biosorbent 1) and FC = 30.7766 for Y2 (BRed dye removal onto biosorbent 2) which was much higher than the statistical value (from table) of FC,tab = 6.59 for the freedom degree of ν = n-k − 1 = 16 and ν = k=3, demonstrating that the independent variables had a significant influence on the decision/response function (dye biosorption efficiency). Moreover, for these proposed mathematical models, the experimental dispersion was 27.5943 for Y1 and 25.5418 for Y2, and the coefficients dispersion was 0.2027 for Y1 and 0.0652 for Y2.
The processed data indicate an acceptable accordance between the experimental and model-calculated data, the mean/average deviation being of −2.081% for Y1 and −2.414% for Y2, both in the admissible limit range of −10% ÷ +10%. From the experimental planning matrices (Table 2 and Table 3), it seems that for the selected experimental variation field of all independent variables exists a local maximum value (Y* = 52.878%) for Y1 and a local maximum (Y* = 74.184%) for Y2, corresponding to X1* = +1.0, X2* = +1.0 and X3* = +1.0 for both functions (Y1/Y2), and to a residual encapsulated yeast biomass concentration of 18 g/L (0.45 g per 25 mL), and, respectively, a residual immobilized yeast-based biomass concentration of 18 g/L (0.45 g per 25 mL), a BRed dye concentration of 70 mg/L, and a S/W contact time for biosorption of 8 h.
The analysis of the response functions (Y1 and Y2) indicate that all Xi independent variables (residual encapsulated or immobilized yeast biomass concentration, dye concentration and biosorption contact time of S/L phases) have an important influence on the reactive Bred dye removal efficiency, a fact which is demonstrated by the values of X1, X2 and X3 coefficients much higher than unity, except in the case of biosorbent 1 (residual yeasts encapsulated biomass) for which the BRed dye concentration (X2) had an insignificant effect in the experimental X2 variation field (19–170 mgL) toward dye biosorption efficiency.
The influence of the X3 variable (S/L phases contact time for biosorption) in Y1 response function is quite similar to that of X1 (biosorbent concentration) (i.e., X3 influence is 1.2244 times higher than that of X1) for the BRed dye removal (Y1 decision function), and its effects are similar (e.g., the biosorbent concentration (X1) increasing and the S/L contact time (X3) increasing in the biosorption process increases the dye removal efficiency, Y1).
The influence of X3 variable (S/L phases contact time for biosorption) in Y2 response function is almost two times (exactly ≅ 1.78) higher than that of X2 (BRed reactive dye concentration), and quite similar to that of X1 (biosorbent concentration) (i.e., X3 influence is of 1.078 times higher than of X1) for the BRed dye removal (Y2 optimization criterion, or response/decision function), and its effects are similar (e.g., the biosorbent concentration (X1) increasing and the S/L contact time (X3) increasing in the biosorption process increases the dye removal efficiency, Y2), except for X2 and X3 which had the opposite effects (negative sign), meaning that the biosorption time increasing (X3) and decrease in the dye concentration (X2) increases the dye removal degree (Y2). Thus, it was recommended to work in the biosorption with a dye concentration in range of 45–50 mg/L.

3.3. Optimization of the Proposed Mathematical Models

The application of classical optimization method for finding the maximum of the response function/proposed optimization criterion, i.e., Y* = f(X1*,X2*,X3*), consists of the solving of specific equations’ systems with first- and second-order derivates equalized with zero.
The result for Y1 response/decision function optimization leads us to the conclusion that the Y1* response function (maximum dye removal by biosorption onto biosorbent 1) has no distinct maximum and only a local maximum experimentally found as corresponding to X1* = +1.00, X2* = +1.00 and X3* = +1.00, meaning a dye removal of 52.878%, working at least 8 h with 70 mg/L BRed dye and 18 g/L of biosorbent 1.
In the case of Y2 function optimization, the result leads to the conclusion that the Y2* function (maximum dye removal by biosorption onto biosorbent 2) has a distinct maximum (Y = 75.3375%), corresponding to the following values of three independent values: X1* = +1.6849, X2* = −0.0755 and X3* = +1.3999. Transposed to real values, these independent variables for maximum Y2* function correspond to a biosorbent 2 concentration of 22.1094 g/L (0.553 g per 25 mL), a BRed dye concentration of 48.49 mg/L, and a S/L contact time for biosorption of at least 8.80 h.

4. Discussions

Figure 3a–f present the influence of two independent variables (one independent variable kept at the basic value) vs. reactive Bred dye removal (Y1) (i.e., Y = Y1(X1,X2,0), Y = Y1(X1,0,X3) and Y = Y1(0,X2,X3)).
Figure 4a–f illustrate the dependence of reactive dye removal (Y2) vs. two independent variables (one independent variable kept at the basic value) (i.e., Y = Y2(X1,X2,0), Y = Y2(X1,0,X3) and Y = Y2(0,X2,X3)).
The graphical representations of the BRed dye removal (Yi, %) variation in the experimental field of two independent variables (on isolines) in Figure 3 for biosorbent 1 and Figure 4 for biosorbent 2 indicate the following aspects:
(1)
The biosorbent concentration (X1) had one of the highest levels of significance in obtaining a high dye removal degree, with higher values recommended than the basic (X1 > 0) where the local maximum dye removal was no more than 23% for Y1 (Figure 3c,d) and 65% for Y2 (Figure 4a,b);
(2)
High local dye removal (Y) close to the value of 52% for Y1 function and 80% for Y2 function can be performed for an initial dye concentration close to 50 mg/L in the aqueous system studied (Figure 3a,b and Figure 4c,d);
(3)
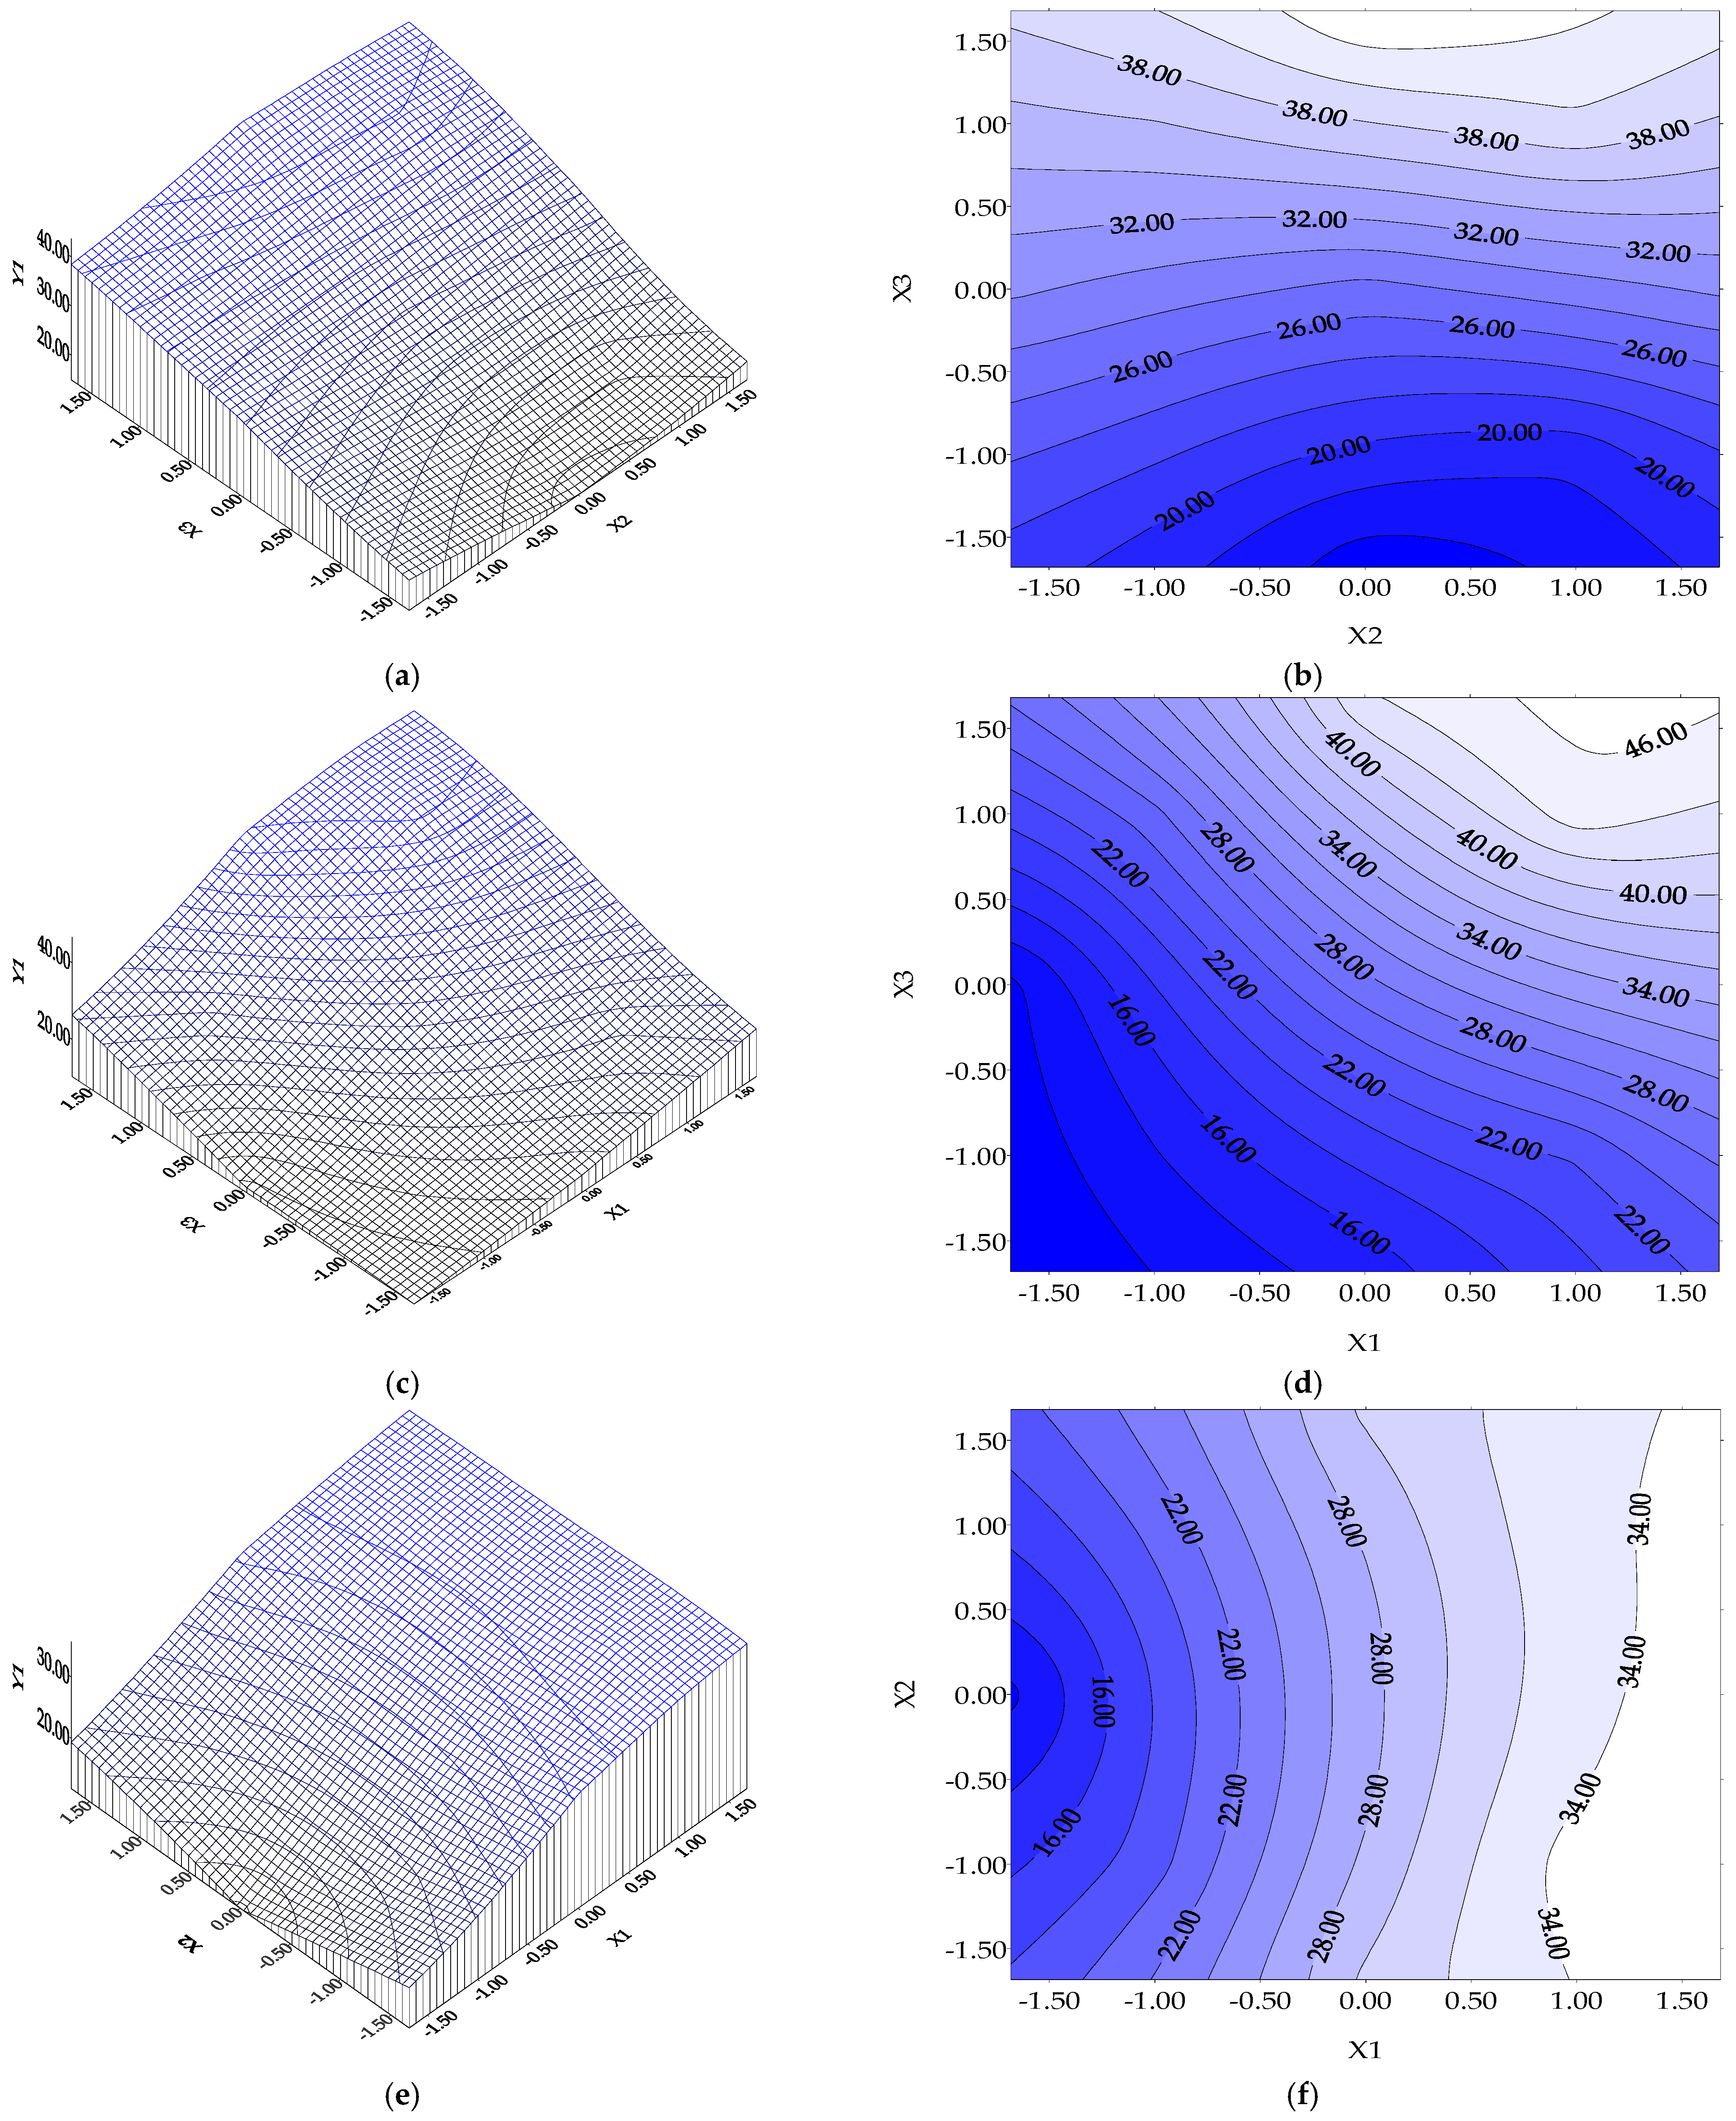
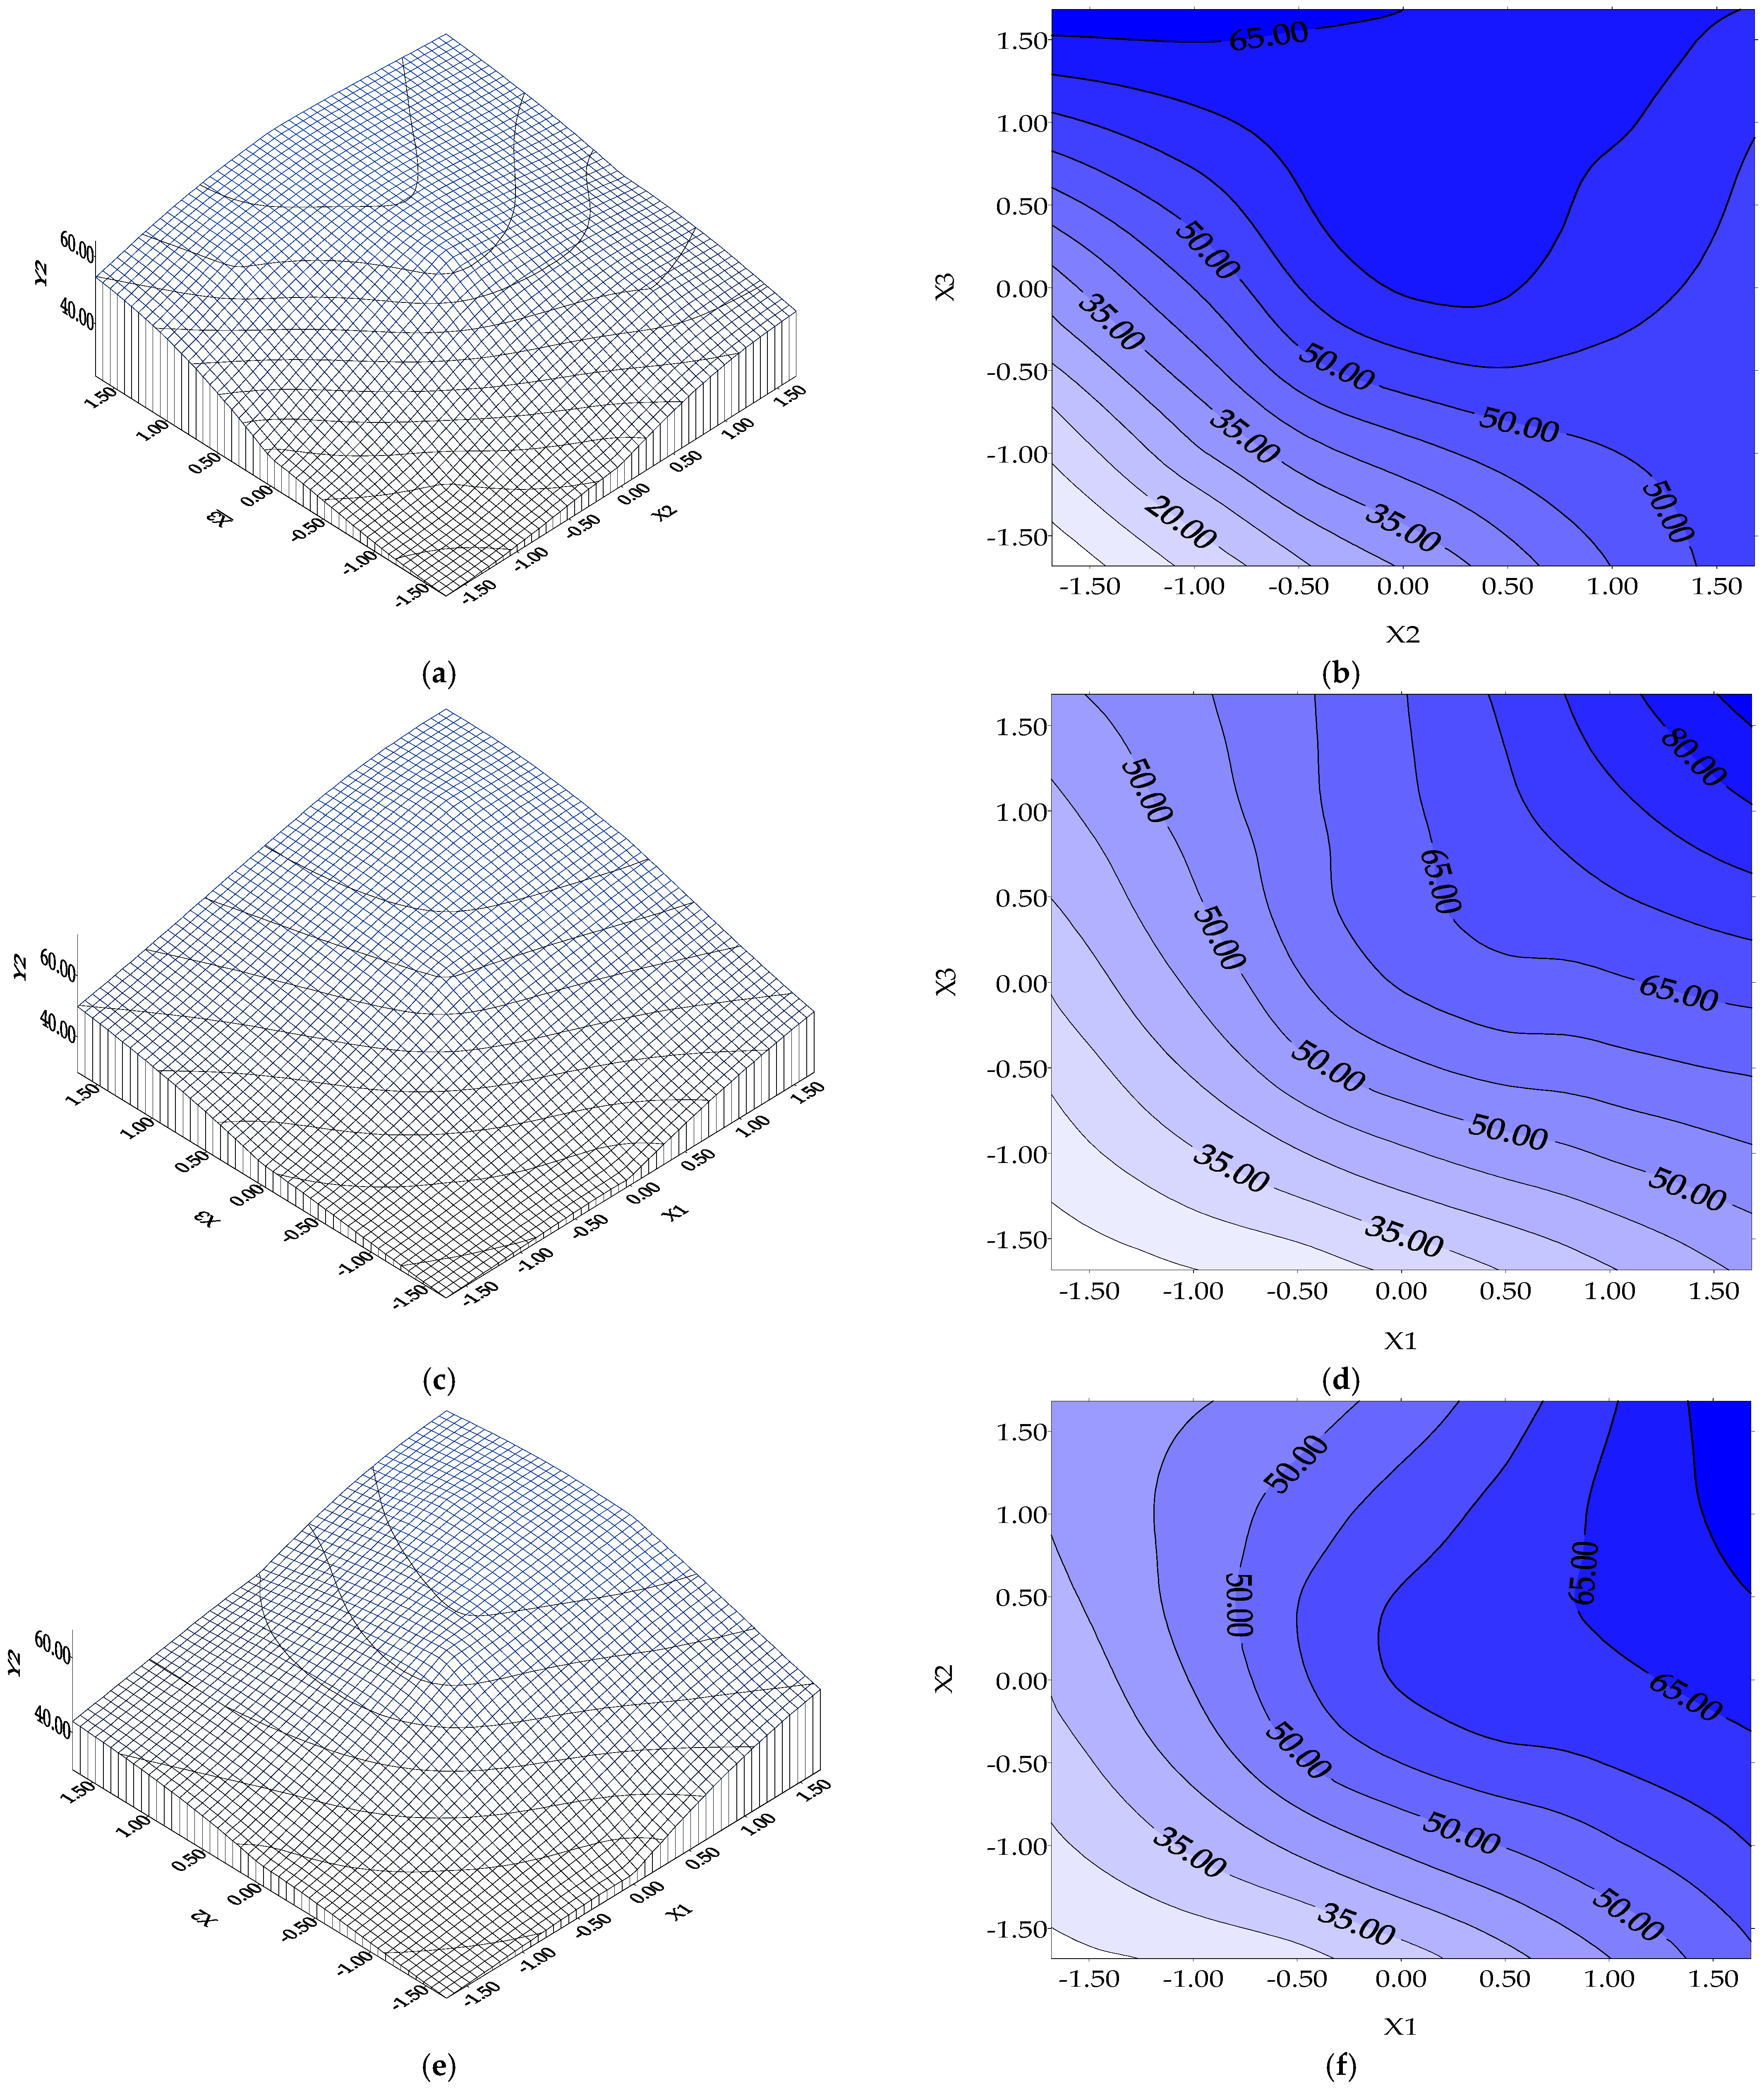
A biosorption time higher than 8 h (as a possible exchange period at work) is beneficial but at least 6 h (basic value of X3) are obligatory for dye removals of at least 35% for Y1 (or > 52.878% experimentally performed, Figure 3e,f) and 50% for Y2, or much more than the obtained experimental value of 72.4868% (Figure 4e,f);
(4)
If the biosorption operating regime is discontinuous, higher values of the dye removal degree will be performed after a S/L contact time greater than 20 h (as found in a previous authors’ report after 24 h) [10,11].
Other aspects can be underlined when two independent variables are constant in the biosorption process, especially at their basic values (Xi,j = 0). In this context, the increase in BRed reactive dye removal percentage (dye biosorption efficiency) can vary with the increase in each Xi independent value, as follows:
-
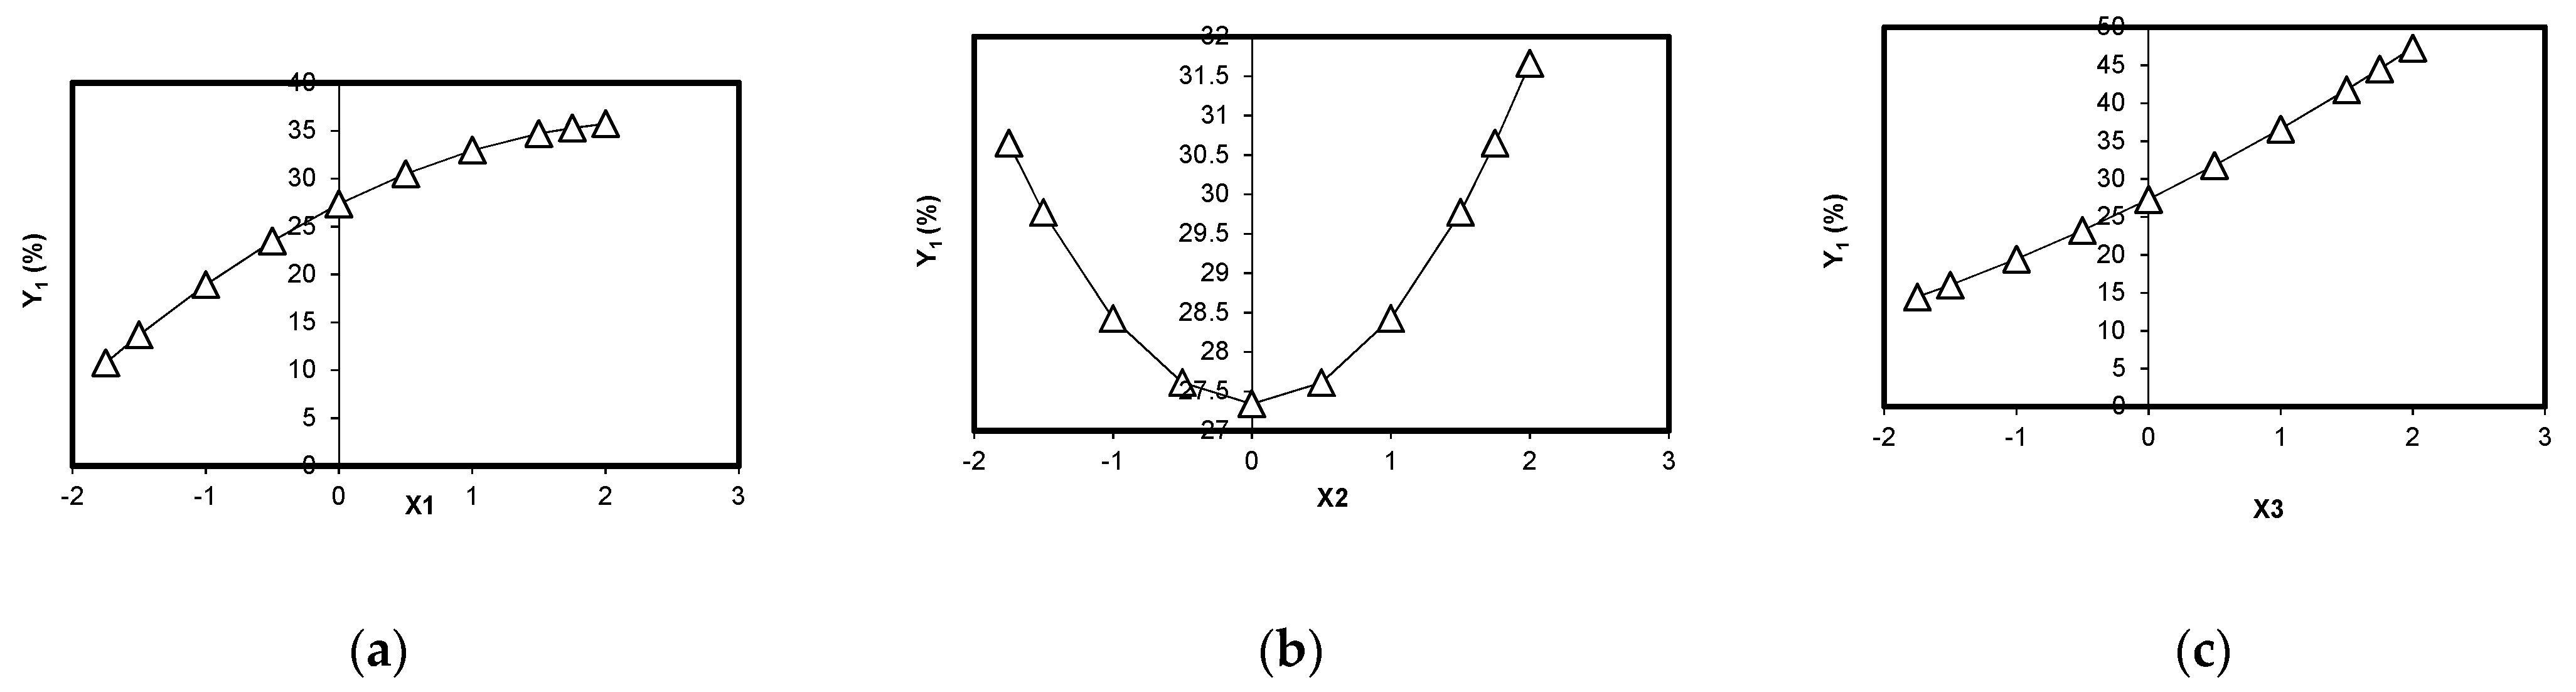
for Y1 function (BRed dye biosorption efficiency onto biosorbent 1): the influence of initial dye concentration (X1) vs. Y1 is illustrated in Figure 5a. It seems that it is no distinct maximum but only an extreme local maximum for BRed dye removal (Y1* = 35.724%) at X1*= +2.00 corresponding to a BRed dye concentration of 100.00 mg/L, for a biosorbent 1 concentration of 12 g/L and tbiosorption of 6 h (X2 and X3 kept constant at their basic values). The dependence of BRed dye removal (Y1) vs. X2 (biosorbent 1 concentration) (X1 and X3 coded values are 0) indicates no distinct minimum of dye removal degree; thus, an extreme local maximum can be considered (Y = 31.661%) at X2* = +2.00, corresponding to a biosorbent concentration of 24 g/L (0.60 g per 25 mL), a dye concentration of 50.00 mg/L and tsorption of 6 h (Figure 5b). The dependence of reactive BRed dye removal (Y1) vs. X3 (biosorption time) (X1 and X2 coded values are 0) indicates no distinct maximum dye removal degree, thus only an extreme local maximum can be considered (Y = 47.291%) for X3*= +2.00 (i.e., a local maximum point after a S/W contact time in biosorption step of 12 h, a dye concentration of 50 mg/L and a biosorbent concentration of 12 g/L (i.e., around 0.3 g per 25 mL) (Figure 5c). The X3 variable (biosorption time) has the most significant influence on the maximum value Y1.
-
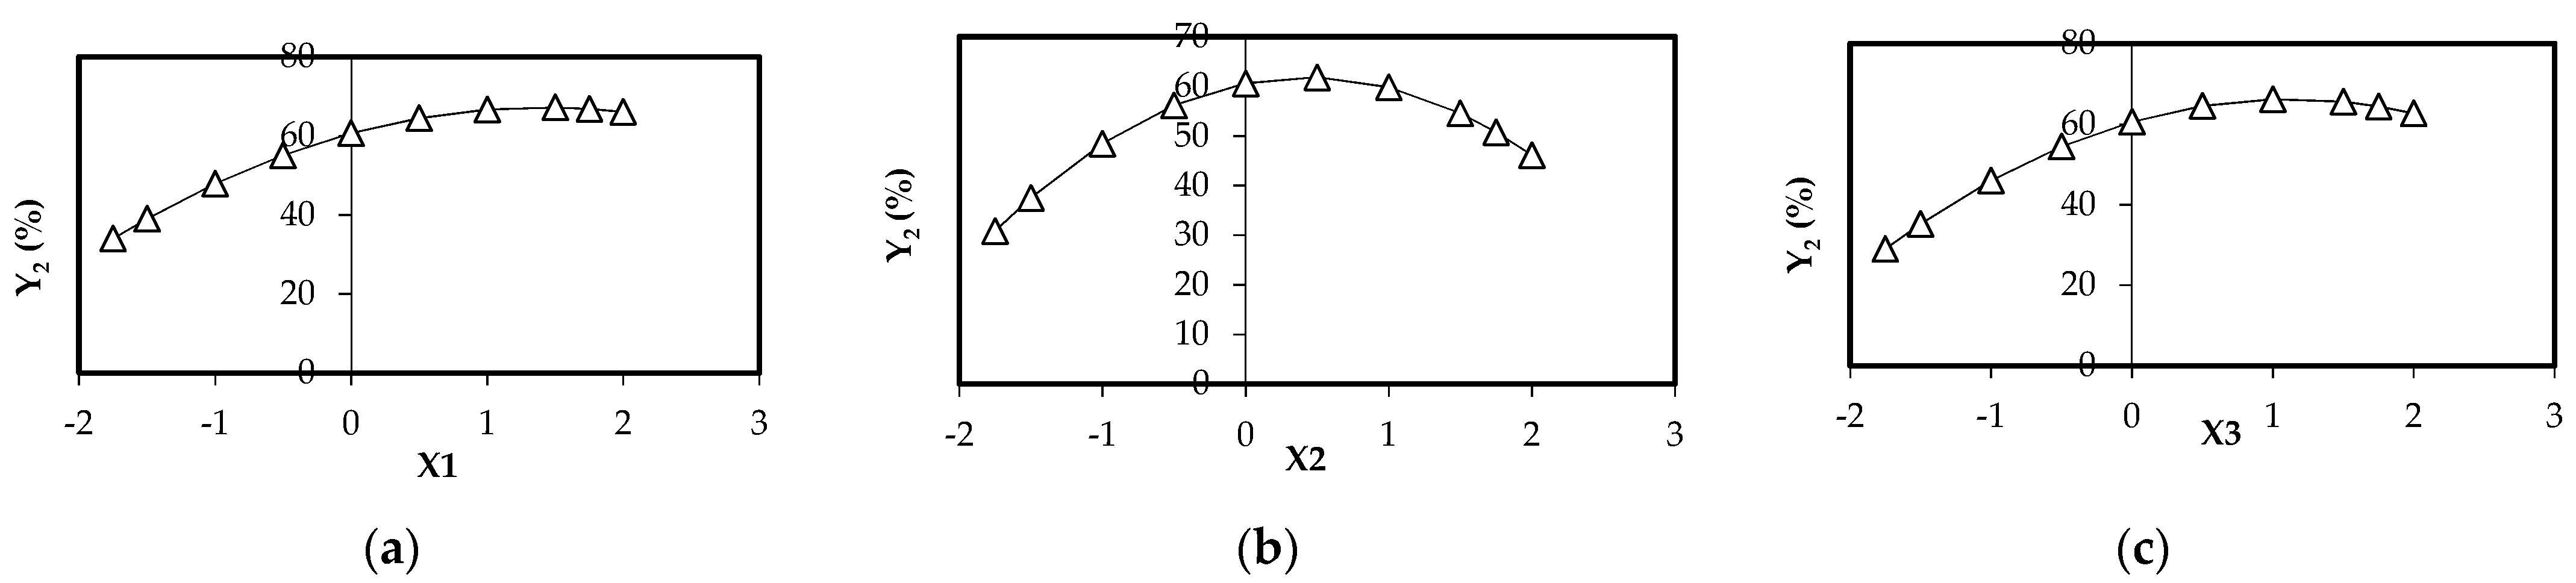
for Y2 function (BRed dye biosorption onto biosorbent 2): the influence of biosorbent 2 concentration (X1) vs. Y2 is evidenced in Figure 6a. It seems that there exists a distinct maximum of the BRed dye removal (Y2* = 67.189%) at X1* = +1.4048 corresponding to a biosorbent 2 concentration of 20.4288 g/L (0.5107 g per 25 mL), for a BRed dye concentration of 50 mg/L and tbiosorption of 6 h (X2 and X3 kept constant at their basic values). The dependence of BRed dye removal (Y2) vs. X2 (dye concentration) (X1 and X3 coded values are 0) indicates a distinct maximum dye removal degree (Y = 61.852%) at X2* = +0.4402, corresponding to a biosorbent concentration of 14.6412 g/L (0.366 g per 25 mL), a dye concentration of 50.00 mg/L and tsorption of 6 h (Figure 6b). The dependence of reactive BRed dye removal (Y2) vs. X3 (biosorption time) (X1 and X2 coded values are 0) indicates a distinct maximum dye removal degree (Y = 66.207%) for X3*= +1.1133 (i.e., a maximum point after a S/W contact time in biosorption step of 8.226 h, a dye concentration of 50 mg/L and a biosorbent concentration of 12 g/L (i.e., around 0.30 g per 25 mL) (Figure 6c).
Considering two independent variables at their basic values, we can conclude that the optimum values for the dye removal performance (Y*) by biosorption onto residual micro-encapsulated (biosorbent 1) or immobilized yeasts (biosorbent 2) biomass corresponded to a relatively high quantity of biosorbent (more than 14.64–24.00 (g/L)) and thus high dye removal efficiency can be performed working with a relatively high biosorbent concentration (i.e., >20 g/L, or >0.50 g per 25 mL of sample), a dye concentration around of 45–50.00 mg/L or more, and a biosorption contact time of at least 8 h (or ca. 12 h).
The application of other direct empirical optimization methodologies (i.e., univariant search or gradient methods) [13,14,15,16,17,18,19,20] for the maximum findings in the case of the proposed mathematical model leads to optimum values close to that found by the application of the classical optimization method for the proposed mathematical model, i.e., Y1* = 52.878% or Y2* = 75.338%.
The graphical representations (Figure 3, Figure 4, Figure 5 and Figure 6) allowed us to visualize the 3D and 2D variation of the selected response/decision function and its maximal points for the selected experimental variation field on isolines (2D), and also when some of the independent variables were constantly kept at their basic values (3D and/or 2D). The WinSurf and Excel data processing programs were used.

5. Conclusions

The biosorption onto two new prepared biosorbents based on residual biomass of Saccharomyces pastorianus micro-encapsulated (biosorbent 1) or immobilized (biosorbent 2) in sodium alginate can be applied with good efficiencies in the reactive BRed dye removal from aqueous systems.
Two empirical models were proposed by an active central compositional rotatable design of 23 order, considering the biosorbent concentration (X1), dye concentration (X2) and biosorption time (X3) as independent variables and the Bred dye removal as decision/response function, or optimization criterion (Y1 and Y2, %). The maximum values of response/decision function (Y1 and Y2) considered as optimization criterion were determined by using the classical optimization methodology and appreciated, in association with the significance and importance of each variable (i.e., Fisher constant (F), test (Fc), multiple correlation coefficient (RYx1x2x3), Student t-test, experimental and coefficients’ dispersion, among others).
The Y1 decision function (for biosorbent 1) was found to have only a local maximum of 52.878%, working with 70 mg/L BRed dye, 18 g/L of residual yeasts (Saccharomyces pasturianus) biomass micro-encapsulated in sodium alginate and after at least 8 h. A distinct maximum for Y2 function (with biosorbent 2) was found to correspond to an immobilized biosorbent concentration of 22.109 g/L (0.553 g per 25 mL), a dye concentration of 48.49 mg/L and biosorption time of 8.799 h for a maximum Bred dye removal of 75.338%.
The graphical representation of the dye removal variation vs. one or two selected independent variables permits the localization of the optimal variation field of each studied variable. The maximum solutions are encouraging (BRed reactive dye removal > 52% onto biosorbent 1 and >75% onto biosorbent 2), and thus the continuity of this modeling and optimization study is recommended when the utilization of other improved, empirical and programmed (controlled) modeling and optimization methods is possible.

Author Contributions

Conceptualization, C.Z.; methodology, C.Z. and D.S.; software, C.Z.; validation, C.Z.; formal analysis, C.Z.; investigation, C.Z.; resources, D.S.; data curation, C.Z., D.S.; writing—original draft preparation, C.Z.; writing—review and editing, C.Z.; visualization, C.Z. and D.S.; supervision, C.Z.; project administration, D.S.; funding acquisition, D.S. All authors have read and agreed to the published version of the manuscript.

Funding

This research is supported by a grant of the Ministry of Research, Innovation and Digitization, CNCS/CCCDI–UEFISCDI, project number 490PED/2020, within PNCDI II.

Institutional Review Board Statement

Not applicable.

Informed Consent Statement

Not applicable.

Data Availability Statement

Not applicable.

Conflicts of Interest

The authors declare no conflict of interest.

References

  1. Elgarahy, A.M.; Elwakeel, K.Z.; Mohammad, S.H.; Elshoubaky, G.A. A critical review of biosorption of dyes, heavy metals and metalloids from wastewater as an efficient and green process. Clean. Eng. Technol. 2021, 4, 100209. [Google Scholar] [CrossRef]
  2. Suteu, D.; Zaharia, C.; Blaga, A.C. Biosorption-current bioprocess for wastewater treatment (chapter 10). In Current Topics, Concepts and Research Priorities in Environmental Chemistry; Zaharia, C., Ed.; ‘Al.I. Cuza’ University Ed.: Iasi, Romania, 2012; Volume I, pp. 221–244. [Google Scholar]
  3. Torres, E. Biosorption: A Review of the Latest Advances. Processes 2020, 8, 1584. [Google Scholar] [CrossRef]
  4. Daza-López, E.V.; Fernández-Andrade, K.J.; Nóbrega, R.Q.; Zambrano-Intriago, L.A.; Ramos, G.V.; Quiroz-Fernández, L.S.; Montenegro, M.C.B.S.M.; Rodríguez-Díaz, J.M. Modified or Functionalized Natural Bioadsorbents: New Perspectives as Regards the Elimination of Environmental Pollutants. In Advances in the Domain of Environmental Biotechnology. Environmental and Microbial Biotechnology; Maddela, N.R., García Cruzatty, L.C., Chakraborty, S., Eds.; Springer: Singapore, 2021; pp. 195–225. [Google Scholar] [CrossRef]
  5. Berillo, D.; Al-Jwaid, A.; Caplin, J. Polymeric Materials Used for Immobilisation of Bacteria for the Bioremediation of Contaminants in Water. Polymers 2021, 13, 1073. [Google Scholar] [CrossRef] [PubMed]
  6. Żywicka, A.; Wenelska, K.; Junka, A.; Chodaczek, G.; Szymczyk, P.; Fijałkowski, K. Immobilization pattern of morphologically different microorganisms on bacterial cellulose membranes. World J. Microbiol. Biotechnol. 2019, 35, 1–11. [Google Scholar] [CrossRef] [PubMed]
  7. Blaga, A.C.; Zaharia, C.; Suteu, D. Polysaccharides as Support for Microbial Biomass-Based Adsorbents with Applications in Removal of Heavy Metals and Dyes. Polymers 2021, 13, 2893. [Google Scholar] [CrossRef] [PubMed]
  8. Al-Zaban, M.I.; Alharbi, N.K.; Albarakaty, F.M.; Alharthi, S.; Hassan, S.H.A.; Fawzy, M.A. Experimental Modeling Investigations on the Biosorption of Methyl Violet 2B Dye by the Brown Seaweed Cystoseira Tamariscifolia. Sustainability 2022, 14, 5285. [Google Scholar] [CrossRef]
  9. Chwastowski, J.; Staroń, P. Influence of Saccharomyces cerevisiae yeast cells immobilized on Cocos nucifera fibers for the adsorption of Pb(II) ions. Colloids Surf. A Physicochem. Eng. Asp. 2022, 632, 127735. [Google Scholar] [CrossRef]
  10. Suteu, D.; Blaga, A.C.; Cimpoesu, R.; Puițel, A.C.; Tataru-Farmus, R.-E. Composites Based on Natural Polymers and Microbial Biomass for Biosorption of Brilliant Red HE-3B Reactive Dye from Aqueous Solutions. Polymers 2021, 13, 4314. [Google Scholar] [CrossRef] [PubMed]
  11. Suteu, D.; Blaga, A.C.; Zaharia, C.; Cimpoesu, R.; Puițel, A.C.; Tataru-Farmus, R.-E.; Tanasă, A.M. Polysaccharides Used in Biosorbents Preparation for Organic Dyes Retaining from Aqueous Media. Polymers 2022, 14, 588. [Google Scholar] [CrossRef] [PubMed]
  12. Iacob Tudose, E.T.; Zaharia, C. Textile Wastewater Treatment on a Spinning Disc Reactor: Characteristics, Performances and Empirical Modeling. Appl. Sci. 2020, 10, 8687. [Google Scholar] [CrossRef]
  13. Zaharia, C.; Suteu, D. A preliminary modeling and optimization study of a homogenous advanced oxidation process applied for an industrial colored effluent. J. Environ. Prot. Ecol. 2014, 15, 1680–1689. [Google Scholar]
  14. Macoveanu, M.; Nicu, V. Basis of the chemical technology. Methodology of mathematical modeling in the chemical industry. In Romanian: Bazele Tehnologiei Chimice. Metodologia Modelarii Matematice in Industria Chimica; “Gheorghe Asachi” Technical University Publishing House: Iasi, Romania, 1987. [Google Scholar]
  15. Cojocaru, C.; Cretu, V.C.; Preda, C.; Macoveanu, M.; Cretescu, I. Response surface methodology applied for investigation of diesel oil spill removal from surface water using textile sorbents. J. Environ. Prot. Ecol. 2010, 11, 643–656. [Google Scholar]
  16. Cojocaru, C.; Macoveanu, M.; Cretescu, I. Peat-based sorbents for the removal of oil spills from water surface: Application of artificial neural network modeling. Colloids Surf. A Physicochem. Eng. Asp. 2011, 384, 675–684. [Google Scholar] [CrossRef]
  17. Betianu, C.; Caliman, F.A.; Gavrilescu, M.; Cretescu, I.; Cojocaru, C.; Poulios, I. Response surface methodology applied for Orange II photocatalytic degradation in TiO2 aqueous suspensions. J. Chem. Technol. Biotechnol. 2008, 83, 1454–1465. [Google Scholar] [CrossRef]
  18. Cretescu, I.; Diaconu, M.; Cojocaru, C.; Benchea, R.E.; Pohontu, C. Removal of Dunkel Blau dye from aqueous solutions by fungal and peat biomass in batch mode. Environ. Eng. Manag. J. 2010, 9, 107–112. [Google Scholar] [CrossRef]
  19. Secula, M.S.; Cagnon, B.; Creţescu, I.; Diaconu, M.; Petrescu, S. Removal of an acid dye from aqueous solutions by adsorption on a commercial granular activated carbon: Equilibrium, kinetic and thermodynamic study. Sci. Study Res.-Chem. Eng. Biotechnol. Food Ind. 2011, 12, 307–322. [Google Scholar]
  20. Cojocaru, C.; Cretescu, I.; Macoveanu, M.; Diaconu, M.; Kicsi, A. Studies on diesel oil spills removal from water surface using peat. Process modelling and optimization. Environ. Eng. Manag. J. 2004, 3, 247–257. [Google Scholar] [CrossRef]
  21. Rodrigues, M.I.; Iemma, A.F. Experimental Design and Process Optimization, 1st ed.; CRC Press: Boca Raton, FL, USA, 2014; ISBN 9781482299557-CAT# K24472. [Google Scholar]
Figure 1. Chemical structure of reactive Brilliant Red HE-3B dye—C.I. 25810.
Applsci 12 06377 g001
Figure 2. The influence of the initial concentration of dye (a) and the amount of dry biomass per 25 mL aqueous dye solution (b) on the biosorption of Brilliant Red HE-3B dye onto the residual biomass of Saccharomyces pastorianus immobilized in sodium alginate. Working conditions: pH =3, contact time = 24 h, and (a) 3.2 g/L of biosorbent 1 and 2.4 g/L biosorbent 2, T = 30 °C; (b) C0 = 31.95 mg/L of dye, T = 20 °C for both two biosorbents; biosorbent 1 (f 1 = 1.5 mm, prepared by using a Buchi micro-encapsulator) and biosorbent 2 (f 2 = 4 mm, prepared by a simple dropping technique).
Applsci 12 06377 g002
Figure 3. Variation of Bred dye removal (Y1) vs. two independent variables (one variable kept at its basic value) and its isolines. (a) Y = Y1(0,X2,X3); (b) Isolines for Y = Y1(0,X2,X3); (c) Y = Y1(X1,0,X3); (d) Isolines for Y = Y1(X1,0,X3); (e) Y = Y1(X1,X2,0); (f) Isolines for Y = Y1(X1,X2,0).
Applsci 12 06377 g003
Figure 4. Variation of Bred dye removal (Y2) vs. two independent variables (one variable kept at its basic value) and its isolines. (a) Y = Y2(0,X2,X3); (b) Isolines for Y = Y2(0,X2,X3); (c) Y = Y2(X1,0,X3); (d) Isolines for Y = Y2(X1,0,X3); (e) Y = Y2(X1,X2,0); (f) Isolines for Y = Y2(X1,X2,0).
Applsci 12 06377 g004
Figure 5. Variation of reactive dye removal degree (Y1) vs. one independent variable (Xi) (two variables kept at the basic value), i.e., (a) Y1 = Y(X1,0,0), (b) Y1 = Y(0,X2,0), or (c) Y1 = Y(0,0,X3).
Applsci 12 06377 g005
Figure 6. Variation of reactive dye removal degree (Y2) vs. one independent variable (Xi) (two variables kept at the basic value), i.e., (a) Y2 = f(X1,0,0), (b) Y2 = f(0,X2,0), or (c) Y2 = f(0,0,X3).
Applsci 12 06377 g006
Table 1. Codification of independent variables in the active central compositional rotatable design of 23 order for reactive BRed dye biosorption onto residual biomass (encapsulated/immobilized type).
Variable/ValueReal Variable
(Zi)
Coded Variable
(Xi)
Real Basic Variable
(Zi0)
Variation Step
(∆Zi0)
Biosorbent 1: Residual yeast biomass prepared by using a Buchi microencapsulator
Dye concentration, (mg/L)Z1X15020
Residual encapsulated biomass, (g/L)Z2X2126
Biosorption (S/L) contact time, (h)Z3X362
Biosorbent 2: Residual biomass immobilized in sodium alginate by simple dropping technique
Residual immobilized biomass, (g/ L)Z1X1126
Dye concentration, (mg/L)Z2X25020
Biosorption (S/L) contact time, (h)Z3X362
Table 2. Experimental planning matrix in the active central compositional rotatable design of 23 order for static BRed dye biosorption onto biosorbent 1 (residual yeast biomass encapsulated in sodium alginate).
Exp. No.Z1, (mg/L)Z2, (g/L)Z3, (h)X1X2X3Yei (%)Yci (%)Deviation (A)
13064−1−1−113.62416.023−0.176
2301841−1−131.87825.8870.188
37064−11−114.36213.8280.037
47018411−116.79520.779−0.237
53068−1−1131.21723.9390.233
6301881−1147.75144.9910.058
77068−11126.35029.047−0.102
87018811152.87847.1860.108
9501.9086−1.6820011.55711.581−0.002
105022.09261.6820030.49835.132−0.152
1116.361260−1.682031.26629.2400.064
1283.6412601.682031.27030.9070.012
1350122.6400−1.68219.82314.8810.249
1450129.36001.68249.27840.7210.174
155012600023.75627.342−0.151
165012600024.31827.342−0.124
17500.60600023.27427.342−0.175
18500.60600024.47827.342−0.117
19500.60600023.59627.342−0.159
20500.60600023.91727.342−0.143
Table 3. Experimental planning matrix in the active central compositional rotatable design of 23 order for static BRed dye biosorption onto biosorbent 2 (residual yeast biomass immobilized in sodium alginate).
Exp. No.Z1, (g/L)Z2, (mg/L)Z3, (h)X1X2X3Yei (%)Yci (%)Deviation (A)
16304−1−1−113.624317.9134−0.3148
2183041−1−134.788433.69220.0315
36704−11−133.353138.3054−0.1485
41870411−148.486754.7038−0.1282
56308−1−1152.631644.78420.1491
6183081−1172.486865.90420.0908
76708−11147.058846.52500.0113
81870811174.183968.26460.0798
91.908506−1.6820036.677435.37980.0354
1022.0925061.6820063.322666.9328−0.0570
111216.3660−1.682034.650541.5375−0.1988
121283.64601.682051.909149.60460.0444
1312502.6400−1.68244.943830.75590.3157
1412509.36001.68269.662965.85380.0547
151250600056.741660.6002−0.0680
161250600055.377260.6002−0.0943
170.6050600056.821860.6002−0.0665
180.6050600058.105960.6002−0.0429
190.6050600054.895760.6002−0.1039
200.6050600056.500860.6002−0.0726
Publisher’s Note: MDPI stays neutral with regard to jurisdictional claims in published maps and institutional affiliations.

