
Social Network Analysis: Mathematical Models for Understanding Professional Football in Game Critical Moments—An Exploratory Study

 ,
,  ,
,  ,
,  and
and 
Abstract
:1. Introduction
1.1. Mathematic Models Applied to Professional Football and to the Centroid Player
1.2. Critical Events and Moments in a Football Game
2. Materials and Methods
2.1. Participants
2.2. Ethical Clearance
2.3. Design and Procedures
2.4. Data Analysis
3. Results
3.1. Micro Analysis
3.2. Macro Analysis
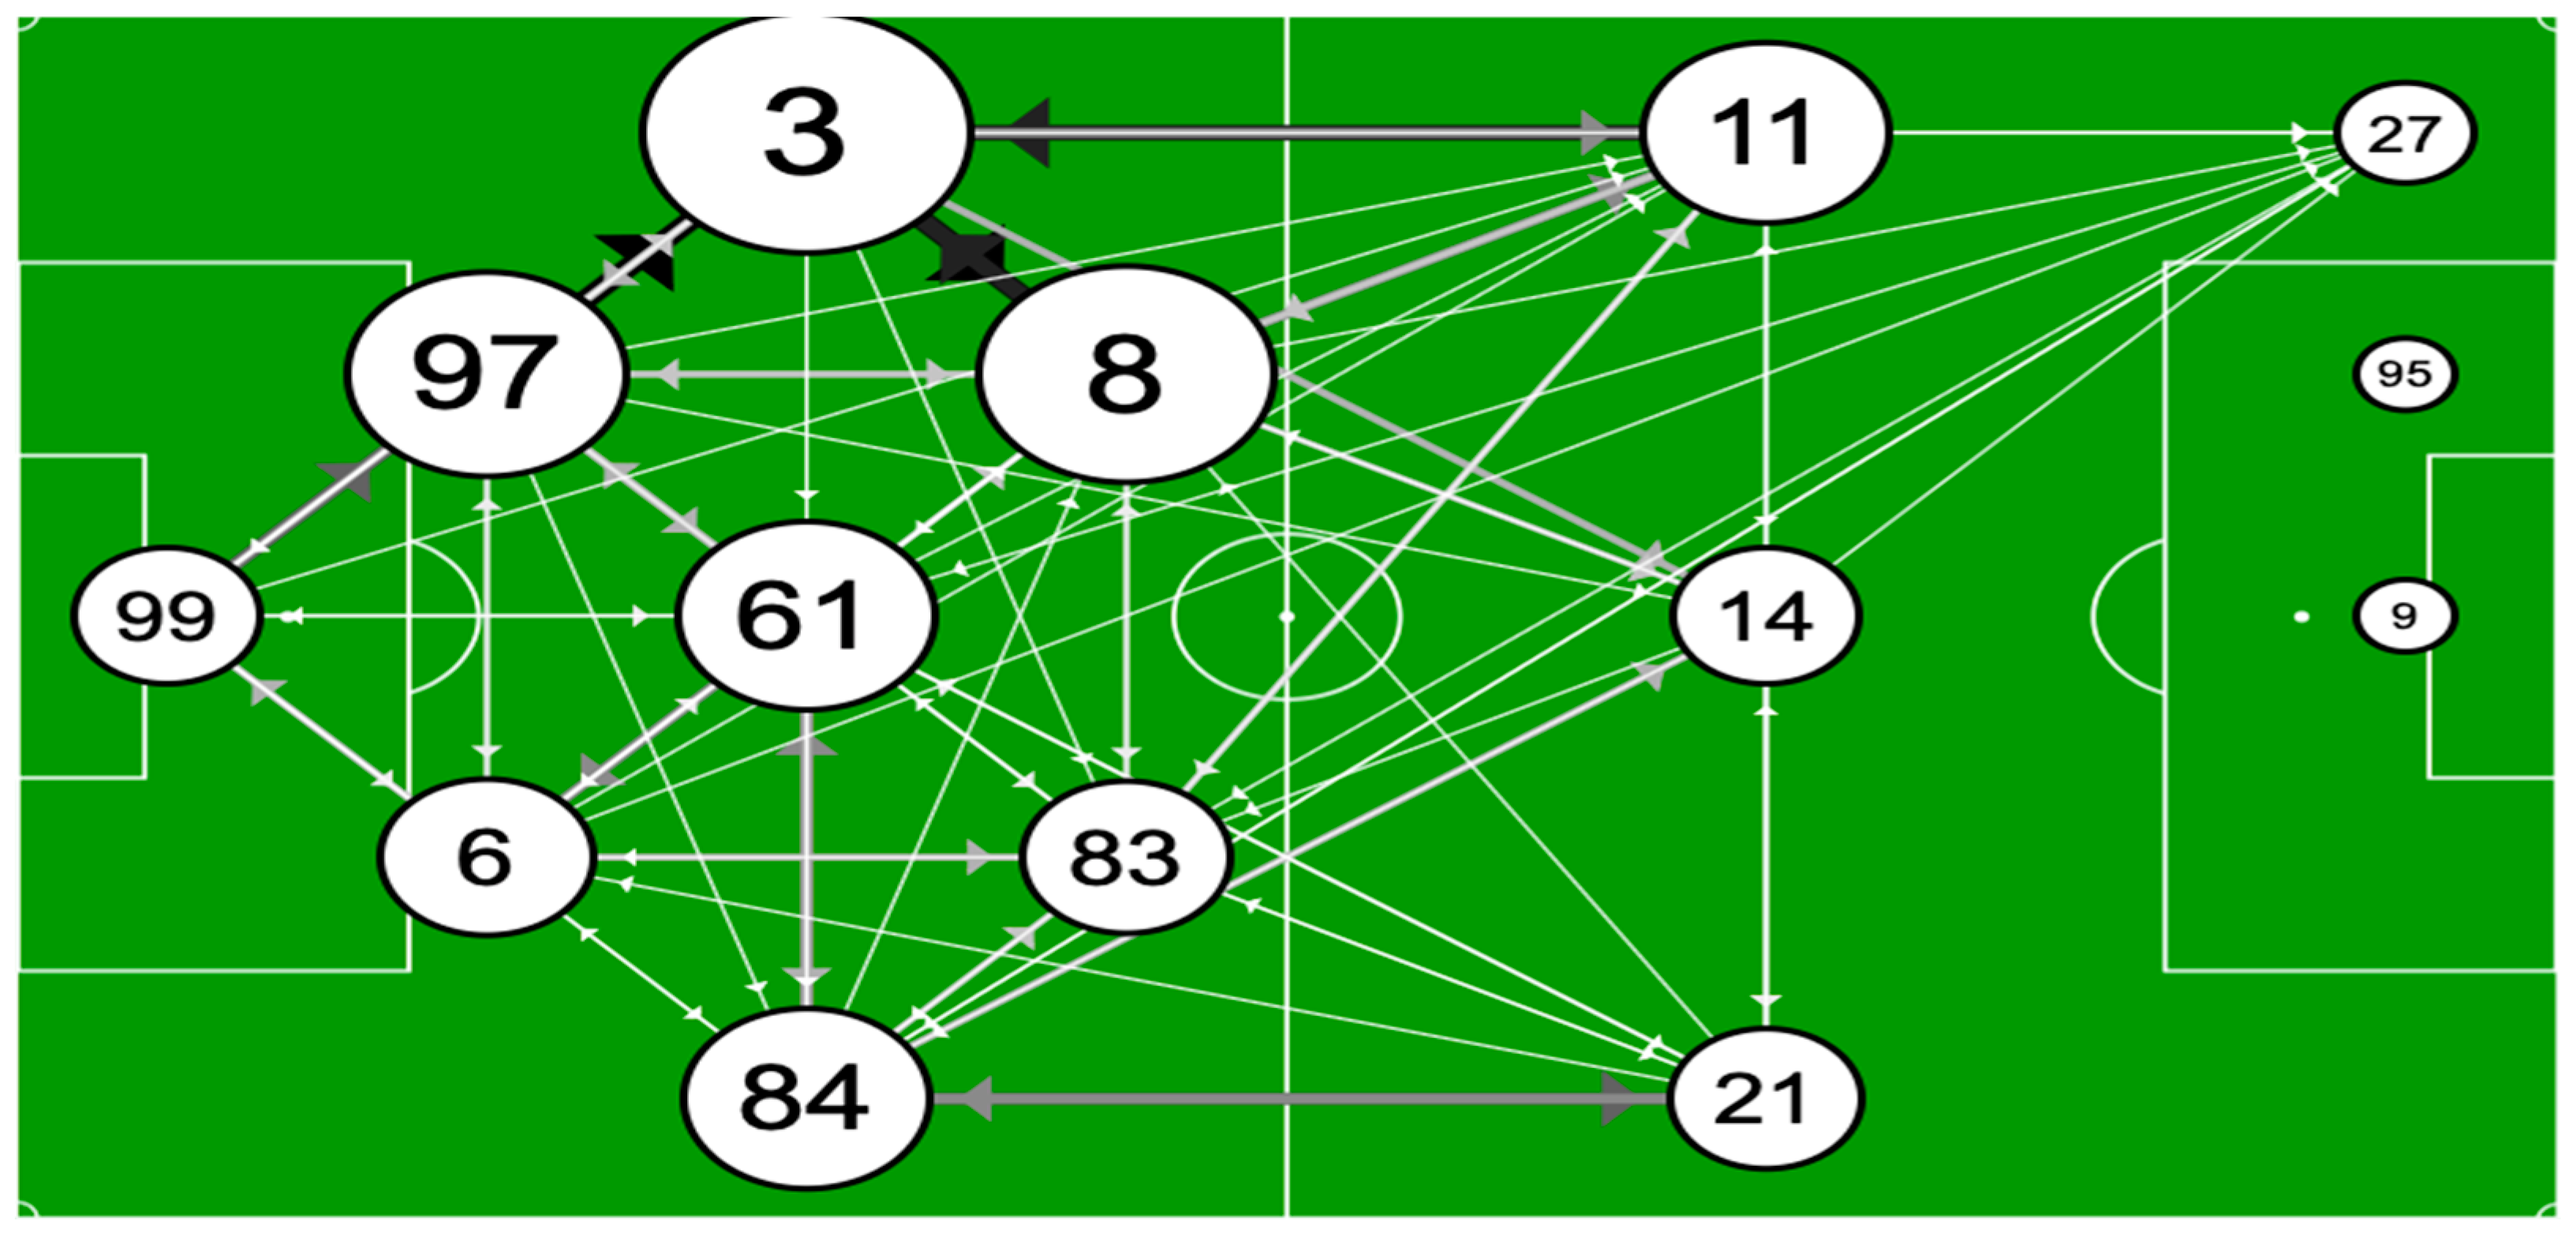
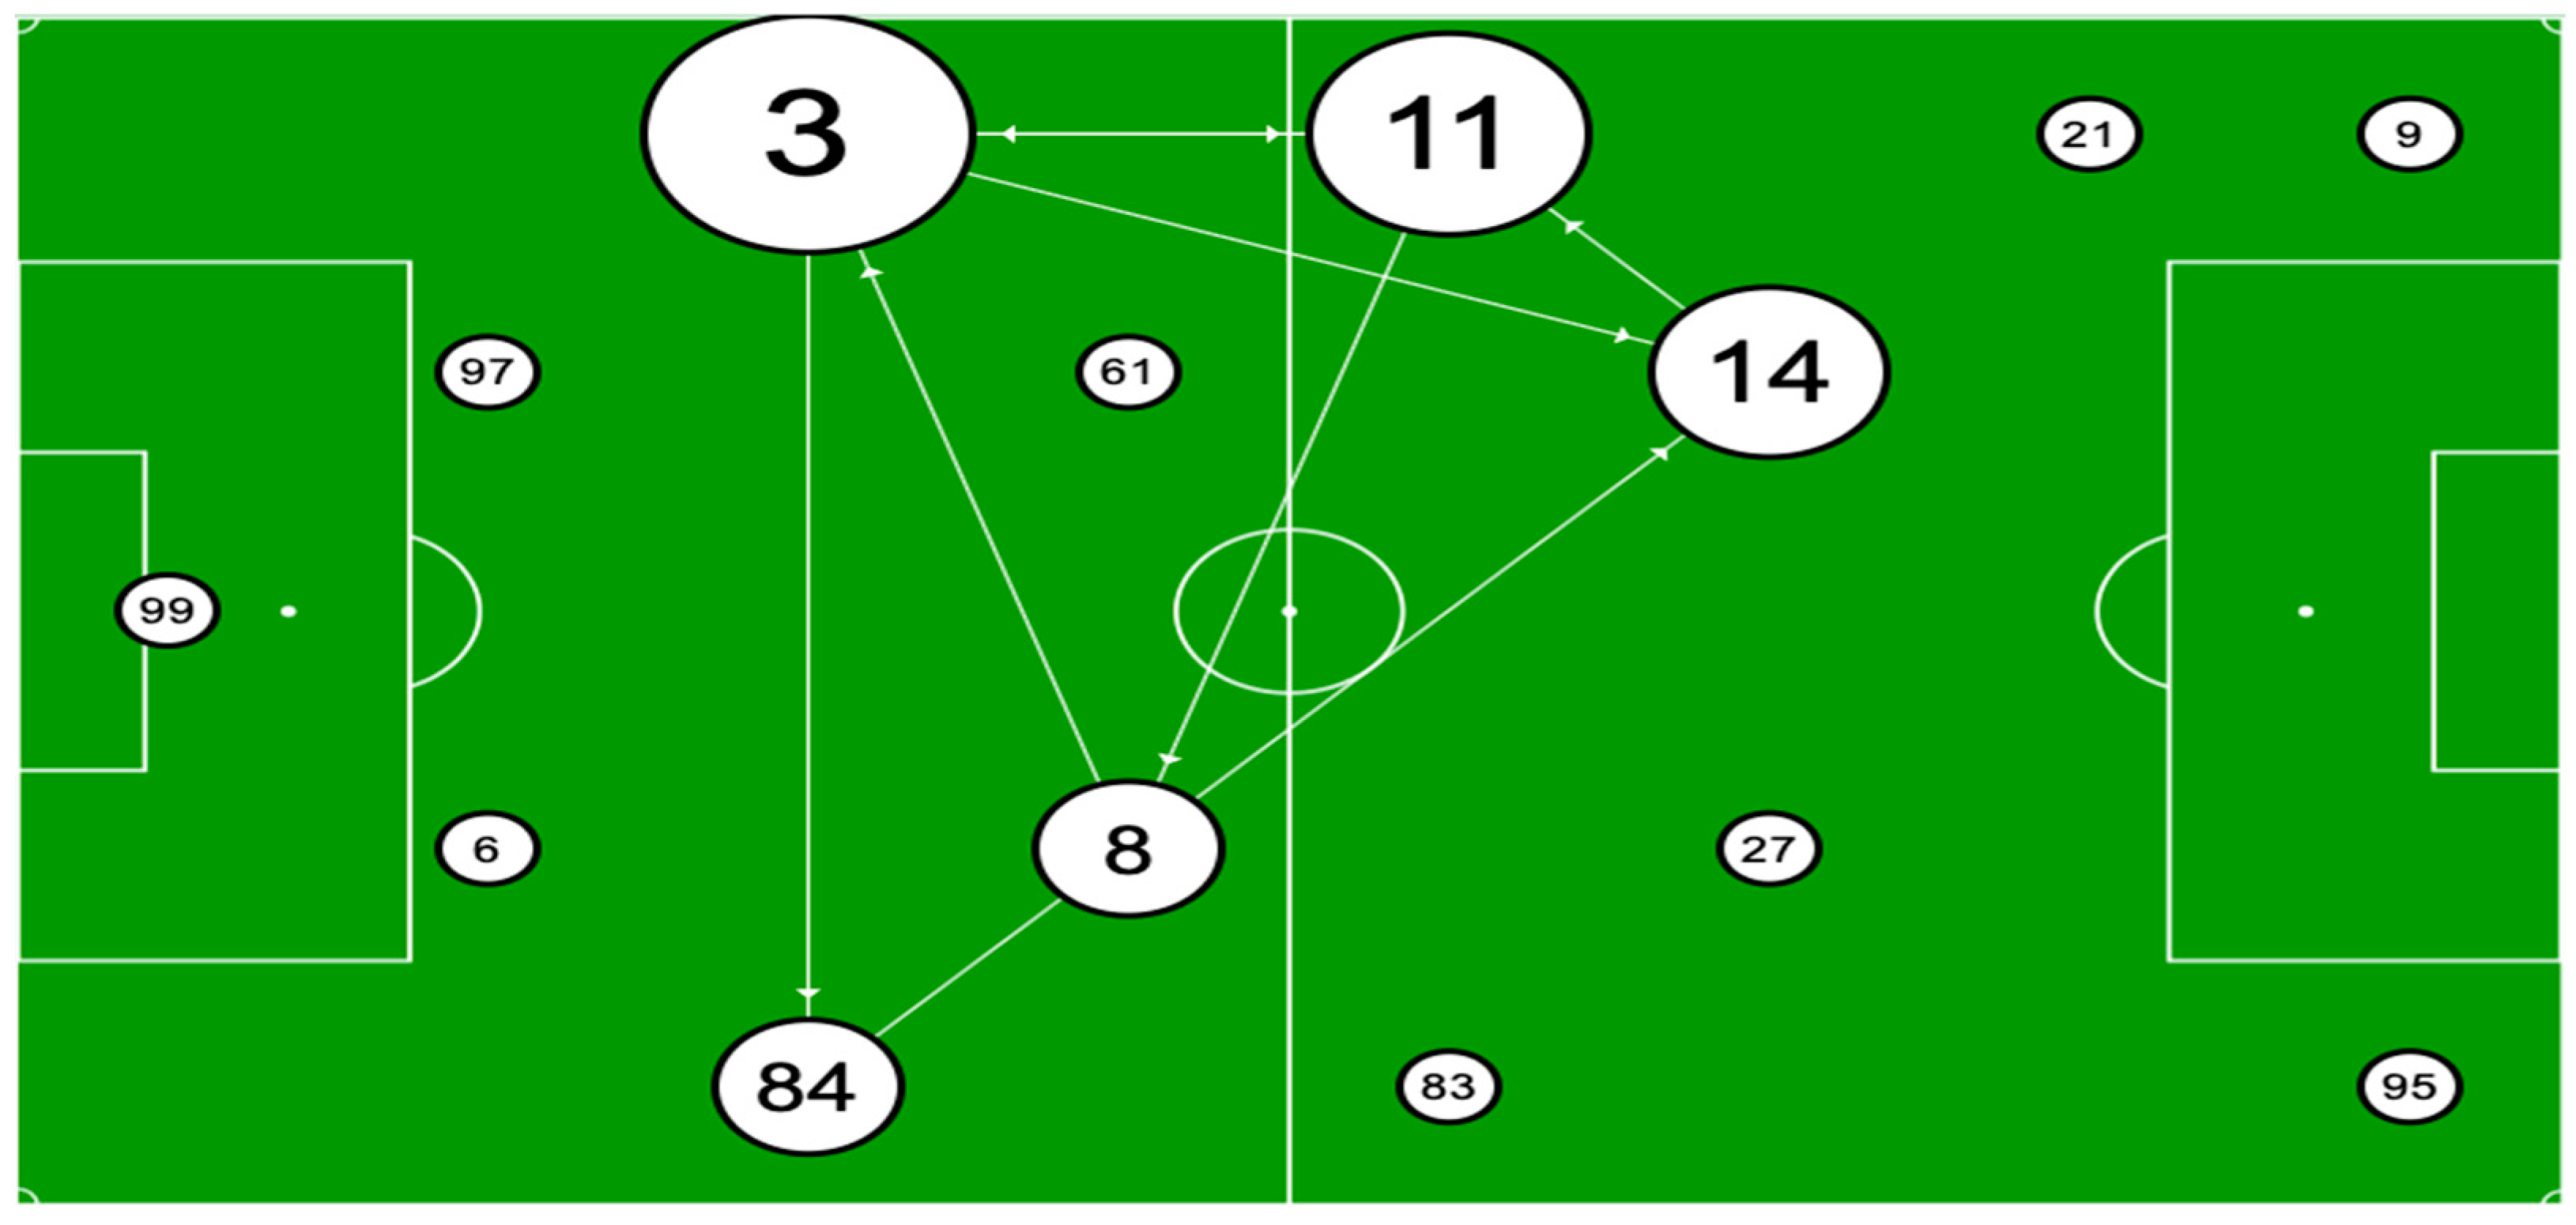
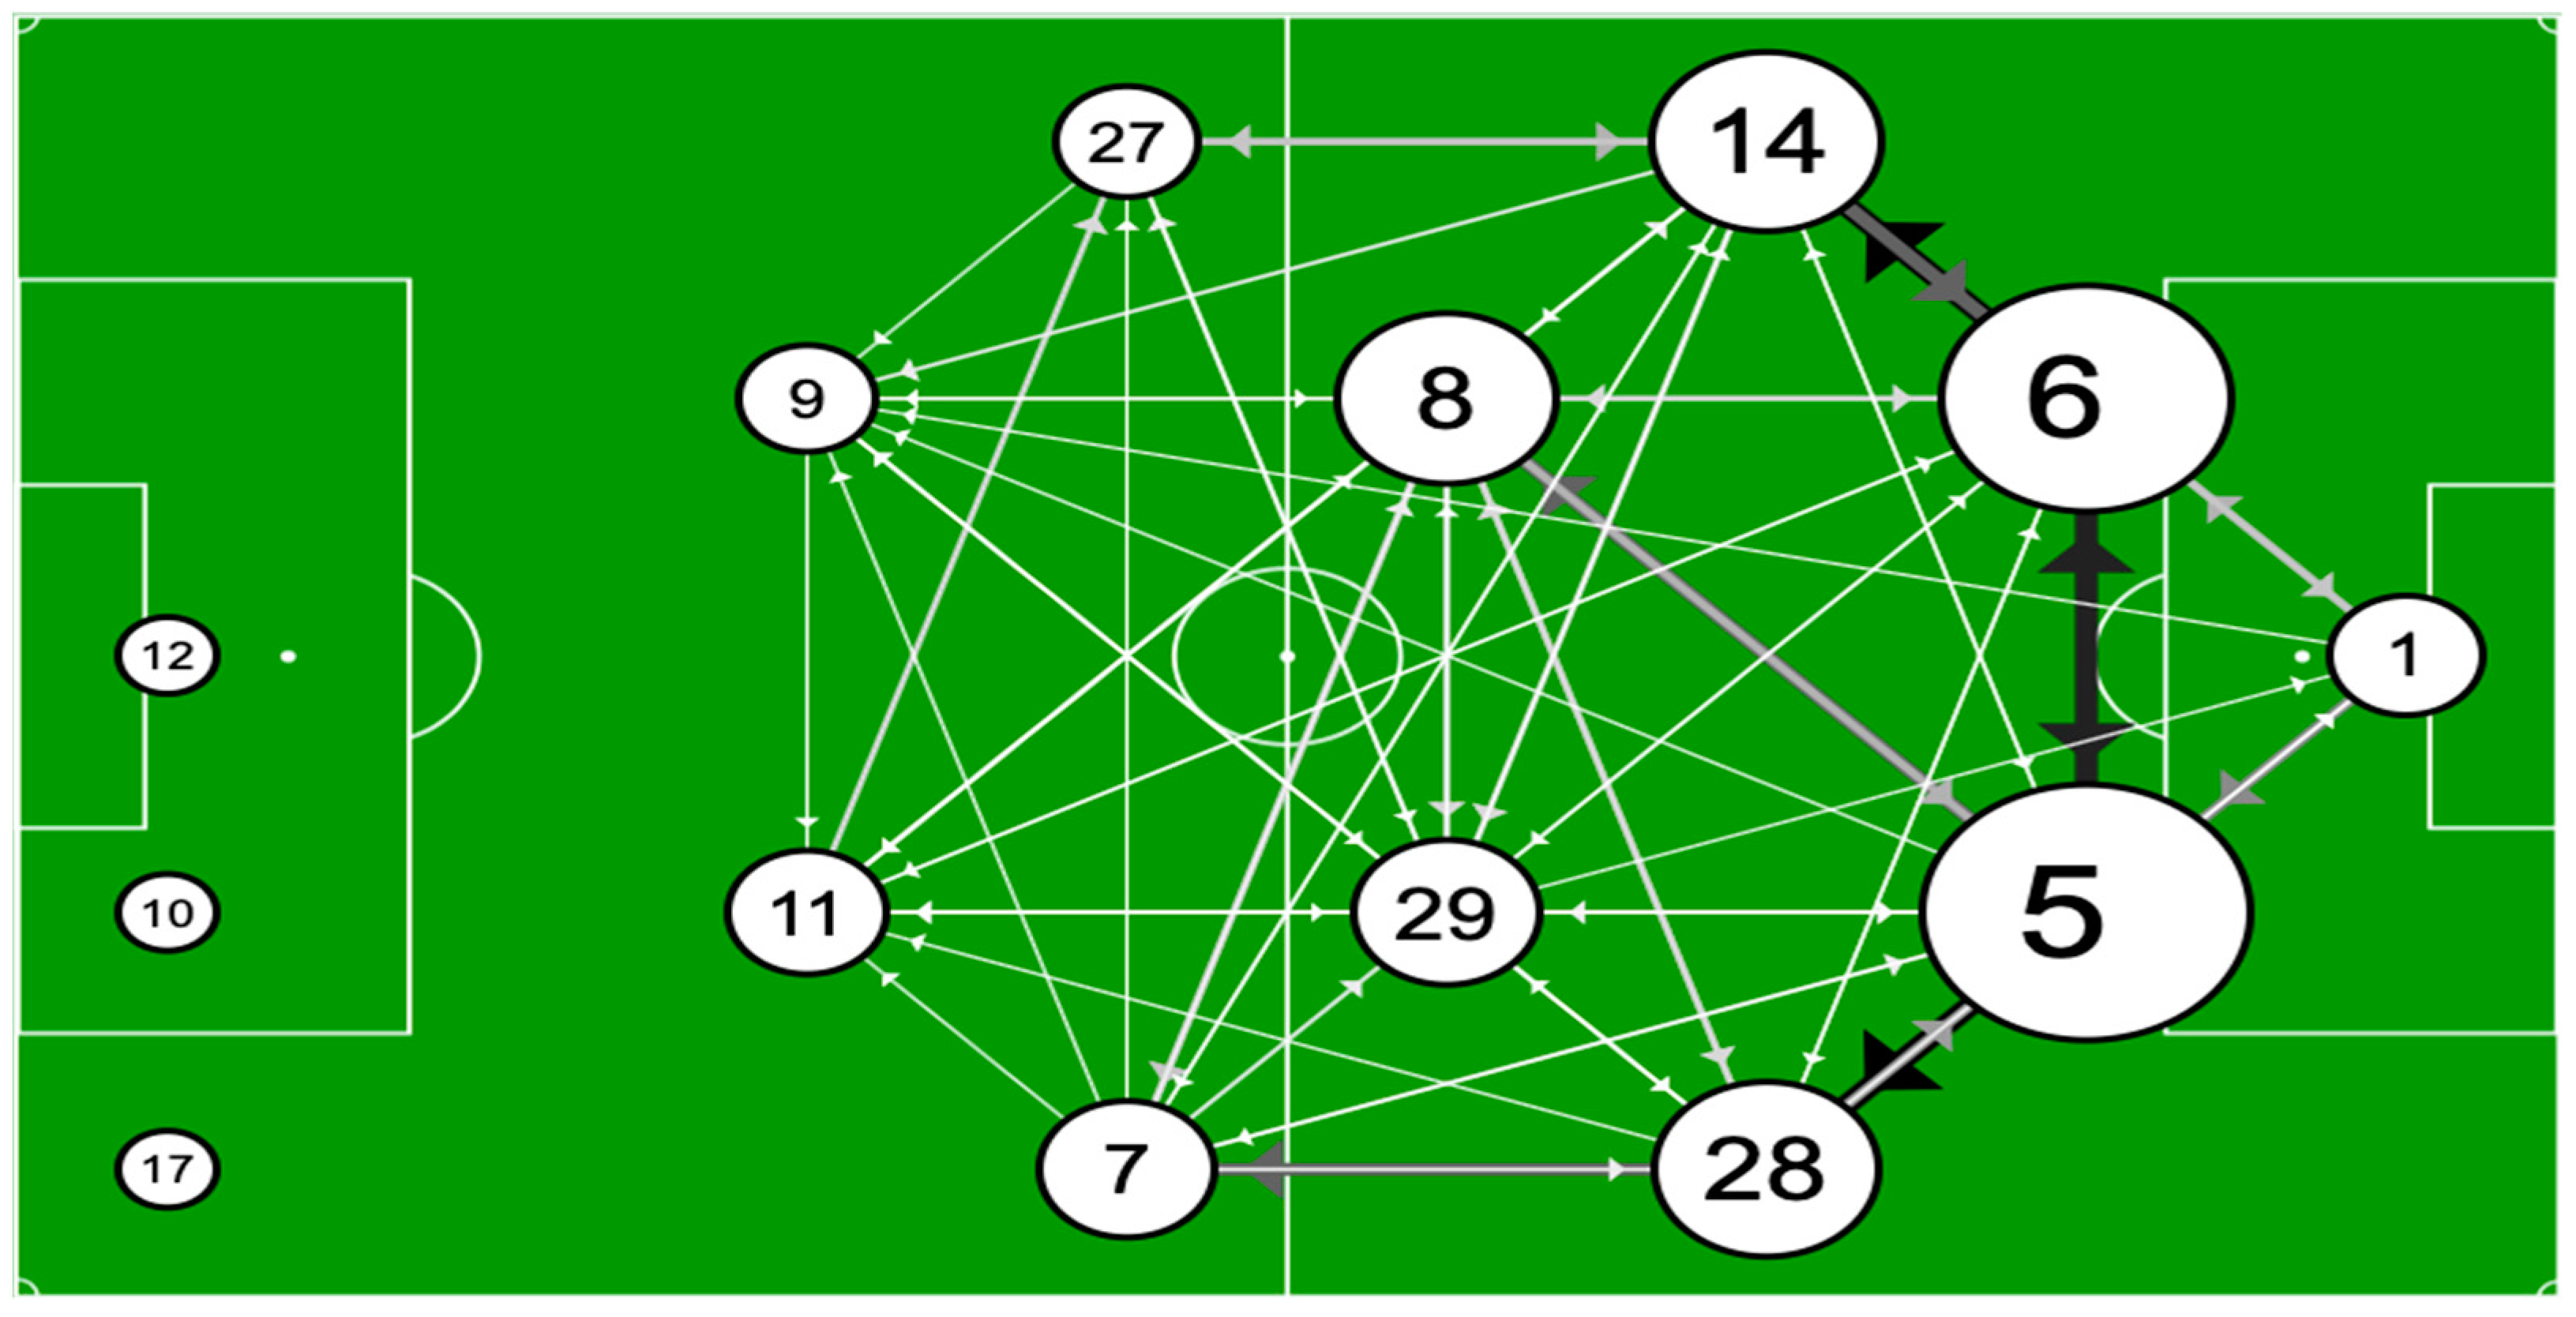
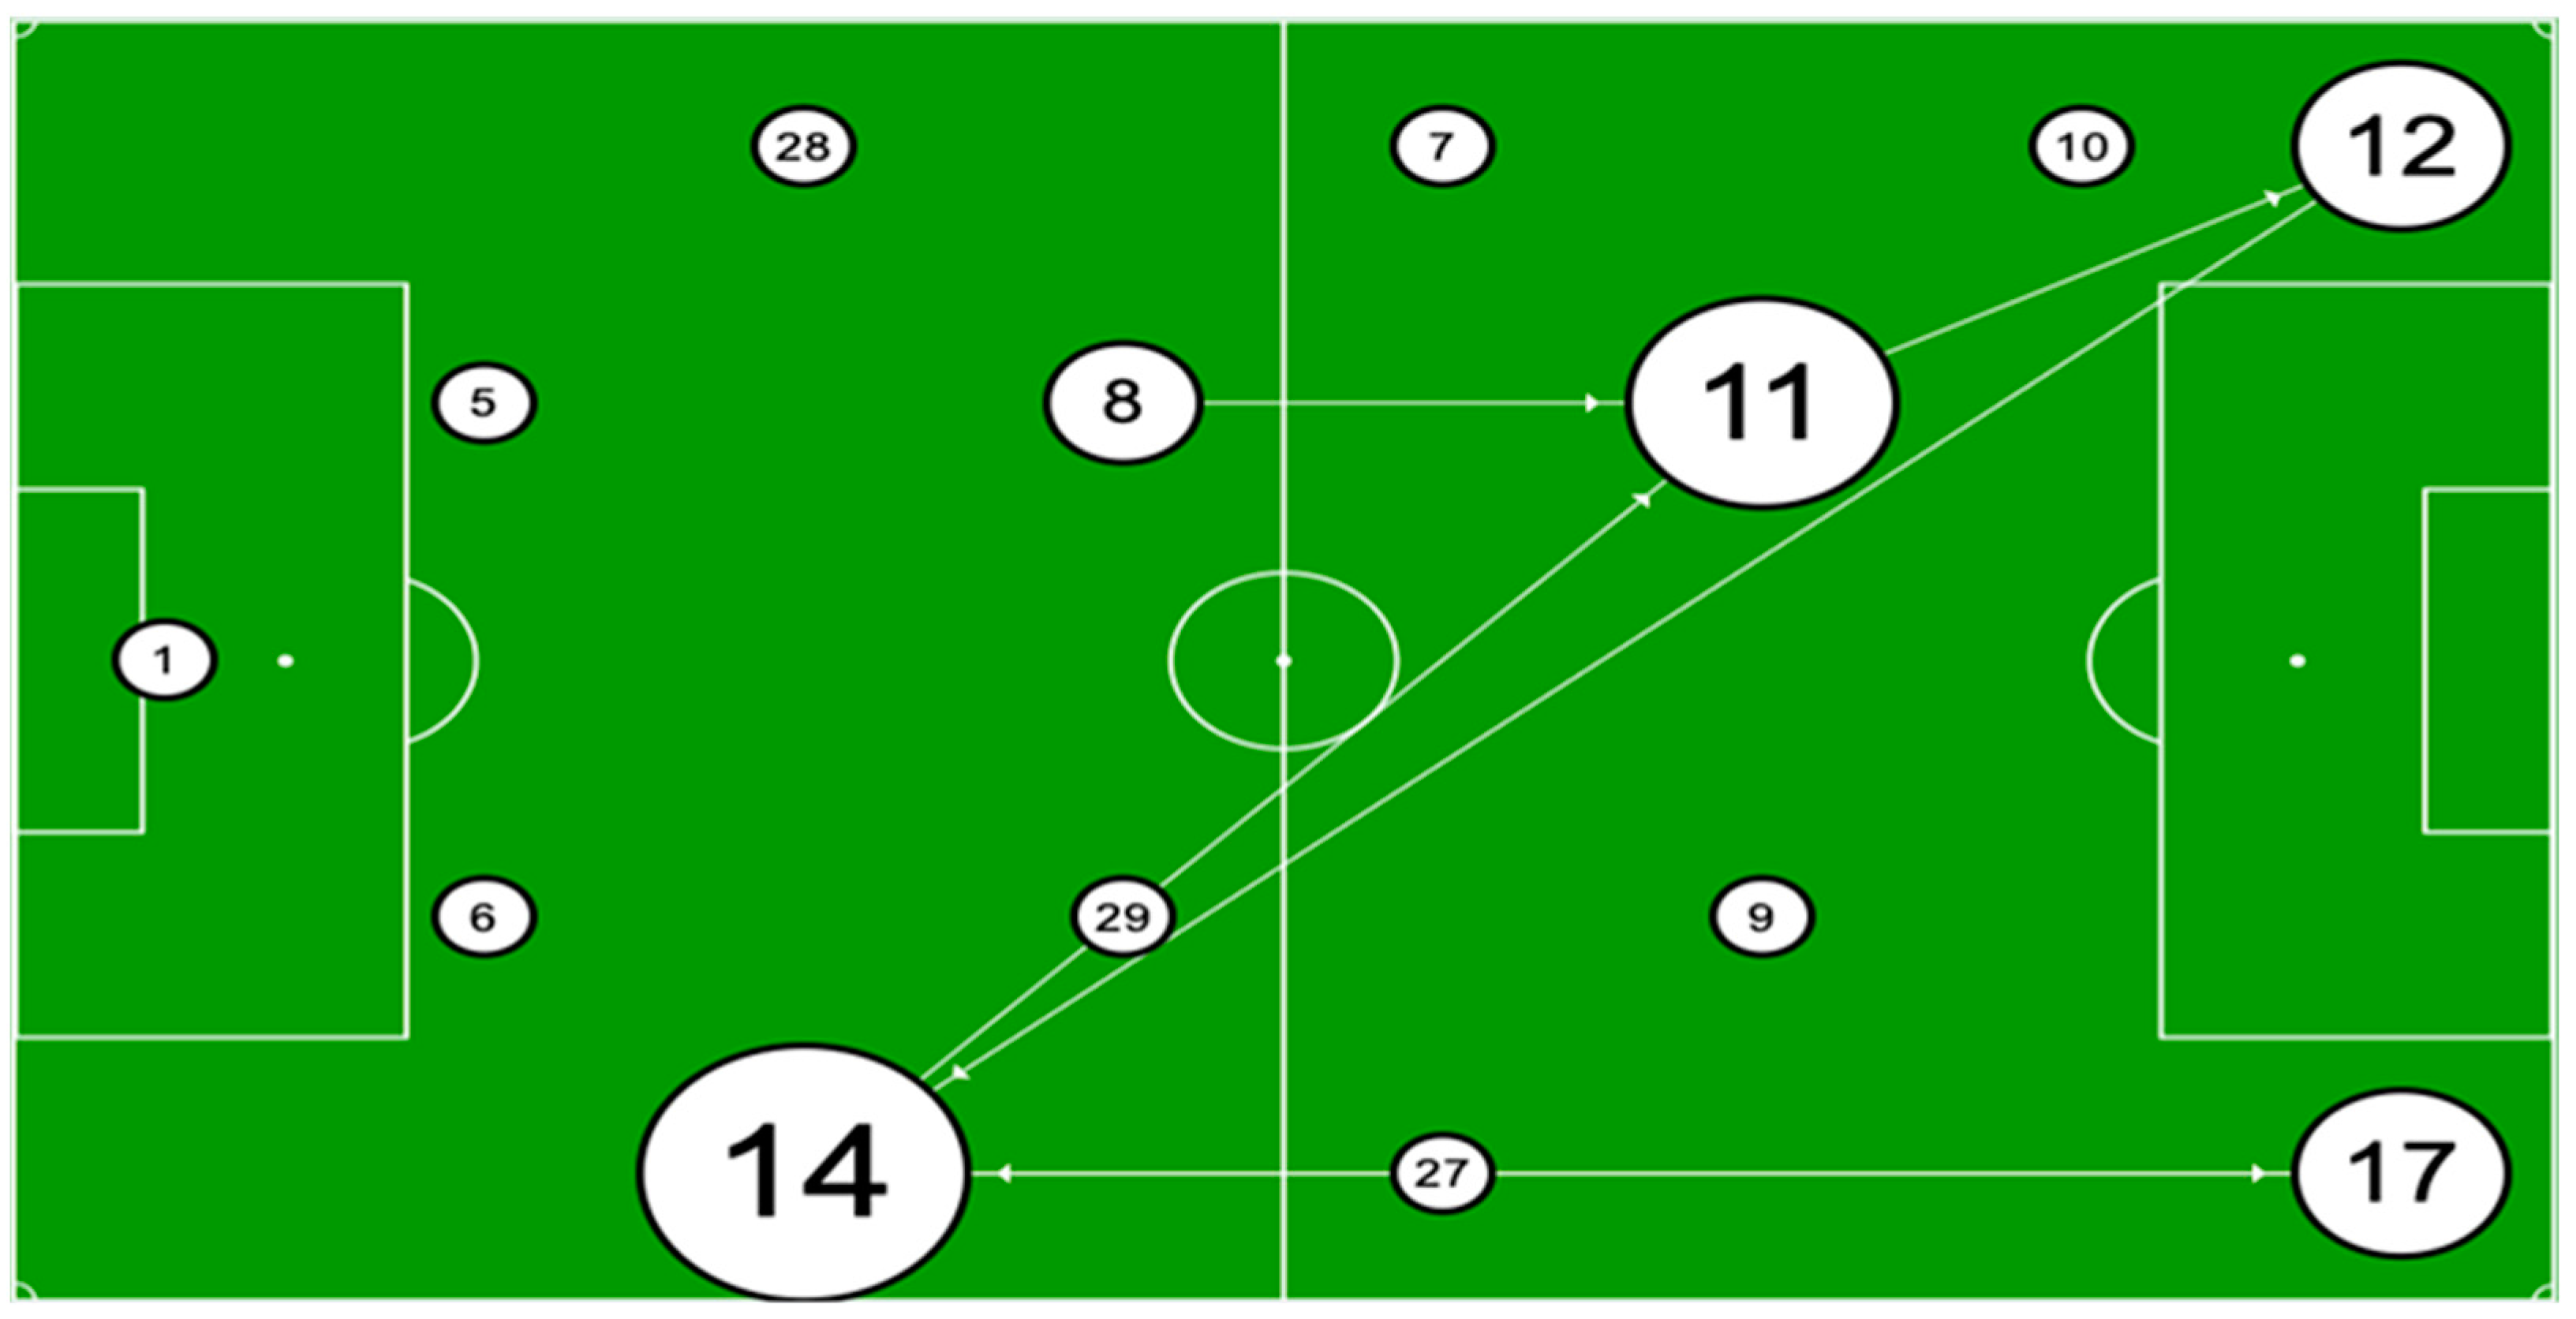
3.3. Centroid Players’ Interaction Networks of Both Teams
4. Discussion
5. Conclusions
6. Limitations
Author Contributions
Funding
Institutional Review Board Statement
Informed Consent Statement
Data Availability Statement
Conflicts of Interest
Appendix A

| Player | 1st | 2nd | G | B2 | B3 | B4 | ΣR | B5 | B1 | B6 | ΣG |
|---|---|---|---|---|---|---|---|---|---|---|---|
| 84 | 0.109 | 0.104 | 0.107 | 0.000 | 0.000 | 0.077 | 0.091 | 0.000 | 0.000 | 0.000 | 0.000 |
| 6 | 0.078 | 0.104 | 0.090 | 0.000 | 0.000 | 0.000 | 0.000 | 0.000 | 0.000 | 0.000 | 0.000 |
| 99 | 0.078 | 0.067 | 0.073 | 0.000 | 0.000 | 0.000 | 0.000 | 0.000 | 0.000 | 0.000 | 0.000 |
| 97 | 0.124 | 0.141 | 0.132 | 0.000 | 0.077 | 0.000 | 0.091 | 0.167 | 0.000 | 0.000 | 0.000 |
| 3 | 0.140 | 0.117 | 0.129 | 0.000 | 0.077 | 0.231 | 0.364 | 0.333 | 0.000 | 0.000 | 0.000 |
| 27 | 0.016 | 0.000 | 0.008 | 0.000 | 0.000 | 0.000 | 0.000 | 0.000 | 0.077 | 0.000 | 0.077 |
| 61 | 0.098 | 0.086 | 0.093 | 0.000 | 0.000 | 0.000 | 0.000 | 0.167 | 0.000 | 0.000 | 0.000 |
| 83 | 0.047 | 0.086 | 0.065 | 0.000 | 0.000 | 0.000 | 0.000 | 0.000 | 0.077 | 0.000 | 0.077 |
| 8 | 0.124 | 0.086 | 0.107 | 0.000 | 0.000 | 0.077 | 0.091 | 0.000 | 0.000 | 0.000 | 0.000 |
| 11 | 0.093 | 0.018 | 0.059 | 0.077 | 0.000 | 0.154 | 0.273 | 0.000 | 0.077 | 0.000 | 0.077 |
| 14 | 0.036 | 0.025 | 0.031 | 0.000 | 0.000 | 0.077 | 0.091 | 0.000 | 0.077 | 0.000 | 0.077 |
| Player | 1st | 2nd | G | L1 | L2 | L5 | ΣΡ | L4 | L3 |
|---|---|---|---|---|---|---|---|---|---|
| 14 | 0.110 | 0.123 | 0.116 | 0.000 | 0.077 | 0.077 | 0.154 | 0.000 | 0.154 |
| 5 | 0.205 | 0.145 | 0.178 | 0.000 | 0.000 | 0.000 | 0.000 | 0.000 | 0.000 |
| 6 | 0.175 | 0.141 | 0.159 | 0.000 | 0.000 | 0.000 | 0.000 | 0.000 | 0.000 |
| 1 | 0.065 | 0.048 | 0.057 | 0.000 | 0.000 | 0.000 | 0.000 | 0.000 | 0.000 |
| 28 | 0.110 | 0.097 | 0.104 | 0.000 | 0.000 | 0.077 | 0.077 | 0.000 | 0.000 |
| 11 | 0.049 | 0.070 | 0.059 | 0.000 | 0.000 | 0.077 | 0.077 | 0.000 | 0.077 |
| 7 | 0.065 | 0.022 | 0.045 | 0.077 | 0.000 | 0.000 | 0.077 | 0.000 | 0.000 |
| 8 | 0.099 | 0.066 | 0.084 | 0.000 | 0.000 | 0.000 | 0.000 | 0.077 | 0.077 |
| 29 | 0.065 | 0.101 | 0.082 | 0.000 | 0.000 | 0.000 | 0.000 | 0.000 | 0.000 |
| 27 | 0.030 | 0.040 | 0.035 | 0.000 | 0.077 | 0.000 | 0.077 | 0.000 | 0.000 |
| 9 | 0.027 | 0.018 | 0.022 | 0.000 | 0.077 | 0.000 | 0.077 | 0.077 | 0.000 |
| Player | 1st | 2nd | G | B2 | B3 | B4 | ΣΡ | B5 | B1 | B6 | ΣΓ |
|---|---|---|---|---|---|---|---|---|---|---|---|
| 84 | 2.495 | 1.747 | 2.363 | 0.000 | 0.000 | 1.444 | 1.083 | 0.000 | 0.000 | 0.000 | 0.000 |
| 6 | 1.966 | 1.863 | 2.427 | 0.000 | 0.000 | 0.000 | 0.000 | 0.000 | 0.000 | 0.000 | 0.000 |
| 99 | 2.203 | 1.877 | 2.656 | 0.000 | 0.000 | 0.000 | 0.000 | 0.000 | 0.000 | 0.000 | 0.000 |
| 97 | 2.662 | 2.198 | 2.972 | 0.000 | 4.333 | 0.000 | 1.040 | 5.200 | 0.000 | 0.000 | 0.000 |
| 3 | 2.272 | 1.797 | 2.801 | 0.000 | 13.000 | 2.600 | 2.000 | 6.500 | 0.000 | 0.000 | 0.000 |
| 27 | 0.974 | 0.000 | 0.806 | 0.000 | 0.000 | 0.000 | 0.000 | 0.000 | 4.333 | 0.000 | 4.333 |
| 61 | 2.721 | 1.646 | 2.605 | 0.000 | 0.000 | 0.000 | 0.000 | 2.600 | 0.000 | 0.000 | 0.000 |
| 83 | 1.515 | 1.500 | 2.023 | 0.000 | 0.000 | 0.000 | 0.000 | 0.000 | 4.333 | 0.000 | 4.333 |
| 8 | 2.122 | 1.569 | 2.478 | 0.000 | 0.000 | 1.857 | 1.368 | 0.000 | 0.000 | 0.000 | 0.000 |
| 11 | 2.228 | 1.008 | 2.325 | 13.000 | 0.000 | 2.167 | 2.000 | 0.000 | 4.333 | 0.000 | 4.333 |
| 14 | 1.201 | 0.969 | 1.328 | 0.000 | 0.000 | 1.625 | 1.300 | 0.000 | 2.167 | 0.000 | 2.167 |
| Player | 1st | 2nd | G | L1 | L2 | L5 | ΣΡ | L4 | L3 |
|---|---|---|---|---|---|---|---|---|---|
| 14 | 5.027 | 2.172 | 4.197 | 0.000 | 2.167 | 13.000 | 1.857 | 0.000 | 3.250 |
| 5 | 5.884 | 2.506 | 4.410 | 0.000 | 0.000 | 0.000 | 0.000 | 0.000 | 0.000 |
| 6 | 5.950 | 2.416 | 4.426 | 0.000 | 0.000 | 0.000 | 0.000 | 0.000 | 0.000 |
| 1 | 4.461 | 1.650 | 3.478 | 0.000 | 0.000 | 0.000 | 0.000 | 0.000 | 0.000 |
| 28 | 4.085 | 2.130 | 3.742 | 0.000 | 0.000 | 1.300 | 0.520 | 0.000 | 0.000 |
| 11 | 2.568 | 1.374 | 2.558 | 0.000 | 0.000 | 4.333 | 1.083 | 0.000 | 2.167 |
| 7 | 2.648 | 1.149 | 2.170 | 13.000 | 0.000 | 0.000 | 2.167 | 0.000 | 0.000 |
| 8 | 3.803 | 1.704 | 3.153 | 0.000 | 0.000 | 0.000 | 0.000 | 2.167 | 1.300 |
| 29 | 2.938 | 1.963 | 3.140 | 0.000 | 0.000 | 0.000 | 0.000 | 0.000 | 0.000 |
| 27 | 3.208 | 1.584 | 3.111 | 0.000 | 4.333 | 0.000 | 4.333 | 0.000 | 0.000 |
| 9 | 1.911 | 0.896 | 1.837 | 0.000 | 13.000 | 0.000 | 13.000 | 4.333 | 0.000 |
| Player | 1st | 2nd | G | B2 | B3 | B4 | ΣΡ | B5 | B1 | B6 | ΣΓ |
|---|---|---|---|---|---|---|---|---|---|---|---|
| 84 | 0.135 | 0.125 | 0.166 | 0.000 | 0.000 | 0.000 | 0.000 | 0.000 | 0.000 | 0.000 | 0.000 |
| 6 | 0.071 | 0.050 | 0.077 | 0.000 | 0.000 | 0.000 | 0.000 | 0.000 | 0.000 | 0.000 | 0.000 |
| 99 | 0.026 | 0.013 | 0.013 | 0.000 | 0.000 | 0.000 | 0.000 | 0.000 | 0.000 | 0.000 | 0.000 |
| 97 | 0.179 | 0.074 | 0.192 | 0.000 | 0.000 | 0.000 | 0.000 | 0.000 | 0.000 | 0.000 | 0.000 |
| 3 | 0.122 | 0.163 | 0.263 | 0.000 | 0.006 | 0.038 | 0.077 | 0.006 | 0.000 | 0.000 | 0.000 |
| 27 | 0.000 | 0.000 | 0.000 | 0.000 | 0.000 | 0.000 | 0.000 | 0.000 | 0.019 | 0.000 | 0.019 |
| 61 | 0.218 | 0.008 | 0.119 | 0.000 | 0.000 | 0.000 | 0.000 | 0.000 | 0.000 | 0.000 | 0.000 |
| 83 | 0.026 | 0.111 | 0.068 | 0.000 | 0.000 | 0.000 | 0.000 | 0.000 | 0.013 | 0.000 | 0.013 |
| 8 | 0.022 | 0.059 | 0.054 | 0.000 | 0.000 | 0.000 | 0.000 | 0.000 | 0.000 | 0.000 | 0.000 |
| 11 | 0.087 | 0.000 | 0.119 | 0.000 | 0.000 | 0.038 | 0.077 | 0.000 | 0.006 | 0.000 | 0.006 |
| 14 | 0.000 | 0.000 | 0.000 | 0.000 | 0.000 | 0.019 | 0.026 | 0.000 | 0.000 | 0.000 | 0.000 |
| Player | 1st | 2nd | G | L1 | L2 | L5 | ΣΡ | L4 | L3 |
|---|---|---|---|---|---|---|---|---|---|
| 14 | 0.186 | 0.269 | 0.343 | 0.000 | 0.000 | 0.019 | 0.077 | 0.000 | 0.038 |
| 5 | 0.311 | 0.295 | 0.314 | 0.000 | 0.000 | 0.000 | 0.000 | 0.000 | 0.000 |
| 6 | 0.250 | 0.321 | 0.288 | 0.000 | 0.000 | 0.000 | 0.000 | 0.000 | 0.000 |
| 1 | 0.000 | 0.000 | 0.000 | 0.000 | 0.000 | 0.000 | 0.000 | 0.000 | 0.000 |
| 28 | 0.045 | 0.301 | 0.131 | 0.000 | 0.000 | 0.000 | 0.000 | 0.000 | 0.000 |
| 11 | 0.006 | 0.103 | 0.109 | 0.000 | 0.000 | 0.026 | 0.064 | 0.000 | 0.032 |
| 7 | 0.006 | 0.000 | 0.000 | 0.000 | 0.000 | 0.000 | 0.000 | 0.000 | 0.000 |
| 8 | 0.038 | 0.179 | 0.103 | 0.000 | 0.000 | 0.000 | 0.000 | 0.000 | 0.000 |
| 29 | 0.000 | 0.013 | 0.038 | 0.000 | 0.000 | 0.000 | 0.000 | 0.000 | 0.000 |
| 27 | 0.000 | 0.013 | 0.000 | 0.000 | 0.013 | 0.000 | 0.064 | 0.000 | 0.000 |
| 9 | 0.000 | 0.000 | 0.000 | 0.000 | 0.013 | 0.000 | 0.038 | 0.013 | 0.000 |
| Player | 1st | 2nd | G | B2 | B3 | B4 | ΣΡ | B5 | B1 | B6 | ΣΓ |
|---|---|---|---|---|---|---|---|---|---|---|---|
| 84 | 0.078 | 0.104 | 0.090 | 0.000 | 0.000 | 0.077 | 0.091 | 0.000 | 0.000 | N/A | 0.000 |
| 6 | 0.067 | 0.067 | 0.067 | 0.000 | 0.000 | 0.000 | 0.000 | 0.000 | 0.000 | N/A | 0.000 |
| 99 | 0.036 | 0.037 | 0.037 | 0.000 | 0.000 | 0.000 | 0.000 | 0.000 | 0.000 | N/A | 0.000 |
| 97 | 0.098 | 0.092 | 0.096 | 0.000 | 0.000 | 0.000 | 0.000 | 0.167 | 0.000 | N/A | 0.000 |
| 3 | 0.145 | 0.123 | 0.135 | 0.000 | 0.077 | 0.154 | 0.273 | 0.333 | 0.000 | N/A | 0.000 |
| 27 | 0.036 | 0.000 | 0.020 | 0.077 | 0.000 | 0.000 | 0.091 | 0.000 | 0.154 | N/A | 0.154 |
| 61 | 0.098 | 0.055 | 0.079 | 0.000 | 0.000 | 0.000 | 0.000 | 0.000 | 0.000 | N/A | 0.000 |
| 83 | 0.088 | 0.117 | 0.101 | 0.000 | 0.000 | 0.000 | 0.000 | 0.000 | 0.077 | N/A | 0.077 |
| 8 | 0.124 | 0.080 | 0.104 | 0.000 | 0.000 | 0.077 | 0.091 | 0.000 | 0.000 | N/A | 0.000 |
| 11 | 0.093 | 0.055 | 0.076 | 0.000 | 0.000 | 0.154 | 0.182 | 0.000 | 0.077 | N/A | 0.077 |
| 14 | 0.073 | 0.031 | 0.053 | 0.000 | 0.077 | 0.154 | 0.273 | 0.000 | 0.000 | N/A | 0.000 |
| Player | 1st | 2nd | G | L1 | L2 | L5 | ΣΡ | L4 | L3 |
|---|---|---|---|---|---|---|---|---|---|
| 14 | 0.118 | 0.123 | 0.120 | 0.000 | 0.000 | 0.077 | 0.077 | 0.000 | 0.154 |
| 5 | 0.183 | 0.115 | 0.151 | 0.000 | 0.000 | 0.000 | 0.000 | 0.000 | 0.000 |
| 6 | 0.152 | 0.128 | 0.141 | 0.000 | 0.000 | 0.000 | 0.000 | 0.000 | 0.000 |
| 1 | 0.034 | 0.026 | 0.031 | 0.000 | 0.000 | 0.000 | 0.000 | 0.000 | 0.000 |
| 28 | 0.106 | 0.093 | 0.100 | 0.000 | 0.000 | 0.000 | 0.000 | 0.000 | 0.000 |
| 11 | 0.053 | 0.088 | 0.069 | 0.000 | 0.000 | 0.077 | 0.077 | 0.077 | 0.154 |
| 7 | 0.068 | 0.022 | 0.047 | 0.000 | 0.000 | 0.000 | 0.000 | 0.000 | 0.000 |
| 8 | 0.110 | 0.084 | 0.098 | 0.000 | 0.000 | 0.077 | 0.077 | 0.000 | 0.000 |
| 29 | 0.084 | 0.075 | 0.080 | 0.000 | 0.077 | 0.000 | 0.077 | 0.000 | 0.000 |
| 27 | 0.049 | 0.044 | 0.047 | 0.077 | 0.077 | 0.000 | 0.154 | 0.000 | 0.000 |
| 9 | 0.042 | 0.031 | 0.037 | 0.000 | 0.077 | 0.000 | 0.077 | 0.077 | 0.000 |
| Player | 1st | 2nd | G | B2 | B3 | B4 | ΣΡ | B5 | B1 | B6 | ΣΓ |
|---|---|---|---|---|---|---|---|---|---|---|---|
| 84 | 0.206 | 0.327 | 0.280 | −1.000 | 0.000 | 0.190 | 0.145 | 0.000 | 0.000 | −1.000 | 0.000 |
| 6 | 0.222 | 0.390 | 0.300 | −1.000 | 0.000 | 0.000 | 0.000 | 0.000 | 0.000 | −1.000 | 0.000 |
| 99 | 0.307 | 0.255 | 0.297 | −1.000 | 0.000 | 0.000 | 0.000 | 0.000 | 0.000 | −1.000 | 0.000 |
| 97 | 0.447 | 0.455 | 0.472 | −1.000 | −1.000 | 0.000 | 0.338 | 0.369 | 0.000 | −1.000 | 0.000 |
| 3 | 0.455 | 0.325 | 0.381 | −1.000 | 0.000 | 0.629 | 0.639 | 0.652 | 0.000 | −1.000 | 0.000 |
| 27 | 0.036 | 0.000 | 0.026 | −1.000 | 0.000 | 0.000 | 0.000 | 0.000 | 0.471 | −1.000 | 0.471 |
| 61 | 0.312 | 0.291 | 0.319 | −1.000 | 0.000 | 0.000 | 0.000 | 0.326 | 0.000 | −1.000 | 0.000 |
| 83 | 0.143 | 0.290 | 0.203 | −1.000 | 0.000 | 0.000 | 0.000 | 0.000 | 0.673 | −1.000 | 0.673 |
| 8 | 0.414 | 0.228 | 0.336 | −1.000 | 0.000 | 0.363 | 0.338 | 0.000 | 0.000 | −1.000 | 0.000 |
| 11 | 0.305 | 0.059 | 0.199 | −1.000 | 0.000 | 0.572 | 0.517 | 0.000 | 0.404 | −1.000 | 0.404 |
| 14 | 0.075 | 0.063 | 0.080 | −1.000 | 0.000 | 0.330 | 0.273 | 0.000 | 0.404 | −1.000 | 0.404 |
| Player | 1st | 2nd | G | L1 | L2 | L5 | ΣΡ | L4 | L3 |
|---|---|---|---|---|---|---|---|---|---|
| 14 | 0.285 | 0.340 | 0.309 | −1.000 | −0.707 | 0.000 | −0.333 | 0.000 | 0.614 |
| 5 | 0.572 | 0.460 | 0.536 | −1.000 | 0.000 | 0.000 | 0.000 | 0.000 | 0.000 |
| 6 | 0.546 | 0.502 | 0.530 | −1.000 | 0.000 | 0.000 | 0.000 | 0.000 | 0.000 |
| 1 | 0.291 | 0.196 | 0.265 | −1.000 | 0.000 | 0.000 | 0.000 | 0.000 | 0.000 |
| 28 | 0.276 | 0.272 | 0.280 | −1.000 | 0.000 | −0.577 | −0.333 | 0.000 | 0.000 |
| 11 | 0.112 | 0.148 | 0.135 | −1.000 | 0.000 | −0.577 | −0.667 | 0.000 | 0.350 |
| 7 | 0.148 | 0.036 | 0.116 | −1.000 | 0.000 | 0.000 | −0.333 | 0.000 | 0.000 |
| 8 | 0.268 | 0.197 | 0.252 | −1.000 | 0.000 | 0.000 | 0.000 | 1.000 | 0.264 |
| 29 | 0.143 | 0.355 | 0.251 | −1.000 | 0.000 | 0.000 | 0.000 | 0.000 | 0.000 |
| 27 | 0.061 | 0.104 | 0.083 | −1.000 | −0.707 | 0.000 | −0.333 | 0.000 | 0.000 |
| 9 | 0.043 | 0.032 | 0.042 | −1.000 | 0.000 | 0.000 | 0.000 | 0.000 | 0.000 |
| Mathematical Model | 1st | 2nd | G | B2 | B3 | B4 | ∑R | B5 | B1 | B6 | ∑G |
|---|---|---|---|---|---|---|---|---|---|---|---|
| Network Density | 0.118 | 0.128 | 0.122 | 0.005 | 0.011 | 0.044 | 0.030 | 0.016 | 0.022 | N/A | 0.022 |
| Network Heterogeneity | 0.630 | 0.606 | 0.574 | 3.606 | 2.449 | 1.581 | 1.535 | 1.700 | 1.581 | inf | 1.581 |
| Reciprocity | 0.622 | 0.491 | 0.635 | N/A | N/A | 0.250 | 0.182 | 0.333 | N/A | N/A | N/A |
| (out-in)-Assortativity Coefficient | 0.166 | 0.045 | 0.028 | inf | inf | −0.290 | −0.311 | −0.333 | −0.333 | inf | −0.333 |
| (in-out)-Assortativity Coefficient | 0.049 | −0.056 | −0.076 | inf | −1.000 | −0.143 | −0.360 | −0.304 | N/A | N/A | N/A |
| in-Assortativity Coefficient | 0.136 | −0.007 | 0.022 | −1.000 | −0.333 | −0.333 | −0.349 | −0.557 | −0.714 | N/A | −0.714 |
| out-Assortativity Coefficient | 0.061 | 0.046 | −0.001 | −1.000 | −0.333 | −0.362 | −0.485 | −0.333 | inf | N/A | inf |
| Mathematical Model. | 1st | 2nd | G | L1 | L2 | L5 | ∑R | L4 | L3 |
|---|---|---|---|---|---|---|---|---|---|
| Network Density | 0.085 | 0.113 | 0.096 | 0.005 | 0.016 | 0.022 | 0.044 | 0.016 | 0.033 |
| Network Heterogeneity | 0.853 | 0.630 | 0.711 | 3.606 | 1.915 | 1.581 | 1.09 | 1.915 | 1.453 |
| Reciprocity | 0.700 | 0.687 | 0.735 | N/A | N/A | N/A | N/A | N/A | 0.333 |
| (out-in)-Assortativity Coefficient | 0.037 | 0.017 | 0.013 | inf | inf | inf | 0.333 | inf | −0.333 |
| (in-out)-Assortativity Coefficient | 0.001 | 0.037 | −0.008 | inf | −0.500 | −0.333 | −0.043 | −0.500 | −0.286 |
| in-Assortativity Coefficient | −0.024 | −0.021 | −0.032 | −1.000 | −0.200 | −0.143 | −0.418 | −0.200 | −0.600 |
| out-Assortativity Coefficient | 0.071 | 0.100 | 0.045 | −1.000 | −0.200 | −0.143 | −0.418 | −0.200 | −0.500 |
References
- Wasserman, S.; Faust, K. Social Network Analysis: Methods and Applications; Cambridge University Press: Cambridge, UK, 1994. [Google Scholar]
- Clemente, F.; Martins, F.L.; Mendes, R. Social Network Analysis Applied to Team Sports Analysis; Springer International Publishing: Cham, Switzerland, 2016; ISBN 978-3-319-25854-6. [Google Scholar]
- Gama, J.; Passos, P.; Davids, K.; Relvas, H.; Ribeiro, J.; Vaz, V.; Dias, G. Network Analysis and Intra-Team Activity in Attacking Phases of Professional Football. Int. J. Perform. Anal. Sport 2014, 14, 692–708. [Google Scholar] [CrossRef]
- Ribeiro, J.; Silva, P.; Duarte, R.; Davids, K.; Garganta, J. Team Sports Performance Analysed Through the Lens of Social Network Theory: Implications for Research and Practice. Sports Med. 2017, 47, 1689–1696. [Google Scholar] [CrossRef]
- Medina, P.; Carrasco, S.; Rogan, J.; Montes, F.; Meisel, J.D.; Lemoine, P.; Lago Peñas, C.; Valdivia, J.A. Is a Social Network Approach Relevant to Football Results? Chaos Solitons Fractals 2021, 142, 110369. [Google Scholar] [CrossRef]
- Dhand, A.; McCafferty, L.; Grashow, R.; Corbin, I.M.; Cohan, S.; Whittington, A.J.; Connor, A.; Baggish, A.; Weisskopf, M.; Zafonte, R.; et al. Social Network Structure and Composition in Former NFL Football Players. Sci. Rep. 2021, 11, 1630. [Google Scholar] [CrossRef] [PubMed]
- Gama, J.; Dias, G.; Couceiro, M.; Sousa, T.; Vaz, V. Networks Metrics and Ball Possession in Professional Football. Complexity 2016, 21, 342–354. [Google Scholar] [CrossRef]
- Silva, F.G.M.; Correia, A.F.P.P.; Clemente, F.; Martins, F.L.; Nguyen, Q.T. Ultimate Performance Analysis Tool (UPATO) Implementation of Network Measures Based on Adjacency Matrices for Team Sports; Springer: Berlin/Heidelberg, Germany, 2019; ISBN 978-3-319-99752-0. [Google Scholar]
- Gama, J.; Dias, G.; Passos, P.; Couceiro, M.; Davids, K. Homogeneous Distribution of Passing between Players of a Team Predicts Attempts to Shoot at Goal in Association Football: A Case Study with 10 Matches. Nonlinear Dyn. Psychol. Life Sci. 2020, 24, 353–365. [Google Scholar]
- Martins, F.; Gomes, R.; Lopes, V.; Silva, F.; Mendes, R. Node and Network Entropy-A Novel Mathematical Model for Pattern Analysis of Team Sports Behavior. Mathematics 2020, 8, 1543. [Google Scholar] [CrossRef]
- Gama, J.; Couceiro, M.; Dias, G.; Vaz, V. Small-world networks in professional football: Conceptual model and data. Eur. J. Hum. Mov. 2015, 35, 85–113. [Google Scholar]
- Clemente, F.; Couceiro, M.S.; Martins, F.L.; Mendes, R.; Figueiredo, A. Sistemas Inteligentes Para El Análisis de Fútbol: Centroide Ponderado. Ing. E Investig. 2014, 34, 70–75. [Google Scholar] [CrossRef]
- Gama, J.; Dias, G.; Couceiro, M.; Belli, R.; Vaz, V.; Figueiredo, A.; Ribeiro, J. Networks and Centroid Metrics for Understanding Football. S. Afr. J. Res. Sport Phys. Educ. Recreat. 2016, 38, 75–90. [Google Scholar] [CrossRef]
- Gama, J.; Dias, G.; Couceiro, M.; Passos, P.; Davids, K.; Ribeiro, J. An ecological dynamics rationale to explain home advantage in professional football. Int. J. Mod. Phys. 2016, 27, 1650102. [Google Scholar] [CrossRef]
- Frencken, W.; de Poel, H.; Visscher, C.; Lemmink, K. Variability of Inter-Team Distances Associated with Match Events in Elite-Standard Soccer. J. Sports Sci. 2012, 30, 1207–1213. [Google Scholar] [CrossRef] [PubMed]
- Pratas, J.M.; Volossovitch, A.; Carita, A.I. The Effect of Performance Indicators on the Time the First Goal Is Scored in Football Matches. Int. J. Perform. Anal. Sport 2016, 16, 347–354. [Google Scholar] [CrossRef]
- Sarmento, H.; Clemente, F.M.; Araújo, D.; Davids, K.; McRobert, A.; Figueiredo, A. What Performance Analysts Need to Know About Research Trends in Association Football (2012–2016): A Systematic Review. Sports Med. 2017, 48, 799–836. [Google Scholar] [CrossRef]
- Memmert, D.; Lemmink, K.A.P.M.; Sampaio, J. Current Approaches to Tactical Performance Analyses in Soccer Using Position Data. Sports Med. 2017, 47, 1–10. [Google Scholar] [CrossRef] [PubMed]
- Janetzko, H.; Sacha, D.; Stein, M.; Schreck, T.; Keim, D.A.; Deussen, O. Feature-Driven Visual Analytics of Soccer Data. In Proceedings of the 2014 IEEE Conference on Visual Analytics Science and Technology (VAST), Paris, France, 25–31 October 2014; pp. 13–22. [Google Scholar] [CrossRef]
- Carpita, M.; Sandri, M.; Simonetto, A.; Zuccolotto, P. Discovering the Drivers of Football Match Outcomes with Data Mining. Qual. Technol. Quant. Manag. 2016, 12, 561–577. [Google Scholar] [CrossRef]
- Di Salvo, V.; Baron, R.; Tschan, H.; Montero, F.J.C.; Bachl, N.; Pigozzi, F. Performance Characteristics According to Playing Position in Elite Soccer. Int. J. Sports Med. 2007, 28, 222–227. [Google Scholar] [CrossRef]
- Garganta, J. Trends of Tactical Performance Analysis in Team Sports: Bridging the Gap between Research, Training and Competition. Rev. Port. Ciências Desporto 2009, 9, 81–89. [Google Scholar] [CrossRef]
- Herold, M.; Kempe, M.; Bauer, P.; Meyer, T. Attacking Key Performance Indicators in Soccer: Current Practice and Perceptions from the Elite to Youth Academy Level. J. Sports Sci. Med. 2021, 20, 158–169. [Google Scholar] [CrossRef]
- Martins, F.M.L.; Silva, F.; Clemente, F.; Gomes, A.J.P.; Correia, A.; Nguyen, Q.; Sequeiros, J.B.; Ribeiro, J.S.; Lopes, V.F. Ultimate Performance Analysis Tool (uPATO). 2018. Available online: http://uPATO.it.ubi.pt (accessed on 12 June 2022).
- Mendes, R.; Clemente, F.; Rocha, R.; Damásio, S. Observação Como Instrumento No Processo de Avaliação Em Educação Física. Rev. Científica Exedra 2012, 6, 57–70. [Google Scholar]
- Martins, F.; Gomes, R.; Lopes, V.; Silva, F.; Mendes, R. Mathematical Models to Measure the Variability of Nodes and Networks in Team Sports. Entropy 2021, 23, 1072. [Google Scholar] [CrossRef] [PubMed]
- Buldú, J.M.; Busquets, J.; Martínez, J.H.; Herrera-Diestra, J.L.; Echegoyen, I.; Galeano, J.; Luque, J. Using Network Science to Analyse Football Passing Networks: Dynamics, Space, Time, and the Multilayer Nature of the Game. Front. Psychol. 2018, 9, 1900. [Google Scholar] [CrossRef] [PubMed] [Green Version]
- Liu, H.; Hopkins, W.G.; Gómez, M.A. Modelling Relationships between Match Events and Match Outcome in Elite Football. Eur. J. Sport Sci. 2016, 16, 516–525. [Google Scholar] [CrossRef] [PubMed]
- Penumala, R.; Sivagami, M.; Srinivasan, S. Automated Goal Score Detection in Football Match Using Key Moments. Procedia Comput. Sci. 2019, 165, 492–501. [Google Scholar] [CrossRef]
- De Brito Souza, D.; López-Del Campo, R.; Blanco-Pita, H.; Resta, R.; del Coso, J. An Extensive Comparative Analysis of Successful and Unsuccessful Football Teams in LaLiga. Front. Psychol. 2019, 10, 2566. [Google Scholar] [CrossRef] [PubMed] [Green Version]
| Mathematical Models | Abbreviation | Analysis Type |
|---|---|---|
| Betweenness Centrality | BC | Micro |
| Closeness Centrality | CC | |
| Degree Centrality | DC | |
| Degree Prestige | DP | Macro |
| Eigenvector Centrality | EC | |
| Assortativity Coefficient | AC | |
| Network Density | ND | |
| Network Heterogeneity | NH | |
| Reciprocity | R |
| Mathematical Model | Player Performance |
|---|---|
| Team A’s Degree Centrality (DC): | Player 3 obtained higher DC values in two critical game moments (B4 e B5) and also in ΣR. |
| Team B’s Degree Centrality (DC): | Player 14 reached the highest value on ΣR, and on critical event: L3. |
| Team A’s Closeness Centrality (CC): | Players 97 and 3 reached their highest values of CC, in critical events B3 and B5. |
| Team B’s Closeness Centrality (CC): | Players 14, 5 and 6 obtained the highest levels of CC. Even though players 5 and 6 were the most relevant on field, they did not participate in the previously established critical events. |
| Team A’s Betweenness Centrality (BC): | Player 3′s values for the previously stated critical events were all inferior to those obtained in the global analysis of results. |
| Team B’s Betweenness Centrality (BC): | The analysis of critical events did not translate into concrete values for mathematical model BC. |
| Team A’s Degree Prestige (DP): | Player 3 achieved his highest EC values in critical events B4, B5 and in ΣR |
| Team B’s Degree Prestige (DP): | Regardless of how essential for the team’s performance players 5 and 6 were, they did not take part in the critical events. Besides, only players 11, 27 and 9 obtained higher DP values in ΣR, than in the complete analysis of the game. |
| Team A’s Eigenvector Centrality (EC): | Players 27, 61, 11 and 14 reached better values in ΣG analysis. |
| Team B’s Eigenvector Centrality (EC): | In a global analysis, athletes 14, 5 and 6 were the team’s centroid players and the ones who interacted the most with their teammates. |
| Mathematical Model | Team Performance |
|---|---|
| Team A’s Network Density (ND): | The team’s highest ND value was achieved in ΣR. |
| Team B’s Network Density (ND): | Team B achieved a higher ND value in the ΣR than team A did in both ΣR and ΣG. The critical event analysis was very close to 0. |
| Team A’s Network Heterogeneity: | In critical event B2, team A obtained the highest NH value. This team displayed a lesser degree of cooperation between players in the critical event analysis. |
| Team B’s Network Heterogeneity: | This team presented a great degree of deviance in the number of interactions each player was involved in when in critical moments, more specifically in the L1 moment, where they obtained their highest value of NH. |
| Team A’s Reciprocity: | Regarding critical event analysis, it was observed that, for moments B2, B3, B1, B6, and ΣG there was no calculation result, which may indicate a limitation in this model for this specific metric. |
| Team A’s in—Assortativity Coefficient Matrix of Values: | The in-AC model values calculated for team A were, for the most part, negative. However, this team also reached the most positive value (in the first half) and also the most negative (ΣG). |
| Team B’s in—Assortativity Coefficient Matrix of Values | The value calculated for critical event L1 was the lowest in this regard, which means that the players who received the ball the most, did not pass it to the players which passed it the most. The values obtained in the analysis of both halves and of the full game presented the values closest to 0, this team in particular kept their values very close to 0. |
| Team A’s out—Assortativity Coefficient Matrixes of values | This team obtained the closest value to the very worst value possible in the ΣR, whereas team B achieved their best value for this model in the second half. Because team A’s value was so close to 0, it ended up as not being relevant to the graphical representation of the mathematical model. |
| Team B’s out—Assortativity Coefficient Matrix of values: | For the out-AC model, team B reached their highest value in the 2nd half of the game, that is, the players responsible for the most passes were interconnected between each other. However, the same did not occur during event L1. |
| Team A’s (out-in)—Assortativity Coefficient values: | Values were not calculated for moments B1, B6 and ΣG, as such it is assumed that this model possesses some limitations for this metric’s calculation. |
| Team B’s (out-in)—Assortativity Coefficient values: | Team B obtained the highest (out-in)-AC value in the ΣR analysis, that is, in the sum of the shots they took. It was in both ΣR and ΣG analysis that the lowest values were achieved. It is important to stress that team B obtained the most consistent (out-in) value. |
| Team A’s (in-out)—Assortativity Coefficient Matrix of values: | Out of both teams, team A was the one who achieved the most positive value (in the 1st half of the game) but also the most negative value (ΣR). Besides, B1, B6 and ΣG did not obtain a value due to the possible limitation this mathematical value possesses to this performance metric’s calculation. |
| Team B’s (in-out)—Assortativity Coefficient Matrix of values: | In the both halves of the game, this team achieved (in-out)—AC values very close to 0, which means that the players did not achieve a strong connection with the players they interacted with in the game. It was in events L2 and L4, that the players who received the most passes displayed the lowest values of connection with the players who had the most passes. |
Publisher’s Note: MDPI stays neutral with regard to jurisdictional claims in published maps and institutional affiliations. |
© 2022 by the authors. Licensee MDPI, Basel, Switzerland. This article is an open access article distributed under the terms and conditions of the Creative Commons Attribution (CC BY) license (https://creativecommons.org/licenses/by/4.0/).
Share and Cite
Assunção, D.; Pedrosa, I.; Mendes, R.; Martins, F.; Francisco, J.; Gomes, R.; Dias, G. Social Network Analysis: Mathematical Models for Understanding Professional Football in Game Critical Moments—An Exploratory Study. Appl. Sci. 2022, 12, 6433. https://doi.org/10.3390/app12136433
Assunção D, Pedrosa I, Mendes R, Martins F, Francisco J, Gomes R, Dias G. Social Network Analysis: Mathematical Models for Understanding Professional Football in Game Critical Moments—An Exploratory Study. Applied Sciences. 2022; 12(13):6433. https://doi.org/10.3390/app12136433
Chicago/Turabian StyleAssunção, Diana, Isabel Pedrosa, Rui Mendes, Fernando Martins, João Francisco, Ricardo Gomes, and Gonçalo Dias. 2022. "Social Network Analysis: Mathematical Models for Understanding Professional Football in Game Critical Moments—An Exploratory Study" Applied Sciences 12, no. 13: 6433. https://doi.org/10.3390/app12136433
APA StyleAssunção, D., Pedrosa, I., Mendes, R., Martins, F., Francisco, J., Gomes, R., & Dias, G. (2022). Social Network Analysis: Mathematical Models for Understanding Professional Football in Game Critical Moments—An Exploratory Study. Applied Sciences, 12(13), 6433. https://doi.org/10.3390/app12136433