Article

Development of Screen-Printable Nafion Dispersion for Electrochemical Sensor

1
Brewer Science, Inc., 2401 Brewer Drive, Rolla, MO 65401, USA
2
Jordan Valley Innovation Center, Missouri State University, 524 North Boonville Avenue, Springfield, MO 65806, USA
*
Author to whom correspondence should be addressed.
Appl. Sci. 2022, 12(13), 6533; https://doi.org/10.3390/app12136533
Submission received: 27 May 2022 / Revised: 25 June 2022 / Accepted: 26 June 2022 / Published: 28 June 2022
(This article belongs to the Section Materials Science and Engineering)

Abstract

:
A modified Nafion dispersion for direct screen printing was developed and characterized. Commercial Nafion solution was neutralized to its sodium form and the solvent was replaced by a screen-printing-compatible solvent. The modified Nafion dispersion has optimized rheological properties including shear-thinning behavior, thixotropy, and moderate yield stress. The elemental composition and chemical states of the modified Nafion were characterized by X-ray photoelectron spectroscopy (XPS). The chemical state and composition of the modified Nafion remained the same as those of commercial Nafion. The crystallinity of the cured membranes of both Nafion dispersions was evaluated by X-ray diffraction spectroscopy (XRD). It was found that the modified Nafion has lower crystallinity as compared to the commercial Nafion, and the degree of crystallinity increases with an increase in the curing temperature. The modified material was screen printed onto a commercial sensor as a cation-exchange membrane for the detection of lead Pb(II) in buffer solutions. The sensor showed good linearity in the range of 5 µg/L to 500 µg/L, with a detection limit of 2 µg/L for Pb(II) by square-wave anodic stripping voltammetry. This work demonstrates the possibility of printing Nafion on a large scale in a wide range of fields, such as printed electrochemical sensors.

1. Introduction

Nafion™ material is a perfluorosulfonic acid ion-exchange polymer that was invented in 1955 by DuPont. The polymer is produced by incorporating perfluorovinyl ether groups terminated with hydrophilic sulfonate cation-exchange sites onto a hydrophobic polytetrafluoroethylene (PTFE) backbone. The combination of sulfonate groups and a stable PTFE backbone makes Nafion a well-known ionic polymer with advantages of excellent ionic conductivity, cation selectivity, chemical inertness, and thermal stability [1]. The unique properties of Nafion have drawn great interest in a broad range of research areas and applications, including fuel cells and batteries [2,3,4,5], chemical sensors [6,7,8,9,10,11,12,13,14,15], biosensors [16,17], and separation technologies [18].
In recent years, Nafion has been extensively investigated as a membrane or electrode modifier of electrochemical sensors for environmental and biomedical applications [6,7,8,9,10,11,12,13,14,15,16,17]. Electrochemical sensors monitor the changes in potential or current caused by electrochemical reactions on an electrode’s surface. This type of technique offers portability, good sensitivity, and real-time analysis with a simple and low-cost setup. For detection of cationic species, such as heavy metal ions, Nafion membranes have been used to pre-concentrate target analytes and reduce interferences from anionic species [7,8,9,10]. The membrane has good adhesion to most electrode surfaces and can protect the surfaces from fouling and deterioration [8]. Christos et al. utilized a Nafion-modified bismuth film sensor and anodic stripping voltammetry (ASV) for determination of Pb(II) and Cd(II) in lake water with the presence of surfactants [9]. Nafion solution was drop casted onto the working electrode to form a 0.4-µm thick membrane. The limit of detection was around 0.5 µg/L. It was also found that the thickness of the Nafion membrane played an important role in the sensor’s sensitivity and resistance toward surfactants. Kannika et al. developed a crown ether/Nafion and bismuth film-modified, screen-printed carbon electrode (SPCE) for detection of Pb(II) and Cd(II) in rice samples by sequential injection and ASV [7]. Nafion solution (0.5 wt%) as an electrode modifier was mixed with carbon ink and screen printed onto the conducting layer. Shirley et el. developed a screen-printed graphene electrode modified by bismuth nanoparticles and Nafion for in situ environmental monitoring of Pb(II) and Cd(II) [10]. The detection limit was reported to be 280 ng/L and 40.34 µg/L for Pb(II) and Cd(II), respectively. Nafion solution was diluted to 1% (v/v) by ethanol and mixed with bismuth nanoparticles. The mixed dispersion was then drop casted onto the working electrode. Interestingly, in most of these efforts, the Nafion membrane was deposited onto the electrodes by drop casting, which is not very suitable for product development and up-scaling.
Another important application of Nafion is as a solid polymer electrolyte for polymer electrolyte membrane fuel cells (PEMFC) [5] and vanadium redox flow batteries [3]. Nafion-based nanocomposites demonstrated good performance in terms of proton conductivity, MeOH permeability, and mechanical strength. However, membrane fabrication is still limited to solvent casting or drop casting. The microstructure of the membrane prepared by solvent casting is highly dependent on the solvent and annealing temperature [3], which could limit the selection of high–boiling point solvents and process temperatures. Additionally, controlling film thickness and reproducibility could be challenging for drop casting.
There are several reasons that a Nafion dispersion is not suitable for large-scale fabrication techniques, such as screen printing. A commercial Nafion polymer is typically dispersed in a mixture of water and low boiling point solvent, such as 1-propanol, ethanol, or mixed ethers. The dispersion is not very compatible with screen printing, due to its low viscosity and low boiling point. The inks for screen printing need to possess high viscosity at a low shear rate and a shear-thinning behavior in which the viscosity decreases with increase in shear rate [19]. In addition, the solvent should have a moderately high boiling point to prevent the sample from drying during the printing process. Meanwhile, commercial Nafion solution is in the acidic form, meaning the sulfonic acid groups on the stable PTFE backbone have a pKa value of about −6 [20]. This strong acid property limits the use of commercial Nafion dispersions with some printing methods and substrates.
In this work, a novel approach was developed to prepare a sodium-formed Nafion dispersion with tunable viscosity for screen printing and stencil coating. Nafion dispersion as a copolymer of polytetrafluoroethylene and perfluorosulfonic acid was neutralized to its sodium form by titration with a base, and the original low boiling point and low viscosity solvent was replaced by a high boiling point solvent by rotor evaporation. Rheology properties of the dispersion were characterized by a rotational rheometer. The elemental composition and degree of crystallinity of the fabricated film were measured. The modified Nafion dispersion was also screen printed and stencil coated onto commercial electrochemical sensors. The electrochemical performance of the modified sensors was evaluated by detection of Pb(II) using square-wave anodic stripping voltammetry (SWASV). To our knowledge, this is the first time a screen-printable Nafion dispersion has been developed and characterized for the application of electrochemical sensors.

2. Materials and Methods

2.1. Materials and Chemicals

Commercial Nafion™ ink (D2021, 20% PFSA dispersion) was purchased from Fuel Cell Store (College Station, TX, USA). The starting polymer had an available acid capacity of >0.92 meq/g on a H+ polymer basis. Lead nitrate, potassium nitrate, and the solvents used in rotor evaporation, such as 2-methyl-1,3-propanediol, were of ACS grade and purchased from Sigma Aldrich (St. Louis, MO, USA). The buffer solution consists of 10 mM potassium nitrate in deionized water (18.2 MΩ/cm) and the pH was adjusted to 5 by adding 5 mM acetic/acetate buffer.
Standard stock solution (1000 mg/L) of lead nitrate was prepared by dissolving the associated salts in a buffer solution. The prepared stock solution was further diluted to obtain working standard solutions in the range of 1 to 500 µg/L of Pb(II) using a buffer solution. Commercial screen-printed sensors (SP-1302, silver working electrode) for the detection of Pb(II) were purchased from BASi Research Products (West Lafayette, IN, USA). The sensors are in 3-electrode configuration including a 2-mm silver working electrode, Ag/AgCl reference electrode, and platinum auxiliary electrode. All the electrodes were screen printed on corundum ceramic substrates.

2.2. Nafion pH Adjustment

The pH adjustment of the acidic Nafion dispersion was accomplished by dilution and neutralization, which converted the active site from -SO3H form to its -SO3Na form [21]. Commercial Nafion (20 wt%) was diluted to 0.4 wt% using deionized (DI) water (18.2 MΩ/cm), and the diluted solution was then neutralized by 0.1 M NaOH. To determine the amount of NaOH needed for neutralization, titration was performed by a HI-902C2 potentiometric titrator (Hanna Instruments, Woonsocket, RI, USA). Fifty grams of diluted Nafion solution was titrated to pH 7 by 0.1 M NaOH under constant stirring. The equilibrium time was set to 3 min between each step of titrant addition. Based on the titration result, a calculated amount of 0.1 M NaOH and 100 g Nafion (20% PFSA) dispersion were added into the flask. The resulting solution was stirred at 300 rpm for about 12 h at 30 °C to allow complete neutralization.

2.3. Nafion Solvent Replacement

After pH adjustment, a “solvent swap” was performed to neutralize the Nafion dispersion to replace the original, low boiling point solvent with a higher boiling point, screen printing-compatible solvent [21]. An amount of 80 g of 2-methyl-1,3-propanediol was added to 100 g of neutralized dispersion, and the mixture was kept under stirring for 2 h until a homogeneous dispersion was obtained. The resulting dispersion was transferred into a 500-mL round, glass flask and rotor evaporated at 55 °C under vacuum using a R-200 Buchi rotor evaporator (Sigma Aldrich, St. Louis, MO, USA). During evaporation, a small aliquot of sample was taken every 10 min for testing the solid content. Rotor evaporation was completed when the solution reached 25 wt% solid content (measured by Mettler Toledo HE73 moisture analyzer). The obtained inks had higher viscosity and were used for screen printing or stencil coating.

2.4. Screen Printing and Stencil Coating

Modified Nafion material was screen printed onto the substrate using an AT-55PD ATMA Electric Flat Screen Printer (Taipei, Taiwan 248) with the following parameters: 1–1.5-mm squeegee and flood bar height, 10° squeegee and flood bar angle, 150-mm/s squeegee and flood bar print speed, 1-mm print off-contact, and 5-bar squeegee and flood bar pressure. Printed membranes were cured in a vacuum oven (Stable Temp Model 282A) at 55 °C for 24 h.
The modified Nafion was also stencil coated onto different substrates for characterization of membranes. The stencil used was a 7-mil (175 µm) thick PET adhesive film with a 6-mm diameter hole. The PET adhesive film was placed onto the substrate and 0.5 g of modified Nafion was loaded evenly onto the stencil. A plastic scraper blade was used as a flood bar to coat the material onto substrates. Deposited membranes were cured at 55 °C on a hot plate for 24 h.

2.5. Characterization of Nafion

The rheological properties of the modified Nafion inks were characterized using a Discovery HR-20 rheometer (TA Instrument, New Castle, DE, USA). Shear-dependent viscosity was measured at frequencies ranging from 0.1 to 500 s−1. Three-level flow method was used to measure thixotropy, with shear rate starting at 0.1 s−1 for 2 min, followed by increasing to 100 and 500 s−1 for 10 s and 5 s, respectively, and then recovering back to 0.1 s−1 for 5 min. Yield stress was tested by dynamic strain sweep method. All three measurements were performed with a 40-mm parallel plate geometry at 25 °C.
X-ray photoelectron spectroscopy (XPS) was conducted using a Thermo Scientific Nexsa XPS with a micro-focused monochromated Al Kα (1486.6 eV) X-ray radiation source. All spectra were collected using a 400-µm spot size in a ~5 × 10⁻⁸ mbar vacuum environment. The survey scans were collected at a pass energy of 200 eV and binding energy (BE) steps of 0.10 eV, and the high-resolution scans were collected at a pass energy of 50 eV and BE steps of 0.01 eV. The commercial and modified Nafion membranes were stencil coated onto silicon substrates and subsequently cured on a hot plate at 55 °C for 24 h.
X-ray diffraction (XRD) was conducted using a Bruker D2 phaser XRD to characterize the crystallinity of the Nafion membranes. Both commercial and modified Nafion were stencil coated onto zero background silicon wafers.
Film thickness and surface roughness characterizations of the post-cured Nafion films were conducted using an Olympus LEXT laser scanning confocal microscope (LSCM) equipped with a 405 nm ultraviolet (UV) laser.

2.6. Electrochemical Sensor Performance Tests

Electrochemical measurements of Nafion printed on a commercial sensor were performed by a CHI-655E potentiostat (CH Instrument) with square-wave anodic stripping voltammetry (SWASV).
The sample solutions of Pb(II) at different concentrations were sequentially measured by the commercial sensors, with or without modified Nafion, using the SWASV technique. Prior to testing, sensors were presoaked in sample solution for 24 h for the Nafion to reach equilibrium. The analytes were first deposited on the working electrode at −0.9 V vs Ag/AgCl reference electrode for 120 s. The potentials were applied in the range of −0.9 V to −0.5 V, with a frequency of 5 Hz and a pulse amplitude of 25 mV.

3. Results

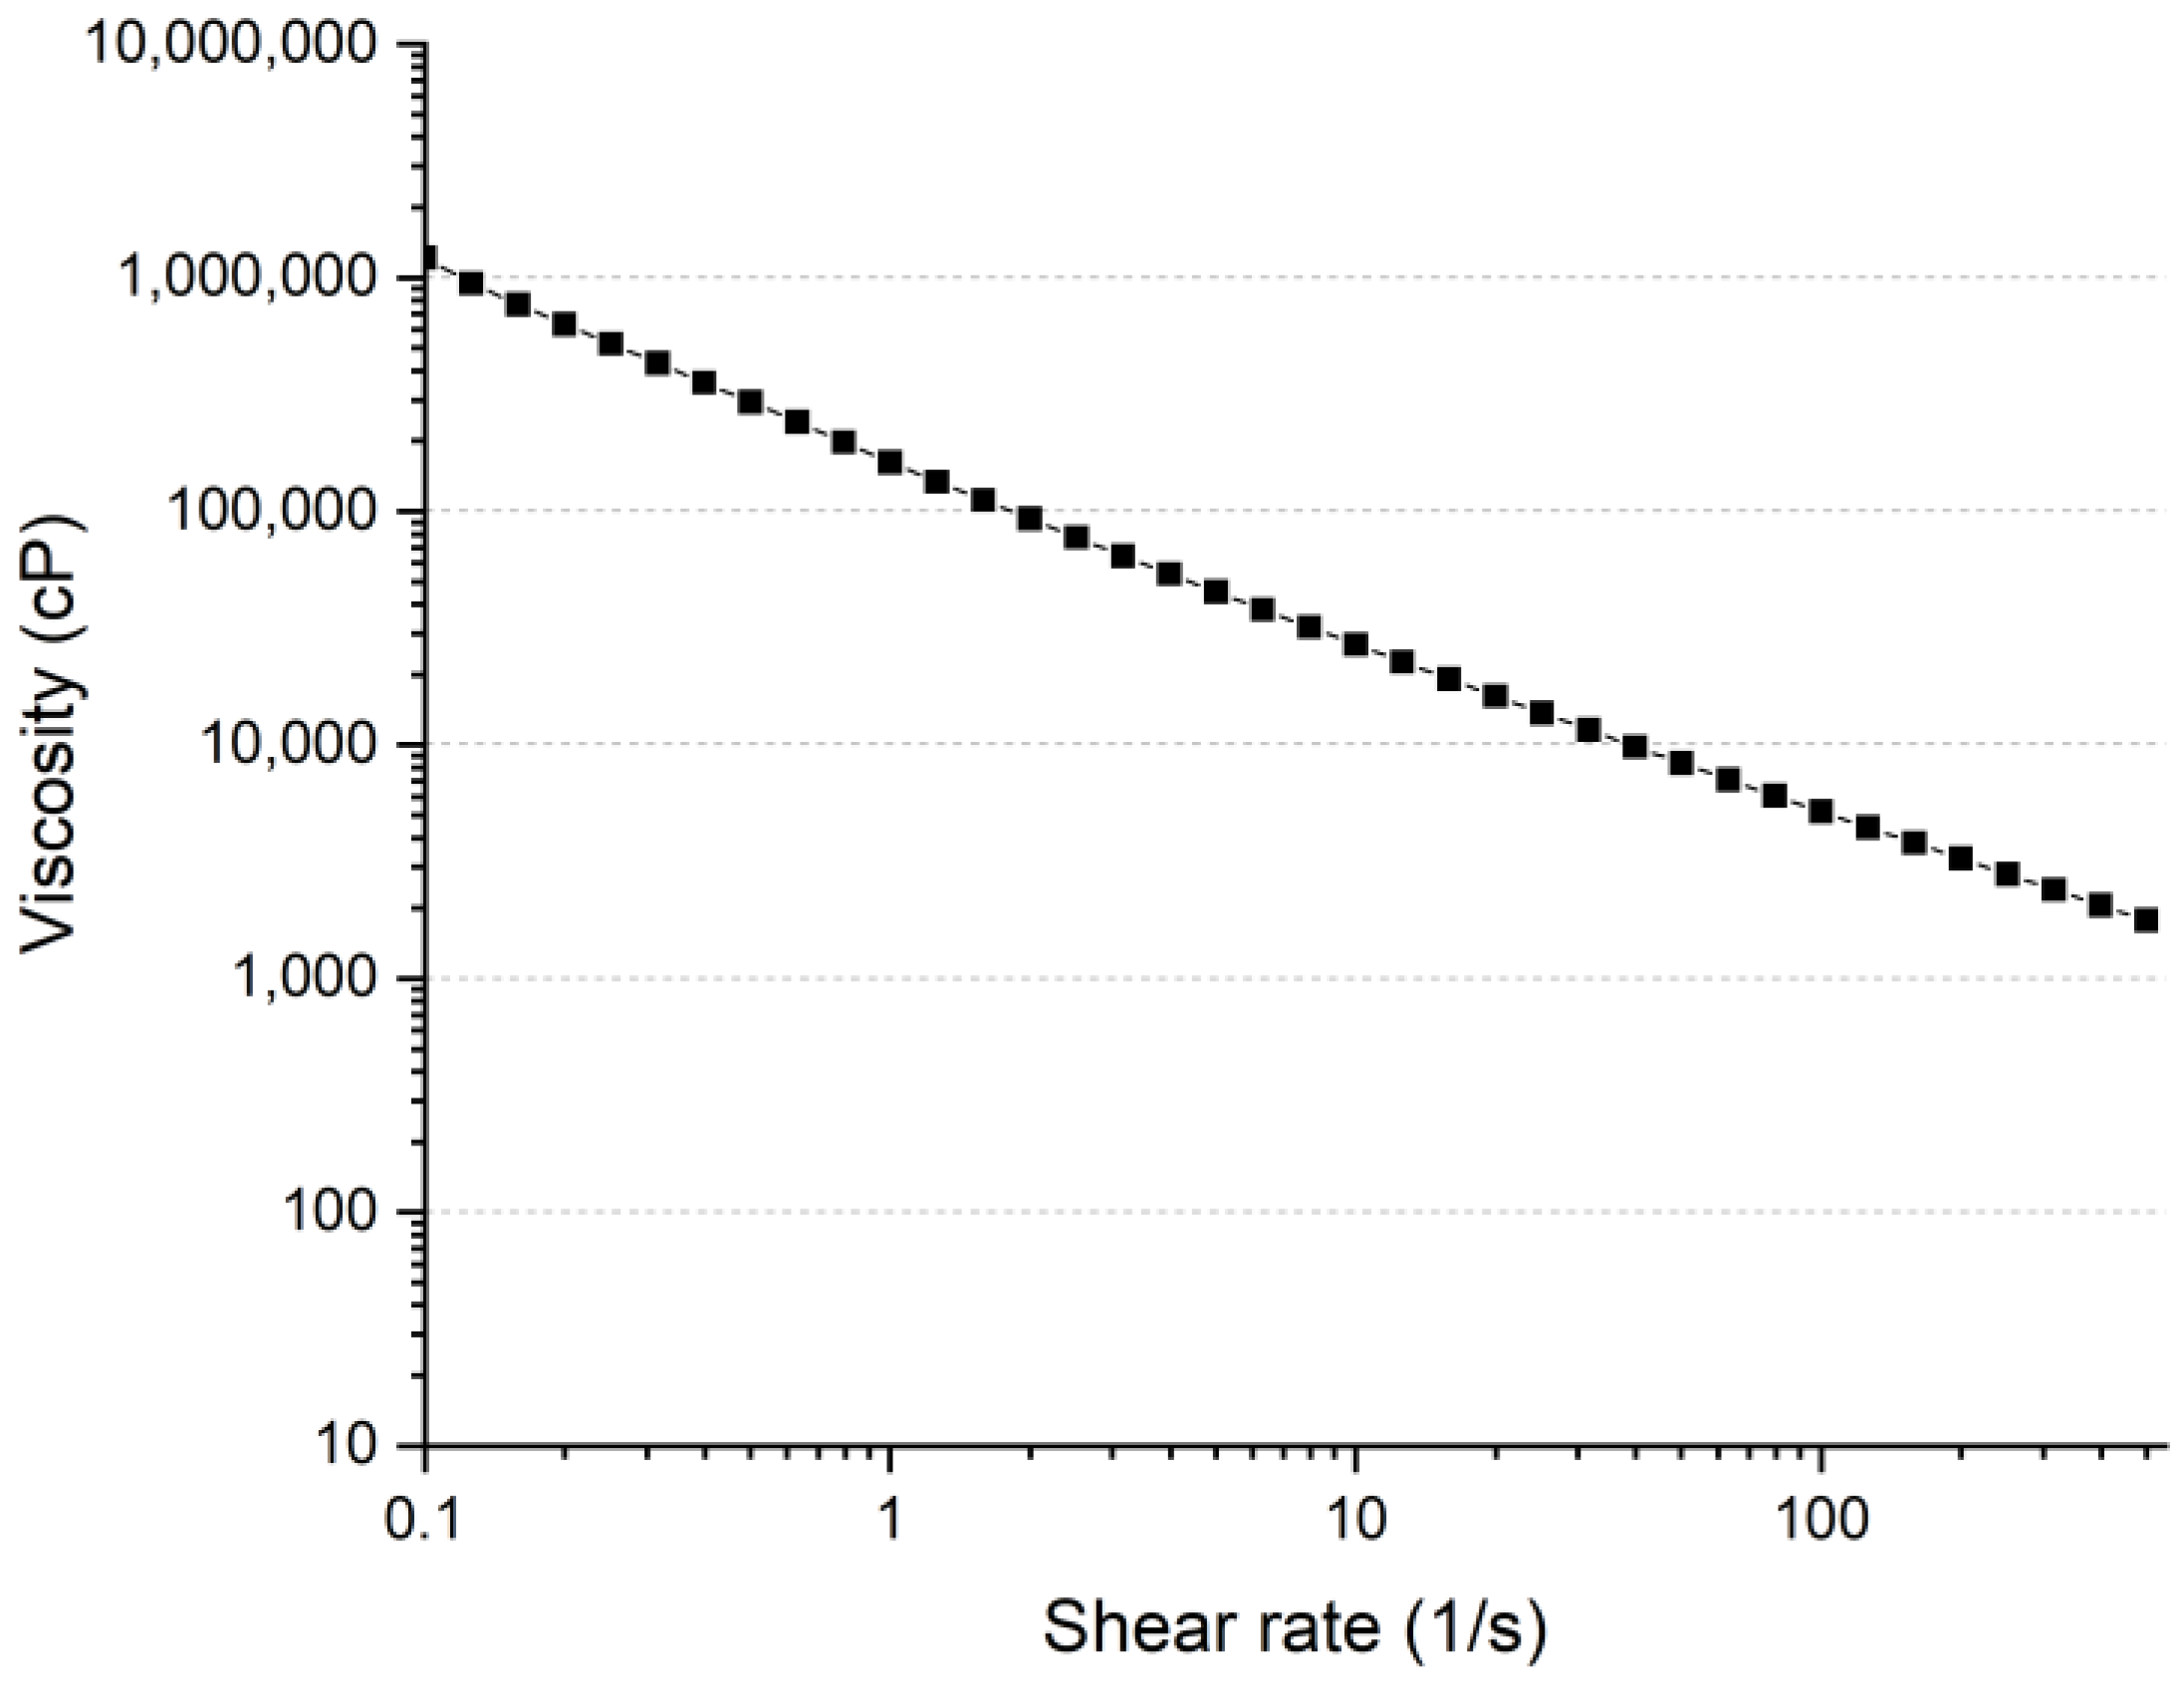
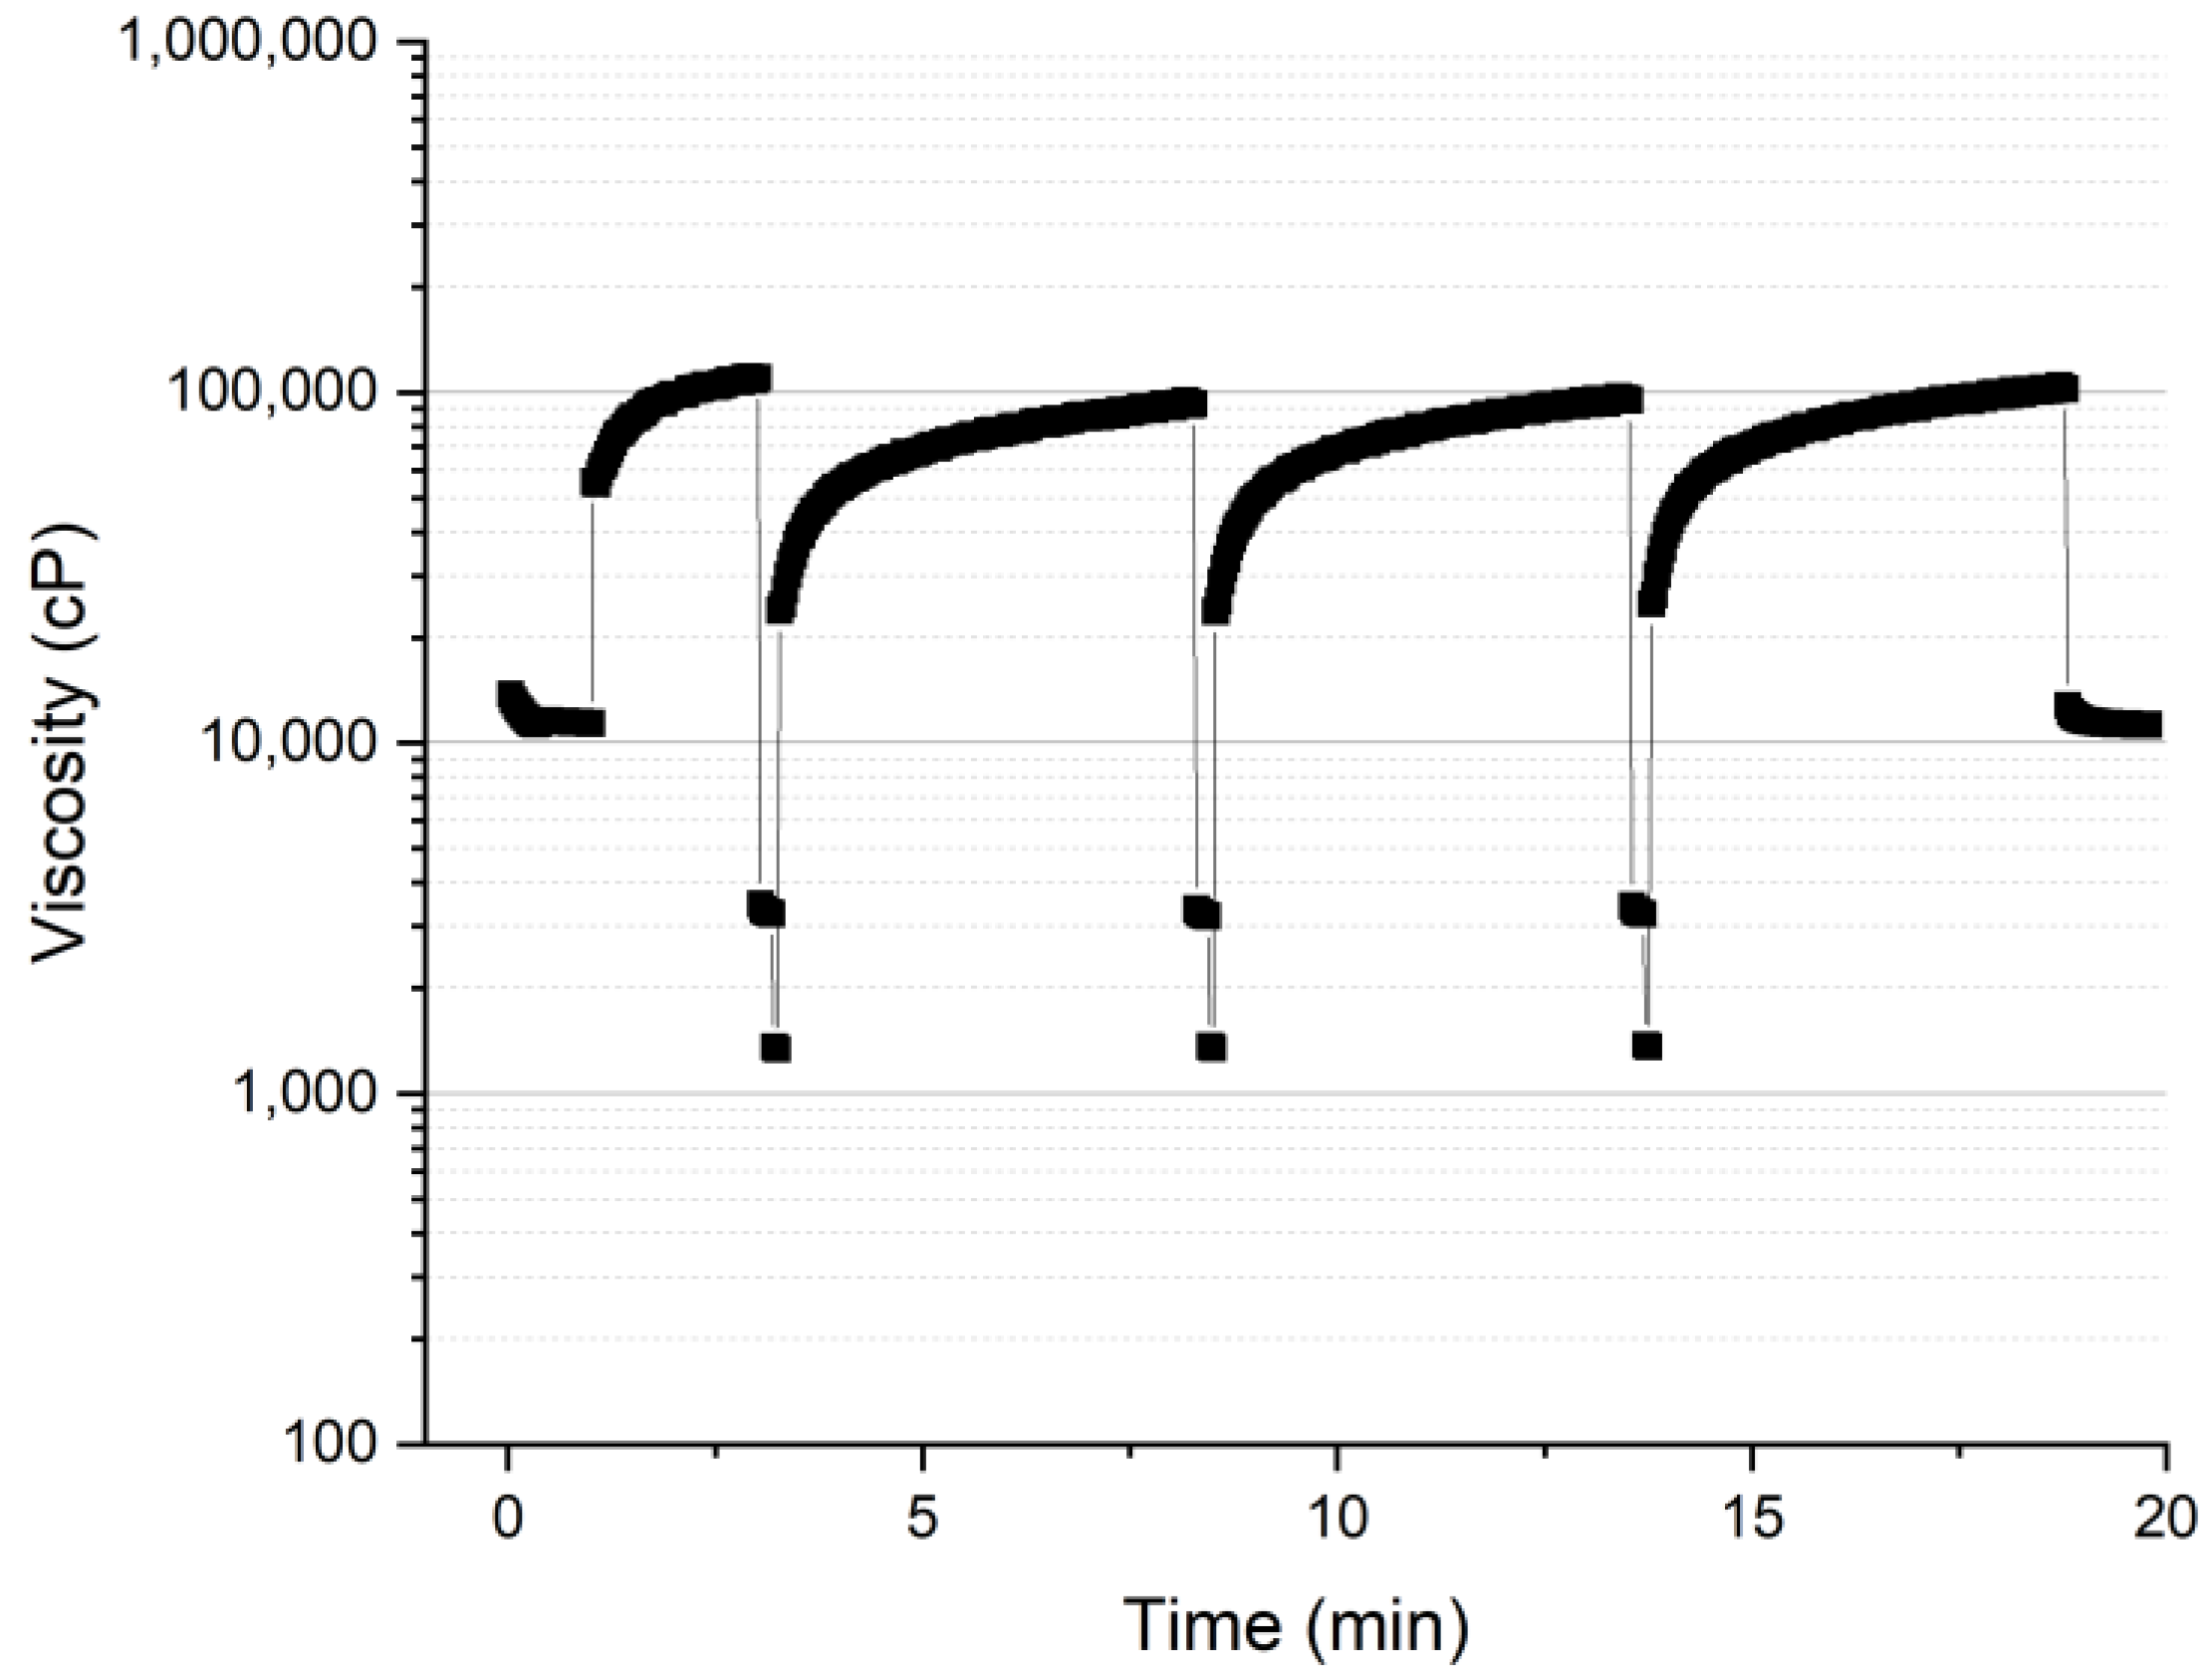
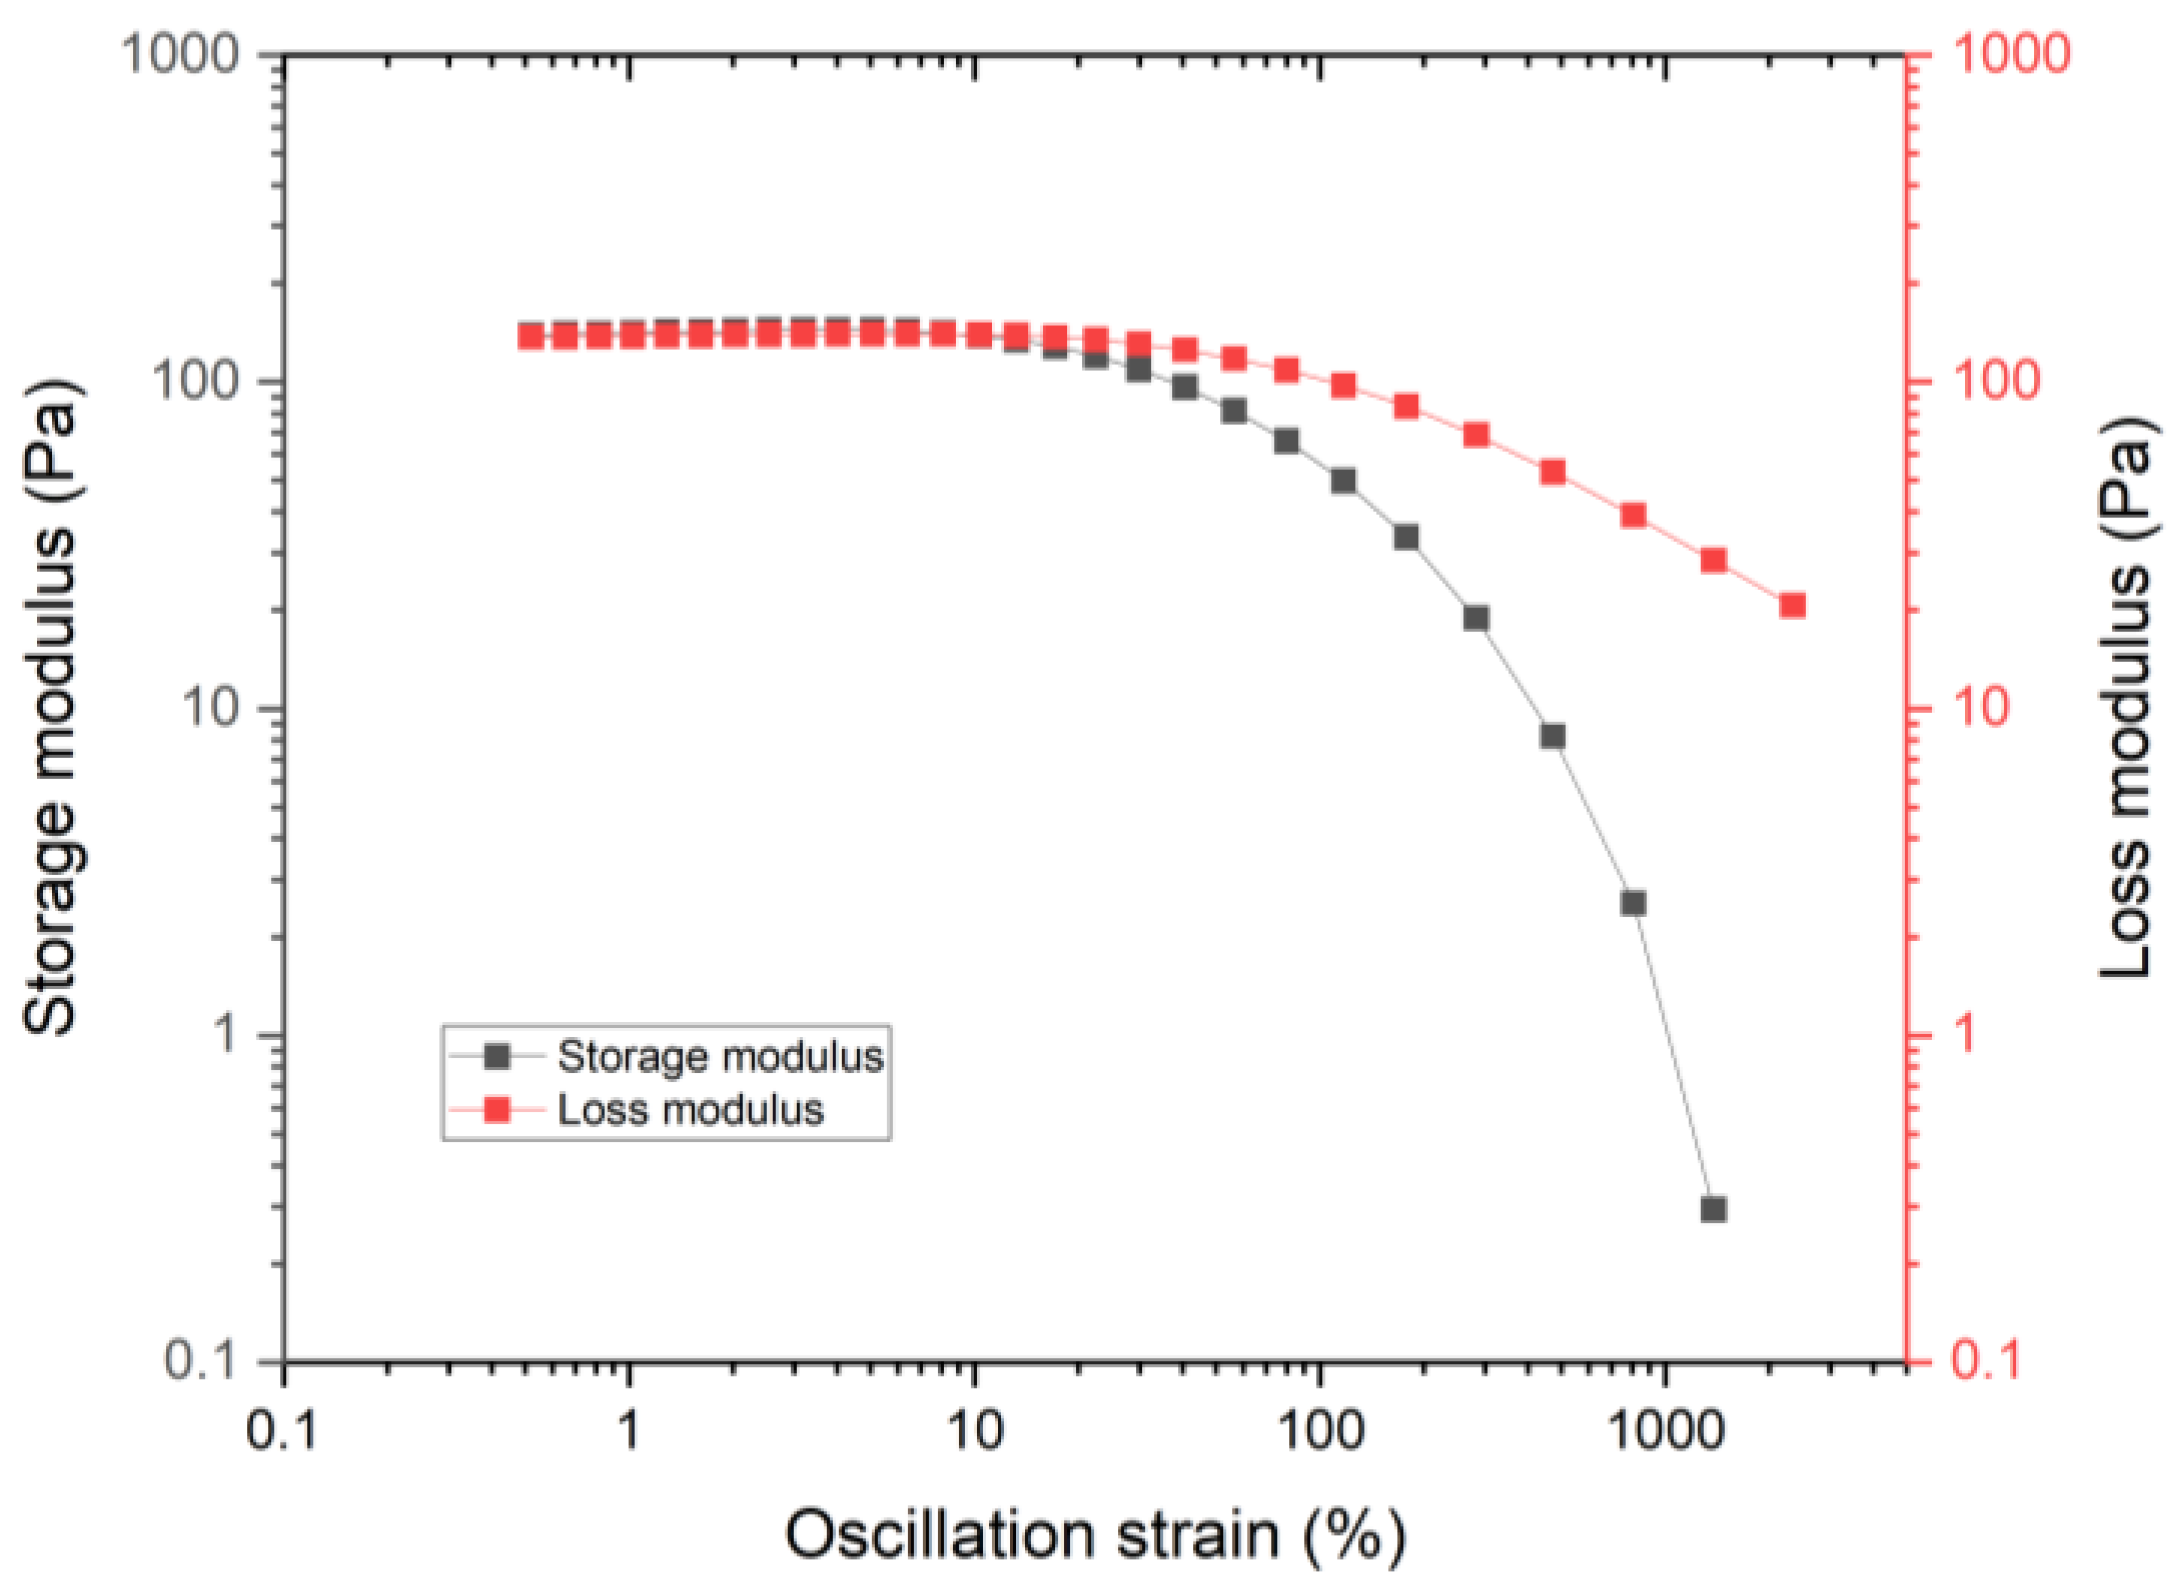
3.1. Rheology Properties

Rheological properties of the modified Nafion inks are essential to ensure the quality and performance of printed membranes. Desired screen-printable inks should possess shear-thinning and thixotropic behavior with moderate yield stress [22,23]. These properties of the modified Nafion dispersion were characterized and discussed in this section.

3.1.1. Shear Thinning

Shear thinning is a non-Newtonian behavior in which the viscosity of the sample decreases with the increase in shear rate. It is required for inks used in screen printing to have certain degrees of shear thinning so the ink can be pushed through the screen mesh during squeegee movement [23]. On the other hand, the inks should also have good stability under higher shear rate; otherwise, the printing quality will be poor. Figure 1 shows the viscosity of the modified Nafion dispersion as a function of shear rate, also known as a viscosity curve. The sample is highly shear thinning, with a viscosity value at 500 s−1 being around 1778 centipoise (cP), nearly three orders of magnitude smaller than the viscosity value at 0.1 s−1 (1.22 × 10⁶ cP). The shear-thinning behavior of modified Nafion is mainly due to the disentanglement of polymer chain and shear-induced strand alignment [24]. The viscosity curve demonstrates good stability of the modified ink over a wide range of shear rates (0.1 to 500 s−1), which is suitable for applications in both screen printing and stencil coating.

3.1.2. Thixotropy

Thixotropy describes the time-dependent shear thinning in which the viscosity decreases with time with applied shear stress and recovers when stress is removed. Thixotropic properties and associated recovery rate are also important characteristics of screen-printing inks. During the screen-printing process, the viscosity of the ink is greatly reduced when high shear stress is applied by a squeegee bar. The ink is expected to recover its viscosity after being deposited onto the substrate. A slow thixotropic recovery rate may lead to misprints or defects, while a leveling issue could happen if the recovery rate is too fast. The thixotropic property of the modified Nafion ink was characterized by a three-level flow method, similar to the three-interval thixotropy test (3ITT) [22,24]. Viscosities of the samples were measured at three different levels of shear rate for different time periods. The shear rate begins at 0.1 s−1 as if the sample is at rest on the screen. In the second step, the shear rate increases to 100 s−1 for 10 s, then 500 s−1 for 5 s, to represent movements of the flood bar and squeegee bar. The shear rate is lowered to the rest condition (0.1 s−1) afterwards to monitor the thixotropic recovery rate. The three-level flow was consecutively measured three times to check the repeatability of sample thixotropic recovery.
The results of the thixotropy analysis of the modified Nafion ink by the three-level flow method are summarized in Figure 2. It was found that the viscosity of the sample recovered to within 92% of the corresponded value at the rest condition within 5 min. Good repeatability was observed among three consecutive measurements for both viscosity and recovery rate. The results further show the reversible recovery of the ink’s microstructure even after exposure to high shear. The thixotropic index was calculated based on the ratio between low and high shear rate at 0.1 and 100 s−1. The thixotropic index of the ink is above 28, again demonstrating its excellent shear-thinning property.

3.1.3. Yield Stress

Yield stress is defined as the minimum shear stress needed for the material to start flow. Yield stress helps the understanding of ink stability and printability and is considered one of the key characteristics for screen-printing inks [25]. Materials with certain degrees of yield stress have less chance of phase separation or aggregation, providing better printability and long-term stability [26]. Since the viscosity of modified Nafion ink is relatively high, yield stress was measured using the dynamic strain sweep method to minimize the effect of wall slippage [27]. The results of storage modulus (G’) and loss modulus (G’’) as a function of oscillation strain are shown in Figure 3. The yield stress is determined by the G’/G” crossover point, which is 139.7 Pa. This moderate yield stress makes the ink suitable for both screen printing and stencil coating.

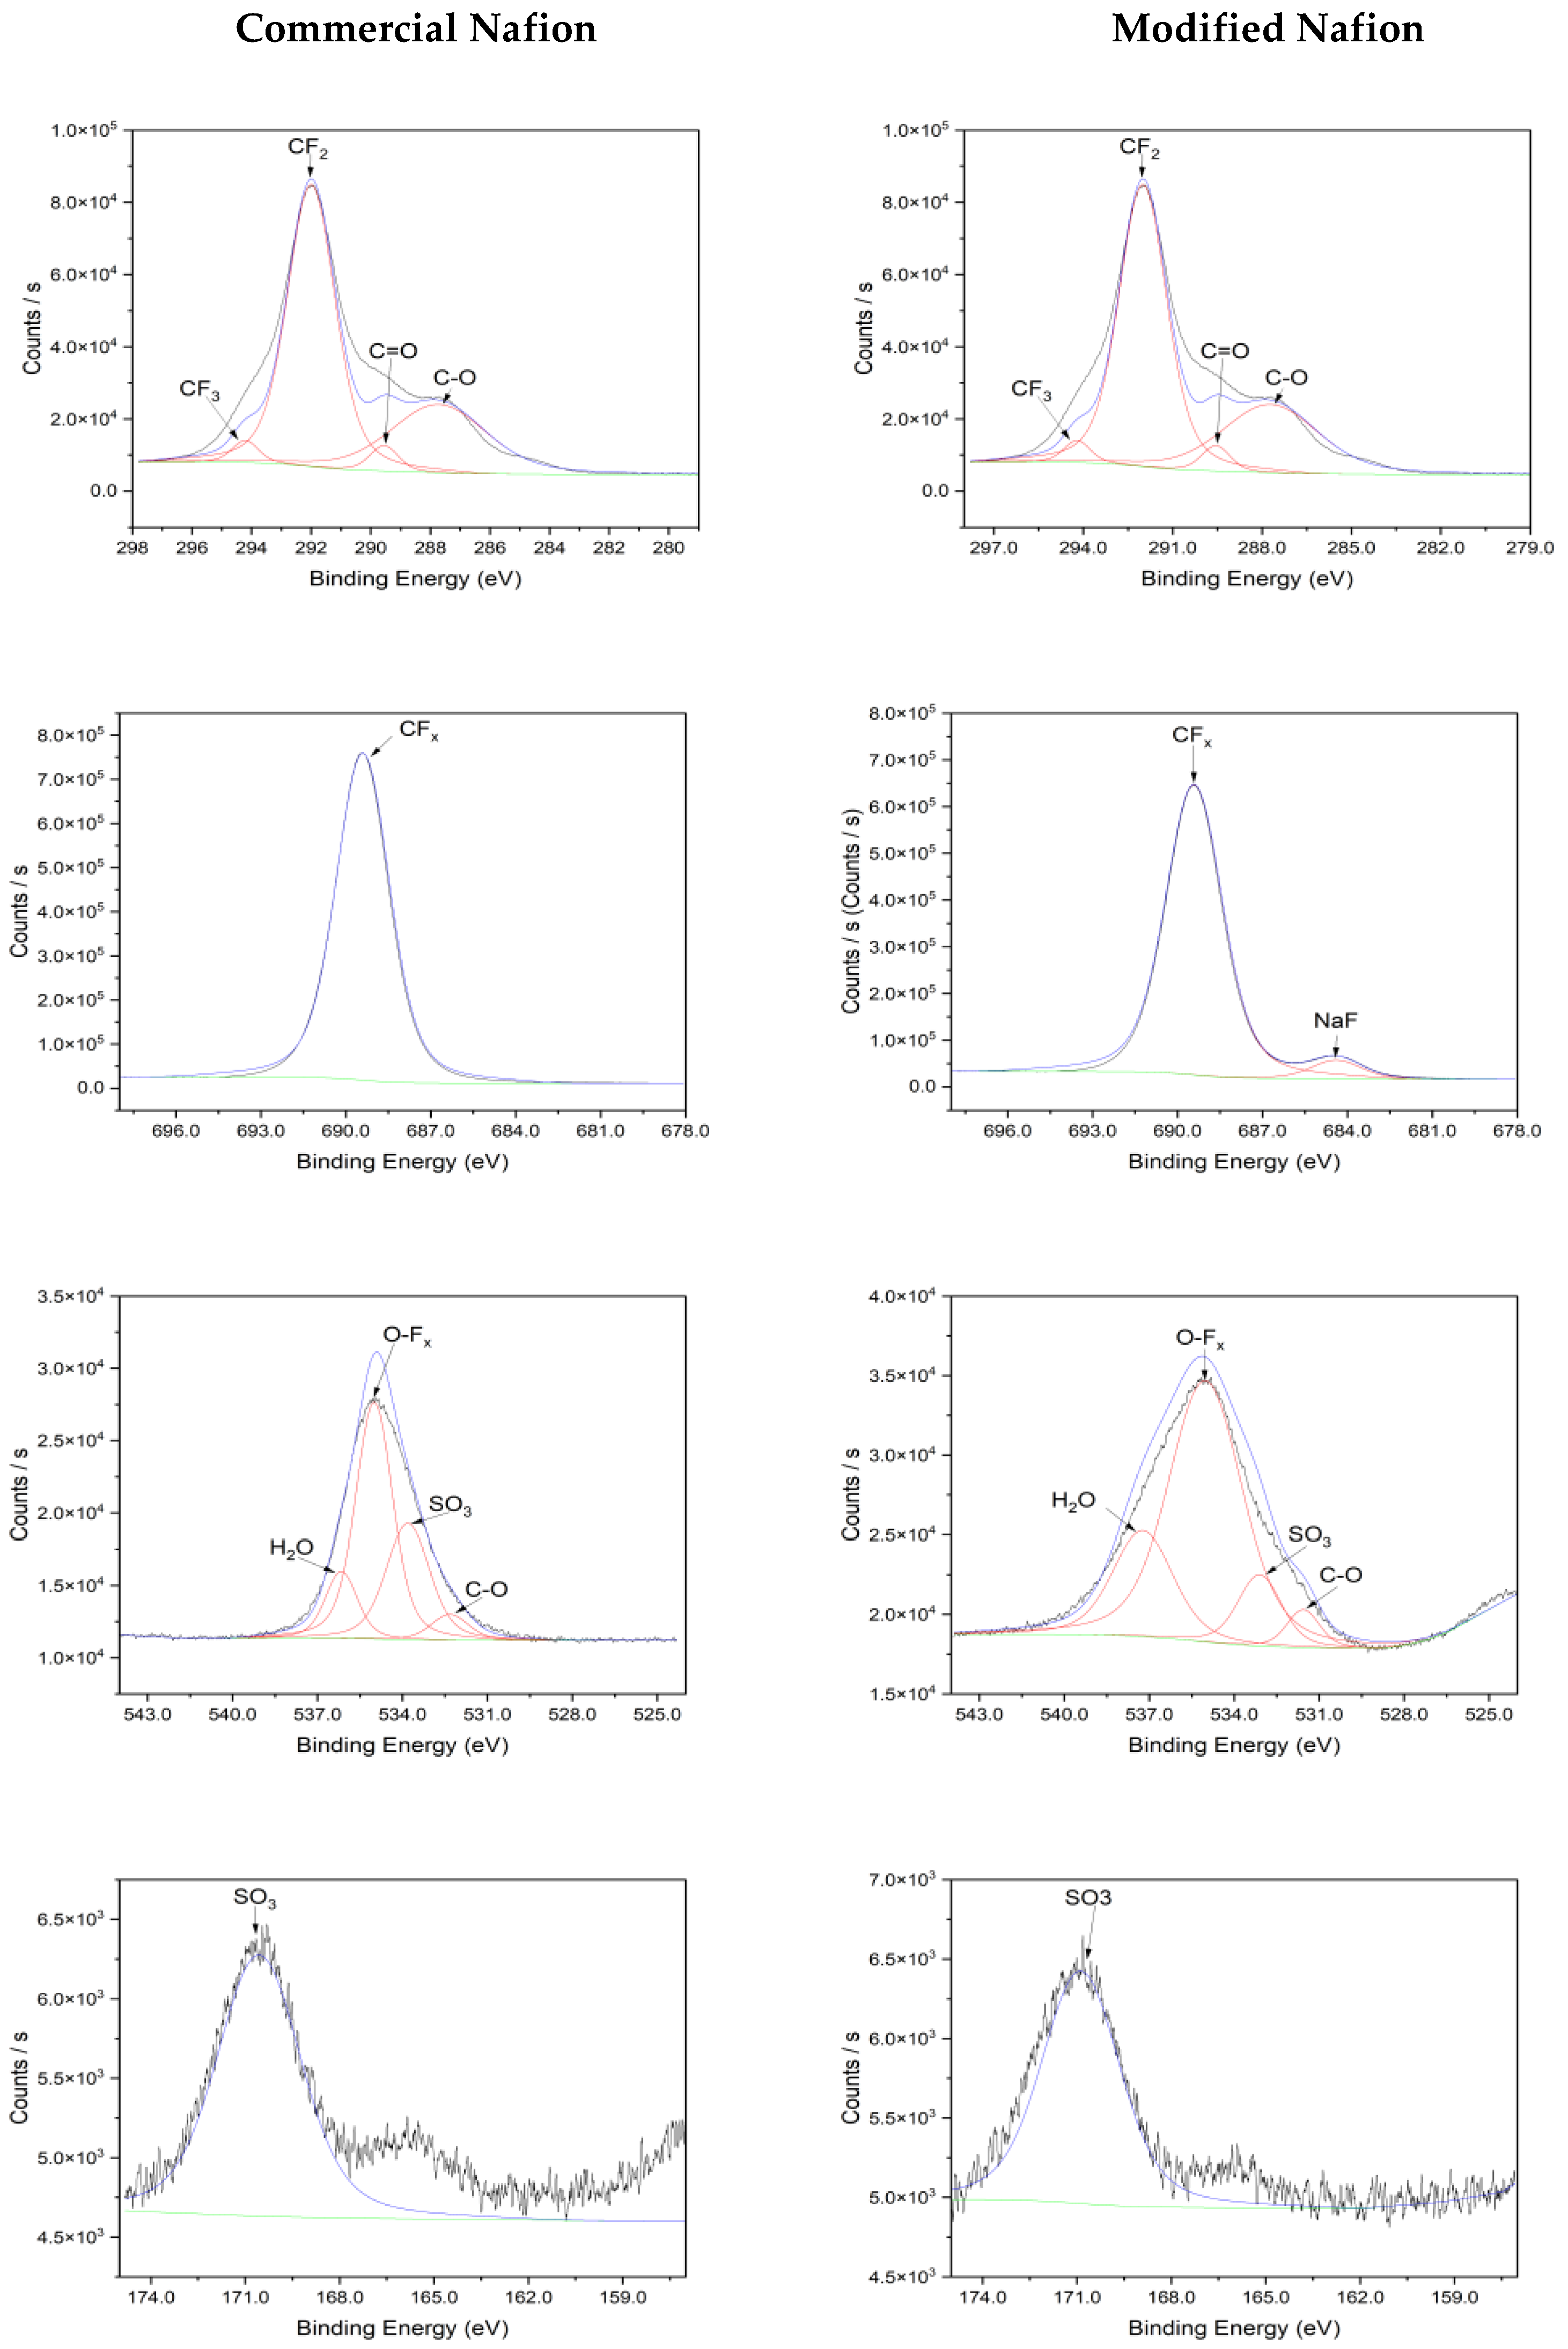
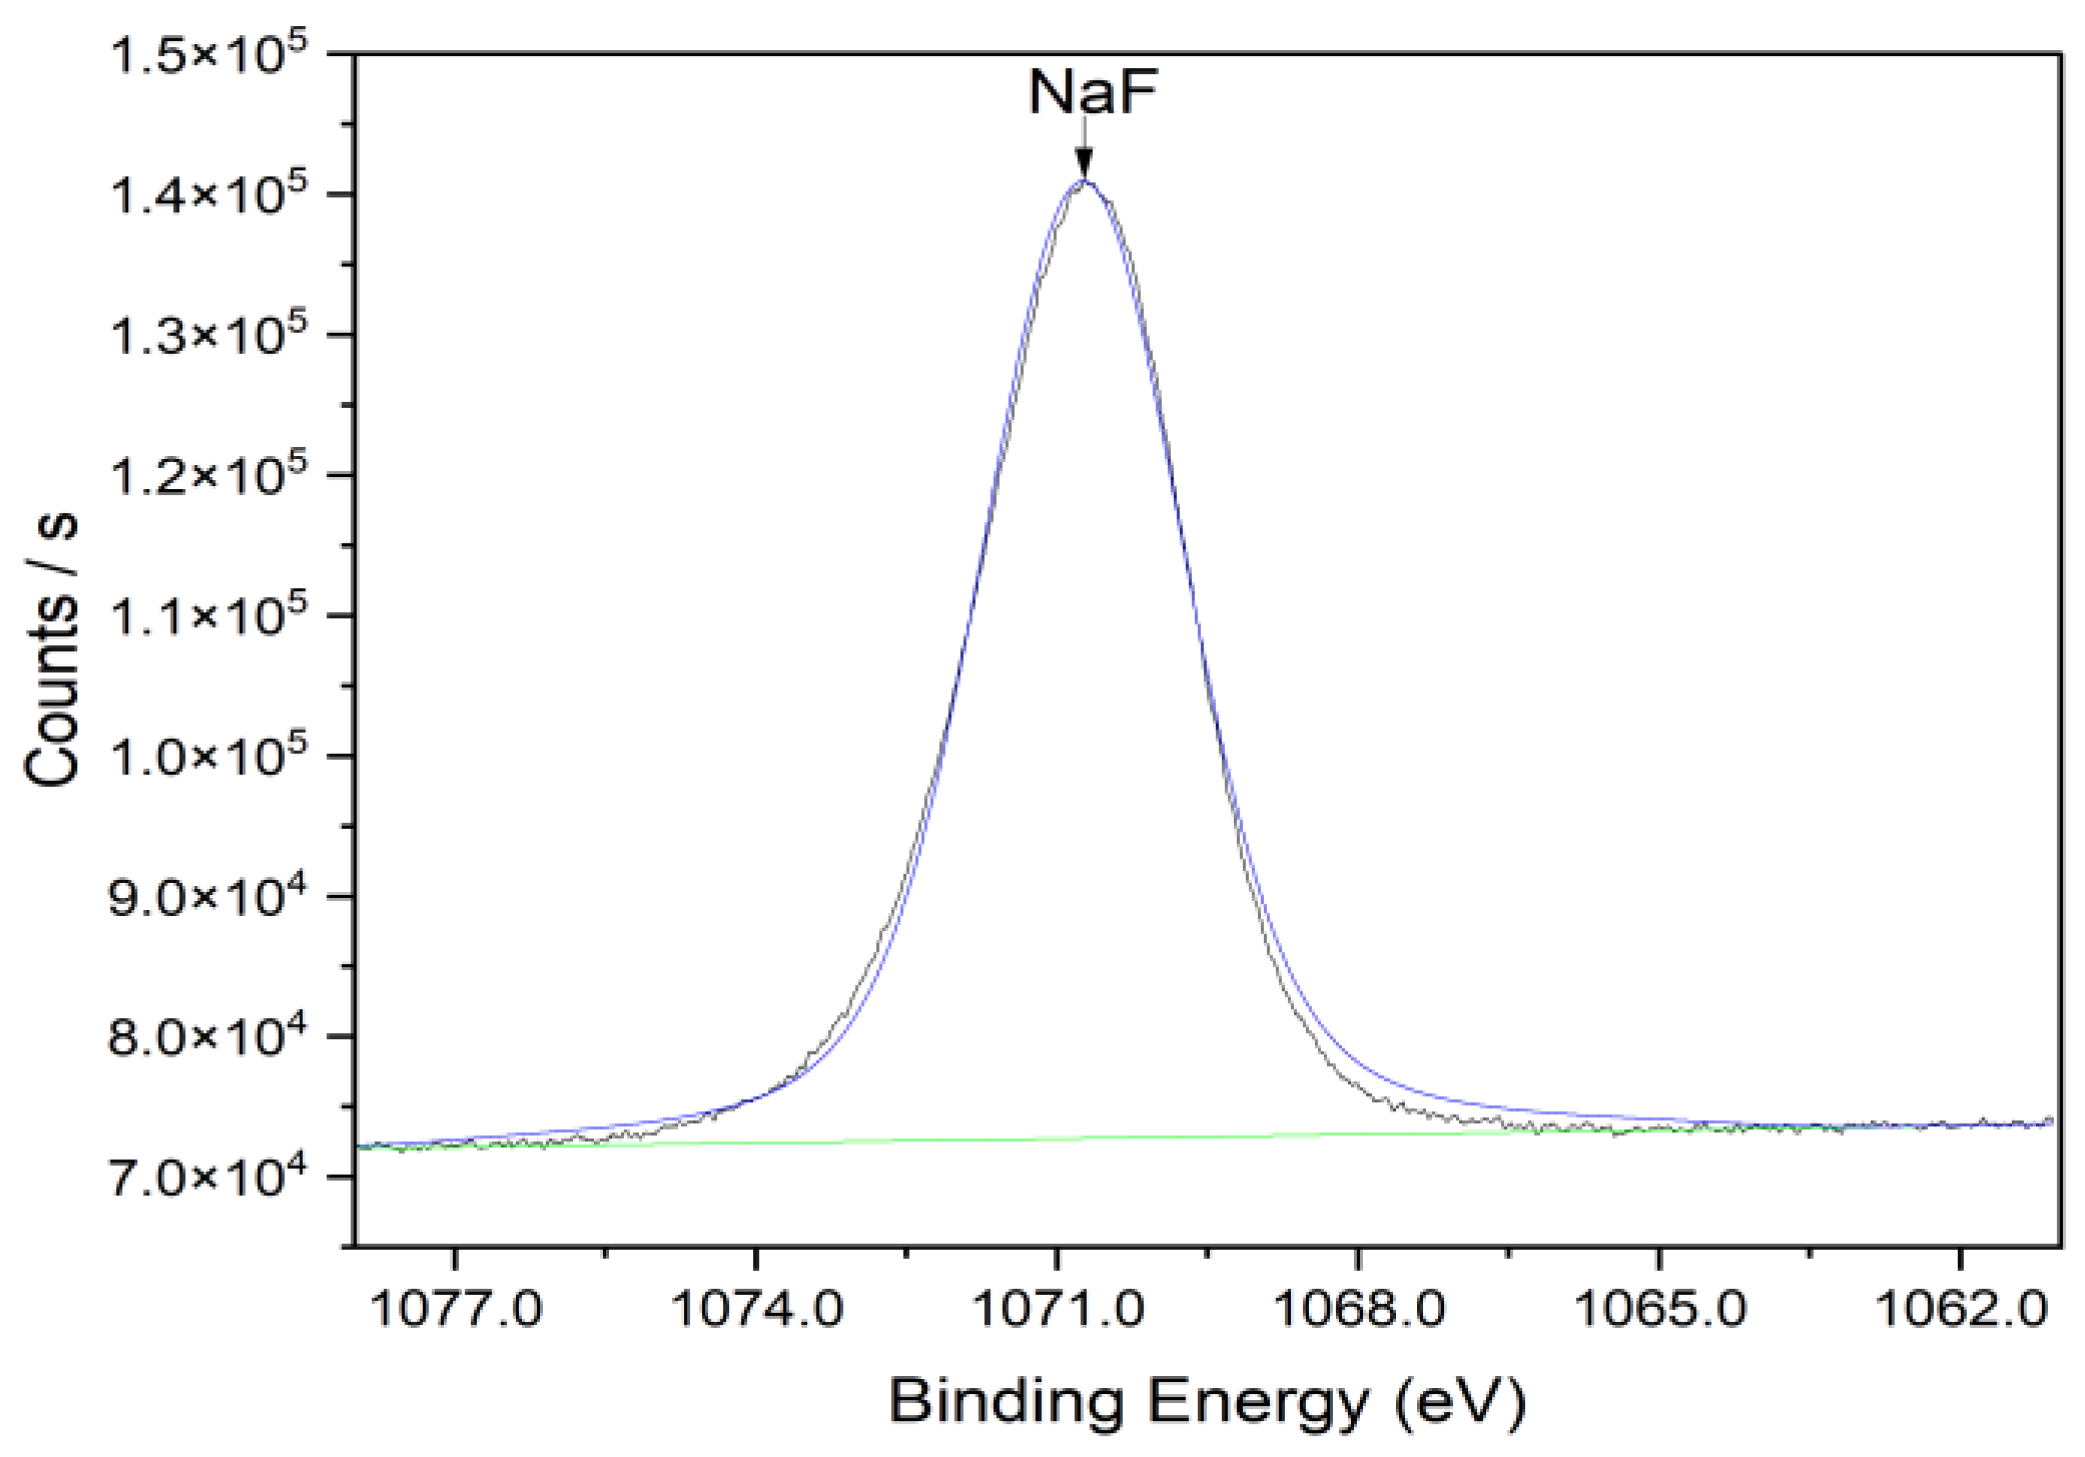
3.2. Characterization of Nafion Membrane

The presence of both hydrophilic sulfonic groups and hydrophilic PTFE backbone in Nafion has been reported to form certain zigzag structures with a low degree of crystallinity [28]. Crystallinity of Nafion is considered an important factor that affects the ion conductivity and mechanical strength. In fuel cell applications, a higher degree of crystallinity of Nafion is preferred to lower the hydrogen/methane crossover and enhance durability [28]. On the contrary, the ion mobility of Nafion is reduced with high crystallinity and is not favored for electrochemical detection. The degree of crystallinity of modified Nafion as a function of curing temperature was characterized by X-ray diffraction. A lower angle scan was chosen due to the large lattice spacings in the sample.
Commercial Nafion ink and modified Nafion inks were deposited onto zero background silicon wafers to minimize contribution of the substrate and allow for an accurate measurement. The commercial Nafion was cured at 55 °C. The modified Nafion inks were cured at different temperatures—55 °C, 90 °C, and 120 °C—to investigate the dependence of curing temperatures on the crystallinity. The degree of crystallinity (D) was calculated by the following equation:
D = C r y s t a l l i n e   A r e a T o t a l   A r e a
The results of X-ray diffraction are shown in Figure 4. It was found that the degree of crystallinity varies with the curing temperature of the Nafion. Increasing the curing temperature brings the crystallinity of the formulation more toward that of commercial Nafion. The overall intensity of the samples increases with the increase in the crystallinity of the Nafion. The modified Nafion ink cured at 120 °C has a diffraction peak at approximately 6.5° 2θ, which is not present in commercial Nafion or modified Nafion cured at other lower temperatures. The broad peak at approximately 38.5° 2θ changes with the curing temperature significantly; interestingly, this peak is most intense when cured at 90 °C. The changes in the crystalline structure are a strong contributor to the properties of the cured Nafion and can be tuned accordingly. Overall, modified Nafion cured at 55 °C has the lowest degree of crystallinity (D = 32.3) with good film quality, while bubble issues were observed for membranes cured at the other two temperatures. Therefore, the curing temperature of modified Nafion was selected as 55 °C. The low degree of crystallinity indicates that the cured membrane is amorphous dominant with small, isolated crystal regions.
Figure 5 shows the survey spectra of the commercial and modified Nafion. It is evident from the survey scans that, compared to the commercial Nafion material, the main difference is the modified Nafion material contains Na. Table 1 provides the elemental composition for each of two Nafion materials, showing comparable percent composition to that of the theoretical values [29].
The high-resolution scans of each of the two materials provides a more in-depth look at the chemical structure of the respective materials. Scrutinizing the high-resolution scans of the identified peaks from the survey scan of each of the two Nafion materials, starting with C1s at peak position of 292.0 eV, indicates the CF2 backbone of the Nafion chemical structure, which is evident in both Nafion membranes. The deconvolution of the C1s peak of each Nafion membrane (Figure 6) shows a comparison of their respective carbon structures, indicting no significant changes in the base CFx chemical structure. The high-resolution scans of the F1s peaks for the commercial and modified Nafion membranes are at 689.4 eV and 689.42 eV, respectively. The F1s peaks further show the similarity between the two Nafion films from the perspective of the base CFx (CF2 and CF3 peak differences are negligible) backbone. A NaF peak is evident at 684.40 eV, as indicated from the F1s high-resolution scan of the modified Nafion film.
The O1s high-resolution peak comparison shows slightly higher peak broadening for the modified Nafion material compared with the commercial Nafion material. This is likely due to the exchange in solvent system between the two Nafion materials; however, key features from the deconvoluted peaks show a similar base structure. It is also evident from the O1s peak deconvolution that trapped water molecules at 536 eV are present in both materials. The S2p centered at 170.55 eV (commercial) and 170.88 eV (modified) indicates the sulfonate (SO3) group in both Nafion materials. Figure 7 provides the Na1s peak centered at 1070.74 eV, indicating a NaF chemical state.
Table 2 provides film thickness values and the surface roughness (Sa) for 3 screen-printed Nafion membranes characterized by LSCM. The fabricated films showed good repeatability in thickness. Sa is the average surface area roughness of the Nafion membranes. The overall Sa accounts for approximately 20% of the film thickness over the area of the deposited films. The level of roughness is likely due to the amorphous morphology of the cured Nafion membranes.

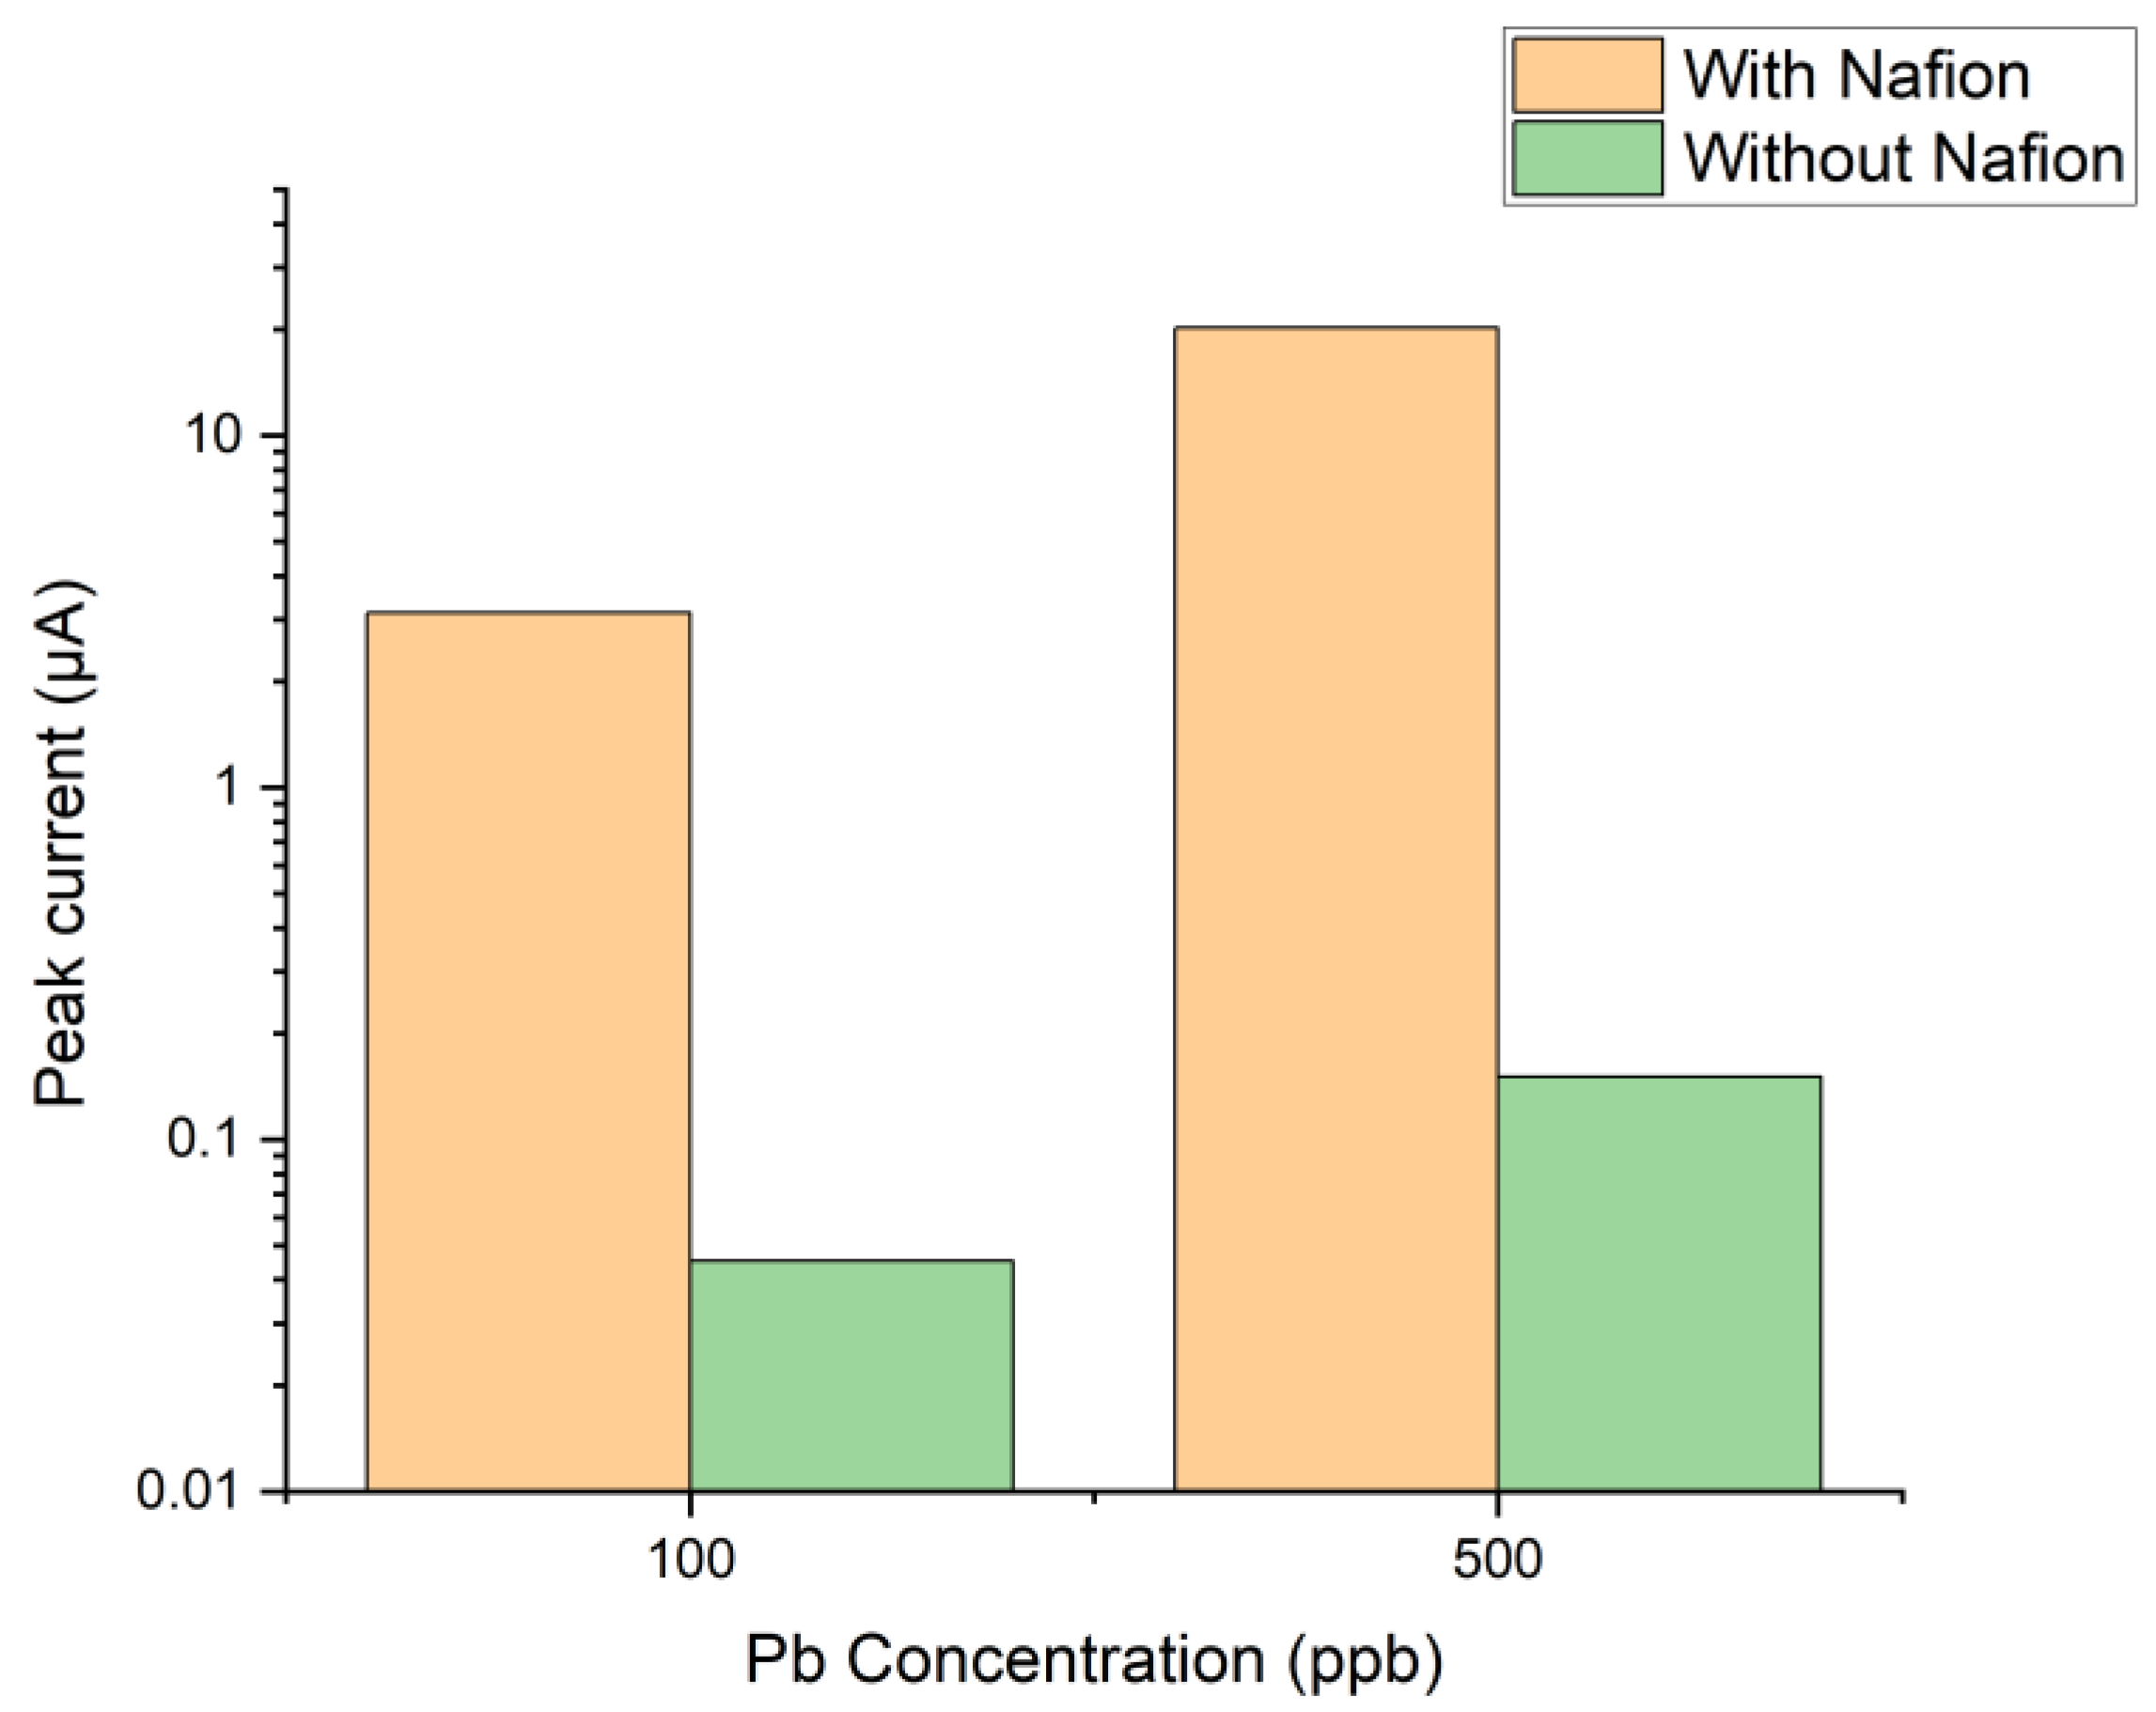
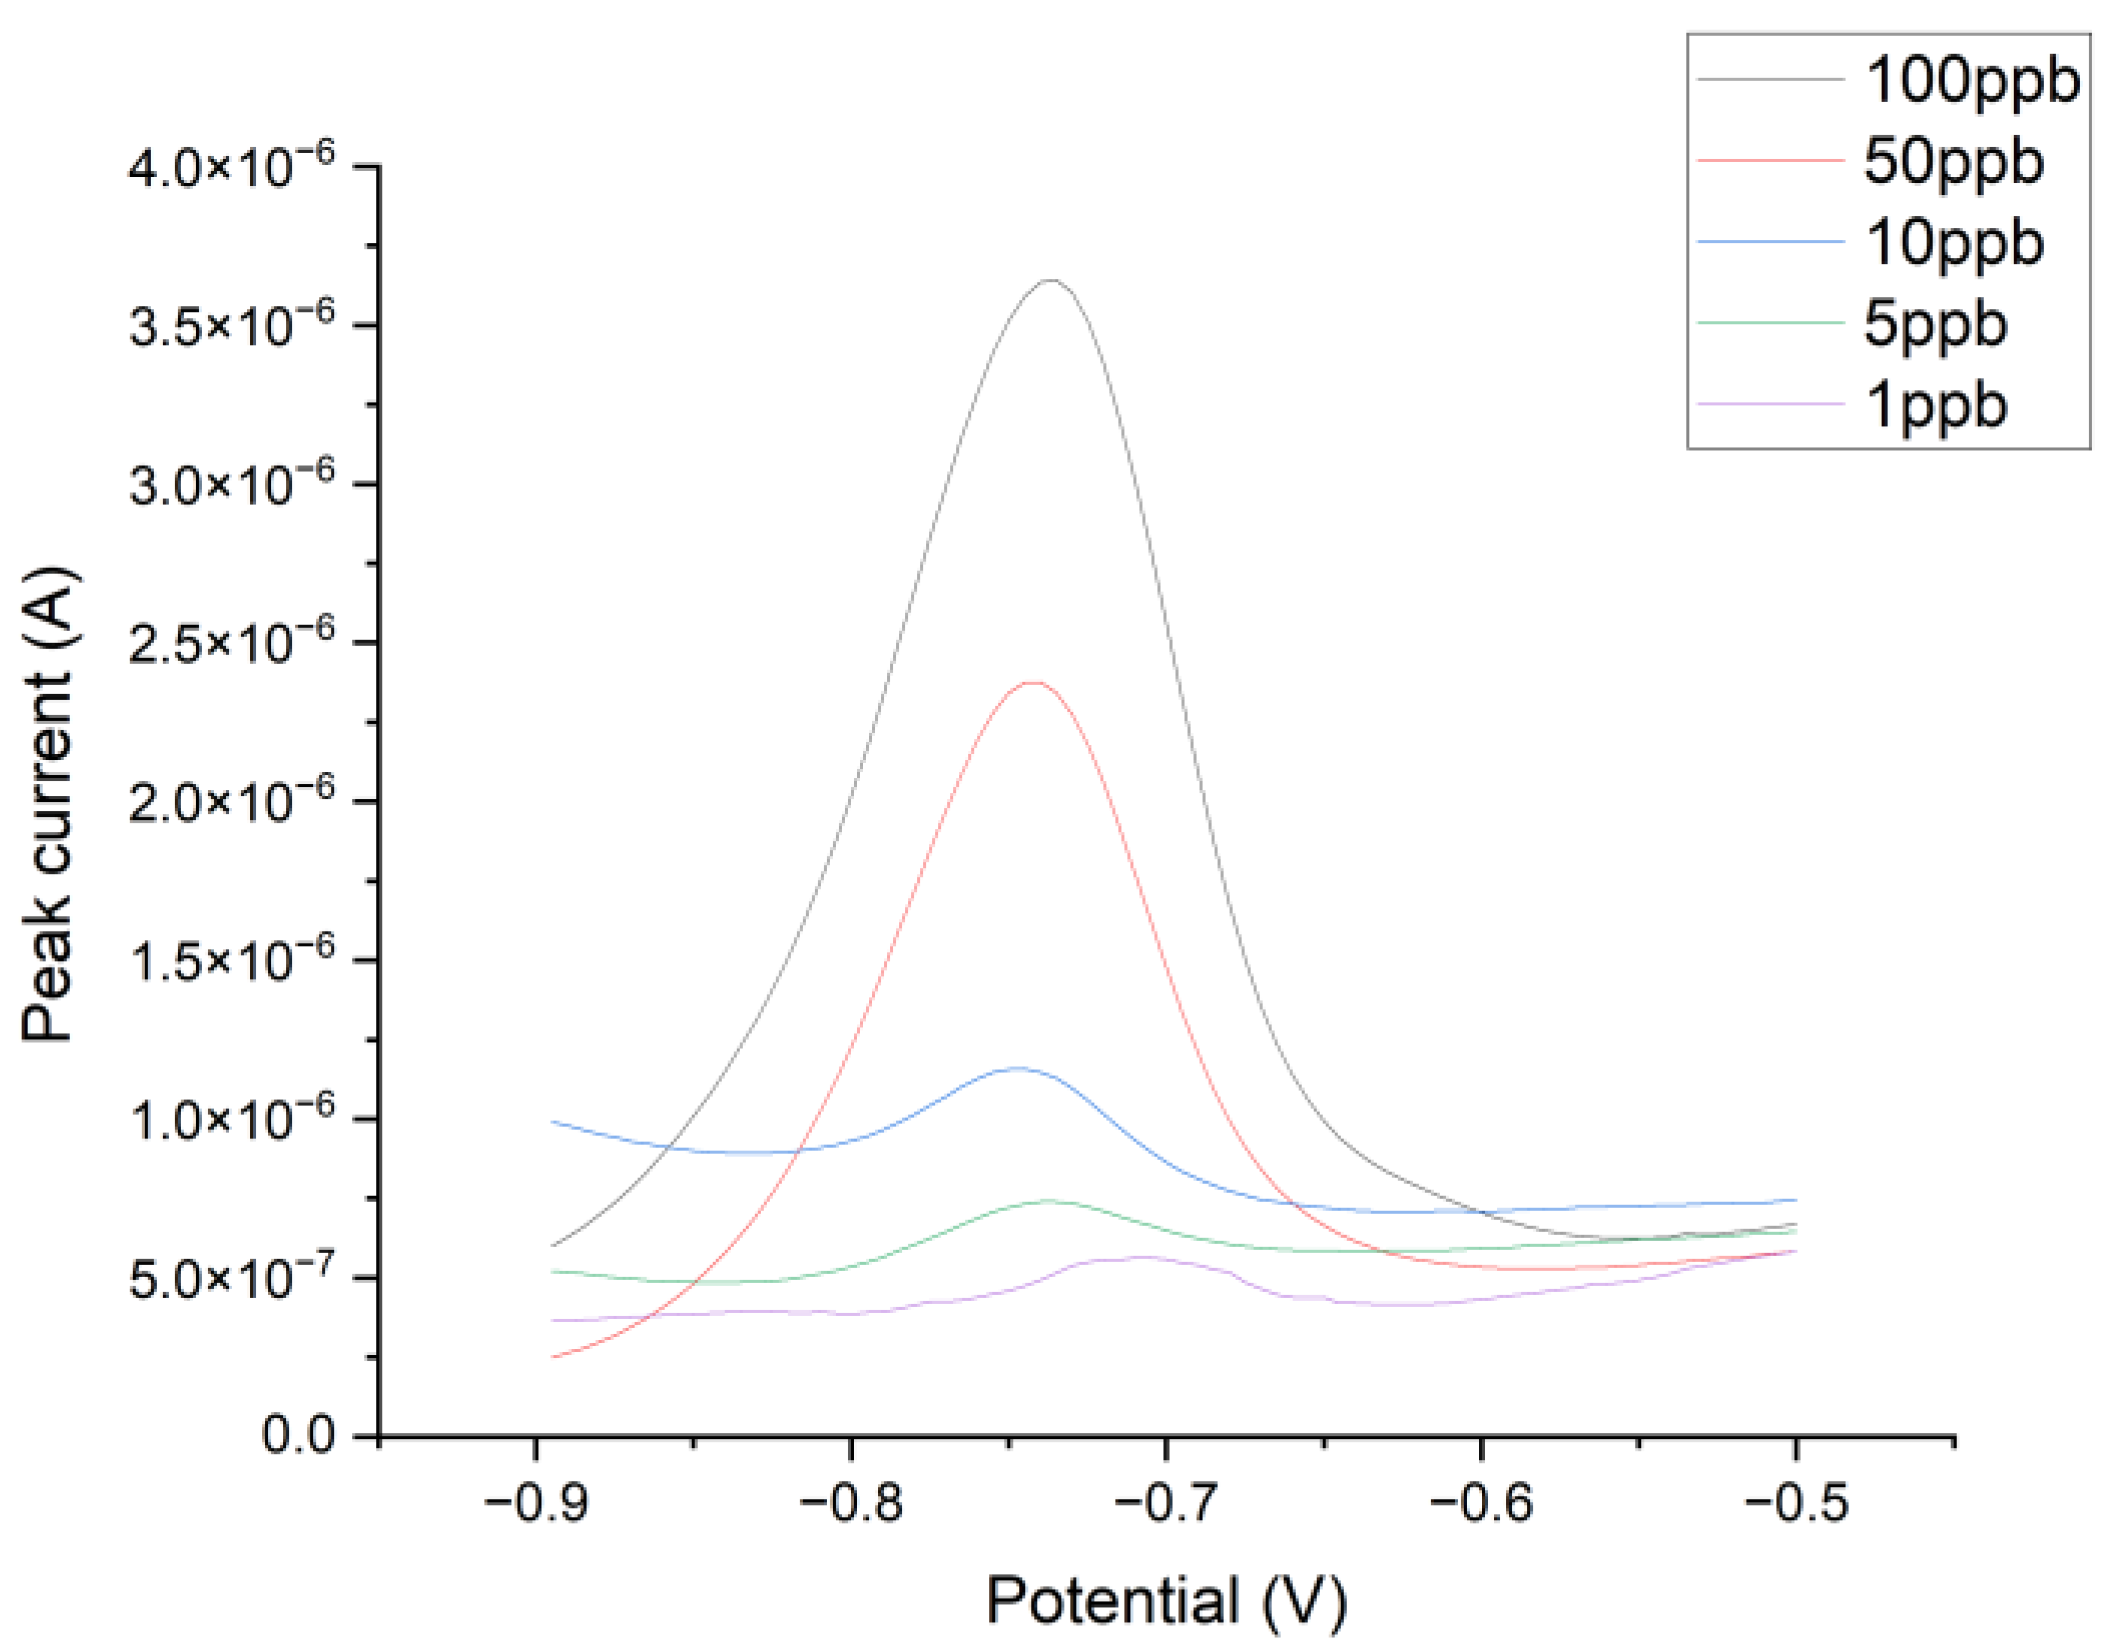
3.3. Detection of Heavy Metals

To evaluate the performance of the modified Nafion as an ion-exchange membrane (IEM) for electrochemical sensors, the ink was screen printed onto commercial sensors with screen-printed Ag as a working electrode (from BASi). The performance of the sensors with and without modified Nafion was evaluated by analyzing the concentrations of Pb(II) in 10 mM KNO3 buffer solution (pH = 5).
Figure 8 shows the peak intensity (log10 scale) of the SWASV measurement of 100 µg/L and 500 µg/L Pb(II) using commercial sensors with and without the modified Nafion. The stripping peak currents of sensors without modified Nafion were at 0.0452 µA and 0.151 µA for 100 µg/L and 500 µg/L of Pb(II), respectively. With Nafion coating as the ion-exchange membrane, the peak current increased more than 50 times to 3.13 µA for 100 µg/L of Pb(II) and to 17.61 µA for Pb(II) level of 500 µg/L, respectively. The significant increase in peak intensity is due to the target Pb(II) ions being pre-concentrated by the sulfonated groups, which indicates that the modified Nafion material still possesses strong cation-exchange properties.
The performance of the commercial sensors with modified Nafion was further characterized by analyzing Pb(II) with concentrations ranging from 1 µg/L to 500 µg/L in 10 mM KNO3 buffer solutions. The obtained voltammograms at various Pb(II) concentrations are shown in Figure 9. The anodic peak of Pb(II) has a peak potential of −0.74 V, and the peak intensity increases with the increase in Pb(II) concentrations. The peak shape and baseline are good at most concentrations except for those at 1 µg/L, at which the signal-to-noise ratio (S/N) is slightly less than 3. Solutions containing different Pb(II) concentrations were analyzed in triplicate, and the average peak currents were plotted as a function of Pb(II) concentrations, as shown in Figure 10. Standard deviations at each level are also included in the calibration curve as Y-axis error bars. Overall, the commercial sensor with modified Nafion showed good linearity within the range of 5 µg/L to 500 µg/L of Pb(II) with an R-square value of 0.989. The detection limit for Pb(II) is estimated at around 2 µg/L based on the S/N ratio. The obtained detection limit of sensors with the modified Nafion is below the EPA regulatory limit for Pb (15 µg/L) and is also comparable to those with other electrode materials in previous reports [8,9]. No delamination was found in those tested sensors and the Nafion membrane retained its integrity and functionality after 1 month of soaking in the buffer solutions. Again, this result demonstrates the superior application potential of modified Nafion as a screen-printable, cation-exchange membrane in electrochemical sensing and detection.

4. Conclusions

A novel, screen-printable Nafion™ polymer dispersion was developed by pH adjustment and solvent replacement of commercial Nafion solutions. The obtained Nafion in the sodium form has strong shear-thinning behavior, moderate thixotropy recovery rate, and moderate yield stress, which is well-suited for screen printing. Meanwhile, the modified Nafion retained its original chemical structure and excellent cation-exchange capability. The dispersion was cured at 55 °C to reduce the degree of crystallinity for better ionic conductivity. The modified Nafion as a cation-exchange membrane significantly increased the response of the electrochemical sensor for detecting Pb(II) in buffer solutions. A commercial Ag electrode with screen-printed modified Nafion has shown good sensitivity, repeatability, and linearity on the detection of Pb(II) at the detection limit of 2 µg/L by SWASV.

5. Patents

The work reported in this manuscript is related to the following patent: U.S. Patent Publication 2021/0292581A1, “Printable dispersion with tunable viscosity”.

Author Contributions

Conceptualization, Z.C., X.C. and Q.W.; methodology, Z.C., X.C., R.P. and Q.W.; validation, Z.C., C.S. (Cody Simmons), R.P. and J.B.; formal analysis, R.P., J.B. and Q.W.; investigation, R.P., J.B., C.K., C.S. (Camron Satterfield), C.S. (Cody Simmons) and A.N.; resources, Z.C., C.S. (Cody Simmons) and A.N.; data curation, C.S. (Cody Simmons), Z.C., R.P. and Q.W.; writing—original draft preparation, Q.W.; writing—review and editing, Q.W., R.P. and J.B.; visualization, Q.W., R.P. and J.B.; supervision, Z.C. and Q.W.; project administration, Z.C. and Q.W.; funding acquisition, R.P. and Q.W. All authors have read and agreed to the published version of the manuscript.

Funding

This research was funded by the U.S. Army Engineer Research and Development Center–Environmental Laboratory (ERDC-EL) under the program W912HZ-21-2-0019. Any opinions, findings, and conclusions, or recommendations expressed in this material are those of the author(s) and do not necessarily reflect the views of ERDC-EL.

Institutional Review Board Statement

Not applicable.

Informed Consent Statement

Not applicable.

Data Availability Statement

All data are included in the manuscript.

Conflicts of Interest

The authors declare no conflict of interest. The funders had no role in the design of the study; in the collection, analyses, or interpretation of data; in the writing of the manuscript, or in the decision to publish the results.

References

  1. Scott, K.; Shukla, A.K. Polymer Electrolyte Membrane Fuel Cells: Principles and Advances. Rev. Environ. Sci. Biotechnol. 2004, 3, 273–280. [Google Scholar] [CrossRef]
  2. Kim, T.-H.; Yi, J.-Y.; Jung, C.-Y.; Jeong, E.; Yi, S.-C. Solvent Effect on the Nafion Agglomerate Morphology in the Catalyst Layer of the Proton Exchange Membrane Fuel Cells. Int. J. Hydrogen Energy 2017, 42, 478–485. [Google Scholar] [CrossRef]
  3. Dai, J.; Teng, X.; Song, Y.; Ren, J. Effect of Casting Solvent and Annealing Temperature on Recast Nafion Membranes for Vanadium Redox Flow Battery. J. Membr. Sci. 2017, 522, 56–67. [Google Scholar] [CrossRef]
  4. Jayakrishnan, M.P.; Vena, A.; Meghit, A.; Sorli, B.; Perret, E. Nafion-Based Fully Passive Solid-State Conductive Bridging RF Switch. IEEE Microw. Wirel. Compon. Lett. 2017, 27, 1104–1106. [Google Scholar] [CrossRef]
  5. Cele, N.; Ray, S.S. Recent Progress on Nafion-Based Nanocomposite Membranes for Fuel Cell Applications: Recent Progress on Nafion-Based Nanocomposite Membranes. Macromol. Mater. Eng. 2009, 294, 719–738. [Google Scholar] [CrossRef]
  6. Jeon, J.-Y.; Kang, B.-C.; Ha, T.-J. Flexible PH Sensors Based on Printed Nanocomposites of Single-Wall Carbon Nanotubes and Nafion. Appl. Surf. Sci. 2020, 514, 145956. [Google Scholar] [CrossRef]
  7. Keawkim, K.; Chuanuwatanakul, S.; Chailapakul, O.; Motomizu, S. Determination of Lead and Cadmium in Rice Samples by Sequential Injection/Anodic Stripping Voltammetry Using a Bismuth Film/Crown Ether/Nafion Modified Screen-Printed Carbon Electrode. Food Control 2013, 31, 14–21. [Google Scholar] [CrossRef]
  8. Frutos-Puerto, S.; Miró, C.; Pinilla-Gil, E. Nafion-Protected Sputtered-Bismuth Screen-Printed Electrode for On-Site Voltammetric Measurements of Cd(II) and Pb(II) in Natural Water Samples. Sensors 2019, 19, 279. [Google Scholar] [CrossRef] [Green Version]
  9. Kokkinos, C.; Economou, A. Disposable Nafion-Modified Micro-Fabricated Bismuth-Film Sensors for Voltammetric Stripping Analysis of Trace Metals in the Presence of Surfactants. Talanta 2011, 84, 696–701. [Google Scholar] [CrossRef]
  10. Palisoc, S.; Sow, V.A.; Natividad, M. Fabrication of a Bismuth Nanoparticle/Nafion Modified Screen-Printed Graphene Electrode for in Situ Environmental Monitoring. Anal. Methods 2019, 11, 1591–1603. [Google Scholar] [CrossRef]
  11. Liu, M.; Xiang, J.; Zhou, J.; Ding, H. A Disposable Amperometric Sensor for Rapid Detection of Serotonin in the Blood and Brain of the Depressed Mice Based on Nafion Membrane-Coated Colloidal Gold Screen-Printed Electrode. J. Electroanal. Chem. 2010, 640, 1–7. [Google Scholar] [CrossRef]
  12. Lee, C.-H.; Wang, S.-C.; Yuan, C.-J.; Wen, M.-F.; Chang, K.-S. Comparison of Amperometric Biosensors Fabricated by Palladium Sputtering, Palladium Electrodeposition and Nafion/Carbon Nanotube Casting on Screen-Printed Carbon Electrodes. Biosens. Bioelectron. 2007, 22, 877–884. [Google Scholar] [CrossRef] [PubMed]
  13. Montes, C.; Contento, A.M.; Villaseñor, M.J.; Ríos, Á. A Screen-Printed Electrode Modified with Silver Nanoparticles and Carbon Nanofibers in a Nafion Matrix for Ionic Liquid-Based Dispersive Liquid-Liquid Microextraction and Voltammetric Assay of Heterocyclic Amine 8-MeIQx in Food. Microchim. Acta 2020, 187, 190. [Google Scholar] [CrossRef] [PubMed]
  14. Lazouskaya, M.; Tamm, M.; Scheler, O.; Uppuluri, K.; Zaraska, K. Nafion as a Protective Membrane for Screen-Printed PH-Sensitive Ruthenium Oxide Electrodes. In Proceedings of the 2020 17th Biennial Baltic Electronics Conference (BEC), Tallinn, Estonia, 6–8 October 2020; IEEE: Tallinn, Estonia, 2020; pp. 1–4. [Google Scholar] [CrossRef]
  15. Hsiao, F.-R.; Liao, Y.-C. Printed Micro-Sensors for Simultaneous Temperature and Humidity Detection. IEEE Sens. J. 2018, 18, 6788–6793. [Google Scholar] [CrossRef]
  16. Li, B.; Li, Z.; Situ, B.; Dai, Z.; Liu, Q.; Wang, Q.; Gu, D.; Zheng, L. Sensitive HIV-1 Detection in a Homogeneous Solution Based on an Electrochemical Molecular Beacon Coupled with a Nafion–Graphene Composite Film Modified Screen-Printed Carbon Electrode. Biosens. Bioelectron. 2014, 52, 330–336. [Google Scholar] [CrossRef]
  17. Zhu, M.; Li, N.; Ye, J. Sensitive and Selective Sensing of Hydrogen Peroxide with Iron-Tetrasulfophthalocyanine-Graphene-Nafion Modified Screen-Printed Electrode. Electroanalysis 2012, 24, 1212–1219. [Google Scholar] [CrossRef]
  18. Dai, Z.; Aboukeila, H.; Ansaloni, L.; Deng, J.; Giacinti Baschetti, M.; Deng, L. Nafion/PEG Hybrid Membrane for CO2 Separation: Effect of PEG on Membrane Micro-Structure and Performance. Sep. Purif. Technol. 2019, 214, 67–77. [Google Scholar] [CrossRef]
  19. Zhang, Y.; Zhu, Y.; Zheng, S.; Zhang, L.; Shi, X.; He, J.; Chou, X.; Wu, Z.-S. Ink Formulation, Scalable Applications and Challenging Perspectives of Screen Printing for Emerging Printed Microelectronics. J. Energy Chem. 2021, 63, 498–513. [Google Scholar] [CrossRef]
  20. Kreuer, K.D.; Ise, M.; Fuchs, A.; Maier, J. Proton and Water Transport in Nano-Separated Polymer Membranes. J. Phys. IV Proc. 2000, 10, Pr7-279–Pr7-281. [Google Scholar] [CrossRef]
  21. Chen, Z.; Fury, J.J.; Neeson, A. Printable Dispersion with Tunable Viscosity. United States Patent Application. U.S. Patent 17/208,386, 23 September 2021. [Google Scholar]
  22. Xu, C.; Willenbacher, N. How Rheological Properties Affect Fine-Line Screen Printing of Pastes: A Combined Rheological and High-Speed Video Imaging Study. J. Coat. Technol. Res. 2018, 15, 1401–1412. [Google Scholar] [CrossRef]
  23. Yüce, C.; König, M.; Willenbacher, N. Rheology and Screen-Printing Performance of Model Silver Pastes for Metallization of Si-Solar Cells. Coatings 2018, 8, 406. [Google Scholar] [CrossRef] [Green Version]
  24. Michelarakis, N.; Franz, F.; Gkagkas, K.; Gräter, F. Longitudinal Strand Ordering Leads to Shear Thinning in Nafion. Phys. Chem. Chem. Phys. 2021, 23, 25901–25910. [Google Scholar] [CrossRef] [PubMed]
  25. Xu, C.; Fies, M.; Willenbacher, N. Impact of Wall Slip on Screen Printing of Front-Side Silver Pastes for Silicon Solar Cells. IEEE J. Photovolt. 2017, 7, 129–135. [Google Scholar] [CrossRef]
  26. Barnes, H.A. A Handbook of Elementary Rheology; University of Wales, Institute of Non-Newtonian Fluid Mechanics: Aberystwyth, UK, 2000; Volume 1. [Google Scholar]
  27. Bertola, V.; Bertrand, F.; Tabuteau, H.; Bonn, D.; Coussot, P. Wall Slip and Yielding in Pasty Materials. J. Rheol. 2003, 47, 1211–1226. [Google Scholar] [CrossRef]
  28. Zhang, W.; Yue, P.-L.; Gao, P. Crystallinity Enhancement of Nafion Electrolyte Membranes Assisted by a Molecular Gelator. Langmuir 2011, 27, 9520–9527. [Google Scholar] [CrossRef]
  29. del Valle Martínez de Yuso, M.; Arango-Díaz, A.; Bijani, S.; Romero, V.; Benavente, J.; Rodríguez-Castellón, E. Chemical Surface, Thermal and Electrical Characterization of Nafion Membranes Doped with IL-Cations. Appl. Sci. 2014, 4, 195–206. [Google Scholar] [CrossRef] [Green Version]
Figure 1. Viscosity of modified Nafion ink as a function of shear rate.
Applsci 12 06533 g001
Figure 2. Time-dependent viscosity (thixotropic property) of the modified Nafion ink measured by three-level flow method.
Applsci 12 06533 g002
Figure 3. Yield stress analysis of modified Nafion inks by dynamic strain sweep. Black dotted line: storage modulus; red dotted line: loss modulus.
Applsci 12 06533 g003
Figure 4. XRD spectra of commercial Nafion and modified Nafion inks cured at different temperatures.
Applsci 12 06533 g004
Figure 5. XPS survey scans of the commercial Nafion (a) and modified Nafion (b).
Applsci 12 06533 g005
Figure 6. XPS high resolution scans of the commercial Nafion (left) and modified Nafion (right). From top to bottom: carbon—C1s, fluorine—F1s, oxygen—O1s and sulfur—S2p. The black curve in all sub-figures is the scan data; the blue curve is the fitted data; the red curves are the deconvoluted peaks, and the green curve is the baseline.
Applsci 12 06533 g006
Figure 7. High-resolution scan of Na1s of the modified Nafion material centered at 1070.74 eV. The black curve is the scan data; the blue curve is the fitted data, and the green curve is the baseline.
Applsci 12 06533 g007
Figure 8. Peak current (log10 scale) of ASWV for detection of different Pb(II) concentrations using sensors with or without a Nafion membrane.
Applsci 12 06533 g008
Figure 9. Anodic stripping voltammograms of 1 µg/L to 100 µg/L Pb(II) in 10 mM KNO3 detected by commercial sensor with modified Nafion.
Applsci 12 06533 g009
Figure 10. Calibration curve of Pb(II) from 1 µg/L to 500 µg/L detected by commercial sensor with modified Nafion.
Applsci 12 06533 g010
Table 1. XPS quantitative elemental analysis of theoretical, commercial and modified Nafion.
SampleS%C%O%F%Na%
Theoretical [29]1.5030.807.7060.000.00
Commercial Nafion0.9032.296.0960.730.00
Modified Nafion1.6330.198.9457.271.96
Table 2. LSCM film thickness and roughness measurements of screen-printed Nafion membranes.
SampleAvg Height (µm)Roughness (Sa) (µm)
Nafion Film 116.0283.710
Nafion Film 215.7772.906
Nafion Film 315.3973.045
Publisher’s Note: MDPI stays neutral with regard to jurisdictional claims in published maps and institutional affiliations.

