Article

Fatty Acid Content, Lipid Quality Indices, and Mineral Composition of Cow Milk and Yogurts Produced with Different Starter Cultures Enriched with Bifidobacterium bifidum

Department of Commodity and Food Analysis, Faculty of Food Sciences, University of Warmia and Mazury in Olsztyn, 10-719 Olsztyn, Poland
*
Author to whom correspondence should be addressed.
Appl. Sci. 2022, 12(13), 6558; https://doi.org/10.3390/app12136558
Submission received: 9 May 2022 / Revised: 24 June 2022 / Accepted: 26 June 2022 / Published: 28 June 2022
(This article belongs to the Special Issue Role of Microbes in Agriculture and Food)

Abstract

:
This study aimed to analyze the composition of fatty acids, with particular emphasis on the content of cis9trans11 C18:2 (CLA) acid, the content of minerals, and lipid quality indices in raw milk, pasteurized milk, and in yogurts produced with selected starter cultures enriched with Bifidobacterium bifidum. The GC-FID method was used to determine the fatty acid composition of those dairy products. To analyze the contents of microelements (copper, manganese, iron, and zinc) and macroelements (magnesium, calcium) flame atomic absorption spectrometry was used. The content of phosphorus was determined with the usage of the colorimetric method and the contents of sodium and potassium with emission method. Data analysis showed that such technologies as milk pasteurization and milk fermentation had a significant impact on the fatty acid profile and contents of micro- and macroelements. The lipid quality indices: atherogenicity index (AI), index thrombogenicity (TI), hypocholesterolemic/hypercholesterolemic index (H/H), and (n − 6)/(n − 3) ratio, were at similar levels in raw and pasteurized milk and yogurts produced. Starter culture type affected the content of cis-9, trans-11 CLA C18:2 acid in yogurts. Out of the starter cultures applied in the study, only the FD-DVS YC-X16 Yo-Flex starter culture with BB-12 caused a significant (p < 0.05) increase in CLA content. The CLA content of the yogurts produced using this starter culture was 2.67 mg/g fat. In raw milk, pasteurized milk, and the second batch of yogurts, the content of cis-9, trans-11 C18:2 acid was significantly lower and reached 2.26 mg/g fat, 2.17 mg/g fat, and 2.30 mg/g fat, respectively. The study indicated that, when it comes to being a source of minerals, yogurts were better than milk. Yogurts were also characterized by significantly (p < 0.05) higher contents of all micro- and macroelements taken into account in this study than the raw milk used to produce them.

1. Introduction

Milk and dairy products are recognized as food products of high nutritional and dietary value [1]. They are important sources of energy, high-quality protein, fats, lactose, micro- and macro-elements, and vitamins and enzymes that ensure normal human growth and development as well as vital functions of the body [2]. Mineral components affect metabolic transformations and chemical reactions, and are also involved in the normal body development and functions. Their content is determined by various factors, including condition of the natural environment or animal feeding system, both of which influence the quality of raw material and dairy products made of it [3,4,5]. Milk and dairy products represent good sources of calcium (Ca) and phosphorus (P), which are necessary for bone growth development and metabolism [6,7]. Milk fat, both in terms of its dispersion and fatty acid composition, plays an important role in developing the taste and consistency of yogurts. The composition of milk fatty acids (FA) elicits multiple effects on the quality of milk and dairy products, including their physical properties and nutritional value (e.g., effects on human health). Different fatty acids, such as short- and medium-chain saturated, branched, mono- and polyunsaturated, cis and trans, and conjugated linoleic acid cis-9, trans-11 C18:2 (CLA) present in ruminant milk fat can potentially have positive or negative influence on consumer health [8,9]. Short-chain fatty acids (SCFA), including butyric acid (C4:0), are known modulators of gene function and may also play a certain role in cancer prevention. Fatty acids C8:0 and C10:0 may exhibit antiviral activities [10], while branched-chain fatty acids (BCFA) have been shown to elicit anti-cancer effects [11,12]. In turn, oleic acid (cis9 C18:1), the most common MUFA in milk fat, has been demonstrated to increase the activity of low-density lipoprotein receptors and to decrease the cholesterol concentration in serum [13]. Trans-vaccenic acid, which is the main trans C18:1 isomer in milk fat, is said to have anti-cancer and anti-atherogenic effects [14]. Research has shown that n–3 PUFAs can be helpful in heart disease prevention as well as improvement of the immune response, whereas linolenic acid (C18:3) is said to exhibit anti-carcinogenic and anti-atherogenic properties [15,16]. In turn, (n − 6) PUFAs have been reported to improve sensitivity to insulin and thus reduce the incidence of type 2 diabetes [17]. Finally, the cis-9, trans-11 C18:2 acid (CLA) has been proven to display multiple health-promoting properties [18,19,20,21,22].
It is widely accepted that excessive intake of C12:0, C14:0, and C16:0 saturated fatty acids (SFAs), which account for approximately 70% of the total fatty acids in milk fat, are unhealthy [16,23]. However, the matrix in which these SFAs are contained may elicit positive health outcomes. As proven by recent research, several dairy matrix components, such as calcium, peptides, phosphorus, and the milk fat globule membrane, are able to modify blood lipid responses to SFA intake [24,25]. The fatty acid profile has an impact on the nutritional quality of milk and dairy products. In order to assess the nutritional value of a diet and determine whether it has a positive effect on consumer health, the proportions of individual fatty acids are broadly examined, including desirable fatty acids (DFA), hypocholesterolemic/hypercholesterolemic index (H/H), atherogenicity index (AI) and thrombogenicity index (TI), and (n − 6)/(n − 3) ratio.
The contents of all the previously mentioned milk constituents, such as fatty acids and minerals, may differ from their contents in dairy products. Research results indicate that these differences may be due to various factors used in the technological process, such as heat treatment, homogenization or pasteurization, standardization [26,27,28,29,30], fermentation, starter culture type, fermentation time, and storage time and conditions [31,32,33,34,35,36]. High nutritional value of yogurts and other fermented milk drinks is highly influenced by the quality of milk and the production process used, as well as the possible increase in their bioavailability due to the fermentation process. Yogurt is one of the best-known foods containing probiotics [37,38]. It is defined as a coagulated milk product that results from lactic acid fermentation in milk by Lactobacillus bulgaricus and Streptococcus thermophilus [39]. The lactic acid bacteria (LAB) used in the yogurt production are microorganisms that are involved in the traditional fermentation process. Other lactic acid bacteria (LAB) species are now frequently used to impart unique characteristics to the final product. Thus, a carefully selected mixture of LAB species is used to complement each other and to achieve a remarkable efficiency in acid production. In order to ensure good conditions for effective milk fermentation and to obtain the right quality of yogurt, you can use special mixtures of starter cultures available on the market. These mixtures contain several strains of lactic acid bacteria with acid-forming, protective, and organoleptic properties, which ensure the proper process of milk fermentation. As research indicates that certain strains of the genus Bifidobacterium are capable of converting CLA isomers (cis-9, trans-11 C18:2 and trans-10, cis-12 C18:2) from the linoleic acid (LA) present in milk, there is an increase of new probiotic strains available on the market [40,41,42,43,44,45]. Bifidobacterium have many beneficial properties, including production of lactic and acetic acids, which results in a positive lowering of the pH in the human digestive tract [40,42]. Research on the ability of probiotic Bifidobacterium to biosynthesize CLA may afford new possibilities for improving the functional properties of food through the microbiologically-promoted increase in the amount of health-promoting components [40,45].
Therefore, this study aimed to analyze the composition of fatty acids, with particular emphasis on the content of cis9trans11 C18:2 (CLA) acid, the content of minerals, and lipid quality indices in raw milk, pasteurized milk, and in yogurts produced with selected starter cultures enriched with Bifidobacterium bifidum.

2. Materials and Methods

2.1. Materials

The research material was milk and yogurts produced using selected starter cultures enriched with Bifidobacterium bifidum. The raw material for the production of yogurts covered by the study was cows’ collective milk, which is a mixture of milk from many cows of different breeds (about 45 cows, including 50% Simmental cows and 50% of a mixture of Polish Red and Simmental breeds). The milk was collected from individual producers with farms located in Warmia and Mazury. The milk was purchased in January, it came from cows fed with the cowshed method. The cows were fed with their own production of haylage and maize silage (70–80% of the ration) and, triticale, rye, and oat sharps. Additionally, the cows received 1.5 to 2 kg of concentrate for dairy cows. The milk was delivered in a tank to the Technology Hall. Four portions of milk were taken from the delivered milk for the production of yogurts. Two portions of milk were inoculated with the culture starter FD-DVS YC-180 Yo-Flex with BB-12 containing Lactobacillus delbrueckii subsp. bulgaricus, Lactobacillus delbrueckii subsp. lactis, Streptococcus thermophiles, and Bifidobacterium bifidum (Chr. Hansen, Hørsholm, Denmark), and the two were inoculated with culture YC-X16 and BB-12 containing Lactobacillus delbrueckii subsp. bulgaricus, Streptococcus thermophilus, and Bifidobacterium bifidum (Chr. Hansen, Hørsholm, Denmark). Analyses were carried out for raw milk, pasteurized milk prepared for the production of yogurts, and manufactured yogurts. The yogurts used for the analyses were produced by the thermostatic method. The production process included the following stages: first, the raw milk was heated to 45 °C, then subjected to a centrifugation and degassing process (80 kPa; 60 °C). The milk prepared in this way was then pasteurized using the HTST method (72 °C/15 s; ALFA-LAVAL P20-HB pasteurizer, Lund, Sweden) and left to cool down to the temperature of 6 °C (ALFA-LAVAL P20-HB pasteurizer, Lund, Sweden). After the completion of the cooling process, skim milk was added to the milk to standardize the fat content to 2 ± 0.1%. The material was then homogenized in a two-stage process (18/5 MPa, 65 °C; CN003 homogenizer, Spomasz Bełżyce, Poland) and then pasteurized in a long-term VHT (Very High Temperature) pasteurization (90 °C/5 min; ALFA-LAVAL P20-HB pasteurizer, Lund, Sweden). The milk was then cooled to 45 °C and inoculated with selected starter cultures (powder form) that were pre-incubated for 2 h at 45 °C in the amount of 1 mL/L of milk. After the production process was completed, the yogurts were packaged into unit-size containers and left to mature in thermostats (Binder GF115, Tuttingen, Germany) for approximately 4 h at the temperature of 43.5 °C, until they reached pH 4.6. Four samples of yogurts from each production process and each batch were collected for analyses. In total, sixteen samples of yogurt were collected, and their analyses were conducted in two parallel replications.

2.2. Methods

2.2.1. Fat Extraction

The Roese-Gottlieb method was used to extract fat from raw and pasteurized milk [46]. The Folch method was used for the extraction of fat from yogurts [47].

2.2.2. Preparation of Fatty Acid Methyl Esters

The IDF standard method (ISO 15884:2002) was used in the process of converting fatty acids into their corresponding fatty acid methyl esters (FAME) [48].

2.2.3. Analysis of Fatty Acid Composition by GC Method

The composition of fatty acids was determined with the gas chromatography method using a HP 6890 GC System (Münster, Germany) with a flame-ionization detector (FID) was used. A capillary column with a length of 100 m and internal diameter of 0.25 mm was used; the liquid phase was CP Sil 88 (Chrompack, Middelburg, the Netherlands), and the film thickness was 0.2 μm. The analysis was carried out in the following conditions: column temperature from 60 °C (for 1 min) to 180 °C (∆t = 5 °C/min), detector temperature 250 °C, injector temperature was 225 °C, helium was carrier gas (gas flow 1.5 mL/min). The sample injection volume was 0.4 µL (split mode 50:1). The comparison of the retention times of fatty acids with the retention times of methyl esters of fatty acids of reference milk fat (BCR Reference Materials) of CRM 164 symbol and literature data were used to identify fatty acids present in analyzed products [49,50,51]. A mixture of CLA methyl esters (Sigma-Aldrich, St. Louis, MO, USA) was used to identify the cis-9, trans-11 CLA isomer. The standards of methyl esters (Sigma-Aldrich, St. Louis, MO, USA) were used for the identification of the positional trans isomers of C18:1, whereas the trans isomers of C18:2 acid (cis, trans and trans, cis) were identified with the use of a mixture of standards of C18:2 isomers (Supelco, Bellefonte, PA, USA). Contents of fatty acids were calculated in mg/g fat with respect to the introduced standard (methyl ester of C21:0 acid, Sigma-Aldrich, Germany).

2.2.4. The Lipid Quality Indices

The following formulae was used to calculate the hypocholesterolemic fatty acids (DFA) [52]:
DFA = UFA + C18:0
Index of Hypercholesterolemic fatty acids (OFA)
OFA = C12:0 + C14:0 + C16:0
The AI and TI Indices were calculated using the following model [23,53]:
Index of Atherogenicity (AI):
AI = (C12:0 + (4 × C14:0) + C16:0)/((n − 3) PUFAs + (n − 6) PUFAs + MUFAs)
Index of Thrombogenicity (TI):
TI = (C14:0 + C16:0 + C18:0)/((0.5 × C18:1) + (0.5 × sum of other MUFAs) + 0.5 × (n − 6) PUFAs) + (3 × (n − 3) PUFAs) + (n − 3) PUFAs/(n − 6) PUFAs
H/H ratio (hypocholesterolemic/hypercholesterolemic) was calculated using the following model by Ivanova and Hadzhinikolova [54]:
H/H = (C18:1(n − 9) + C18:2(n − 6) + C18:3(n − 3))/(C12:0 + C14:0 + C16:0)

2.3. Mineral Analysis

The milk and yogurt samples were dried at 105 °C to determine the presence of minerals. Then, the dried samples were subjected to the carbonization process and incinerated at the temperature of 480 °C for several hours. The white ash, obtained after the mineralization process, was dissolved in 1 M HNO3, (Suprapur-Merck, Darmstadt, Germany) and transferred into a 25-mL volumetric flask using deionized water. Flame atomic absorption spectrometry (acetylene—air flame) using a Thermo iCE 3000 Series (Madison, WI, USA) with a Glite data station, background correction (deuterium lamp), and appropriate cathode lamps was used to determine the contents of copper (Cu), iron (Fe), zinc (Zn), magnesium (Mg), and calcium (Ca). Lanthanum chloride (0.5% La3+) was added for calcium determination. The determination of selected elements was performed at the following wavelengths: 324.8 nm (Cu), 279.5 nm (Mn), 248.3 nm (Fe), 213.9 nm (Zn), 285.2 nm (Mg), and 422.7 nm (Ca). The emission technique (acetylene-air flame) was applied for the identification of the concentrations of sodium and potassium. An atomic absorption spectrometer Thermo iCE 3000 Series (Waltham, MA, USA), equipped with a Glite data station, operating in an emission system was used to perform the analyses. The determination was carried out at the following wavelengths: 589.0 nm (Na) and 766.5 nm (K). The colorimetric method with ammonium molybdate(VI), sodium sulfate(IV), and hydroquinone helped determine the content of phosphorus (P—610 nm). Absorbance measurements were performed using Spectrophotometer VIS 6000 (KRÜSS—OPTRONIC, Hamburg, Germany).

2.4. Statistical Analysis

The Statistica software package version 13.3 (StatSoft, Kraków, Poland, 2016) was used in the data analysis [55]. Significant differences were calculated according to analysis of variance (ANOVA) test and Duncan’s test with the significance level of p < 0.05.

3. Results and Discussion

3.1. Fatty Acid Composition and Lipid Quality Indices

Data presented in Table 1 shows the total content of fatty acid groups and the values of lipid quality indices in the analyzed samples. The fatty acid composition of milk fat is very complex as it includes over 400 different fatty acids (FAs) of various chain lengths and degrees of unsaturation. The fat of cow’s milk contains about 70% of SFAs, 25% of MUFAs, and 2–5% PUFAs [56,57]. The short-chain fatty acids (SCFA) (from C4:0 to C10:0 carbon atoms) account for approximately 10% of the total SFAs. Saturated fatty acids (SFAs) were found in the highest amount in the fats extracted from the analyzed milk samples. Pasteurized milk was found to contain the highest content of these acids. Fat from raw milk and yogurts was characterized by a significantly (p < 0.05) lower SFA content (Table 1). The fat from pasteurized milk had a significantly (p < 0.05) higher content of short-chain fatty acids (SCFAs) and odd-chain fatty acids (OCFAs). The content of branched fatty acids (BCFAs) in the fat of the analyzed milk and yogurts was at a similar level. Analyzed pasteurized milk and yogurts produced using FD-DVS YC-X16 Yo-Flex with BB-12 had a significantly (p < 0.05) higher MUFA content than raw milk and yogurts produced using FD-DVS YC-180 Yo-Flex with BB-12. The highest content of PUFAs (20.19 mg/g fat) was determined in the fat from pasteurized milk. Raw milk and fat from yogurts produced had significantly lower (p < 0.05) contents of PUFAs (Table 1). The fatty acid profile of dairy products, apart from the quality of the raw material, may be influenced by the conditions used in the technological process, such as heat treatment, homogenization, fermentation, and storage. However, the studies addressing these issues have produced inconsistent findings. According to Santos Júnior et al. [32], milk after pasteurization was characterized by a higher content of SCFAs and PUFAs and lower content of MUFAs. In turn, Khan et al. [26] presented a study in which an increase in short-chain fatty acids (SCFA) and medium-chain fatty acids (MCFA) as well as a decrease in long-chain fatty acids (LCFA) after pasteurization and cooking, was observed, due to high milk temperature, while the study by Pestana et al. [27] demonstrated a decline in SCFAs.
From the nutritional point of view, it is particularly important to determine the content of (n − 6) PUFA and (n − 3) PUFA fatty acids because their proper supply is essential for human health [15]. The conducted research showed a significantly higher (p < 0.05) content of (n − 3) and (n − 6) PUFAs in fat obtained from pasteurized milk (Table 1) than in fat from raw milk and yogurts. Analyzed milk and yogurt had the (n − 6)/(n − 3) ratio at a similar level. Excessive amounts of (n − 6) PUFAs and a high (n − 6)/(n − 3) ratio present in a diet are said to promote the pathogenesis of many diseases, whereas diets with an increased level of (n − 3) PUFAs and a lower (n − 6)/(n − 3) ratio exert suppressive effects [58,59]. The research by Santos Junior et al. [32] showed that yogurts and pasteurized milk had significantly lower contents of (n − 6) acids than raw milk, and the content of (n − 3) acids was significantly lower in yogurts than in raw and pasteurized milk. The research presented by these authors indicated that yogurts were characterized by a significantly higher (n − 6)/(n − 3) ratio than raw and pasteurized milk. The optimal (n − 6)/(n − 3) ratio should be 2:1 to 3:1; however, the risk of many chronic diseases can be reduced by diets with a lower (n − 6)/(n − 3) ratio, which makes it more desirable [59].
The values of DFAs (desirable hypocholesterolemic fatty acids) and OFA (hypercholesterolemic fatty acids) were different in the analyzed milk and produced yogurts (Table 1). Fat from pasteurized milk was characterized by the highest content of DFAs, while fat from raw milk and yogurts produced had a significantly lower (p < 0.05) content of. Significantly (p < 0.05) higher contents of OFAs were found in fat from pasteurized milk than in raw milk. The content of OFAs in the fat from analyzed yogurts varied significantly (p < 0.05).
The atherogenic index (AI) and thrombogenic index (TI) take into account the different effects that single fatty acids might have on human health. The AI and TI prove better in characterizing the atherogenic and thrombogenic potential of the diet than the PUFAs/SFAs ratio [23]. The AI and the TI are great tools in the assessment of the potential effects of FAs composition on our health. Diets that include products in which the composition of fatty acids are with lower AI and TI may be helpful in reducing the risk of coronary heart disease due to a better nutritional quality of said products [13]. AI indicates the relationship between the sum of primary saturated fatty acids and that of main classes of unsaturated, the former being considered pro-atherogenic (favoring the adhesion of lipids to cells of the immunological and circulatory system), and the latter anti-atherogenic (inhibiting the aggregation of plaque and diminishing levels of esterified fatty acids, cholesterol, and phospholipids, thereby preventing the appearance of micro- and macro-coronary diseases). On the other hand, TI shows the tendency to form clots in the blood vessels. Moreover, it characterizes the relationship between pro-thrombogenic (saturated) and anti-thrombogenic fatty acids (MUFAs, (n − 6) PUFAs, and (n − 3) PUFAs) [60]. Milk and milk products that are characterized by a low AI may have an impact on decreasing the possibility of coronary heart diseases. The presented study (Table 1) shows that the AI and TI values were at similar levels in raw milk, pasteurized milk, and yogurts produced. Their lower values, that indicate high quantities of anti-atherogenic fatty acids in fat, are recommended for a healthy diet. The hypocholesterolemic/hypercholesterolemic (HH) ratio characterizes the relationship between hypocholesterolemic fatty acid (cis C18:1 and PUFA) and hypercholesterolemic fatty acids (C12:0, C14:0, and C16:0) [61]. In the present study, the H/H ratio was at a similar level in milk and yogurts produced from this milk (Table 1).

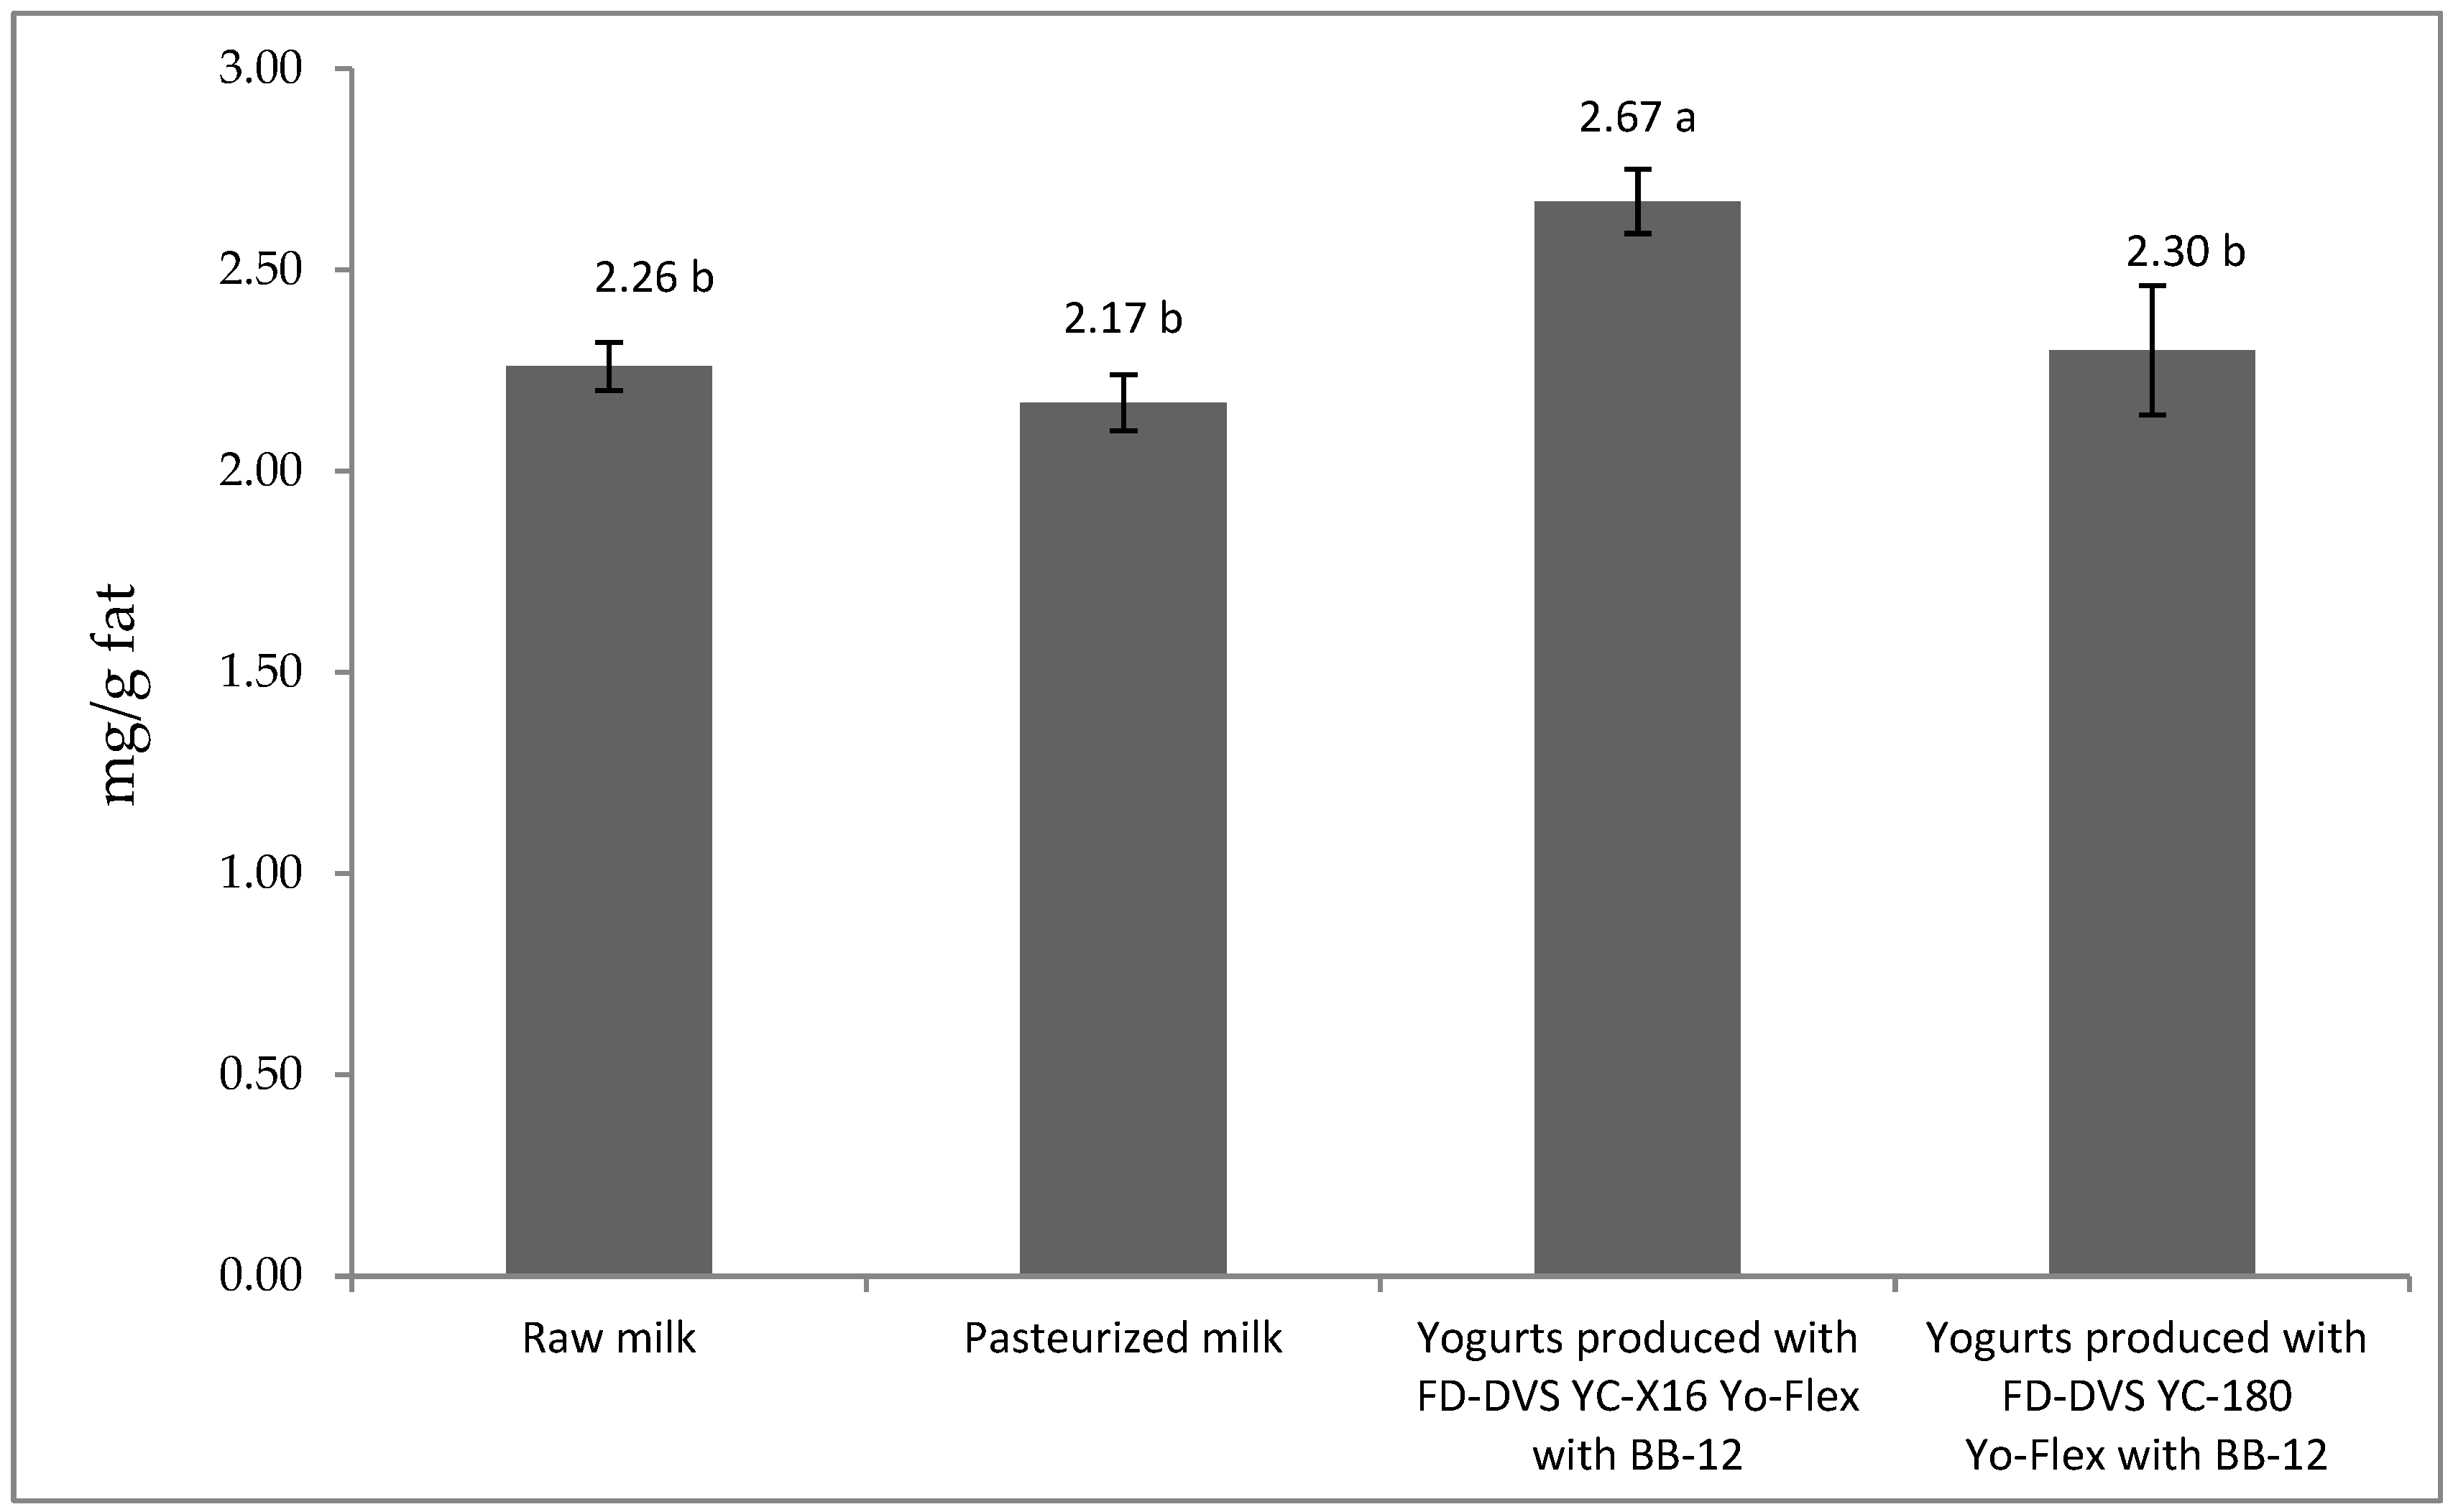
3.2. CLA Content in Milk and Yogurts

Probiotic bacteria used in dairy production are able to synthesize conjugated linolenic acid cis-9, trans-11 C18: 2 (CLA). According to literature data [62,63], the content of CLA in milk fat ranges from 2.3 to 6.0 mg/g of fat. Such variety is a result of different factors, including animal feeding, breed, age, and lactation period [64,65,66,67,68,69]. According to many authors [36,41,42,62,70], the content of CLA in fermented dairy products may be different than that of the milk they were made of. The production process can also be a factor that has an impact on its content in dairy products. The content of CLA in dairy products may be influenced by industrial technological treatments and additives used [71,72,73,74,75]. According to literature data [76,77,78,79], selected bacterial strains are capable of synthesizing CLA during fermentation; however, the process can be impacted by many factors, such as the number of cells, appropriate concentration of the substrate and incubation conditions.
The conducted research has shown that the content of CLA in raw milk was 2.26 mg/g of fat. In pasteurized milk its content was slightly lower, reaching 2.17 mg/g of fat. In yogurts produced using FD-DVS YC-180 Yo-Flex with BB-12 containing Lactobacillus delbrueckii subsp. bulgaricus, Lactobacillus delbrueckii subsp. lactis, Streptococcus thermophiles, and Bifidobacterium bifidum, it was at a similar level to the one found in raw milk. A significantly (p < 0.05) higher content of this acid (2.67 mg/g fat) was found in yogurts produced using the FD-DVS YC-X16 Yo-Flex starter culture with BB-12, containing Lactobacillus delbrueckii subsp. bulgaricus, Streptococcus thermophiles, and Bifidobacterium bifidum (Figure 1). A study by Santos Junior et al. [32] indicated that raw milk had 14.91 mg/g of fat of cis9trans11 C18:2 acid, while pasteurized milk and yogurts were characterized by a significantly lower content of this acid, reaching 6.22 mg/g of fat and 5.41 mg/g of fat, respectively. According to Lin et.al. [80], the content of CLA in fermented milk drinks varied from 3.82 mg/g of fat in yogurts to 4.66 mg/g of fat in buttermilk. In non-fermented milk drinks, the content of CLA ranged from 3.38 mg/g of fat in condensed milk to 4.49 mg/g of fat in whole milk. Prandini et al. [75] stated that the mean CLA content in Italian fermented milk drinks produced with varied starter cultures ranged from 4.42 mg/g of fat in probiotic yogurts to 6.15 mg/g of fat in fermented milk from mountain pasture cows.

3.3. The Mineral Composition of Milk and Yogurts

Table 2 presents the mean contents of selected micro-elements (Cu, Mn, Fe, and Zn), whereas Table 3 presents the mean contents of selected macro-elements (Mg, Ca, Na, K, and P) in raw milk, pasteurized milk, and yogurts produced. The yogurts had significantly (p < 0.05) higher contents of copper and manganese compared to milk they were made of (Table 2). The iron content was the highest (26.9 µg/100 g) in the yogurts produced using the FD-DVS YC-180 Yo-Flex starter culture enriched with BB-12, while milk and yogurts produced using the FD-DVS YC-X16 Yo-Flex starter culture with BB-12 had a significantly lower content of this element (Table 2). Zinc content was similar in both pasteurized milk and yogurts, whereas raw milk was characterized by a significantly (p < 0.05) lower value of this microelement.
Among the macroelements tested, calcium and potassium were found in the highest contents in milk and yogurts produced (Table 3). Their contents in pasteurized milk and yogurts were similar but significantly (p < 0.05) lower in raw milk. The magnesium content of raw milk reached 7.6 mg/100 g and was significantly lower than its contents in pasteurized milk and yogurts made of it (Table 3). Contents of sodium and phosphorus were the highest in the yogurts produced using the FD-DVS YC-180 Yo-Flex starter culture with BB-12 and reached 50.5 mg/100 g and 121.7 mg/100 g, respectively. In turn, the lowest contents of these elements were determined in the yogurts manufactured using the FD-DVS YC-X16 Yo-Flex starter culture with BB-12 and in pasteurized milk. Only raw milk had a significantly (p < 0.05) lower content of sodium and potassium compared to the pasteurized milk and yogurts. Research by Zamberlin et al. [81] showed similar contents of macronutrients (calcium, sodium, potassium, and phosphorus) in cow’s milk. In cow’s milk tested by Paszczyk et al. [82], the content of calcium, potassium, and phosphorus was also at a similar level, while the content of sodium was lower than in the milk used in these studies. Research by Paszczyk et al. [82] also showed that the content of minerals was significantly (p <0.05) higher than in yogurts produced from cow’s milk than in the milk used produce them. The increase of the content of micro- and macroelements in the analyzed yogurts compared to the milk used for their production may be caused, on the one hand, by the addition of powdered milk in the production process. Higher levels of some elements may also come from physical contamination from metals, plastics, and other materials used during the production and storage of fermented milk products.

4. Conclusions

Data analysis showed that such technologies as milk pasteurization and milk fermentation had a significant impact on the fatty acid profile, lipid quality indices, and contents of micro- and macroelements in the analyzed samples of milk and yogurts. Yogurts were characterized by significantly (p < 0.05) higher contents of all determined micro- and macroelements compared to raw milk, which was used for their production. The study demonstrated that the starter culture type affected the content of cis-9, trans-11 CLA C18:2 acid in yogurts. Only one of all the starter cultures that were used to conduct this study, the FD-DVS YC-X16 Yo-Flex starter culture with BB-12, caused a significant increase in CLA content. Appropriate selection of lactic acid bacteria strains and appropriate production process conditions may result in fermented milk products being naturally enriched in CLA isomers, which might be a new trend in the dairy market. However, the topic of whether CLA production by LAB and Bifidobacteria can be enhanced needs further research to help determine the optimal requirements for these starter cultures.

Author Contributions

B.P. manuscript conceptualization and preparation, performed the experiment, methodology, data analysis, review and writing—original draft preparation, project administration, and funding acquisition; E.T. performed the experiment, methodology, data analysis, and review. All authors have read and agreed to the published version of the manuscript.

Funding

This project was financially supported by the Minister of Education and Science in the scope of the program entitled “Regional Initiative of Excellence” for the years 2019–2022; project No. 010/RID/2018/19; amount of funding: PLN 12.000.000.

Institutional Review Board Statement

Not applicable.

Informed Consent Statement

Not applicable.

Data Availability Statement

Data is contained within the article.

Acknowledgments

We would like to express special thanks to Waldemar Brandt for help in preparing yogurts for research.

Conflicts of Interest

The authors declare no conflict of interest.

References

  1. Korhenen, H. Bioactive Components in Bovine Milk. In Bioactive Components in Milk and Dairy Products; Park, Y.W., Ed.; Wiley-Blackwell: Singapore, 2009; pp. 15–42. [Google Scholar]
  2. Lordan, R.; Tsoupras, A.; Mitra, B.; Zabetakis, I. Dairy fats and cardiovascular disease: Do we really need to be concerned? Foods 2018, 7, 29. [Google Scholar] [CrossRef] [PubMed] [Green Version]
  3. Dobrzański, Z.; Kołacz, R.; Górecka, H.; Chojnacka, K.; Bartkowiak, A. The Content of Microelements and Trace Elements in Raw Milk from Cows in the Silesian Region. Pol. J. Environ. Stud. 2005, 14, 685–689. [Google Scholar]
  4. Brodziak, A.; Litwińczuk, A.; Kędzierska-Matysek, M.; Król, J. Zawartość wybranych makro- i mikroelementów w mleku krów różnych ras i serwatce podpuszczkowej. Ochr. Środ. i Zasob. Nat. 2011, 48, 467–474. [Google Scholar]
  5. Barłowska, J.; Wolanciuk, A.; Kędzierska-Matysek, M.; Litwińczuk, Z. Eeffect of production season on basic chemical composition and content of macro- and microelements in cow’s and goat’s milk. ŻYWNOŚĆ. Nauka. Technologia. Jakość 2013, 6, 69–78. [Google Scholar]
  6. Adolphi, B.; Scholz-Ahrens, K.E.; de Vrese, M.; Açil, Y.; Laue, C.; Schrezenmeir, J. Short-term effect of bedtime consumption of fermented milk supplemented with calcium, inulin-type fructans and caseinphosphopeptides on bone metabolism in healthy, postmenopausal women. Eur. J. Nutr. 2009, 48, 45–53. [Google Scholar] [CrossRef]
  7. Cashman, K. Milk minerals (including trace elements) and bone health. Int. Dairy J. 2006, 16, 1389–1398. [Google Scholar] [CrossRef]
  8. Hanuš, O.; Samková, E.; Krížová, L.; Hasǒnová, L.; Kala, R. Role of fatty acids in milk fat and the influenceof selected factors on their variability—A Review. Molecules 2018, 23, 1636. [Google Scholar] [CrossRef] [Green Version]
  9. Albenzio, M.; Santillo, A.; Avando, M.; Nudda, A.; Chesse, S.; Pirisi, A.; Banni, S. Nutritional properties of small ruminant food products and their role on human health. Small Rumin. Res. 2016, 136, 3–12. [Google Scholar] [CrossRef]
  10. Claeys, W.L.; Verraes, C.; Cardoen, S.; de Block, J.; Huyghebaer, A.; Raes, K.; Dewettinck, K.; Herman, L. Consumption of raw or heated milk from different species: An evaluation of the nutritional and potential health benefits. Food Control 2014, 42, 188–201. [Google Scholar] [CrossRef]
  11. Wongtangtintharn, S.; Oku, H.; Iwasaki, H.; Toda, T. Effect of branched-chain fatty acids on fatty acid biosynthesis of human breast cancer cells. J. Nutr. Sci. Vitaminol. 2004, 50, 137–143. [Google Scholar] [CrossRef] [Green Version]
  12. Adamska, A.; Rutkowska, J. Odd- and branched-chain fatty acids in milk fat—Characteristic and health properties. Postepy Hig. Med. Dosw. 2014, 68, 957–966. [Google Scholar] [CrossRef] [PubMed]
  13. Chen, J.; Liu, H. Nutritional Indices for Assessing Fatty Acids: A Mini-Review. Int. J. Mol. Sci. 2020, 21, 5695. [Google Scholar] [CrossRef]
  14. Lim, J.-N.; Oh, J.-J.; Wang, T.; Lee, J.-S.; Kim, S.-H.; Kim, Y.-H.; Lee, H.-G. trans-11 18:1 vaccenic acid (TVA) has a direct anti-carcinogenic effect on MCF-7 human mammary adenocarcinoma cells. Nutrients 2014, 6, 627–636. [Google Scholar] [CrossRef] [PubMed] [Green Version]
  15. Williams, C.M. Dietary fatty acids and human health. Ann. De Zootech. 2000, 49, 165–180. [Google Scholar] [CrossRef] [Green Version]
  16. Haug, A.; Hostmark, A.T.; Harstad, O.M. Bovine milk in human nutrition: A review. Lipids Health Dis. 2007, 6, 25. [Google Scholar] [CrossRef] [PubMed] [Green Version]
  17. Arnould, V.M.-R.; Soyeurt, H. Genetic variability of milk fatty acids. J. Appl. Genet. 2009, 50, 29–39. [Google Scholar] [CrossRef] [PubMed] [Green Version]
  18. Akalln, A.S.; Tokusoglu, Ö. A potential Anticarcinogenic Agent: Conjugated linoleic acid (CLA). Pak. J. Nutr. 2003, 2, 109–110. [Google Scholar] [CrossRef] [Green Version]
  19. Aydin, R. Conjugated linoleic acid: Structure, sources and biological properties. Turk. J. Vet. Anim. Sci. 2005, 29, 189–195. [Google Scholar]
  20. Kee, J.-I.; Ganesan, P.; Kwak, H.-S. Bioactive conjugated linoleic acid (CLA) in milk. Korean J. Food Sci. Ani. Resour. 2010, 30, 879–885. [Google Scholar] [CrossRef] [Green Version]
  21. Park, Y. Conjugated linoleic acid (CLA): Good or bad trans fat? J. Food Comp. Anal. 2009, 22S, S4–S12. [Google Scholar] [CrossRef]
  22. Parodi, P.W. Anti-cancer agents in milkfat. Austr. J. Dairy Technol. 2003, 58, 114–118. [Google Scholar]
  23. Ulbricht, T.L.V.; Southgate, D.A.T. Coronary heart disease: Seven dietary factors. Lancet 1991, 338, 985–992. [Google Scholar] [CrossRef]
  24. Thorning, T.K.; Bertram, H.C.; Bonjour, J.-F.; de Groot, L.; Dupont, D.; Feeney, E.; Ipsen, R.; Lecerf, J.M.; Mackie, A.; McKinley, M.C.; et al. Whole dairy matrix or single nutrients in assessment of health effects: Current evidence and knowledge gaps. Am. J. Clin. Nutr. 2017, 105, 1033–1045. [Google Scholar] [CrossRef] [PubMed]
  25. Gómez-Cortés, P.; Juárez, M.; Angel de la Fuente, M. Milk fat acids and potential health benefits: An update vision. Trends Food Sci. Technol. 2018, 81, 1–9. [Google Scholar] [CrossRef] [Green Version]
  26. Khan, I.T.; Nadeem, M.; Imran, M.; Ayaz, M.; Ajmal, M.; Ellahi, M.Y.; Khalique, A. Antioxidant capacity and fatty acids characterization of heat treated cow and buffalo milk. Lipids Health Dis. 2017, 16, 227. [Google Scholar] [CrossRef] [Green Version]
  27. Pestana, J.M.; Gennari, A.; Monteiro, B.W.; Lehn, D.N.; Souza, C.F.V. Effects of Pasteurization and Ultra-High Temperature Processes on Proximate Composition and Fatty Acid Profile in Bovine Milk. Am. J. Food Technol. 2015, 10, 265–272. [Google Scholar] [CrossRef] [Green Version]
  28. Ajmal, M.; Nadeem, M.; Imran, M.; Junaid, M. Lipid compositional changes and oxidation status of ultra-high temperature treated milk. Lipids Health Dis. 2018, 17, 227. [Google Scholar] [CrossRef] [Green Version]
  29. Simionato, J.I.; Hiroki, A.P.; Katsuda, M.S.; Pedrão, M.R.; Dias, L.F.; Evelazio de Souza, N. Effects of Seasonality on the Proximate Composition and Fatty Acid Profile in Cow Milk. Int. J. Food Sci. Nutr. Eng. 2012, 2, 96–100. [Google Scholar] [CrossRef] [Green Version]
  30. Laučienė, L.; Andrulevičiūtė, V.; Sinkevičienė, I.; Sederevičius, A.; Musayeva, K.; Šernienė, L. Analysis of fatty acid composition and healthy lipids indices in raw and processed milk. J. Food Nutr. Res. 2019, 7, 386–390. [Google Scholar] [CrossRef]
  31. Gassem, M.; Osman, M.; Mohamed Ahmed, I.; Abdel Rahman, I.; Fadol, M.; Al-Maiman, S. Effect of fermentation by selected lactic acid bacteria on the chemical composition and fatty acids of camel milk. J. Camel. Pract. Res. 2016, 23, 277. [Google Scholar] [CrossRef]
  32. Santos Júnior, O.O.; Pedrao, M.R.; Dias, L.F.; Paula, L.N.; Coro, F.A.G.; De Souza, N.E. Fatty Acid Content of Bovine Milkfat From Raw Milk to Yoghurt. Am. J. Appl. Sci. 2012, 9, 1300–1306. [Google Scholar] [CrossRef]
  33. Serafeimidou, A.; Zlatanos, S.; Kritikos, G.; Tourianis, A. Change of fatty acid profile, including conjugated linoleic acid (CLA) content, during refrigerated storage of yogurt made of cow and sheep milk. J. Food Compos. Anal. 2013, 31, 24–30. [Google Scholar] [CrossRef]
  34. Paszczyk, B.; Brandt, W.; Łuczyńska, J. Content of conjugated linoleic acid (CLA) and trans isomers of C18:1 and C18:2 acids in fresh and stored fermented milks produced with selected starter cultures. Czech. J. Food Sc. 2016, 34, 391–396. [Google Scholar] [CrossRef] [Green Version]
  35. Czarnowska-Kujawska, M.; Paszczyk, B. Changes in the folate content and fatty acid profile in fermented milk produced with different starter cultures during storage. Molecules 2021, 26, 6063. [Google Scholar] [CrossRef] [PubMed]
  36. Domagała, J.; Sady, M.; Najgebauer-Lejko, D.; Czernicka, M.; Witeska, I. The content of conjugated linoleic acid (CLA) in cream fermented using different starter cultures. Biotechnol. Anim. Husb. 2009, 25, 745–751. [Google Scholar]
  37. Goetsch, A.L.; Zeng, S.S.; Gipson, T.A. Factors affecting goat milk production and quality. Small Rumin. Res. 2011, 101, 55–63. [Google Scholar] [CrossRef]
  38. El-Abbadi, N.H.; Dao, M.C.; Meydani, S.N. Yogurt: Role in healthy and active aging. Am. J. Clin. Nutr. 2014, 99, 1263S–1270S. [Google Scholar] [CrossRef] [Green Version]
  39. Horiuchi, H.; Sasaki, Y. Effect of oxygen on symbiosis between Lactobacillus bulgaricus and Streptococcus thermophilus. J. Dairy Sci. 2012, 95, 2904–2909. [Google Scholar] [CrossRef]
  40. Coakley, R.P.; Ross, R.P.; Nordgren, M.; Fitzgerald, G.; Devery, R.; Stanton, C. Conjugated linoleic acid biosynthesis by human-derived Bifidobacterium species. J. Appl. Microbiol. 2003, 94, 138–145. [Google Scholar] [CrossRef]
  41. Lin, T.Y. Conjugated linoleic acid concentration as affected by lactic cultures and additives. Food Chem. 2000, 69, 27–31. [Google Scholar] [CrossRef]
  42. Sieber, R.; Collomb, M.; Aeschlimann, A.; Jelen, P.; Eyer, H. Impact of microbial cultures on conjugated linoleic acid in dairy products—A review. Int. Dairy J. 2004, 14, 1–15. [Google Scholar] [CrossRef]
  43. Xu, S.; Boylston, T.D.; Glatz, B.A. Effect of lipid source on probiotic bacteria and conjugated linoleic acid formation in milk model systems. J. Am. Oil. Chem. Soc. 2004, 81, 589–595. [Google Scholar] [CrossRef]
  44. Gorissen, L.; Raes, K.; Weckx, S.; Dannenberger, D.; Leroy, F.; De Vuyst, L.; De Smet, S. Production of conjugated linoleic acid and conjugated linolenic acid isomers by Bifidobacterium species. Appl. Microbiol. Biotechnol. 2010, 87, 2257–2266. [Google Scholar] [CrossRef] [PubMed]
  45. Rosberg-Cody, E.; Ross, R.P.; Hussey, S.; Ryan, C.A.; Murphy, B.P.; Fitzgerald, G.F.; Devery, R.; Stanton, C. Mining the microbiota of the neonatal gastrointestinal tract for conjugated linoleic acid-producing. Bifidobact. Appl. Environ. Microbiol. 2004, 70, 4635–4641. [Google Scholar] [CrossRef] [PubMed] [Green Version]
  46. PN-EN ISO 1211:2011; Milk-Determination of Fat Content—Gravimetric Method (Reference Method). ISO: Geneva, Switzerland, 2011.
  47. Christie, W.W. (Ed.) The isolation of lipids from tissues. Recommended Procedures. Chloroform-methanol (2:1, v/v) extraction and “Folch” wash. In Lipid Analysis. Isolation, Separation, Identification and Structural Analysis of Lipids; Pergamon Press: Oxford, UK; New York, NY, USA; Toronto, ON, Canada; Tokyo, Japan; Sydney, Australia; Braunschweig, Germany, 1973; pp. 39–40. [Google Scholar]
  48. ISO 15884:2002 (IDF 182:2002); Milkfat: Preparation of Fatty Acid Methyl Esters. Available online: https://www.iso.org/obp/ui/#iso:std:iso:15884:ed-1:v1:en (accessed on 12 July 2003).
  49. Roach, J.A.G.; Mossoba, M.M.; Yurawecz, M.P.; Kramer, J.K.G. Chromatographic separation and identification of conjugated linoleic acid isomers. Anal. Chim. Acta 2002, 465, 207–226. [Google Scholar] [CrossRef]
  50. Kramer, J.K.G.; Cruz-Hermantez, C.; Deng, Z.; Zhou, J.; Jahreis, G.; Dugan, M.E.R. Analysis of conjugated linoleic acid and trans 18:1 isomers in syntetic and animal products. Am. J. Clin. Nutr. 2004, 79, 1137S–1145S. [Google Scholar] [CrossRef] [Green Version]
  51. LeDoux, M.; Chardigny, J.-M.; Darbois, M.; Soustre, Y.; Sébédio, J.-L.; Laloux, L. Fatty acid composition of French butters, with special emphasis on conjugated linoleic acid (CLA) isomers. J. Food Compos. Anal. 2005, 18, 409–425. [Google Scholar] [CrossRef]
  52. Medeiros, E.; Queiroga, R.; Oliveira, M.; Medeiros, A.; Sabedot, M.; Bomfim, M.; Madruga, M. Fatty Acid Profile of Cheese from Dairy Goats Fed a Diet Enriched with Castor, Sesame and Faveleira Vegetable Oils. Molecules 2014, 19, 992–1003. [Google Scholar] [CrossRef] [Green Version]
  53. Osmari, E.K.; Cecato, U.; Macedo, F.A.F.; Souza, N.E. Nutritional quality indices of milk fat from goats on diets supplemented with different roughages. Small Rumin. Res. 2011, 98, 128–132. [Google Scholar] [CrossRef]
  54. Ivanova, A.; Hadzhinikolova, L. Evaluation of nutritional quality of common carp (Cyprinus carpio L.) lipids through fatty acid ratios and lipid indices. Bulg. J. Agric. Sci. 2015, 21, 180–185. [Google Scholar]
  55. Statistica, Version 13.3; StatSoft: Kraków, Poland, 2007.
  56. Grummer, R.R. Effect of Feed on the Composition of Milk Fat. J. Dairy Sci. 1991, 74, 3244–3257. [Google Scholar] [CrossRef]
  57. Jensen, R.G. The Composition of Bovine Milk Lipids: January 1995 to December 2000. J. Dairy Sci. 2002, 85, 295–350. [Google Scholar] [CrossRef]
  58. Simopoulos, A.P. The Importance of the Omega-6/Omega-3 Fatty Acid Ratio in Cardiovascular Disease and Other Chronic Diseases. Exp. Biol. Med. 2008, 233, 674–688. [Google Scholar] [CrossRef] [PubMed]
  59. Simopoulos, A.P. An increase in the omega-6/omega-3 fatty acid ratio increases the risk for obesity. Nutrients 2016, 8, 128. [Google Scholar] [CrossRef] [Green Version]
  60. Ghaeni, M.; Ghahfarokhi, K.N.; Zaheri, L. Fatty acids profile, atherogenic (IA) and thrombogenic (IT) health lipid indices in Leiognathusbindus and Upeneussulphureus. J. Marine Sci. Res. Dev. 2013, 3, 1000138. [Google Scholar] [CrossRef] [Green Version]
  61. Santos-Silva, J.; Bessa, R.J.B.; Santos-Silva, F. Effect of genotype, feeding system and slaughter weight on the quality of light lambs II. Fatty acid composition of meat. Livest. Prod. Sci. 2002, 77, 187–194. [Google Scholar] [CrossRef]
  62. Jiang, J.; Björck, L.; Fondn, R. Production of conjugated linoleic acid by dairy starter cultures. J. Appl. Microbiol. 1998, 85, 95–102. [Google Scholar] [CrossRef]
  63. Kelly, M.L.; Berry, J.R.; Dwyer, D.A.; Griinari, J.M.; Chouinard, P.Y.; Van Amburgh, M.E.; Bauman, D.E. Dietary fatty acid sources affect conjugated linoleic acid concentrations in milk from lactating dairy cows. J. Nutr. Sci. 1998, 128, 881–885. [Google Scholar] [CrossRef]
  64. Chilliard, Y.; Ferlay, A.; Mansbridge, R.M.; Doreau, M. Ruminant Milk Fat Plasticity: Nutritional Control of Saturated, Polyunsaturated, Trans and Conjugated Fatty Acids. Anim. Res. 2000, 49, 181–205. [Google Scholar] [CrossRef] [Green Version]
  65. Kelsey, J.; Corl, B.; Collier, R.; Bauman, D. The Effect of Breed, Parity, and Stage of Lactation on Conjugated Linoleic Acid (CLA) in Milk Fat from Dairy Cows. J. Dairy Sci. 2003, 86, 2588–2597. [Google Scholar] [CrossRef] [Green Version]
  66. Żegarska, Z.; Paszczyk, B.; Rafałowski, R.; Borejszo, Z. Annual Changes in the Content of Unsaturated Fatty Acids with 18 Carbon Atoms, Including Cis9trans11 C18:2 (CLA) Acid, in Milk Fat. Pol. J. Food Nutr. Sci. 2006, 56, 409–414. [Google Scholar]
  67. Collomb, M.; Schmid, A.; Sieber, R.; Wechsler, D.; Ryhänen, E.-L. Conjugated Linoleic Acids in Milk Fat: Variation and Physiological Effects. Int. Dairy J. 2006, 16, 1347–1361. [Google Scholar] [CrossRef]
  68. Frelich, J.; Šlachta, M.; Hanuš, O.; Špička, J.; Samková, E.; Weglarz, A.; Zapletal, P. Seasonal Variation in Fatty Acid Composition of Cow Milk in Relation to the Feeding System. Anim. Sci. Pap. Rep. 2012, 30, 219–229. [Google Scholar]
  69. Hanuš, O.; Krížová, L.; Samková, E.; Špička, J.; Kučera, J.; Klimešová, M.; Roubal, P.; Jedelská, R. The Effect of Cattle Breed, Season and Type of Diet on the Fatty Acid Profile of Raw Milk. Arch. Anim. Breed. 2016, 59, 373–380. [Google Scholar] [CrossRef] [Green Version]
  70. Lin, T.Y. Influence of lactic cultures, linoleic acid and fructo-oligosaccharides on conjugated linoleic acid concentration in non-fat set yoghurt. Aust. J. Dairy Technol. 2003, 58, 11–14. [Google Scholar]
  71. Shantha, N.C.; Decker, E.A.; Ustunol, Z. Conjugated Linoleic Acid Concentration in Processed Cheese. J. Am. Oil Chem. Soc. 1992, 69, 425–428. [Google Scholar] [CrossRef]
  72. Bisig, W.; Eberhard, P.; Collomb, M.; Rehberger, B. Influence of Processing on the Fatty Acid Composition and the Content of Conjugated Linoleic Acid in Organic and Conventional Dairy Products—A Review. Le Lait. 2007, 87, 1–19. [Google Scholar] [CrossRef] [Green Version]
  73. Salamon, R.V.; Lóki, K.; Varga-Visi, E.; Mándoki, Z.; Csapó, J. Increase of Conjugated Linoleic Acid Content of Dairy Products by Adding Sunflower Oil. Krmiva 2009, 51, 99–103. [Google Scholar]
  74. Seçkin, A.K.; Gursoy, O.; Kinik, O.; Akbulut, N. Conjugated Linoleic Acid (CLA) Concentration, Fatty Acid Composition and Cholesterol Content of Some Turkish Dairy Products. LWT 2005, 38, 909–915. [Google Scholar] [CrossRef]
  75. Prandini, A.; Sigolo, S.; Tansini, G.; Brogna, N.; Piva, G. Different Level of Conjugated Linoleic Acid (CLA) in Dairy Products from Italy. J. Food Compos. Anal. 2007, 20, 472–479. [Google Scholar] [CrossRef]
  76. Alonso, L.; Cuesta, E.P.; Gilliland, S.E. Production of free conjugated linoleic acid by Lactobacillus acidophilus and Lactobacillus casei of human intestinal origin. J. Dairy Sci. 2003, 86, 1941–1946. [Google Scholar] [CrossRef] [Green Version]
  77. Kim, Y.; Liu, R. Increase of Conjugated Linoleic Acid Content in Milk by Fermentation with Lactic Acid Bacteria. J. Food Sci. 2002, 67, 1731–1737. [Google Scholar] [CrossRef]
  78. Hennessy, A.; Ross, R.; Devery, R.; Stanton, C. Optimization of a Reconstituted Skim Milk Based Medium for Enhanced CLA Production by Bifidobacteria. J. Appl. Microbiol. 2009, 106, 1315–1327. [Google Scholar] [CrossRef] [PubMed]
  79. Ogawa, J.; Kishino, S.; Ando, A.; Sugimoto, S.; Mihara, K.; Shimizu, S. Production of Conjugated Fatty Acids by Lactic Acid Bacteria. J. Biosci. Bioeng. 2005, 100, 355–364. [Google Scholar] [CrossRef] [PubMed]
  80. Lin, H.; Boylston, T.D.; Chang, M.J.; Luedecke, L.D.; Shultz, T.D. Survey of the CLA contents of dairy products. J. Dairy Sci. 1995, 78, 2358–2365. [Google Scholar] [CrossRef]
  81. Zamberlin, Š.; Neven, A.; Havranek, J.; Samaržija, D. Mineral elements in milk and dairy products. Mljekarstvo 2012, 62, 2, 111–125. [Google Scholar]
  82. Paszczyk, B.; Tońska, E.; Łuczyńska, J. Health-promoting values of cow, sheep and goat milk and yogurts. Mljekarstvo 2019, 69, 182–192. [Google Scholar] [CrossRef]
Figure 1. The content of cis-9,trans-11 C18:2 (CLA) in raw milk, pasteurized milk, and yogurts produced. n = 4 for raw and pasteurized milk; n = 8 for yogurts; a,b—values with different letters differ significantly (p < 0.05).
Applsci 12 06558 g001
Table 1. The sum of fatty acids (mg/g fat) and nutritional indices of milk and yogurts produced.
Raw MilkPasteurized MilkYogurts Produced
Using FD-DVS YC-X16 Yo-Flex
with BB-12
Yogurts Produced
Using FD-DVS
YC-180 Yo-Flex
with BB-12
Mean±SDMean±SDMean±SDMean±SD
n 4 4 8 8
ΣSCFA 163.464.26 b75.691.18 a62.182.37 b62.554.26 b
ΣBCFA 27.110.34 a9.160.28 a8.842.21 a7.130.45 a
ΣOCFA 311.760.40 c15.380.49 a13.210.57 b11.780.77 c
ΣSFA 4368.6014.26 c466.909.43 a417.0423.50 b369.9624.06 c
ΣMUFA 5140.385.33 b178.995.40 a162.5712.11 a141.889.36 b
ΣPUFA 616.220.43 b20.190.45 a17.971.19 b15.941.12 b
(n − 3)1.380.08 b1.790.07 a1.520.08 b1.410.11 b
(n − 6)10.040.28 c12.980.42 a11.560.60 b10.400.62 b,c
(n − 6)/(n − 3)7.310.23 a7.240.04 a7.620.66 a7.390.19 a
UFA 7432.0618.53 b542.5910.62 a479.2224.18 b432.5127.88 b
DFA 8482.3220.57 b606.1712.69 a536.7626.86 b483.1130.86 b
OFA 9318.3412.22 c403.327.36 a359.5020.81 b319.3621.07 c
AI 101.970.00 a1.950.03 a1.920.05 a1.950.06 a
TI 113.760.00 a3.720.05 a3.670.09 a3.730.11 a
H/H 120.400.00 a0.410.01 a0.420.020.410.01 a
n—number of samples; Mean—mean value; SD—standard deviation; a,b,c—values denoted in rows by different letters indicate statistically significant differences (p < 0.05); 1 ΣSCFA: sum of short-chain fatty acids (C4:0–C10:0); 2 ΣBCFA—all branched-chain fatty acids; 3 ΣOCFA—all odd-chain fatty acids; 4 SFA—saturated fatty acids (without SCFA); 5 ΣMUFA—sum of monounsaturated fatty acids; 6 ΣPUFA—sum of polyunsaturated fatty acids; 7 UFA—sum of unsaturated fatty acids (ΣMUFA + ΣPUFA); 8 DFA—hypocholesterolemic fatty acids (ΣUFA + C18:0); 9 OFA- hypercholesterolemic fatty acids (ΣSFA-C18:0); 10 AI (Index of Atherogenicity); 11 TI (Index of Thrombogenicity); 12 H/H (hypocholesterolemic/hypercholesterolemic ratio).
Table 2. Microelements in milk and yogurts produced (µg/100 g wet weight).
Raw MilkPasteurized MilkYogurts Produced Using FD-DVS YC-X16 Yo-Flex
with BB-12
Yogurts Produced Using FD-DVS YC-180 Yo-Flex
with BB-12
Mean±SDMean±SDMean±SDMean±SD
n4 4 8 8
Cu11.30.1 b12.40.3 b14.21.5 a14.50.8 a
Mn2.500.3 b2.80.3 b3.900.3 a3.500.4 a
Fe14.92.3 b19.31.0 b19.61.1 b26.97.3 a
Zn435.020.8 b555.132.0 a552.618.4 a545.619.1 a
n—number of samples; Mean—mean value; SD—standard deviation; a,b—values denoted in rows by different letters indicate statistically significant differences (p < 0.05).
Table 3. Macroelements in milk and yogurts produced (mg/100 g wet weight).
Raw MilkPasteurized MilkYogurts Produced Using FD-DVS
YC-X16 Yo-Flex
with BB-12
Yogurts Produced Using FD-DVS
YC-180 Yo-Flex
with BB-12
Mean±SDMean±SDMean±SDMean±SD
n 4 4 8 8
Mg7.60.8 b9.00.5 a9.700.2 a10.00.2 a
Ca128.38.1 b154.78.1 a158.73.9 a161.17.1 a
Na39.42.2 b46.72.2 a47.11.0 a50.54.4 a
K158.19.6 b188.99.6 a188.75.5 a196.49.0 a
P94.65.4 b115.45.4 a118.21.4 a121.78.4 a
n—number of samples; Mean—mean value; SD—standard deviation; a,b—values denoted in rows by different letters indicate statistically significant differences (p < 0.05).
Publisher’s Note: MDPI stays neutral with regard to jurisdictional claims in published maps and institutional affiliations.

