Article

Investigation of Quantitative Evaluation Method and Engineering Application of Shallow Buried Tunnel Face Stability

1
China Railway Construction Bridge Engineering Bureau Group Co., Ltd., Tianjin 300300, China
2
School of Civil Engineering, Yancheng Institute of Technology, Yancheng 224051, China
3
School of Civil Engineering, Xi’an University of Architecture and Technology, Xi’an 710055, China
4
College of Civil Engineering and Architecture, Guangxi University, Nanning 530004, China
*
Authors to whom correspondence should be addressed.
Appl. Sci. 2022, 12(13), 6656; https://doi.org/10.3390/app12136656
Submission received: 19 May 2022 / Revised: 19 June 2022 / Accepted: 22 June 2022 / Published: 30 June 2022
(This article belongs to the Section Civil Engineering)

Abstract

:
The stability of a tunnel face and the rationality of its supporting structures are the guarantees for safe tunnel construction. This paper established a quantitative analysis model of tunnel face stability, obtained the calculation formula of the tunnel face stability coefficient based on the silo theory of surrounding rock, and then realized the quantitative description of stability of the tunnel face under the condition of a pipe roofing support, bolting support, grouting support and reserved core soil. Finally, a tunnel face stability discrimination and support optimization system was developed, its supporting effects were quantitatively evaluated, and the support measures were optimized based on a buried tunnel of Chongqing rail transit passing through the suburban expressway. The results show that the grouting support increased the stability coefficient by 103~412%, and its supporting effect is the most significant. The reinforcement with reserved core soil has the lowest cost. The tunnel face stability discrimination and support optimization system carries out a rapid judgment of tunnel face stability, and then provides a quantitative evaluation method for the assessment of the tunnel face. On-site monitoring indicates that the cumulative displacement gradually increased with monitoring time; the farther from the tunnel surface, the smaller the cumulative displacement. The cumulative displacement reached 34.50 mm before the optimization of the reinforcement scheme. The optimization scheme of pipe roofing support + reserved core soil + grouting support led to the gradual convergence of cumulative displacement. The final surface settlement displacement was reduced to 15.50 mm, which was about 44.93% of that before the optimization of reinforcement scheme, ensuring the safe construction of the buried tunnel. This research has a certain theoretical significance for the quantitative evaluation and analysis of the tunnel face stability of shallow buried tunnels.

1. Introduction

With the gradual implementation of deep exploitation strategy, the geotechnical engineering field requires more space resources from deep rock mass [1,2,3,4,5], and the underground traffic engineering shows a strong momentum of development [6,7,8,9]. As early as 1991, the Tokyo Declaration, adopted by the International Academic Conference on the Utilization of Urban Underground Space held in Tokyo, proposed that the 21st century would be the century for the development and utilization of underground spaces [10,11,12]. The stability of a tunnel face is the key to safe tunnel construction [13,14]. Different from deep-buried tunnels, the instability and collapse of shallow-buried tunnels are mainly caused by the soil pre-deformation and extrusion deformation of the tunnel excavation face. To ensure the stability of the tunnel excavation face of a shallow buried tunnel in an open-tunnel-face excavations construction, existing research [15] mostly adopted comprehensive advance pre-support measures to realize safe tunnel construction. However, the selection of pre-reinforcement measures is often determined based on engineering experience and there is a lack of reasonable and effective design criteria, which often lead to engineering accidents.
The process of tunnel rock excavation and support has a complex mechanical behavior. For discriminating aspects of tunnel face stability, Broms et al. [16] proposed the concept of a stability coefficient. Potts et al. [17] obtained the minimum support pressure required for the stability of a non-sticky soil tunnel face through the plastic limit analysis method. Anagnostou et al. [18] calculated the ultimate support pressure using the wedge sliding body model. Zhang et al. [19] proposed a 3D destruction mechanism composed of four truncating cones. Li et al. [20] evaluated the stability of a tunnel working surface excavated in a weathered saturated rock mass using the Hoek–Brown damage criterion. Liu et al. [21] obtained the active failure process of tunnel excavation face in dry sand strata under different densities and different coverage depths through model tests and 2D particle flow calculation program. Zheng et al. [22] discussed the advantages of safety coefficient as a basis for judging tunnel stability compared to tunnel convergence and plastic zone criteria. Zhao et al. [23] analyzed the upper limit solution of tunnel face stability and its influencing factors. Wu et al. [24] studied the analytical approach to estimating the influence of shotcrete hardening properties on tunnel response. Regarding the tunnel face support measures, Song et al. [25] proposed a force analysis model for pipe roofing support considering the integrity of grouting support, and deduced the deflection and internal forces, verifying their rationality. Wang et al. [26] introduced the calculation method of tunnel face bolting support and face grouting support. Wang et al. [27] analyzed the influence of glass fiber bolt parameters on the tunnel face stability based on Taoshuping tunnel. Huang et al. [28] optimized the excavation sequence of reserved core soil method for eccentric weak surrounding rock tunnels. Lai et al. [29] showed that the cohesion and internal friction angle of tunnel face soil, which increased after grouting support. Liang et al. [30] proposed a 3D failure mode and analyzed the influence of various parameters on the tunnel face stability. Anagnostou et al. [31] and Oggeri et al. [32] studied the measuring of tunnel face reinforcements and the quality of tunnelling. The above existing results provide an analysis method for studying the stability of tunnel face and revealing the influence of different advanced pre-supporting measures. However, there are few reports on the quantitative determination of the stability of shallow tunnel faces under different support measures. Therefore, it is very important for the safe [33,34], fast, and economical construction of shallow tunnels to conduct a quantitative evaluation of the contribution of different advanced pre-reinforcement measures for tunnel face stability.
To explore the quantitative evaluation method of tunnel face stability of a shallow buried tunnel and its engineering application in open-tunnel-face excavations construction, this paper established a quantitative analysis model of tunnel face stability and obtained the calculation formula of the tunnel face stability coefficient based on the silo theory of surrounding rock. This study then realized the quantitative description of the stability of the tunnel face under the conditions of pipe roofing support, tunnel face bolting support, tunnel face grouting support and reserved core soil. Finally, the tunnel face stability discrimination and support optimization system was developed and its effects were quantitatively evaluated, and the support measures were optimized based on a buried tunnel of Chongqing rail transit passing through suburban expressway. This study has a certain theoretical significance for the quantitative evaluation and analysis of tunnel face stability.

2. Establishment of Wedge Sliding Body Model

2.1. Limit Equilibrium Model of Wedge Sliding Body

The soil in front of a tunnel face has a sliding tendency when a shallow tunnel is excavated, causing instability in the tunnel face [18] and forming a wedge sliding body. In tunnel engineering, the cross-sectional profile of the tunnel is generally composed of multiple central circles, and the cross-sectional shape is also different due to the differences in tunnel structure design. For the convenience of calculation, we make the tunnel cross-section shape equivalent to a rectangle (AabB). As shown in Figure 1a, the triangular prism (ABC-abc) is the wedge sliding body in front of the tunnel face, and the quadrangular prism (DCcd-EFfe) is the upper soil body, and H represents the buried depth of tunnel. AaBb is the equivalent excavation surface of the wedge sliding body, D0 represents the tunnel height, and l0 represents the equivalent width. The excavation area is the section area of tunnel in the case of a full-section excavation, and the excavation area is the upper step area in the case of step method. EeFf is the ground surface of quadrangular prismatic soil. BbDd is the unsupported section and its length Le (DB, as shown in Figure 1b) is related to the actual excavation progress. AaCc is the slip surface of wedge sliding body, and the relationship between sliding angle (β) and internal friction angle (φ) satisfies:
β = π 4 φ 2 ,
To establish the limit equilibrium model of wedge sliding body, the following assumptions need to be made. The soil body is a homogeneous and isotropic rigid-plastic material and the weighted average method can be used for the multi-layer soil body. ① The soil material obeys the Mohr–Coulomb failure criterion (τ = c + σtanφ, c is the cohesion, σ is the normal stress), and the influence of groundwater is not considered. ② The damage range of excavation section is composed of wedge sliding body (ABC-abc) and prismatic body (DCcd-EFfe). ③ The tunnel face is equivalent to a rectangle (ABba) with the same area and height for a calculation based on the principle of area equivalence. The vertical stress on the side of the wedge body linearly increases with the depth, and the stress on the top surface and inclined sliding surface is uniformly distributed.
Figure 2 shows the schematic diagram of wedge sliding body stress. P is the active stress that ensures tunnel face stability and the active force applied by the tunnel face support measures, and the direction is the vertical tunnel face and points to the inside of wedge sliding body. F is the compressive stress of the soil body acting on wedge sliding body. G is the self-gravity of the wedge sliding body (γ indicates density), facing a vertically downward direction, and its size depends on the volume of the wedge sliding body and the density of the surrounding rock. N1 and T1 are the compression stress and shear stress on sliding surface (A(a)C(c)), respectively. N2 and T2 are the compression stress and shear stress on the wedge sliding body (ABC). The lateral abc has the same stress as the lateral ABC. Combined with the limit equilibrium model of the wedge sliding body, the following are the solutions for the self-gravity (G), compressive stress (F), shear stress (T1) and shear stress (T2), which are used to obtain the active stress (P).
When the wedge sliding body is in the limit equilibrium state, the stress balance equation can be expressed as:
{ G = 1 2 γ l 0 D 0 2 tan ( π 4 φ 2 ) P + T 1 sin ( π 4 φ 2 ) + 2 T 2 sin ( π 4 φ 2 ) N 1 cos ( π 4 φ 2 ) = 0 F + G T 1 cos ( π 4 φ 2 ) 2 T 2 cos ( π 4 φ 2 ) N 1 sin ( π 4 φ 2 ) = 0 ,
Therefore, the compressive stress (N1) and active stress (P) can be expressed as:
{ N 1 = F + G sin ( π 4 φ 2 ) T 1 + 2 T 2 tan ( π 4 φ 2 ) P = F + G tan ( π 4 φ 2 ) T 1 + 2 T 2 sin ( π 4 φ 2 ) ,
The unit body of soil body (DCcd-EFfe) is selected as the analysis object, and the schematic diagram of soil unit body at a buried depth (z) is shown in Figure 3. q is the uniformly distributed load on ground surface, which is the active load acting on the surface, and its size is determined according to the actual engineering. w is the self-weight of the soil unit body. σv is the positive stress on the upper surface of soil unit body, and it faces a vertically downward direction. σh and τ are the positive stress and shear stress on the side of soil unit body, respectively, and their sizes are related to the values of c, φ and γ of the surrounding rock. Then, the vertical stress balance equation of soil unit body is:
{ σ v S + γ S d z = ( σ v + d σ v ) S + 2 l 0 τ d z + 2 L τ d z τ = c + λ σ v tan φ L = L e + D 0 tan ( π 4 φ 2 ) ,
where S is the upper surface area of soil unit body. λ is the lateral stress coefficient of soil unit body.
Equation (4) can be rewritten as:
{ d σ v d z + P 0 σ v = Q 0 P 0 = 2 λ ( l 0 + L ) tan φ l 0 L Q 0 = γ 2 c ( l 0 + L ) l 0 L ,
Thus, the equation between normal stress (σv) and buried depth (z) of upper surface of unit body can be obtained:
σ v ( z ) = ( q Q 0 P 0 ) e P 0 z + Q 0 P 0 ( 0 z H ) ,
If it is assumed that the compressive stress (F) acting on the top of wedge sliding body by soil body (DCcd-EFfe) is:
F = σ v | z = H [ L e + D 0 tan ( π 4 φ 2 ) ] ,
The relationship equation between normal stress (σv) and buried depth (z) can be expressed as:
σ v | z = H = Q 0 P 0 ( 1 e P 0 H ) + q e P 0 H ,
The expression relationship of compressive stress (F) can be obtained by combining Equations (8) and (7) as:
F = [ Q 0 P 0 ( 1 e P 0 H ) + q e P 0 H ] [ L e + D 0 tan ( π 4 φ 2 ) ] l 0 ,
The shear stress (T1) on the slip surface (AaCc) of the wedge sliding body according to assumption ④ is expressed as:
T 1 = L e cos ( π 4 φ 2 ) c + N 1 tan φ ,
The shear stress (T1) can be obtained by combining Equations (7), (8) and (10) as:
T 1 = tan ( π 4 φ 2 ) tan ( π 4 φ 2 ) + tan φ [ L e cos ( π 4 φ 2 ) c + ( F + G 2 T 2 cos ( π 4 φ 2 ) ) tan φ sin ( π 4 φ 2 ) ] ,
The shear stress (T2) at the buried depth z on the sliding surface A(a)C(c) based on assumption ③ is expressed as:
T 2 = 1 6 γ λ D 0 3 tan φ tan ( π 4 φ 2 ) + 1 2 [ c + λ σ v | z = H tan φ ] D 0 2 tan ( π 4 φ 2 ) ,
Based on the above analysis, Equations (2), (9), (11) and (12) can be substituted into Equation (3) to obtain the active stress (P):
P = l 0 tan β σ v | z = H + 1 2 γ l 0 2 [ l 0 cos β c + tan φ sin β ( F + G + 2 T 2 cos β ) ] ( tan β + tan φ ) cos β tan φ 6 cos β λ D 0 2 [ γ D 0 + 3 σ v | z = H ] c 2 cos β ,

2.2. Stability Coefficient of Tunnel Face

Existing studies showed that increasing the sliding resistance and reducing the sliding stress are the main measures used to improve the stability of the tunnel surface. To improve the stability of the tunnel face, typical reinforcement measures, such as pipe roofing support, tunnel face bolting support, tunnel face grouting support and reserved core soil, are usually used to reinforce the tunnel excavation section in the rock mass engineering [25]. Wang et al. [26] and Wang et al. [27] conducted a quantitative analysis of pipe roofing support, bolting support and grouting support. The pressure reduction factor (a1) of rock mass was used to quantitatively evaluate the vertical deformation pressure of disturbance section under pipe roofing support. The grouting support effect of tunnel face was evaluated using cohesive strength (c′) to improve the cohesion of surrounding rock. When evaluating the support effect of bolting support, the minimum bearing capacity of each bolt in five failure modes was first calculated, and then the bearing capacity was accumulated to obtain the total supporting stress (P1) provided by the bolting support. The calculation steps of the stability coefficient (K) of the tunnel face based on the reinforcement effects of pipe roofing support, tunnel face bolting support, tunnel face grouting support and reserved core soil are as follows.
The vertical pressure (F′) of wedge sliding body after pipe roofing support was applied can be expressed as:
F = α 1 F ,
The cohesive strength (c′) of surrounding rock after grouting reinforcement can be expressed as:
c = c g V g + c V V = α 2 c ,
α 2 = { 1 + c g ζ L g n c D tan β ( L g < D tan β ) 1 + c g ζ n c ( L g D tan β ) ,
where cg is the cohesion strength of mortar. Vg is the volume of mortar. V is the volume of wedge sliding body. ζ is the filling rate of mortar. Lg is the grouting depth. n is the porosity of the surrounding rock. a2 is the strengthening coefficient of cohesion after grouting support.
Then, by combining the cohesive strength (c′) with Equations (11) and (12), the shear stress ( T 1 ) on the sliding surface and shear stress ( T 2 ) on the side of wedge sliding body after grouting reinforcement can be immediately obtained, respectively.
A fiberglass anchor bolt is a typical bolt commonly used for face reinforcement. Its failure modes include the failure of bolt body by tension (P1i), failure of non-anchored section by sliding of bolt body (P2i), failure of non-anchored section by sliding between the mortar and hole wall (P3i), failure of the anchored section by sliding between bolt body and hole wall (P4i), and failure of the anchored section by sliding between mortar and hole wall (P5i) [27]. The anchoring stress of single bolt is the minimum anchoring stress among the five failure modes considering construction safety. The calculation equations of anchoring stress can be expressed as [28,29]:
P 1 i = π d 2 f b 4 ,
P 2 i = π d b l I i f t ( 2 + 11.7 d b l I i ) ,
P 3 i = π d h l I i f t ( 1 + λ 2 σ v tan φ + c ) ,
P 4 i = π d b l II i f t ( 2 + 11.7 d b l II i ) ,
P 5 i = π d h l II i f t ( 1 + λ 2 σ v tan φ + c ) ,
where fb is the tensile strength of anchor bolt. db is the diameter of anchor bolt. ft is the design value of tensile strength of mortar. lIi is the length of the i-th row of anchor bolt in non-anchored area. lIIi is the length of the i-th row of anchor bolt in anchored area. dh is the drilling diameter. λ is the lateral pressure coefficient of soil body.
The total supporting stress (P1) of tunnel face can be expressed as:
{ P i = m i × min ( P 1 i , P 2 i , P 3 i , P 4 i , P 5 i ) P 1 = i = 1 i = n P i ,
where mi is the number of transverse anchor bolts in row i. n is the number of rows of anchor bolt.
Reserved core soil is a common measure to ensure the stability of tunnel face, which is realized by dividing the tunnel face into several parts and then optimizing the excavation sequence of the tunnel face. Figure 4a shows the schematic diagram of reserved core soil. The tunnel face is divided into three areas: the annular excavation area, reserved core soil, and excavation area of the lower section. As shown in the figure, the annular excavation area is first excavated to form an arc advance guide pit at the tunnel outline during tunnel excavation. The reserved core soil in the center of tunnel face is retained to support against tunnel face, and then increase the tunnel face stability. The quantitative supporting method of reserved core soil is introduced based on the existing research. A simplified schematic diagram of reserved core soil size is shown in Figure 4b, where b1 is the bottom width, b2 is the top width and h is the height of reserved core soil. It is assumed that the mechanical action of the wedge sliding body on the reserved core soil causes the reserved core soil to be in a critical sliding state. That is, the supporting stress reaches the maximum value, and the maximum supporting stress can be determined by the passive soil pressure. The supporting stress (P2) provided by the reserved core soil is expressed as:
{ P 2 = 1 2 ( b 1 + b 2 ) ( 1 2 K p γ h 2 + 2 K p c h ) K p = tan 2 ( 45 ° + 1 2 φ ) ,
where Kp is the Rankine passive soil pressure coefficient.
It is assumed that the toe angle of the reserved core soil is the sliding angle (β) of the surrounding rock. The top width (b2) of reserved core soil can be expressed as:
b 2 = b 1 2 h tan β ,
The supporting stress (P2) can be obtained by the simultaneous Equations (23) and (24):
P 2 = 1 2 K p γ h 3 tan β + ( 1 2 K p γ b 1 2 tan β K p c ) h 2 + K p c b 1 h ,
From the stable conditions of wedge sliding body, it can be seen that when the sliding stress generated by self-gravity and compressive stress are greater than anti-sliding stress generated by surrounding rock, then the failure of sliding instability will occur. In order to achieve a quantitative description of the stability of the wedge sliding body, the ratio of anti-sliding force to the sliding force of the wedge sliding body is defined as the stability coefficient (K). The ratio of anti-sliding force to sliding force without any supports is defined as the initial stability coefficient of tunnel face (K0). Based on the limit equilibrium model of wedge sliding body in Figure 1, initial stability coefficient (K0) of tunnel face can be expressed as:
K 0 = T 1 + 2 T 2 ( F + G ) cos β ,
If the reinforcement effects of pipe roofing support, tunnel face bolting support, tunnel face grouting support and reserved core soil are considered, the stability coefficient (K) of the tunnel face after reinforcement can be expressed as:
K = T 1 + 2 T 2 + ( P 1 + P 2 ) sin β ( α 1 F + G ) cos β ,

2.3. Discrimination Method of Tunnel Face Stability

To reasonably determine the stability of tunnel face, this paper introduces the critical stability coefficient ([Kmin]) [35], and then comprehensively and quantitatively evaluates the reinforcement effect of the pipe roofing support, tunnel face bolting support, tunnel face grouting support and reserved core soil. First, the initial stability of the tunnel face and whether the excavated tunnel face needs to be reinforced are judged. The discrimination method of tunnel face stability is as follows. When P ≤ 0 and K0 > [Kmin], it indicates that the initial tunnel face is in a stable state, and thus support is not required. When { P 0   ,   K 0 [ K m i n ] P > 0 , it indicates that the initial tunnel face is in an unstable state or its safety reserve is insufficient, so support is needed. The stability coefficient (K) in Section 2.2 is used to determine the tunnel face stability after reinforcement. The discrimination steps are: ① when K ≤ [Kmin], it indicates that the supporting measures cannot meet the stability requirements, and the supporting strength needs to be increased until the stability coefficient meets K > [Kmin]. ② when K > [Kmin], it shows that the supporting measures can ensure the stability of the tunnel face and have a certain safety reserve.
The critical stability coefficient of a tunnel face must be determined. Existing studies [35] show that the sliding surface of rock slope or soil rock combination slope developed with an inclined structure surface has an approximately regular plane, and its stability is usually analyzed by rigid body limit balance condition. Based on the wedge sliding body model established in this paper, the failure mode of tunnel face in shallow buried tunnel is the overall collapse failure of the wedge sliding body and the slip surface is also manifested as the plane, which has the same collapse mode as the rock slope and earth rock slope combined. Therefore, the instability judgment of the tunnel face in shallow buried tunnel can refer to the judgment standard of rock slope or soil–rock slope. The wedge sliding body in front of the tunnel face is regarded as a secondary temporary slope combined with the existing specifications [36,37], and the critical stability coefficient ([Kmin]) can be determined as 1.20.

3. Quantitative Analysis of Support Effect of the Tunnel Face

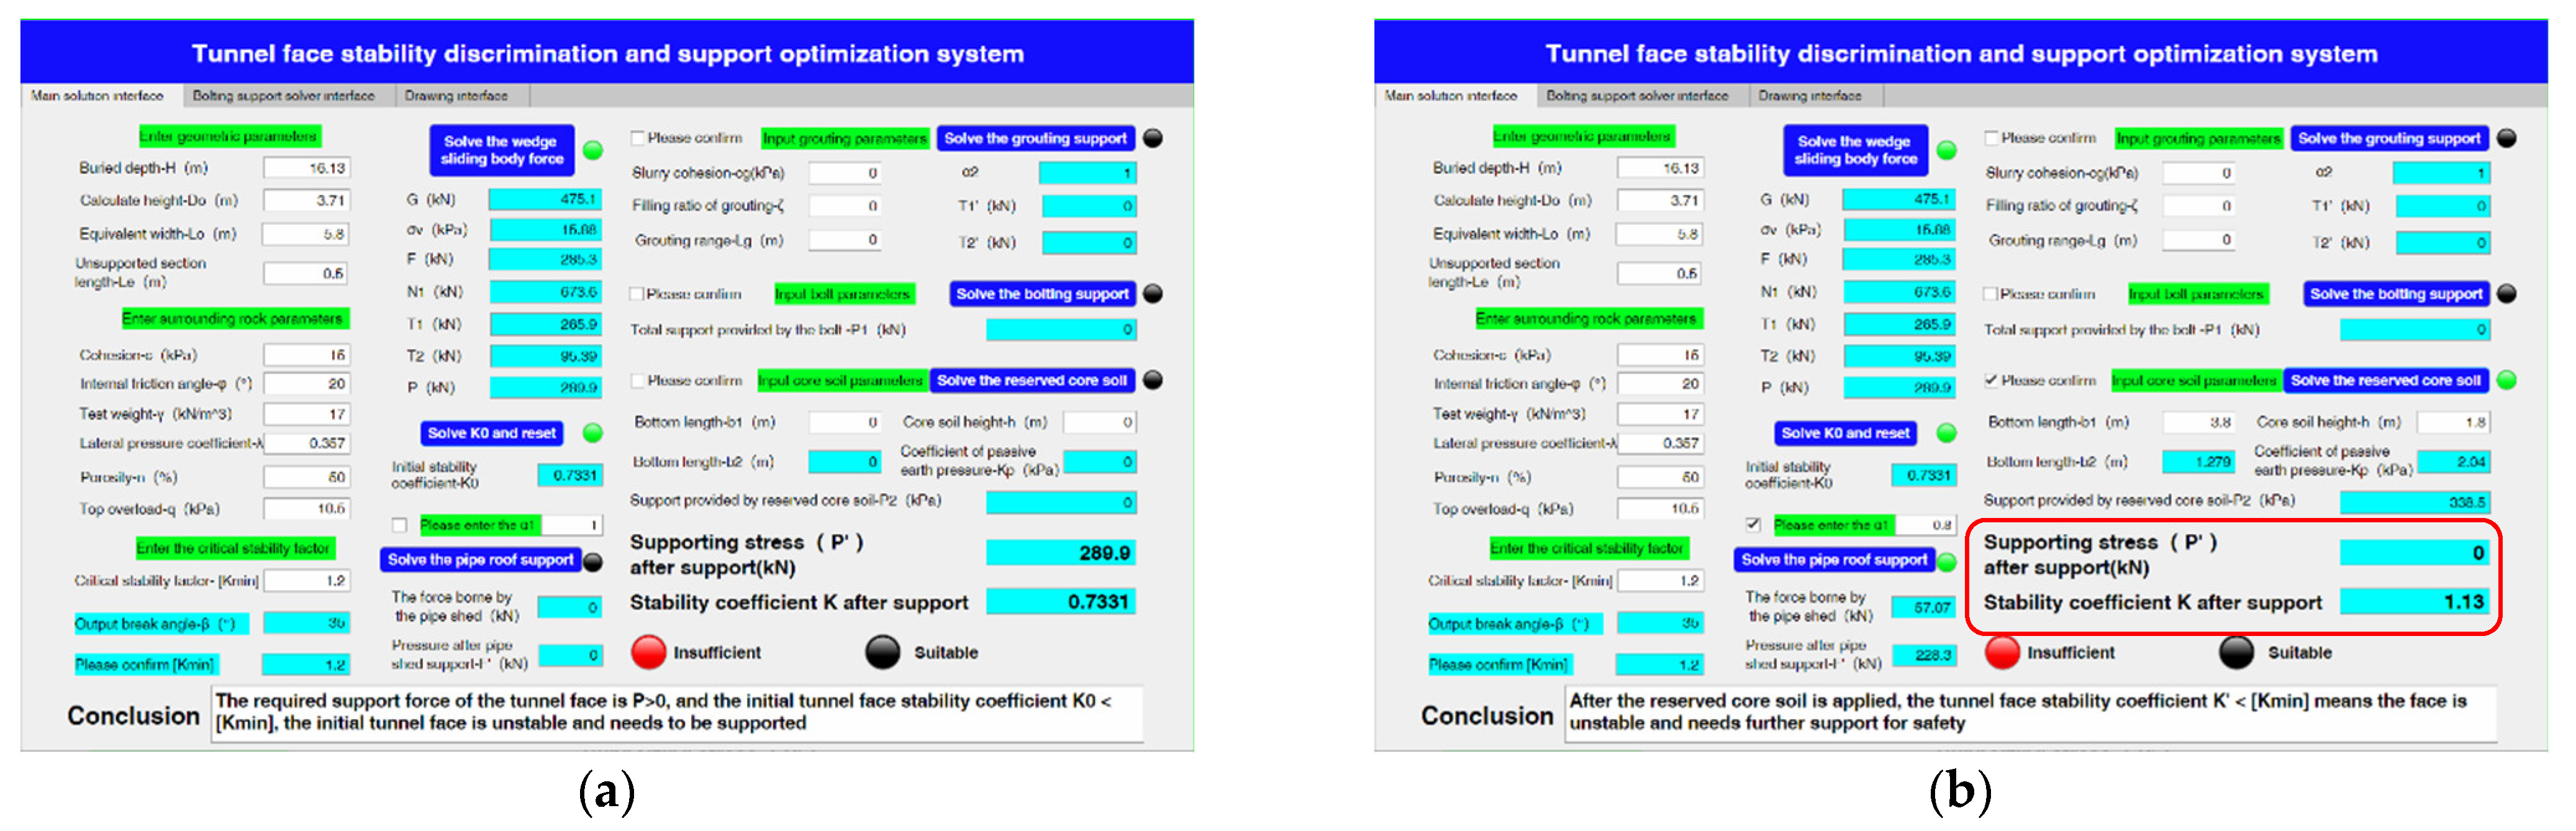
3.1. Support Optimization System of the Tunnel Face

Based on the above discrimination method of tunnel face stability, the discrimination of tunnel face stability and the support optimization system were developed by using the appdesigner function in Matlab software. This support optimization system takes the theoretical calculation in Section 2 as the optimization algorithm to realize the initial stability and stability coefficient under pipe roofing support, tunnel face bolting support, tunnel face grouting support and reserved core soil. Then to judge the stability of tunnel face and suitability of supporting measures. The operation interface for solving support stress and stability coefficient is shown in Figure 5. Its main functions include inputting the tunnel geometric parameters and soil parameters and then calculating the stability coefficient of the tunnel face. The advantage of the support optimization system is that the stability coefficient of the tunnel face under the four support measures can be calculated simultaneously, so as to achieve a comprehensive evaluation of tunnel face stability.
The operation flow chart of the support optimization system is shown in Figure 6. The contribution of different reinforcement measures to tunnel stability is further evaluated by combining them with the geometric parameters [36] of the shallow buried tunnel. Tunnel parameters: the buried depth (H) is 10 m, the tunnel height (D0) is 10 m, and the length of unsupported section (Le) is 1 m. Rock mass parameters: the cohesion (c), internal friction angle (φ) and porosity (n) are 7.50 kPa, 28.60° and 40%, respectively. The density (γ) and lateral stress coefficient (λ) of soil are 18 kN/m3 and 0.5217, respectively.

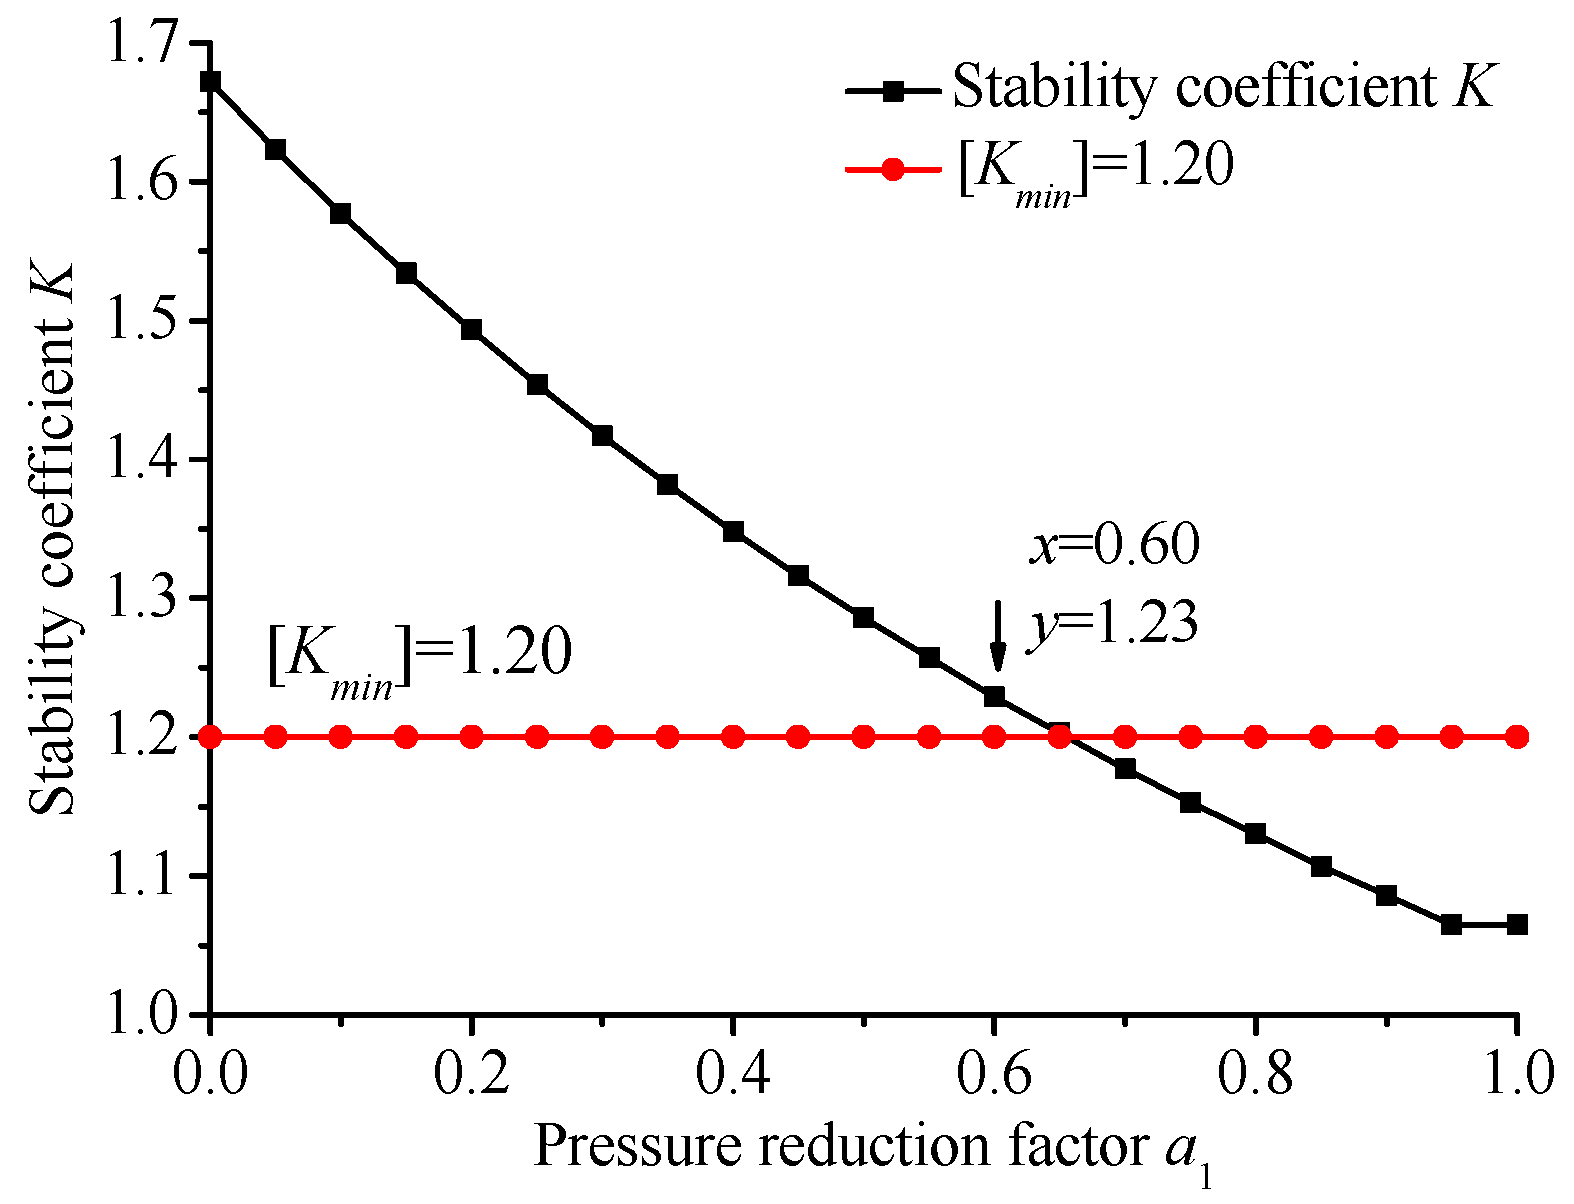
3.2. Strengthening Effect of Pipe Roofing Support

Figure 7 shows the relationship between the stability coefficient (K) and vertical pressure reduction factor (a1) under pipe roofing support. When a1 = 0, it means that the pipe roof bears the upper pressure, and when a1 = 1, it means that the pipe roof does not bear the upper pressure. It can be seen from Figure 7 that the variation range of the stability coefficient is 0.85~1.64, and the stability coefficient of tunnel face decreases with the increasing vertical pressure reduction factor after pipe roofing support is implemented. The stability coefficient is significantly larger than the critical stability coefficient ([Kmin]) when the pressure reduction coefficient is less than 0.40, and the stability coefficient gradually tends to 0.80 when the pressure reduction coefficient is greater than 0.40. The classical prism–wedge model shows that the safety pressure reduction factor of rock mass in actual tunnel engineering is generally between 0.60 and 0.90 [26]. However, the conclusion drawn from Figure 7 shows that the stability coefficient corresponding to the safety pressure reduction coefficient is 0.90~1.06, which is clearly less than 1.20. Therefore, it can be concluded that the strengthening effect of pipe roofing support cannot meet the stability requirements of the tunnel face.

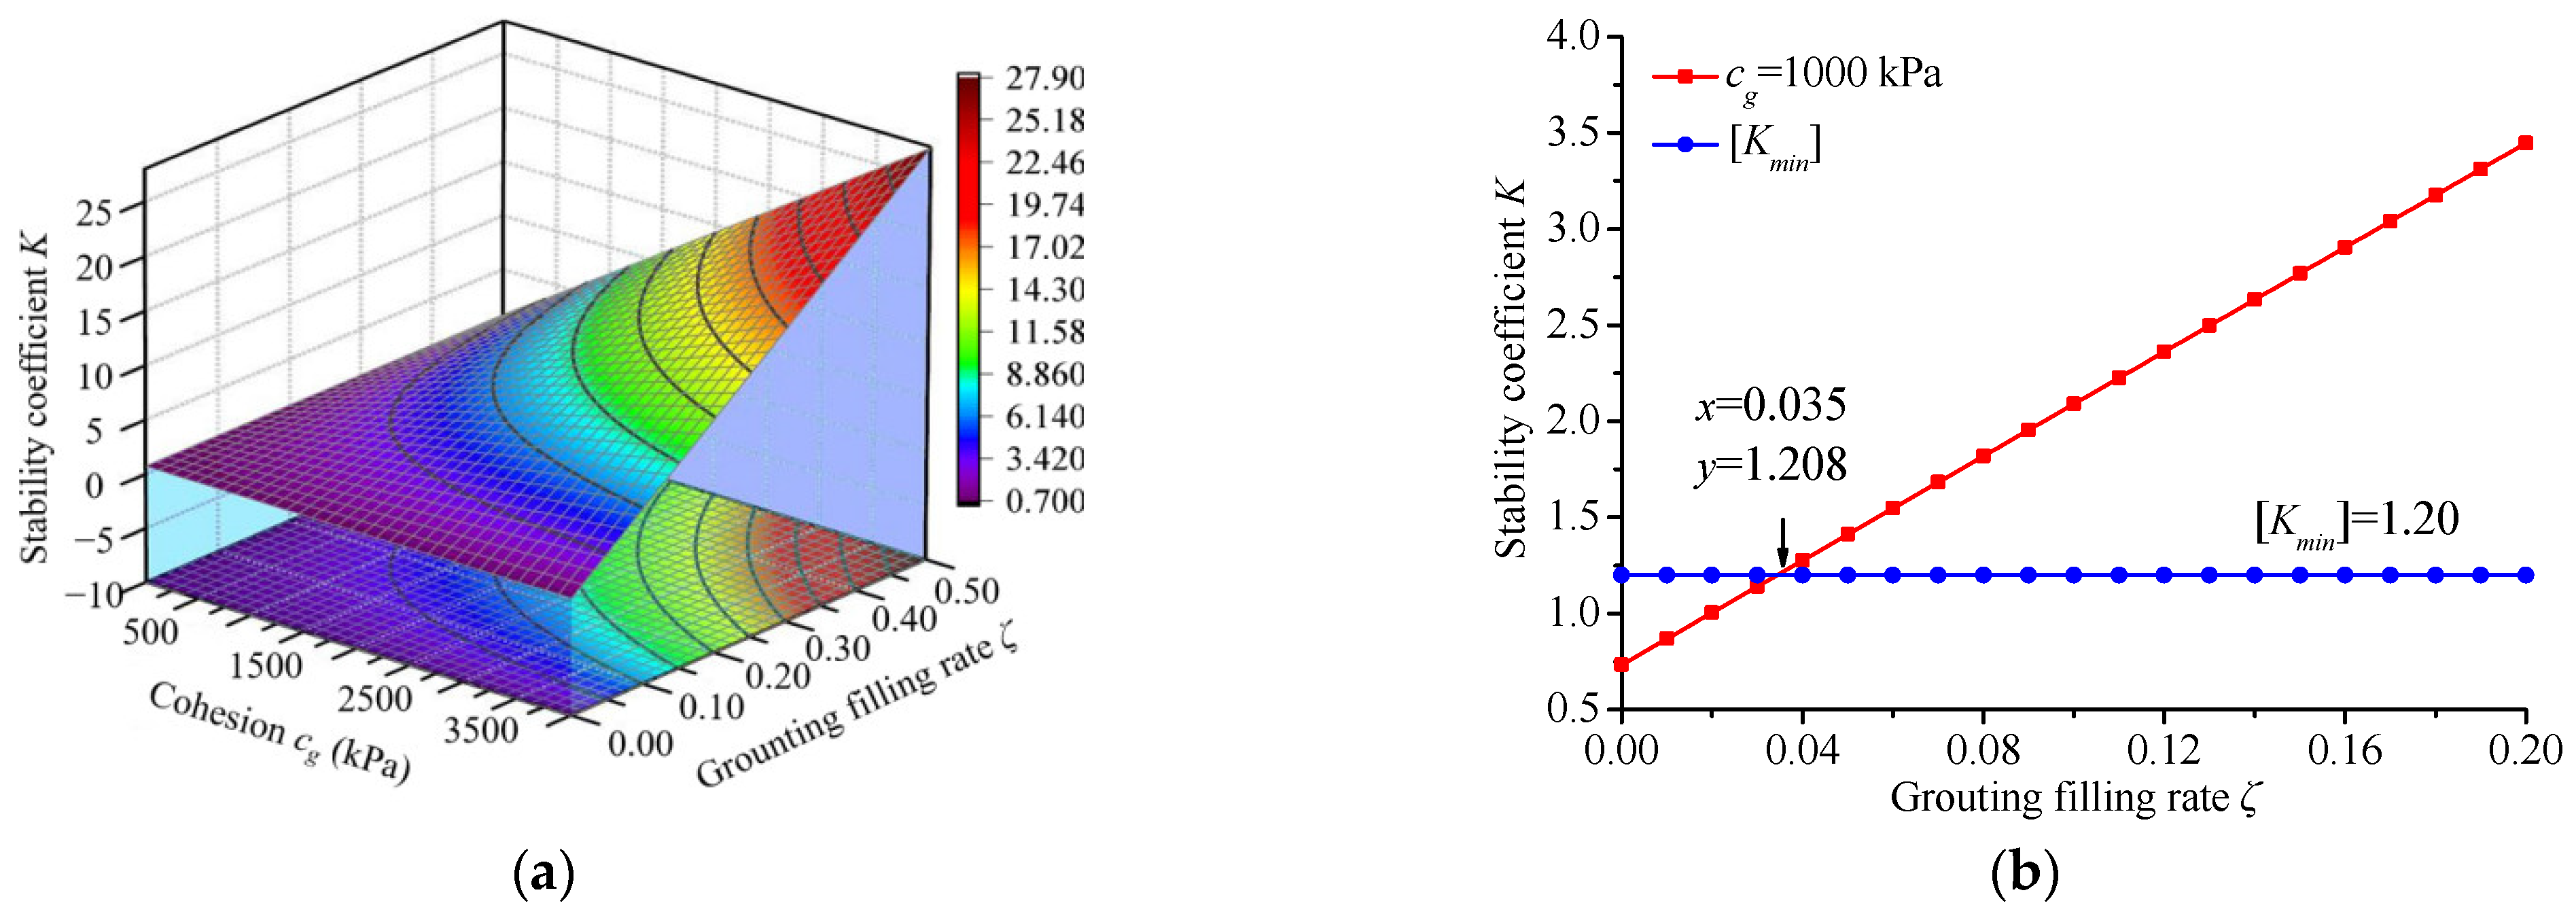
3.3. Strengthening Effect of Grouting Support

The grouting strengthening effect of the tunnel surface is closely related to the cohesion (cg), grouting filling rate (ζ) and grouting depth (Lg). Figure 8 shows the relationship between stability coefficient and grouting depth under grouting support. As can be concluded from Figure 8, the grouting depth causes the stability coefficient to go through a linear growth and a steady development with a stage demarcation point of 5.94 m. The evolution characteristics of the stability coefficient show that when the tunnel face does not have grouting support (Lg = 0), its stability coefficient (0.86) is significantly less than 1.20, showing that the tunnel face cannot reach a self-stable state. The stability coefficient linearly increases when the grouting depth increases from 0 to 6 m, and the strengthening effect of tunnel face is significantly improved when the grouting depth is greater than 2.40 m. The maximum stability coefficient reaches a maximum of 1.75 when the grouting depth is 6 m. This indicates that the tunnel face has the best reinforcement effect. However, the stability coefficient remains around 1.75 when the grouting depth exceeds 6 m, indicating that the reinforcement effect does not continue to improve.
The reason analysis shows that the grouting support improves the stability and bearing strength of tunnel face by increasing the cohesion of the wedge sliding body. The grouting effect cannot be fully utilized by the wedge sliding body and sliding surface when the grouting depth exceeds the sliding surface. The stability of the tunnel face cannot significantly improve if the grouting depth continues to increase, but the utilization rate of the grouting material is reduced [29]. Therefore, the precise position of sliding surface of the wedge sliding body should be considered when strengthening the grouting of the tunnel surface, and the grouting depth should be comprehensively determined in combination with factors such as excavation footage and grouting equipment performance.
Based on a consideration of the potential instability of the tunnel face, a sufficient grouting depth was preserved, and the grouting depth (Lg) is 8 m. Figure 9 shows the relationship between the stability coefficient and cohesion and grouting filling rate. It can be seen from the 3D distribution cloud map that the stability coefficient of the tunnel face has spatial division characteristics, indicating that there are differences in the reinforcement effect of grouting. Figure 9b shows the relationship between the stability coefficient and grouting filling rate when the mortar cohesion is 1000~4000 kPa, revealing that the stability coefficient linearly increases with the increasing grouting filling rate when the mortar cohesion is determined. When the mortar cohesion is 1000 kPa, the grouting filling rate increases from 0 to 0.075, and the stability coefficient increases from 0.86 to 1.20. Existing studies show that the grouting filling rate of surrounding rock in practical engineering is generally between 0.15 and 0.20 [38]. It can be seen that the stability coefficient increases to 1.75 as the grouting filling rate increases to 0.20, indicating that the reinforcement effect is significantly improved.
Figure 9c shows that the stability coefficient also has a good linear correlation with mortar cohesion when the grouting filling rate is determined. When the grouting filling ratio is taken as 0.15, the stability coefficient increases from 0.86 to 1.22 when the mortar cohesion increases from 0 to 550 kPa. When the mortar cohesion increases to 4000 kPa, the stability coefficient can reach 3.52, which is 4.09 times higher than initial stability coefficient. When the grouting filling rate is 0.20 and the mortar cohesion values are 1000 kPa, 2000 kPa, 3000 kPa and 4000 kPa, the corresponding stability coefficients are 1.75, 2.63, 3.52 and 4.41, respectively. A higher stability coefficient can significantly improve the safety of the tunnel face, but it also increases engineering costs and the difficulty of excavation [5,25,29,36]. Therefore, the parameters of the grouting type and grouting pressure should be reasonably determined according to the soil properties to address safety and cost.

3.4. Strengthening Effect of Reserved Core Soil

Figure 10 shows the 3D relationship between the stability coefficient (K), bottom width (b1) and top height (h) of the reserved core soil. It can be seen that the stability coefficient presents typical spatial distribution characteristics when the reserved core soil is used to strengthen the tunnel face, and the projection of the stability coefficient on the horizontal plane is triangular with the variation range of 0.85~1.225. The stability coefficient can effectively be stabilized at 1.225 when the bottom width is 7.85 m and top height is 6.60 m, which is slightly larger than the critical stability coefficient.
Equation (25) shows that the supporting stress provided by reserved core soil has a linear relationship with bottom width and a cubic nonlinear relationship with top height, indicating that the influence of top height on the stability coefficient is significantly greater than that of bottom width. Relevant specifications reveal that the reserved area of core soil is generally not less than 50% of tunnel face [38,39], but the reserved core soil size of the actual construction is often affected by the limitations of tunnel dimensions, cycle footage, self-stability and construction convenience. Therefore, a larger excavation height will reduce the ratio of the reserved core soil area to the excavated cross-sectional area when the tunnel is excavated by the full-section method, resulting in a limited strengthening effect. A larger height of core soil can be reserved for a better supporting effect when excavating with the step method, and this is consistent with the fact that reserved core soil is mostly used in step method construction [30,38]. It can be seen from the above analysis that, on the premise of ensuring the stability of the reserved core soil and construction space, appropriately increasing the top height and bottom width can improve the stability of the tunnel face, and blindly increasing the reserved core soil dimensions will adversely affect the convenience of construction.

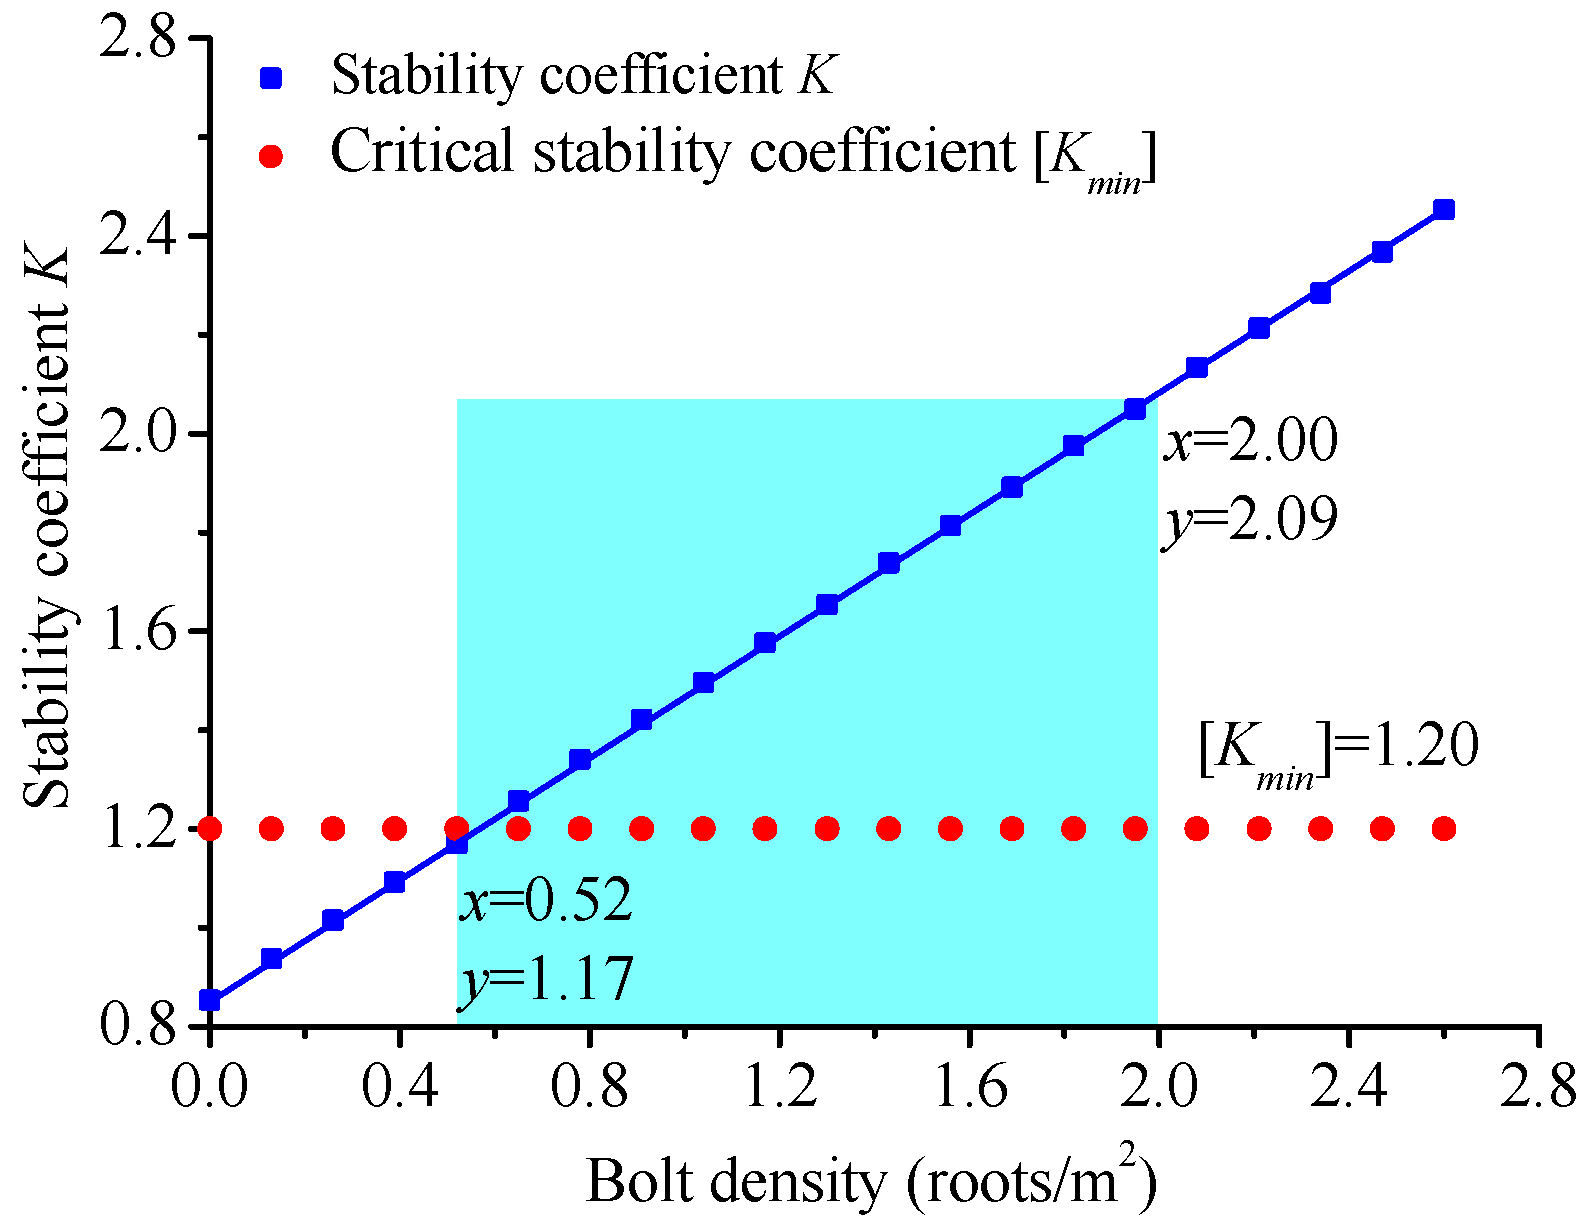
3.5. Strengthening Effect of Bolting Support

Fiberglass anchor bolts are mainly composed of glass fiber polymers and widely used in tunnel face support because of their characteristics of a high tensile strength, low shear strength and easy excavation. To analyze the strengthening effect of bolting support, the bearing capacity of a single bolt in five failure modes was calculated. Referring to the existing study [26,27], the bolt parameters are m = 100, lIi = 3 m, lIIi = 1 m, db = 0.025 m, dh = 0.042 m, fb = 556 MPa, and ft = 1.20 MPa. The anchoring stresses of the anchor bolt are P1i = 272.80 kN, P2i = 592.80 kN, P3i = 17531 kN, P4i = 216 kN, and P5i = 5844 kN, and its total supporting stress is Pmin = 216 kN. Therefore, the strengthening effect of bolting support can be studied by increasing the anchor bolt density. The variation trend in the stability coefficient (K) with increasing anchor bolt density is shown in Figure 11.
As shown in Figure 11, the stability coefficient linearly increases with the density of anchor bolt. The stability of the tunnel face cannot meet the safety construction requirements when the anchor bolt density is less than 0.52 roots/m2. The stability coefficient is slightly greater than the critical stability coefficient (1.20) when the anchor bolt density is greater than 0.52 roots/m2, indicating that the stability of the tunnel face is improved, and the strengthening effect is slightly prominent. The anchor bolt density in actual engineering is generally 0.50~2 roots/m2 [26], as shown in the shaded part in Figure 11, and the stability coefficient calculated from the data in this paper is 1.17~2.09. It can be seen that the improvement effect of tunnel stability depends on the anchor bolt density when the anchoring force is determined; however, it is not possible to blindly increase the anchor bolt density and ignore the cost of engineering, when considering the actual working conditions.
Based on the above analysis, it can be concluded that the grouting support has the most significant effect on improving tunnel face stability, followed by the reinforcement effect of the anchor bolt and reserved core soil; the reinforcement effect of pipe roofing support has the worst effect. Therefore, the reserved core soil is preferred for providing support if the initial stability coefficient of tunnel face cannot meet the stability requirement, and then the reinforcement through the tunnel face grouting is more effective than other measures when the stability requirements are still not met.

4. Engineering Case Calculation

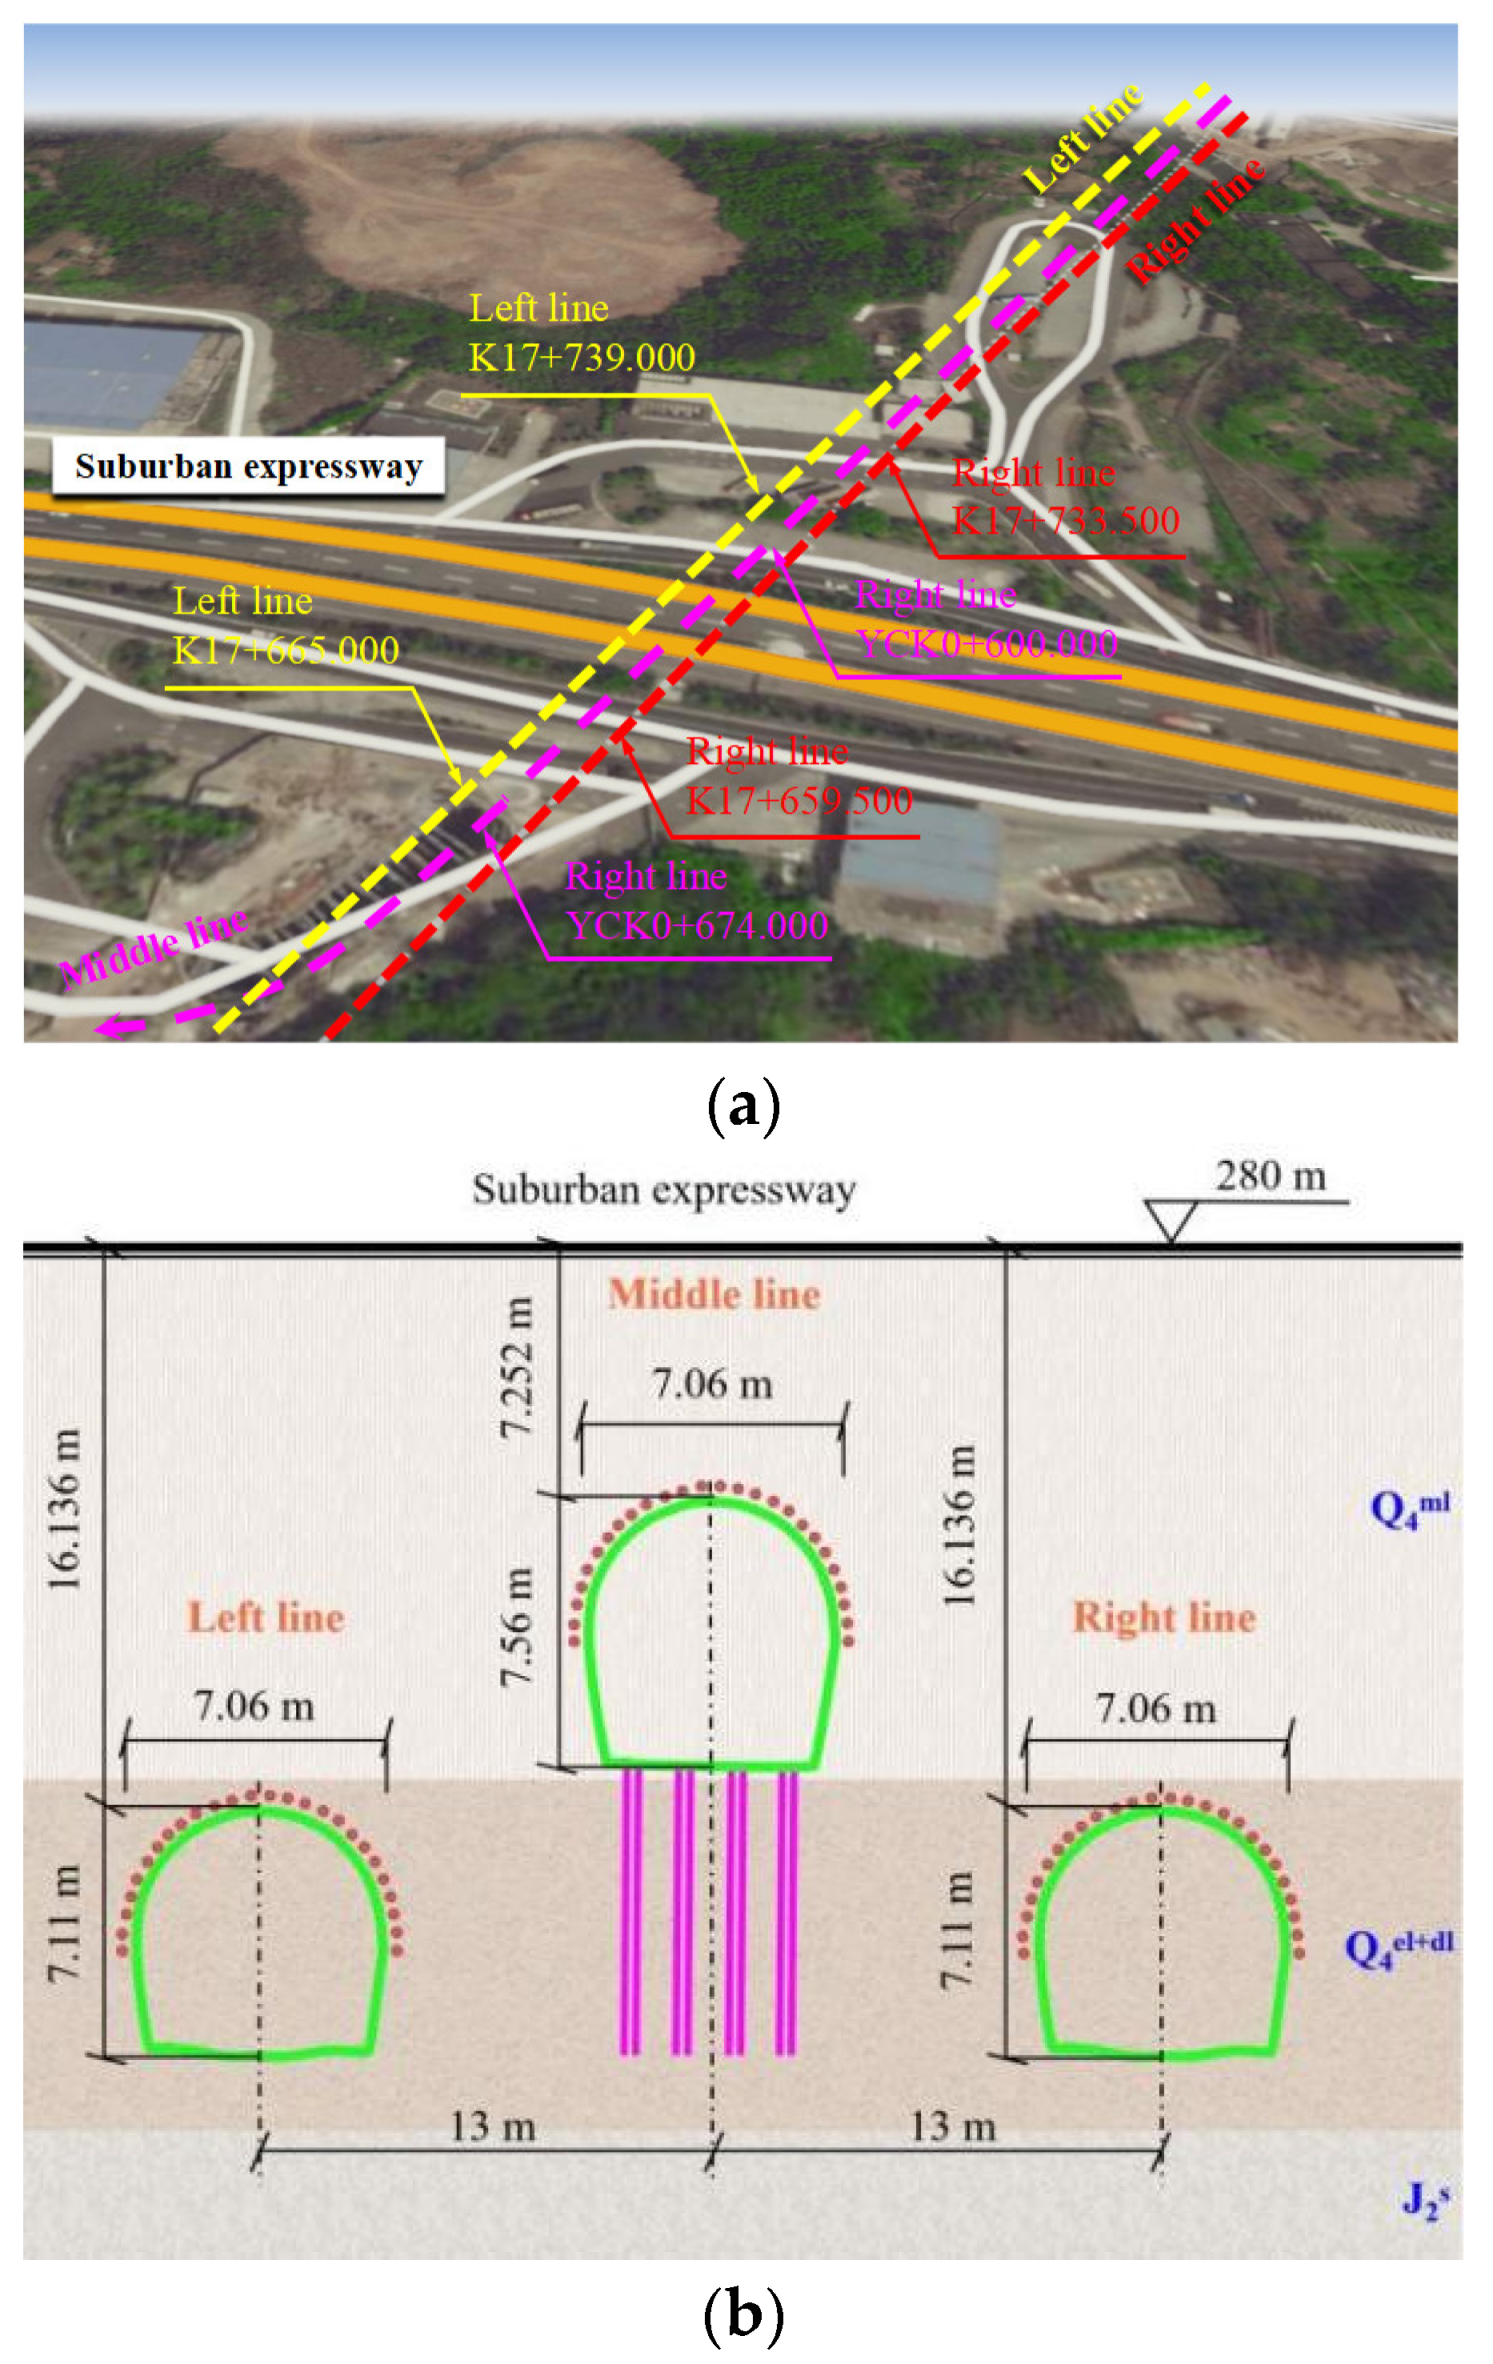
4.1. Engineering Geology Overview

Figure 12 shows the schematic diagram of the underground rail transit tunnel passing through suburban expressway in Chongqing. It can be seen from satellite terrain map that the left, right and middle lines all obliquely pass through the existing suburban expressway through the underground excavation method. The mileage of the left line is K17+665.000 to K17+739.000, the mileage of right line is K17+659.500 to K17+733.500, and the mileage of middle line is YCK0+600.000 to YCK0+674.000. The length of tunnel passing through the suburban expressway is about 74 m. The schematic diagram of tunnel cross-section shows that the left line and right line tunnels are symmetrically distributed with respect to middle line with a width of 7.06 m, a height of 7.11 m and a buried depth of 16.136 m. The width of middle line tunnel is 7.06 m, the height is 7.56 m, and the buried depth is 7.252 m. The geological survey data show that the buried depth of the three tunnels is less than 2.50 times the height of surrounding rock pressure arch, belonging to the shallow buried tunnel [38]. The length (Le) of the unsupported section of excavation section is the spacing between arches (0.50 m). The statistical geometric dimensions and excavation parameters are shown in Table 1.
Table 2 shows the surrounding rock parameters. Above the tunnel vault is mainly artificial fill and silty clay, and the surrounding rock is graded V. The underlying rock is mainly sandstone and sandy mudstone of the Middle Jurassic Shaximiao Formation, and the surrounding rock is graded IV. The exposed strata are Quaternary Holocene artificial fill (Q4ml), residual slope layer silty clay (Q4el+dl), and sedimentary rock strata of Middle Jurassic Shaxi Temple Formation (J2s). Since the suburban expressway is a two-way four-lane expressway, the General Specification for Design of Highway Bridges and Culverts states that the standard value of a uniformly distributed load for a Class I lane is 10.50 kN/m [39]. The geological survey data show that the stratum on the left line of tunnel is poor silty clay, which easily leads to the instability of tunnel face during excavation. Therefore, it is necessary to optimize the reinforcement scheme of the tunnel face.

4.2. Initial Stability Analysis of Tunnel Face

According to the geological conditions of the left line tunnel and mechanical parameters of the surrounding rock, the initial stability analysis of tunnel face was discussed by tunnel face stability discrimination and the support optimization system. According to the above description, the geological conditions and tunnel parameters of the left line tunnel are determined as follows: the buried depth (H) is 16.13 m, the calculated height (D0) is equal to the height of upper step at 3.71 m. The equivalent width (l0) is 5.80 m, and the length of the unsupported section (Le) is 0.50 m. The cohesion (c), internal friction angle (φ), and porosity (n) are 15 kPa, 20° and 50%, respectively. The density (γ) and lateral stress coefficient (λ) of the soil are 17 kN/m3 and 0.357, respectively. The above parameters are input into the tunnel face stability discrimination and support optimization system developed based on the calculation method described in Section 2 to calculate the initial state of stability coefficient of left line tunnel under the original design support. The calculation interface is shown in Figure 13.
The calculation results of the initial stability coefficient of the left line tunnel show that the supporting stress when the tunnel surface reaches the steady state is 289.90 kN, and the initial stability coefficient (K0) is 0.733, which is only 61.83% of the critical stability coefficient. Therefore, the tunnel face cannot reach a stable state without reinforcement measures. The tunnel in this study section adopts a double-layer pipe roofing support and reserved core soil to support the tunnel face according to original design scheme. The calculated supporting stress required for the tunnel face to reach stability is 0 kN, and the stability coefficient is 1.13, which is slightly less than the critical stability coefficient of 1.20. The calculation results of the stability coefficient show that, although the original design scheme can initially stabilize the tunnel face, it cannot guarantee safe construction due to insufficient safety reserves, and there is a great construction risk. On-site monitoring shows that the ground surface of the auxiliary road of the left line occurred in an over-limit settlement on 7 October 2019 when the original design scheme was used for construction, which can further confirm the reliability of the calculation results. The original support scheme of tunnel face needs to be properly optimized.

4.3. Optimization Analysis of Support Measures

Figure 14 shows the relationship between the stability coefficient (K) and vertical pressure reduction factor (a1) under the strengthening effect of pipe roofing support. It can be seen that only when the pressure reduction factor is adjusted from 0.80 to 0.60 can the stability coefficient increase from 1.13 to 1.23, barely reaching the critical stability coefficient. Therefore, it is difficult to ensure the stability of the tunnel face by reducing the pressure reduction factor through the optimization of the pipe roofing support parameters. On the contrary, the operation difficulty and construction costs will greatly improve if the pipe roofing support parameters are forced to improve. Furthermore, the pipe roof has the function of carrying vault gravel to ensure construction safety, so the pipe roof support cannot be removed. Based on the above analysis, it is recommended that the optimization of design parameters of the original scheme is abandoned. Instead, support measures should be adopted based on the original scheme and increase the grouting reinforcement to improve the strengthening effect.
The specification shows that the grouting filling rate of the surrounding rock is about 0.15~0.20 when the mortar cohesion is 1000~4000 kPa [38]. The distance from the sliding surface to the tunnel face calculated in this project is 2.60 m, so the grouting depth (Lg) is set to 3 m, and mortar cohesion is 1000 kPa. Figure 15 shows the relationship between the stability coefficient and grouting filling rate. It can be seen that the stability coefficient increases from 0.733 to 1.208 when the grouting filling rate increases from 0 to 0.035. The stability coefficient will continue to linearly increase with the increase in grouting filling rate. The stability coefficient reaches 2.769 when the grouting filling rate increases to 0.15, indicating that the reinforcement effect can be effectively improved by appropriately increasing the grouting filling rate when the grouting cohesion is determined. From this, it can be concluded that the reserved core soil of the original design scheme (reserved core soil + pipe roofing support) has no optimization conditions, the reinforcement effect after optimizing the pipe roofing support is not clear, and the stability can be greatly improved by grouting support. Therefore, an optimization scheme of pipe roofing support + reserved core soil + grouting support was formed considering the effect of support measures and difficulty of construction.

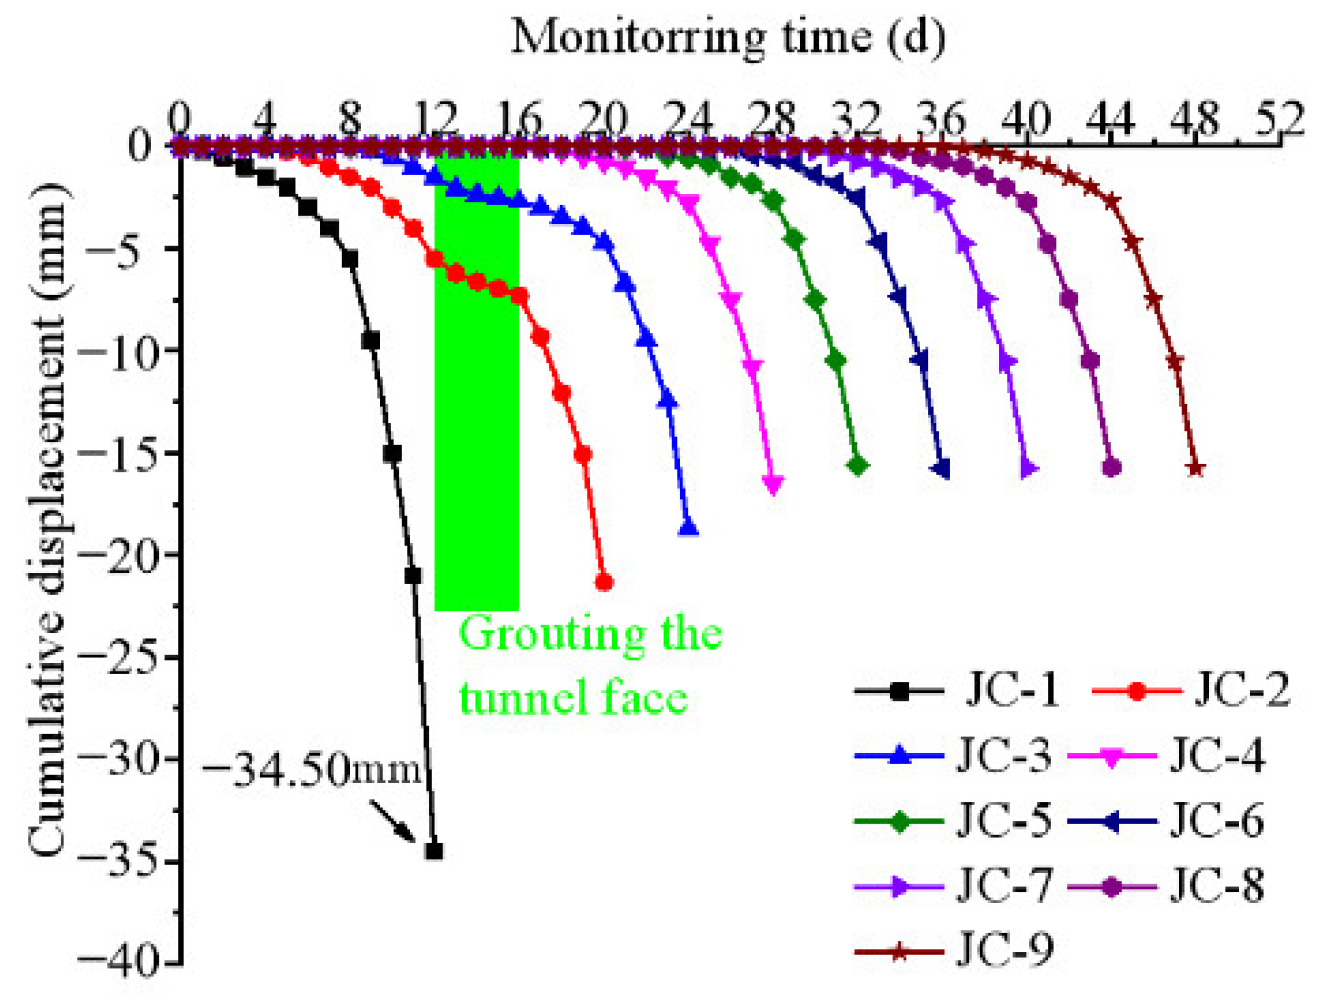
4.4. On-Site Monitoring

To verify the rationality and superiority of the optimized support measures, on-site monitoring was carried out on the surface settlement of a suburban expressway in the study section to reveal the stability of the tunnel face. A schematic layout diagram of the on-site monitoring plan is shown in Figure 16. The monitoring points JC-1~JC-9 were characteristic measuring points with an interval of 8 m, and three monitoring points were arranged between every two characteristic monitoring points. The monitoring points were arranged on the suburban highway pavement along tunnel according to a 2 m spacing. The distance between tunnel face and monitoring point was about 3 times the tunnel diameter (21~24 m). The daily excavation footage of the tunnel was about 2 m, and the next monitoring point began to enter the settlement influence range after 4 days.
Figure 17 shows the variation trend in the cumulative displacement of different monitoring points JC-1~JC-9. It can be seen that the cumulative displacement of all monitoring points gradually increases with increasing monitoring time, and the farther from the tunnel face, the slower the cumulative displacement increases, and the smaller the maximum cumulative displacement. The settlement characteristics can be found that when the distance from tunnel face is about 3.40 times the tunnel dimensions, the cumulative deformation and change rate of monitoring point JC-1 continue to increase. The cumulative displacement reaches 34.50 mm when the tunnel face is excavated below the monitoring point, which exceeds the settlement warning value (30 mm). This has a great impact on the safety of the suburban expressway; therefore, it is necessary to stop the tunnel excavation and optimize the original plan.
To ensure the stability of the excavated tunnel face and inhibit the settlement of suburban expressway, the optimization scheme of pipe roofing support + reserved core soil + grouting support is adopted to reinforce the tunnel face on 12th to 16th days, as shown in the shaded area. During the 4 days of tunnel face grouting construction, the cumulative settlement displacements of monitoring points JC-2 and JC-3 show a gradual convergence trend. After the optimization scheme is implemented, the settlement of monitoring points JC-2 and JC-3 continue to increase but the maximum cumulative settlement displacements are only 61.45% and 53.94% of that of monitoring point JC-1, and the settlement degree significantly decreases. The change trends in the monitoring points JC-4~JC-9 are essentially the same as the tunnel face continues to move forward, and the maximum cumulative displacement is roughly 15.50 mm, which is only 44.93% of monitoring point JC-1. It can be seen that the settlement deformation of monitoring points JC-2~JC-9 meets the requirements of the settlement deformation control value [34,35], and the optimization scheme of pipe roofing support + reserved core soil + grouting support has a clear control effect on the surface deformation.

5. Conclusions

To explore the quantitative evaluation method of tunnel face stability, this paper realized a quantitative description of a tunnel face under pipe roofing support, bolting support, grouting support and reserved core soil. The tunnel face stability discrimination and support optimization system was developed, and supporting effects were quantitatively evaluated based on a buried tunnel in Chongqing. The following conclusions can be drawn:
  • The quantitative analysis model of tunnel face stability is established based on the silo theory. The tunnel face stability discrimination and support optimization system is developed, which can rapidly determine tunnel face stability and then provide a quantitative evaluation method for the assessment of tunnel face safety.
  • Based on the quantitative analysis model of tunnel face stability, the strengthening effect of different support schemes of the tunnel face is systematically analyzed. It can be found that the grouting support has the most significant effect on improving the tunnel face stability, followed by the reinforcement effect of an anchor bolt and reserved core soil, and the reinforcement effect of pipe roofing support has the worst effect. The reserved core soil is preferred for use as a support if the initial stability coefficient of the tunnel face cannot meet the stability requirements. Then, the reinforcement through the tunnel face grouting is more effective than other measures when the stability requirements are still not met.
  • The tunnel surface stability of an underground rail transit tunnel passing through suburban expressway in Chongqing was analyzed based on the tunnel face stability discrimination and support optimization system. The optimization analysis of support measures successfully predicts the over-limit settlement of an auxiliary road of the left line. Then, the optimization scheme of pipe roofing support + reserved core soil + grouting support is finally formed considering the effect of support measures and construction difficulty. On-site monitoring shows that the farther from the tunnel face, the slower the cumulative displacement increases, and the smaller the maximum cumulative displacement. The settlement displacement after optimization is reduced to 15.50 mm, which is about 44.93% before the optimization of the reinforcement scheme, ensuring the safe construction of the suburban expressway.

Author Contributions

Conceptualization, G.-N.Z.; methodology, G.-N.Z. and T.-T.Y.; software, T.-T.Y. and H.L.; validation, T.-T.Y.; formal analysis, G.-N.Z. and T.-T.Y.; investigation, Z.S., Y.C. and J.-J.H.; resources, G.-N.Z. and T.-T.Y.; data curation, Z.S. and H.L.; writing—original draft preparation, Z.S.; writing—review and editing, Y.C. and Z.-P.S.; visualization, Z.-P.S.; supervision, T.-T.Y.; project administration, G.-N.Z.; funding acquisition, G.-N.Z., T.-T.Y. and Z.-P.S. All authors have read and agreed to the published version of the manuscript.

Funding

This research was funded by Science and Technology Innovation Project of China Railway Construction Bridge Engineering Bureau Group Co., Ltd. (No. DQJ-2020-B07).

Institutional Review Board Statement

Not applicable.

Informed Consent Statement

Not applicable.

Data Availability Statement

Not applicable.

Acknowledgments

The authors would like to thank the editor and the reviewers for their contributions.

Conflicts of Interest

The authors declare no conflict of interest.

References

  1. Dong, L.; Song, D.; Liu, G. Seismic wave propagation characteristics and their effects on the dynamic response of layered rock sites. Appl. Sci. 2022, 12, 758. [Google Scholar] [CrossRef]
  2. Fan, S.Y.; Song, Z.P.; Zhang, Y.W.; Liu, N.F. Case study of the effect of rainfall infiltration on a tunnel underlying the roadbed slope with weak inter-layer. KSCE J. Civ. Eng. 2020, 24, 1607–1619. [Google Scholar] [CrossRef]
  3. Fan, S.Y.; Song, Z.P.; Xu, T.; Wang, K.M.; Zhang, Y.W. Tunnel deformation and stress response under the bilateral foundation pit construction: A case study. Arch. Civ. Mech. Eng. 2021, 21, 109. [Google Scholar] [CrossRef]
  4. Tian, X.X.; Song, Z.P.; Zhang, Y.W. Monitoring and reinforcement of landslide induced by tunnel excavation: A case study from Xiamaixi tunnel. Tunn. Undergr. Space Technol. 2020, 110, 103796. [Google Scholar] [CrossRef]
  5. Tian, X.X.; Song, Z.P.; Wang, H.Z.; Zhang, Y.W.; Wang, J.B. Evolution characteristics of the surrounding rock pressure and construction techniques: A case study from Taoshuping tunnel. Tunn. Undergr. Space Technol. 2022, 125, 104522. [Google Scholar] [CrossRef]
  6. Zhu, C.; He, M.C.; Zhang, X.H.; Tao, Z.G.; Yin, Q.; Li, L.F. Nonlinear mechanical model of constant resistance and large deformation bolt and influence parameters analysis of constant resistance behavior. Rock. Soil. Mech. 2021, 42, 1911–1924. [Google Scholar]
  7. Zhu, C.; He, M.C.; Jiang, B.; Qin, X.Z.; Yin, Q.; Zhou, Y. Numerical investigation on the fatigue failure characteristics of water-bearing sandstone under cyclic loading. J. Mt. Sci. 2021, 18, 3348–3365. [Google Scholar] [CrossRef]
  8. Wu, K.; Shao, Z.S.; Qin, S.; Wei, W.; Chu, Z. A critical review on the performance of yielding supports in squeezing tunnels. Tunn. Undergr. Space Technol. 2021, 115, 103815. [Google Scholar] [CrossRef]
  9. Wu, K.; Shao, Z.S.; Sharifzadeh, M.; Hong, S.; Qin, S. Analytical computation of support characteristic curve for circumferential yielding lining in tunnel design. J. Rock Mech. Geotech. Eng. 2022, 14, 144–152. [Google Scholar] [CrossRef]
  10. Song, Z.P.; Song, W.X.; Cheng, Y.; Yang, T.T.; Wang, T.; Wang, K.S. Investigation on strain characteristics and fatigue constitutive model of limestone under osmotic pressure and cyclic disturbance coupling. KSCE J. Civ. Eng. 2021, 26, 1740–1753. [Google Scholar] [CrossRef]
  11. Cheng, Y.; Song, Z.P.; Jin, J.F.; Wang, T.; Yang, T.T. Waveform characterisation and energy dissipation of stress wave based on modified SHPB tests. Geomech. Eng. 2020, 22, 187–196. [Google Scholar]
  12. Cheng, Y.; Song, Z.P.; Chang, X.X.; Wang, T. Energy evolution principles of shock-wave in sandstone under unloading stress. KSCE J. Civ. Eng. 2020, 24, 2912–2922. [Google Scholar] [CrossRef]
  13. Yuan, W.; Jin, J.F.; Guo, Z.Q.; Wu, Y. Theoretical analysis of longitudinal wave attenuation in a stressed rock with variable cross-section. Front. Earth Sci. 2019, 7, 270–278. [Google Scholar] [CrossRef]
  14. Cheng, Y.; Song, Z.P.; Song, W.X.; Li, S.G.; Yang, T.T.; Zhang, Z.K.; Wang, T.; Wang, K.S. Strain performance and fracture response characteristics of hard rock under cyclic loading. Geomech. Eng. 2021, 26, 551–563. [Google Scholar]
  15. Li, P.F.; Zhao, Y.; Liu, J.Y. Deformation characteristics and control methods of tunnel soft surrounding rock. China Railw. Sci. 2014, 35, 55–61. [Google Scholar]
  16. Broms, B.B.; Bennermark, H. Stability of clay at vertical openings. J. Soil Mech. Found. Eng. 1967, 193, 71–94. [Google Scholar] [CrossRef]
  17. Potts, D.M.; Atkinson, J.H. Stability of a shallow circular tunnel in cohesionless soil. Geotechnique 1977, 27, 203–215. [Google Scholar]
  18. Anagnostou, G.; Kovári, K. Face stability conditions with earth-pressure-balanced shields. Tunn. Undergr. Space Technol. 1996, 11, 165–173. [Google Scholar] [CrossRef]
  19. Zhang, C.; Han, K.; Zhang, D. Face stability analysis of shallow circular tunnels in cohesive–frictional soils. Tunn. Undergr. Space Technol. 2015, 50, 345–357. [Google Scholar] [CrossRef]
  20. Li, T.; Yang, X. 3D rotational failure mechanism of tunnel face in weathered and saturated hoek-brown rock masses. KSCE J. Civ. Eng. 2019, 23, 2723–2732. [Google Scholar] [CrossRef]
  21. Liu, H.; Zhang, Y.; Liu, H. Failure mechanism of face for slurry shield-driven tunnel in sand. KSCE J. Civ. Eng. 2020, 24, 3105–3118. [Google Scholar] [CrossRef]
  22. Zheng, Y.R.; Qiu, C.Y.; Zhang, H.; Wang, Q. Exploration on stability analysis method of surrounding rock of soil tunnel. J. Rock Mech. Eng. 2008, 27, 1968–1980. [Google Scholar]
  23. Zhao, L.H.; Li, D.J.; Yang, F.; Li, L.; Cheng, X. Dimensionless parameter diagrams for the active and passive stability of a shallow 3D tunnel face. KSCE J. Civ. Eng. 2019, 23, 866–878. [Google Scholar] [CrossRef]
  24. Wu, K.; Shao, Z.; Sharifzadeh, M.; Chu, Z.; Qin, S. Analytical approach to estimating the influence of shotcrete hardening property on tunnel response. J. Eng. Mech. 2022, 148, 4021127. [Google Scholar] [CrossRef]
  25. Song, Z.P.; Tian, X.X.; Zhou, G.N.; Li, W.W. Theoretical analysis of mechanical behavior of advance presupport of pipe-roof protection in tunnel. China J. Highw. Transp. 2020, 33, 93–102. [Google Scholar]
  26. Wang, M.N.; Zhang, X.; Zhao, S.G.; Wang, Z.L.; Liu, D.G.; Tong, J.J. Study on design method of advance support system for mechanized full section construction of tunnel in soft surrounding rock. J. China Railw. Sci. 2020, 42, 146–154. [Google Scholar]
  27. Wang, X.Y.; Zheng, W.H.; Zhang, J.G.; Liu, W. Stability analysis of tunnel face pre strengthened with glass fiber bolt in soft rock tunnel. China Civ. Eng. J. 2017, 50, 53–58. [Google Scholar]
  28. Huang, W.X.; Wu, H.; Wang, J.; Xia, M. Comparative study on excavation sequence of tunnel in biased soft surrounding rock. J. Eng. Geol. 2019, 27, 277–285. [Google Scholar]
  29. Lai, H.P.; Kang, Z.; Xie, Y.L.; Gao, X.P. Study on grouting presupport technology in loess stratum of subway section tunnel. China Railw. Sci. 2014, 35, 47–54. [Google Scholar]
  30. Liang, Q.; Liu, J.; Wang, J.; Zeng, X.T.; Wu, S.G. Three-dimensional stability of cyclical footage area in tunnel face. KSCE J. Civ. Eng. 2022, 26, 955–965. [Google Scholar] [CrossRef]
  31. Anagnostou, G.; Serafeimidis, K. The dimensioning of tunnel face reinforcement. In Underground Space—The Dimension of Metropolises, Proceedings of the 33rd ITA-AITES World Tunnel Congress, Prague, Czech Republic, 5–10 May 2007; Taylor & Francis: Abingdon, UK, 2007. [Google Scholar]
  32. Oggeri, C.; Ova, G. Quality in Tunnelling. Tunn. Undergr. Space Technol. 2004, 19, 239–272. [Google Scholar] [CrossRef]
  33. Li, D.X.; Wang, E.Y.; Li, Z.H.; Ju, Y.Q.; Wang, D.M.; Wang, X.Y. Experimental investigations of pressure stimulated currents from stressed sandstone used as precursors to rock fracture. Int. J. Rock Mech. Min. Sci. 2021, 145, 104841. [Google Scholar] [CrossRef]
  34. Li, D.X.; Wang, E.Y.; Kong, X.G.; Ali, M.; Wang, D.M. Mechanical behaviors and acoustic emission fractal characteristics of coal specimens with a pre-existing flaw of various inclinations under uniaxial compression. Int. J. Rock Mech. Min. Sci. 2019, 116, 38–51. [Google Scholar] [CrossRef]
  35. GB 50330-2013; Republic of China Technical Code for Building Slope Engineering. China Construction Industry Press: Beijing, China, 2013.
  36. Chen, Z.; He, P.; Yan, D.M.; Gao, H.G.; Nie, A.X. Upper limit analysis of tunnel face stability under advanced support. Geotech. Mech. 2019, 40, 2154–2162. [Google Scholar]
  37. JTG/T D70-2010; Republic of China Detailed Rules for Highway Tunnel Design. Communications Press: Beijing, China, 2010.
  38. GB 50715-2011; Evaluation Standard of Metro Engineering Construction Safety. The Ministry of Housing and Urban-Rural Development: Beijing, China, 2011.
  39. Jiang, D.M.; Li, X.S.; Wang, Y.X.; Bian, Z.F.; Zhang, J.; Fan, H.P. Coordinating urban construction and coal resource mining based on equilibrium value between coal reserve and land resource in coal cities. Geomat. Nat. Haz. Risk. 2021, 12, 2865–2879. [Google Scholar] [CrossRef]
Figure 1. Schematic diagram of limit equilibrium model: (a) 3D computational model, (b) Plan sketch.
Applsci 12 06656 g001
Figure 2. Schematic diagram of wedge sliding body stress.
Applsci 12 06656 g002
Figure 3. Loosening earth pressure calculation model.
Applsci 12 06656 g003
Figure 4. Schematic diagram of reserved core soil support: (a) Schematic diagram of reserved core soil, (b) Schematic diagram of reserved core soil size.
Applsci 12 06656 g004
Figure 5. Tunnel face stability discrimination and support optimization system.
Applsci 12 06656 g005
Figure 6. Operation flow chart of support optimization system.
Applsci 12 06656 g006
Figure 7. Relationship between stability coefficient (K) and pressure reduction factor (a1) under pipe roofing support.
Applsci 12 06656 g007
Figure 8. Relationship between stability coefficient (K) and grouting depth (Lg) under grouting support.
Applsci 12 06656 g008
Figure 9. Relationships between stability coefficient (K) and cohesion (cg) and grouting filling rate (ζ): (a) 3D distribution cloud map, (b) Relationship between K and ζ, (c) Relationship between K and cg.
Applsci 12 06656 g009
Figure 10. Relationship between stability coefficient (K), bottom width (b1), and top height (h).
Applsci 12 06656 g010
Figure 11. Variation trend in stability coefficient (K) with increasing anchor bolt density.
Applsci 12 06656 g011
Figure 12. Schematic diagram of the underground rail transit tunnel passing through suburban expressway: (a) Satellite terrain map of tunnel, (b) Schematic diagram of tunnel cross-section.
Applsci 12 06656 g012
Figure 13. Calculation interface of the initial status and original design scheme: (a) Calculation interface of initial status, (b) Calculation interface of original design scheme.
Applsci 12 06656 g013
Figure 14. Relationship between stability coefficient (K) and pressure reduction coefficient (a1).
Applsci 12 06656 g014
Figure 15. Relationship between stability coefficient and grouting filling rate: (a) 3D distribution cloud map, (b) Relationship between K and ζ.
Applsci 12 06656 g015
Figure 16. Schematic layout diagram of on-site monitoring plan.
Applsci 12 06656 g016
Figure 17. Variation trend of the cumulative displacement of different monitoring points.
Applsci 12 06656 g017
Table 1. Geometric dimensions and excavation parameters.
TunnelsLeft LineRight LineMiddle Line
Buried depth H (m)16.1316.137.25
Tunnel height D (m)7.117.117.56
Tunnel width B0 (m)7.067.067.06
Upper step height D03.713.713.71
Equivalent width l0 (m)5.805.805.80
Bottom of core soil b1 (m)3.803.803.80
Height of core soil h (m)1.801.801.80
Length of unsupported section Le (m)0.500.500.50
Table 2. Surrounding rock parameters.
Surrounding Rock ParametersArtificial FillSilty ClaySandy Mudstone
Thickness (m)15.10~22.40.40~3.506
Density (kN/m3)171820
Porosity (%)504720
Cohesion (kPa)153060
Internal friction angle (°)203540
Lateral pressure coefficient0.3570.2930.234
Publisher’s Note: MDPI stays neutral with regard to jurisdictional claims in published maps and institutional affiliations.

