Article

Seismic Performance Evaluation of Highway Bridges under Scour and Chloride Ion Corrosion

1
Key Laboratory for Old Bridge Detection and Reinforcement Technology of the Ministry of Transportation, Chang’an University, Xi’an 710064, China
2
CCCC First Highway Consultants Co., Ltd., Xi’an 710075, China
*
Author to whom correspondence should be addressed.
Appl. Sci. 2022, 12(13), 6680; https://doi.org/10.3390/app12136680
Submission received: 19 May 2022 / Revised: 22 June 2022 / Accepted: 29 June 2022 / Published: 1 July 2022
(This article belongs to the Special Issue Multi-Hazard Analysis of Structures under Wind and Seismic Loads)

Abstract

:
Cross-river bridges located in seismically active areas are exposed to two major natural hazards, namely earthquakes and flooding. As the scour depth increases, more parts of the bridge substructure will inevitably be exposed to unfavorable conditions such as chloride ion ( Cl ) corrosion. To investigate the seismic performance of highway bridges under the action of scour and Cl corrosion, a spatial finite element dynamic model of a continuous rigid bridge was established and a Cl -accelerated electrochemical corrosion test and quasi-static test were carried out. The results showed that a reasonable scour depth and the combination sub-factors under the joint probability density of scour action and seismic action can be obtained to establish the combined expression of the action effect. Cl corrosion can cause a reduction in displacement ductility, load-bearing, and energy dissipation capacity, and increase inequivalent viscous damping coefficient of the columns. Seismic damage of the columns grows linearly to twice the ultimate displacement under Cl corrosion, which becomes more significant with the increase of the reinforcement ratio.

1. Introduction

Bridges play an important part in the road network and are vulnerable to damage caused by earthquakes, hurricanes, and scour and vessel collision [1]. Effects of various hazards were separately considered in the traditional design of bridge structures, which ignored the interaction of different hazards [2]. In recent years, a large number of bridges have collapsed as a result of the combination of multiple or successive disasters, showing the shortcomings of traditional bridge design methods for meeting the design needs of bridge structures in multi-hazard conditions [3]. The design of structures under multi-hazard conditions involves consideration of the uncertainty between structural capacity and demand and the balance between reliability and cost [4,5]. Therefore, it is of great theoretical significance and value of application to improve the capacity of bridges in terms of comprehensive disaster prevention and mitigation at the level of design, reduce the risk of catastrophic damage to bridges, and establish a reasonable design method for bridges under multi-hazard effects.
Earthquake and scours are two common natural disasters that easily lead to bridge damage and destruction [6,7]. Several procedures for seismic analysis of bridges have been developed in recent years to realize the seismic risk evaluation and damage control [8,9,10]. Especially in soft soil sites where pile foundations of the bridge are less able to resist horizontal loads, lateral restraint of soil on pile foundation is weakened due to scour. The pile foundation can be changed from capacity-protected element to failed element by factors such as sand liquefaction under seismic action, which may result in the transfer of damage from the assumed plastic hinge area on the pier to pile foundation. The failure probability of bridges crossing rivers in seismic zones may increase further as the depth of scour at the foundation changes, at which point the seismic damage pattern of the bridge needs to be re-evaluated [11,12]. It is essential to establish a framework of risk-based research that considers the combined hazards of earthquakes and scours. In addition, the increasing depth of the scour will result in more parts of the bridge substructure elements being exposed to adverse environmental conditions. As the service life of the structure grows, especially in coastal areas, saline areas, and areas with extensive utilization of de-icing salts, corrosion of reinforcements in piers can occur due to the primary cell reaction caused by chlorine salts. The spalling of the protective layer of concrete easily happens owing to the resulting rust swelling which will further accelerate the rate of corrosion of internal reinforcement. As a result, a significant deterioration in seismic performance of bridge piers can be induced. Hence, it is of great theoretical importance to study the seismic performance of bridge structures crossing rivers in earthquake zones under the action of scour and Cl corrosion.
Zhou [13] provided a systematic discussion on the method for solving failure probability of bridges with high pile bearing system under the combined effect of two extreme loads by means of the theory of multi-hazards and full probability. You et al. [14] studied the effect of scour on seismic failure probability of bridges and analyzed the seismic losses of bridges at a defined scour depth from an economic point of view. However, the probability of failure under combined scour and seismic action was not considered. Prasad et al. [15] investigated the seismic fragility curves of bridge piers under different scour conditions, while no consideration was given to the seismic fragility of pile foundations under scour action. Wang et al. [16] analyzed the failure probability under combined action of scour and earthquake by taking bridge columns and pile foundations as the object of study. It was concluded that scour action is beneficial to the seismic resistance of bridge column members, while increasing the seismic failure probability of pile foundation members. However, the relationship between scour depth and failure probability of the component has not been determined. Yang et al. [17] proposed a model of failure probability under combined action of scour and earthquake. The values of reasonable scour depth and combination subfactors of scour action were discussed. However, the coefficients were not based on the target reliability index and could not strictly provide guidance on seismic design of bridges from the perspective of a full probability limit-state design.
Extensive research has been carried out to address the issue of seismic performance degradation of reinforced concrete bridge columns due to Cl corrosion. In a comparison of the contribution of concrete carbonation and reinforcement corrosion due to Cl to the structural failure probability of bridges in a marine environment, Zhao [18] found that the failure probability due to Cl corrosion is much greater than that due to concrete carbonation. Liu [19] found that the corrosion of transverse hoop rebars is greater than that of longitudinal rebars in concrete structures under Cl corrosive condition, especially at the junction of longitudinal and transverse rebars where the hoops were severely corroded or even fractured. It is inevitable to lead to the reduction or even loss of the restraint effect on core concrete which in turn results in a decrease in the ductile properties of structural elements. Zhang et al. [20] investigated the effect of hoop corrosion on axially compressed concrete members. The test results showed that the load-carrying capacity and deformation capacity of restrained concrete decreased significantly with the increase of hoop corrosion. Zhang et al. [21] conducted tensile tests on nearly 300 rusted rebars from different sources to obtain their mass rust rate and ultimate tensile rate. The variation law of reinforcement strength with increasing corrosion rate was obtained and the stress–strain relationship of rusted reinforcement was proposed. Ou et al. [22,23] investigated the tensile properties of naturally and artificially corroded rebars as well as the effect of different sites on seismic performance of reinforced concrete beams. The experimental results showed that corrosion of longitudinal tensile rebars has significant adverse effects on yield displacement, yield load, and peak load, the corrosion of longitudinal compressive rebars has adverse effects on yield displacement, and the corrosion of transverse rebars has negative effects on yield displacement and ultimate displacement when the damage mode is bending-shear damage. Simon et al. [24] investigated the effect of discounted cross-sectional area of rebars and cracking of concrete protective layer on the degradation of strength and stiffness of bridge columns. Ghosh and Padgett [25] researched the corrosion of bridge columns and established a curve of time-varying vulnerability for bridge components. Biondini et al. [26] studied the variation law of seismic performance of reinforced concrete bridge columns in corrosive conditions throughout their service cycles from a probabilistic perspective. It was concluded that the decay of seismic performance of bridge columns in corrosive conditions has a significant effect on its seismic response. Guo et al. [27] investigated the degradation of the performance of offshore columns under consideration of Cl corrosion. The time-varying seismic demand and seismic fragility of columns based on time variation during their remaining service life were researched at the same time. Sun et al. [28] found through experiments that the concrete damage thickness and the degree of matrix damage increased with the number of wet and dry cycles growing.
In this study, the judgement of the seismic damage mode of bridges and the determination of the location of the critical section under certain scour depths were investigated by taking the full bridge model including pile foundation as the study object. The failure probability of bridges at different scour depths was calculated by the direct integration method [29]. The nonlinear relationship between failure probability and scour depth was fitted. Based on the function of joint probability density of scour and seismic action, the reasonable scour depth and scour action subfactor of the joint action were determined. In addition, to investigate the effect of material deterioration on the seismic performance of bridges for the purpose of improving the theory of seismic performance of piers under Cl corrosion, Cl electrochemical erosion tests on three reinforced concrete column specimens under dry and wet cycles for 30 days were conducted. After the corrosion test, the pseudo-static test was carried out to study the effect of Cl corrosion on seismic performance of the reinforcement and concrete materials as well as the column specimens.

2. Earthquake and Scour Combination in the Failure Probability of Bridge

2.1. Calculation of Seismic Failure Probability of Bridges at Different Scour Depths

According to the distribution of scour depth, the full bridge model under different scour depths was established by finite element (FE) software, in which the nonlinear interaction between piles and soil was simulated by method of p-y curve [30]. IDA was carried out to determine the critical component and failure modes of bridge structure under seismic load by a set of steps including selecting 48 earthquake ground motions randomly according to the site type, adjusting the ground motion parameters within an appropriate range, and inputting them into the FE model. Combined with the resistance model of structure, the state equation was established to calculate failure probability and reliability index of the structure through the method of direct integration. The state equation, failure probability, and the reliability index of the structure only can be determined in relation to the actual parameters of the practical project. In order to illustrate the above-mentioned methodology more clearly, an application for a practical project is provided in Section 2.2 for the reader’s reference.

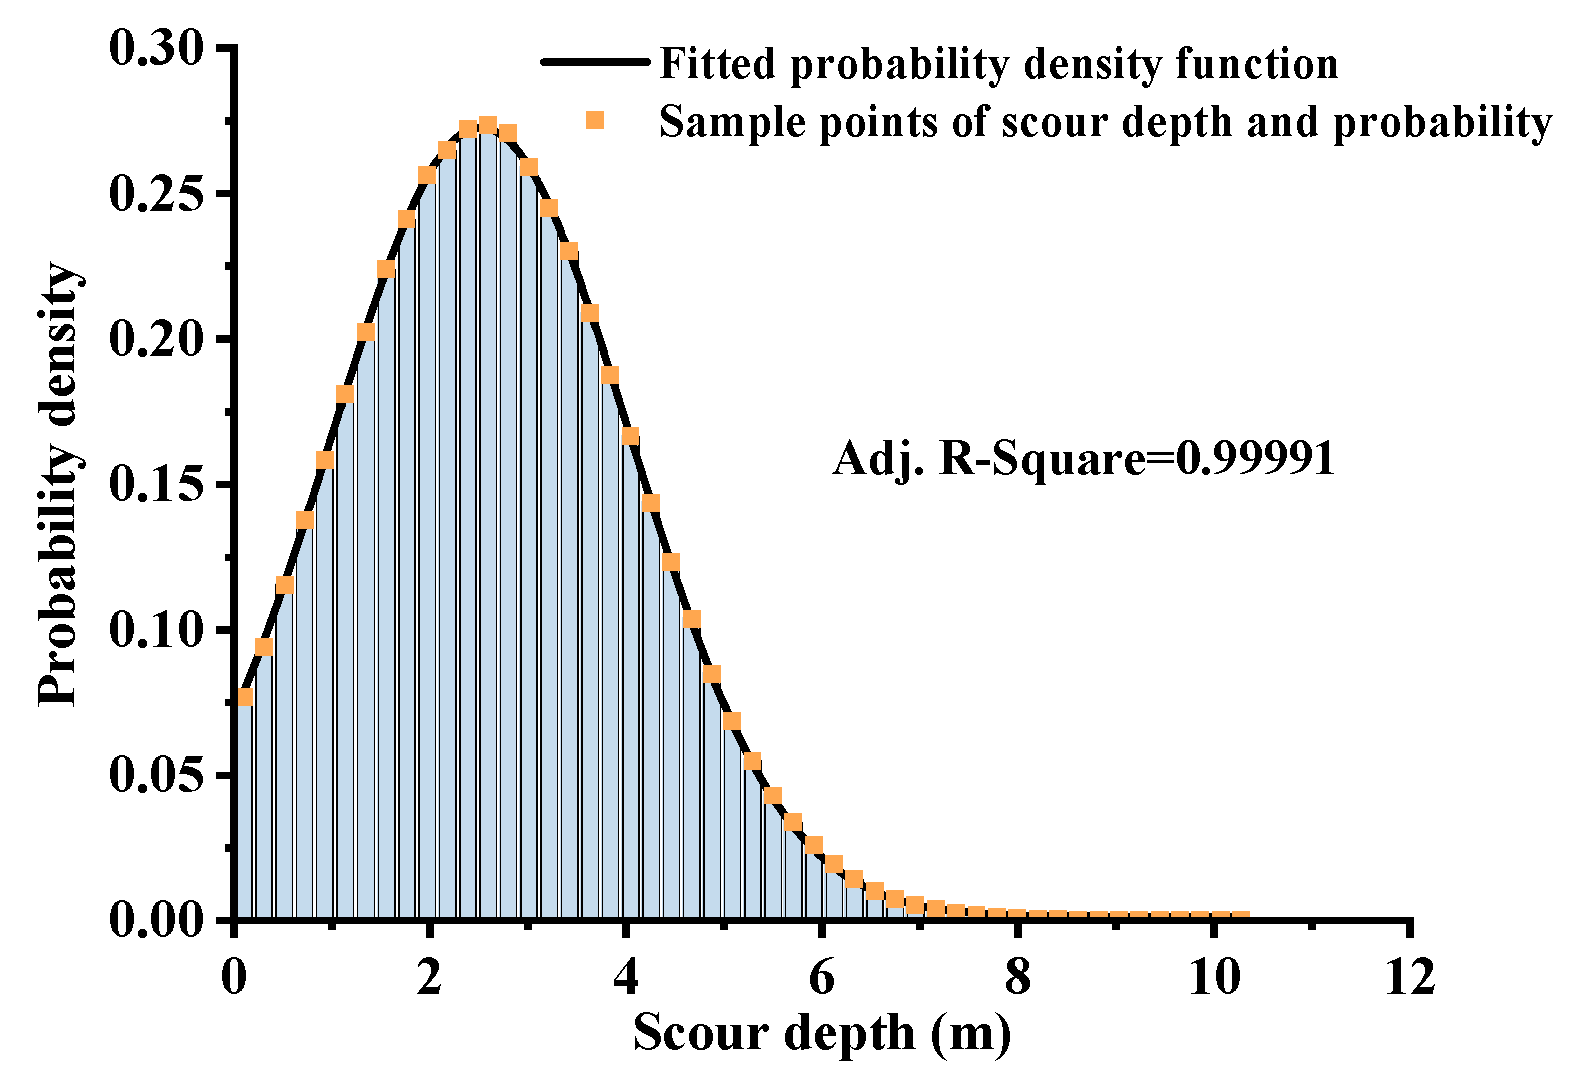
2.1.1. Scour Depth Distribution

The calculation formula of scour depth in HEC NO.18 [31] of the Federal Highway Administration is adopted taking the correction of Johnson et al. [32] into consideration, which is as follows.
H = 2 λ s y 0 K 1 K 2 K 3 K 4 ( D P y 0 ) 0.65 F r 0.43
where H is scour depth; λ s is the correction factor for scour depth; K 1 ~ K 4 are correction coefficients considering the shape of pile foundation, the direction of water flow, the condition of the river bed, and the particle size of material in the river bed, respectively; D P is the width of the pile foundation perpendicular to the direction of water flow; y 0 is the water depth; and F r is the Froude number, which is determined as follows.
F r = ν ( g y 0 ) 0.5
where ν is the flow velocity, which can be obtained from the size and flow of the river section; and g is gravitational acceleration.
Johnson et al. interpreted the determination of scour depth distribution and reached the conclusion that the correction coefficient K 1 for the shape of the pile foundation and K 4 for the river bed material both are equal to one. Other parameter models can be achieved for determining the probability distribution of scour depth parameters by referring to the classification and summary of prior art from Yang et al. [17], as shown in Table 1.

2.1.2. Solution of Structural Failure Probability

The distribution of structural resistance can be defined by performing an analysis of bending moment curvature on critical sections through the calculation of the fiber unit [33]. When the distribution function of the seismic effect is certain, the state equation of the structure can be established as
Z = S R
where S is the seismic effect value of the structure; and R is the value of structural resistance.
The absolute failure probability can be calculated by means of direct integration when the distribution of constituent variables in state equation is certain. The solution process is shown in Figure 1. The failure probability P f of the structure is
P f = P ( Z > 0 ) = P ( S > R ) = + F R ( x ) f S ( x ) d x
where P f is the failure probability of the structure; F R ( x ) is the function of resistance distribution; and f S ( x ) is the probability density function of the effect.
The reliability index can be obtained as
β = Φ 1 ( 1 P f )
where β is the reliability index; and Φ 1 ( ) is the inverse function of normal distribution.

2.2. Application for a Practical Project

2.2.1. The Introduction of Bridge Model and the Determination of Scour Depth Distribution

A continuous rigid-frame highway bridge across a river with the over span arranged as 42 m + 76 m + 42 m was taken as an example bridge for simulation. A reinforced concrete box girder was set as the superstructure. A rectangular solid section was adopted for the main piers, whose top section size is 1.8 m × 6.2 m and bottom section size is 1.8 m × 4.5 m. Double-column piers were adopted for transition piers with 1.5 m diameter. The diameter of the pile foundation at the main pier is 2 m and at the transition pier is 1.8 m. Concrete grades of the girder, pile foundation at the main pier, and the main pier adopted C55, C35, and C40, respectively, and reinforcement adopted HRB400. According to the Bridge Code (MOT 2020) for Seismic Design of Buildings: GB50011-2010 [34], the design earthquake is grouped into the first set, seismic fortification category of the bridge site area is Class B, and basic intensity is VIII degree. Forty-eight seismic time-history waves consisting of 24 artificial acceleration time-history waves of Class III site and 24 seismic waves of Class II site from the peer database were chosen as the input of ground motion.
The FE model was established according to the following principles. Spatial beam elements were utilized to simulate girder and pier and shell elements were adopted to simulate bearing platform. The second-phase pavement was equivalently expressed by line load and area load. Rayleigh damping was set in this bridge with a damping ratio of 0.05. The transition pier was equipped with a friction pendulum bearing which can be simplified to a mechanical model with bilinear restoring force. The FE model of the bridge under scour conditions is shown in Figure 2. The dynamic characteristics of the bridge obtained from the FE model are shown in Table 2.
The static p-y curve between pile foundation and soil can be performed in the FE model by nonlinear connection elements which can be deleted to simulate the scour effect on pile foundation. The p-y curve is calculated according to the formula in API specification [35]. P-y curves at different depths within 18 m below the sour line are displayed in Figure 2.
The function of peak ground acceleration (PGA) probability distribution which obeys type II distribution of the extreme value can be obtained by converting the seismic intensity into PGA [36,37,38,39]. The random sample of earthquake intensity was carried out according to its probability distribution to calculate the corresponding cumulative probability density. The corresponding relationship between a set of PGA and its cumulative probability density can be obtained by converting seismic intensity into PGA, which can be fitted and derived to acquire the probability distribution function of PGA in any design reference period. The formula is as follows.
F t ( a ) = exp [ t 50 ( a 0.06735 ) 1.945 ]
where F t ( a ) is the probability distribution function of PGA; t is the design reference period of bridge; and a is the value of PGA.
The PGA distribution for the input parameter of ground motion is displayed in Figure 2.
The river spanned by the example bridge has water all year and is characterized by rapid rise and fall. River scouring mainly occurred at the pile foundation of the No. 1 main pier. With reference to the geological and hydrological report of the area where the bridge site is located and the Monte Carlo method [40,41], parameters in the above formula for calculating the scour depth can be determined. A large number of random samples were taken according to the distribution shown in Table 1 and the value of probability density corresponding to each refinement interval could be acquired by extracting and refining those sample values. The value of probability density and the scour depth were nonlinearly fitted in accordance with Gaussian distribution. The correlation coefficient was 0.99991, which is close to 1, indicating that the nonlinear fitting has satisfactory reliability. The specific data are shown in Figure 3.
The probability density function of the scour depth after fitting is
f H ( H ) = 5.99841 E 4 + 1.04516 3.06402 π 2 e 2 ( x 2.53013 3.06402 ) 2

2.2.2. Determination of the Critical Section of Members and Structural Failure Mode

In comparison with the fragility analysis of the No. 1 pile foundation, the No. 2 pile foundation, and pier components under combined action of scour and earthquake, pile foundation components were identified as risk analysis objects by extracting the average response of the component section along different directions at different scour depths when the basic PGA was equal to 0.2 g.
Although pile group foundations have the same section and material in general, which leads to the similar section resistance, the response under the combined action of earthquake and scour is quite different. Hence, the No. 1 pile foundation and No. 2 pile foundations were selected as the analysis objects to determine the one suffering the most unfavorable forces.
It can be observed from Figure 4, Figure 5, Figure 6, Figure 7, Figure 8 and Figure 9 that the seismic effect of the No. 1 pile foundation under combined action along longitudinal and transverse directions was both higher than that of the No. 2 pile foundation, which renders the No. 1 pile foundation the component for failure probability analysis due to its more disadvantageous stress state under the combined action of earthquake and scour. The response of the No. 1 pile foundation along transverse and longitudinal directions of the bridge at different scour depths was calculated under the corresponding time history of seismic peak acceleration which took 0.2 g, 0.4 g, and 0.6 g as the representative values. The maximum value of the response was extracted at the same time. The specific data are shown in Figure 10, Figure 11, Figure 12 and Figure 13.
Through the comparison of the capacity–demand ratio in the bending moment of pile foundation along the above two directions, it can be found that the pile foundation was in a more unfavorable stress state under the combination of seismic load input transversely and dead load, which caused the flexural failure of the pile foundation along the transverse direction as the determination of failure mode.

2.2.3. IDA Analysis under the Combined Action of Earthquake and Scour

After the determination of failure component, failure mode, and the position of the critical section under the combined action of earthquake and scour, the selected PGA was input as the ground motion parameter into the established FE model of the example bridge under different scour depths. To ensure that the relationship between PGA and seismic response can be reflected accurately, 0.1–0.5 g was selected as the variation range of PGA with 0.05 g as the step size, which can guarantee the bridge structure to enter failure stage under seismic action so as to obtain the failure probability under the combined action of scour and earthquake. Amplitude modulation of PGA for 48 seismic ground motions were implemented in accordance with the above range and step size in order to carry out IDA analysis [42,43,44], as shown in Figure 14. The average values of the maximum bending moment of pile foundation under different seismic waves and different scour depths were extracted, as shown in Figure 15. It can be concluded that the bending moment of the pile foundation increased rapidly with the growth of scour depth and the speed at which the pile section enters plastic state improved with raising PGA. It proved the weakening effect of soil restraint on pile foundation due to the action of scour, which results in an increase of seismic vulnerability of the pile foundation components.

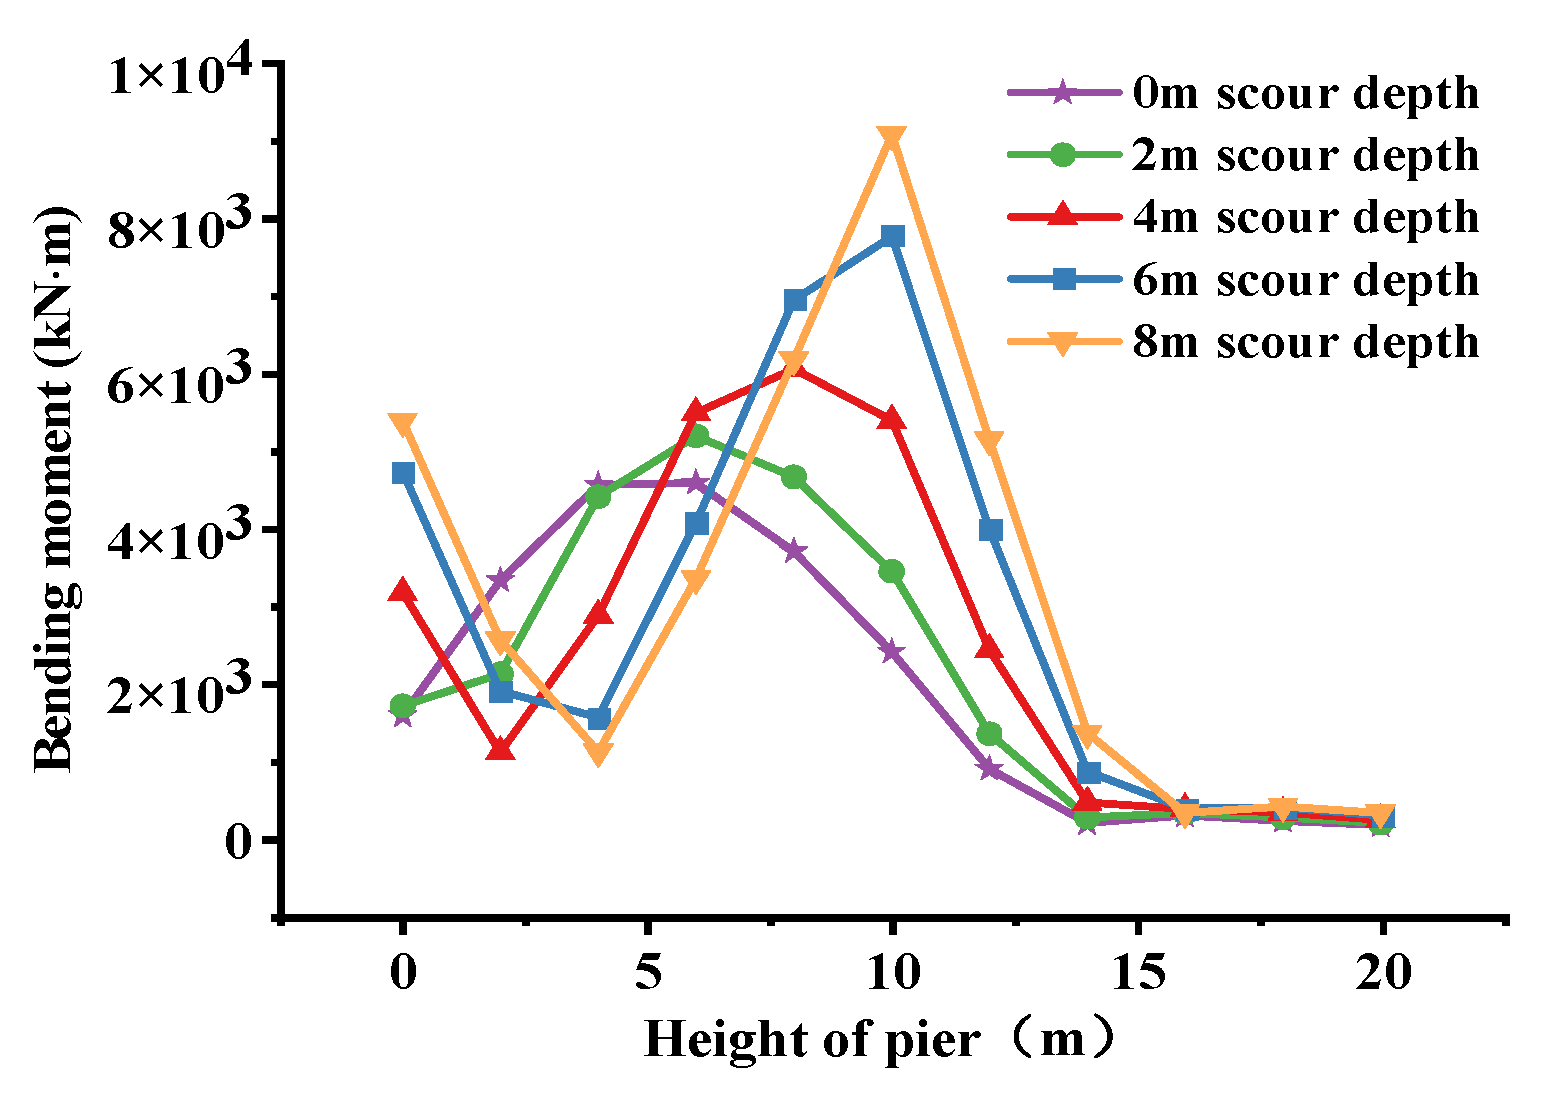
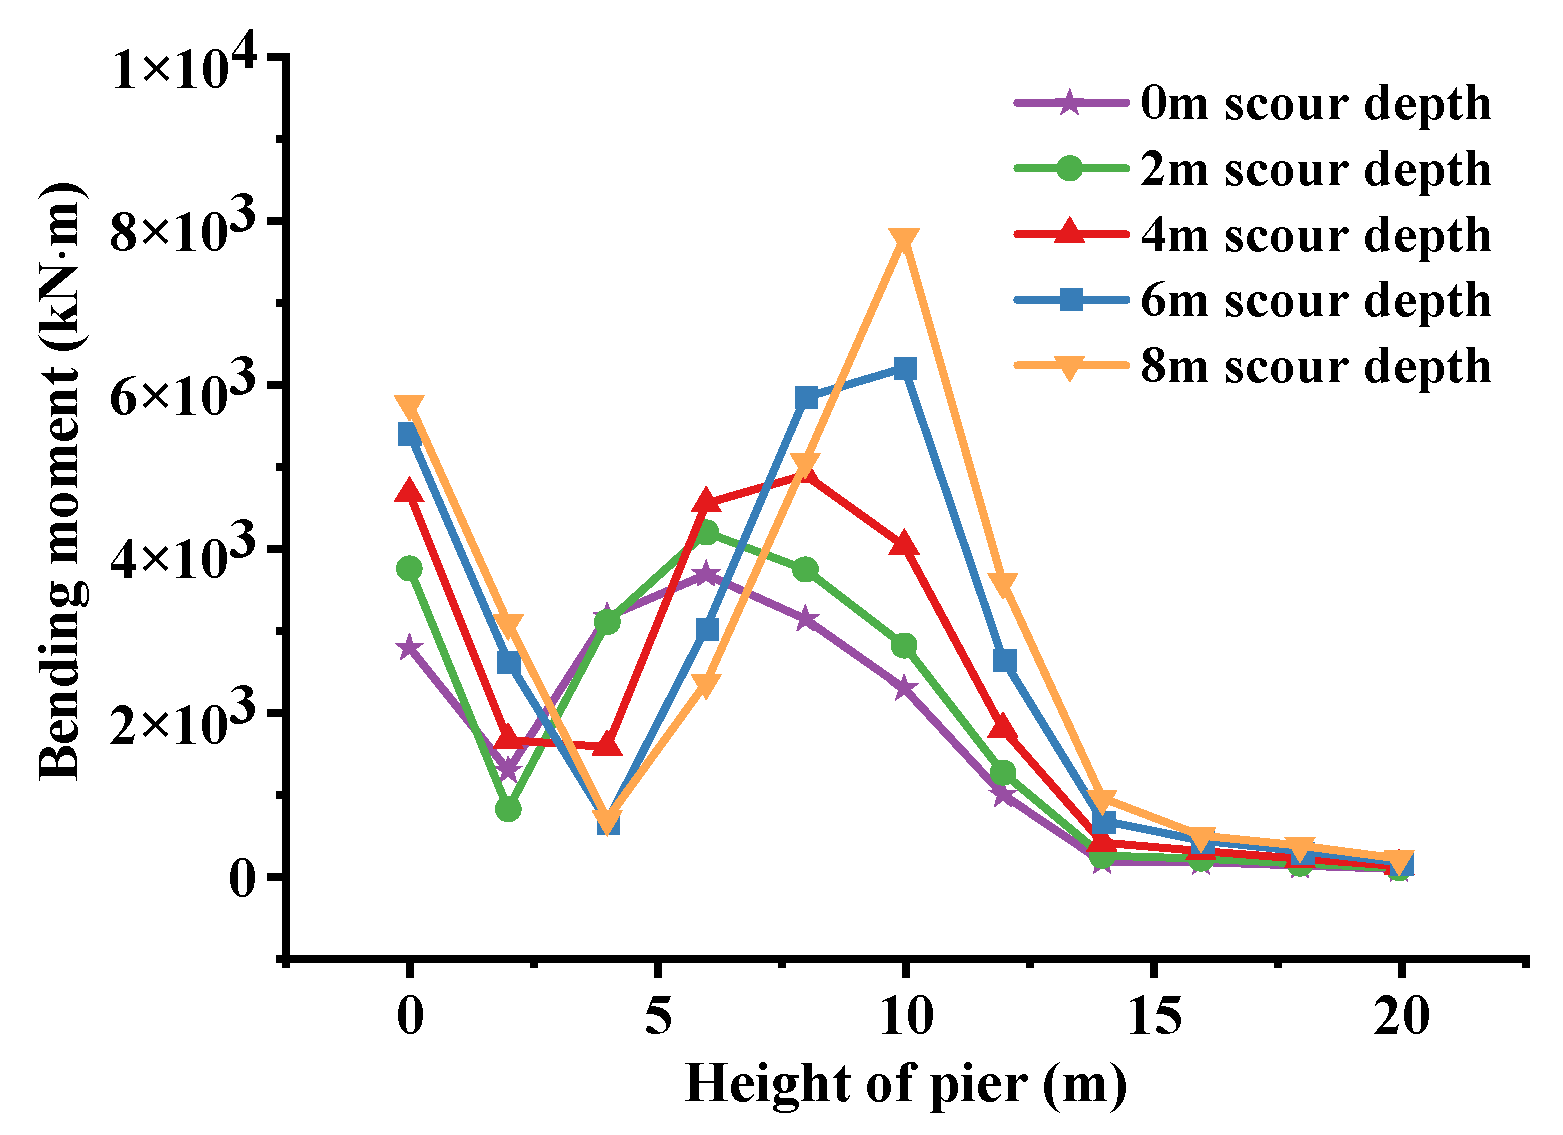
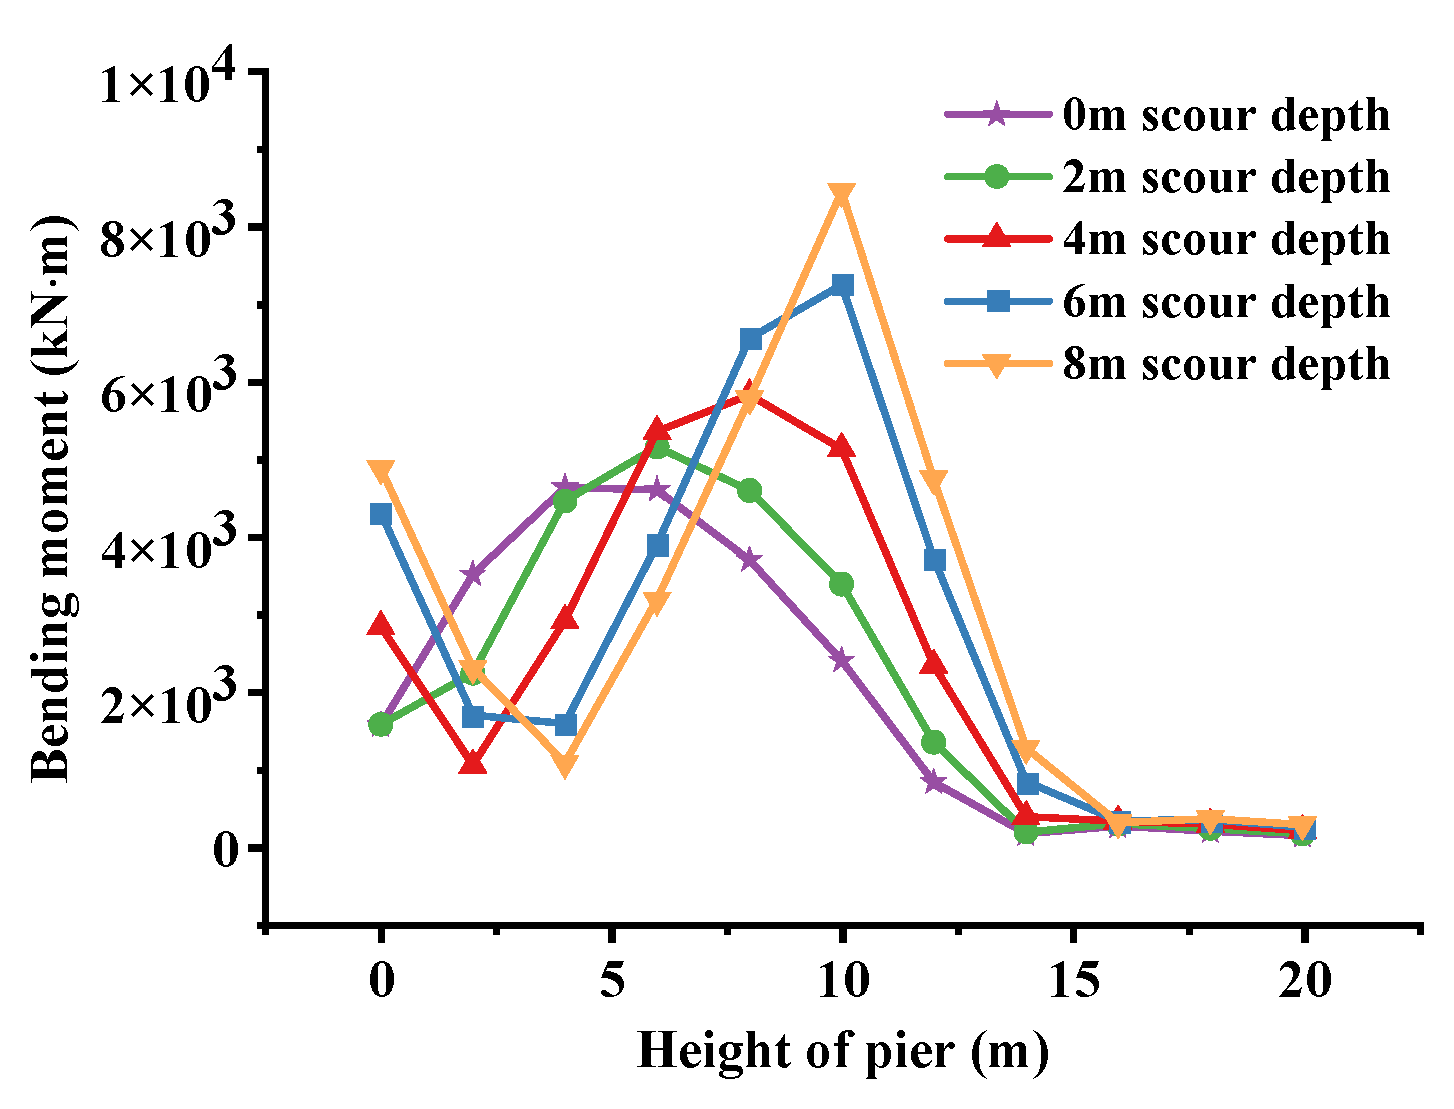
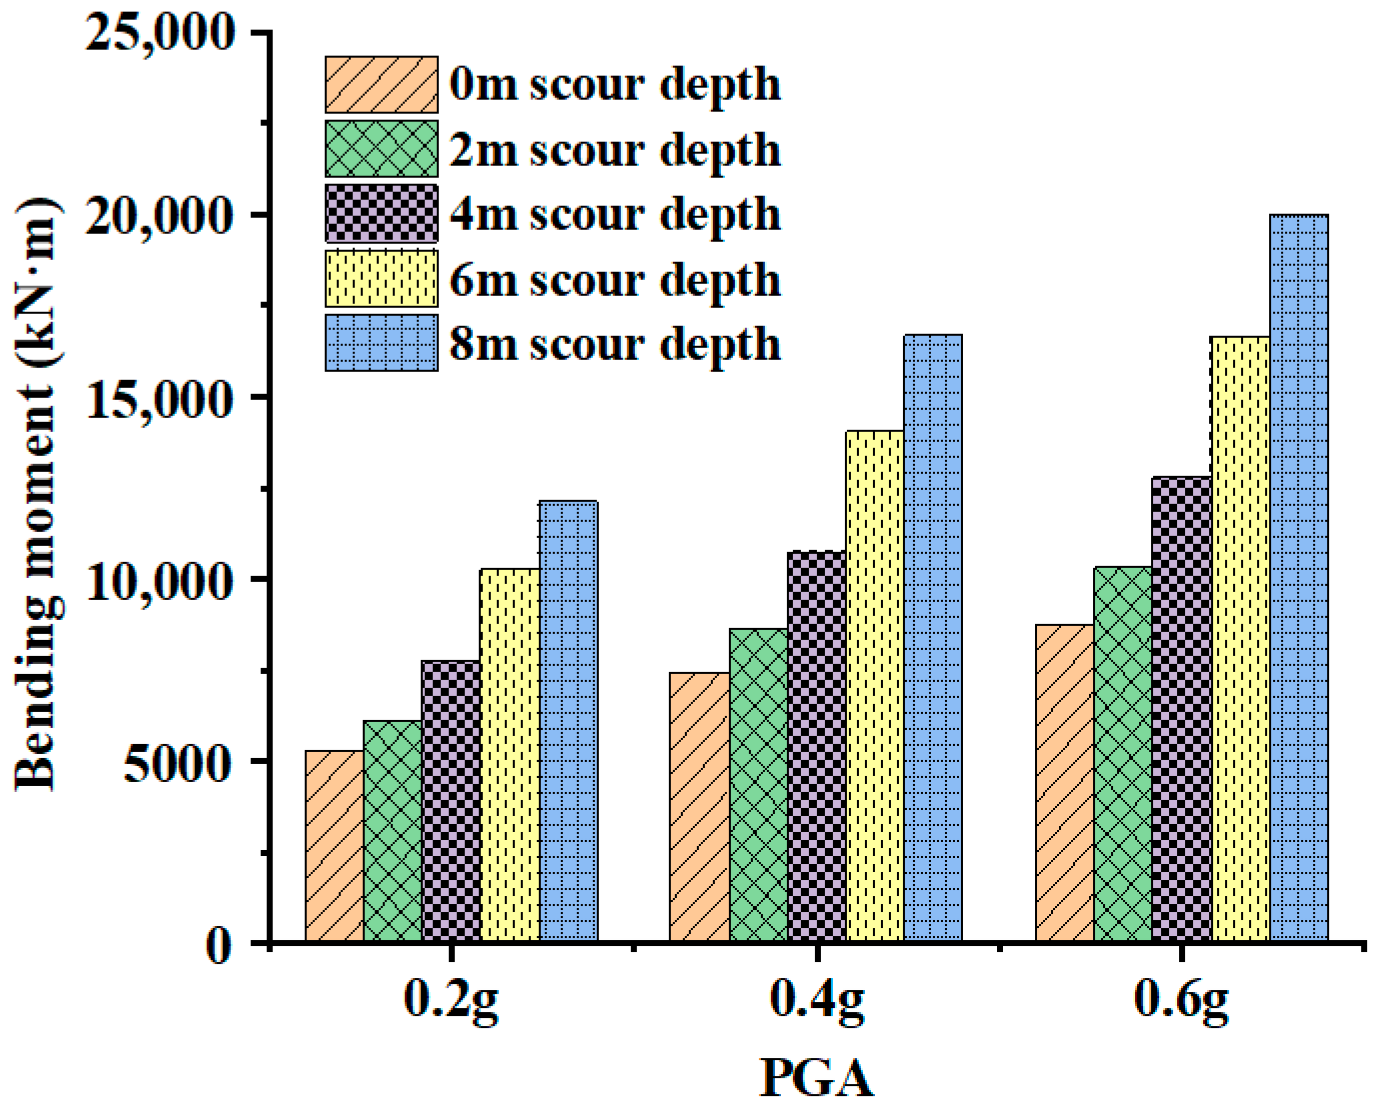
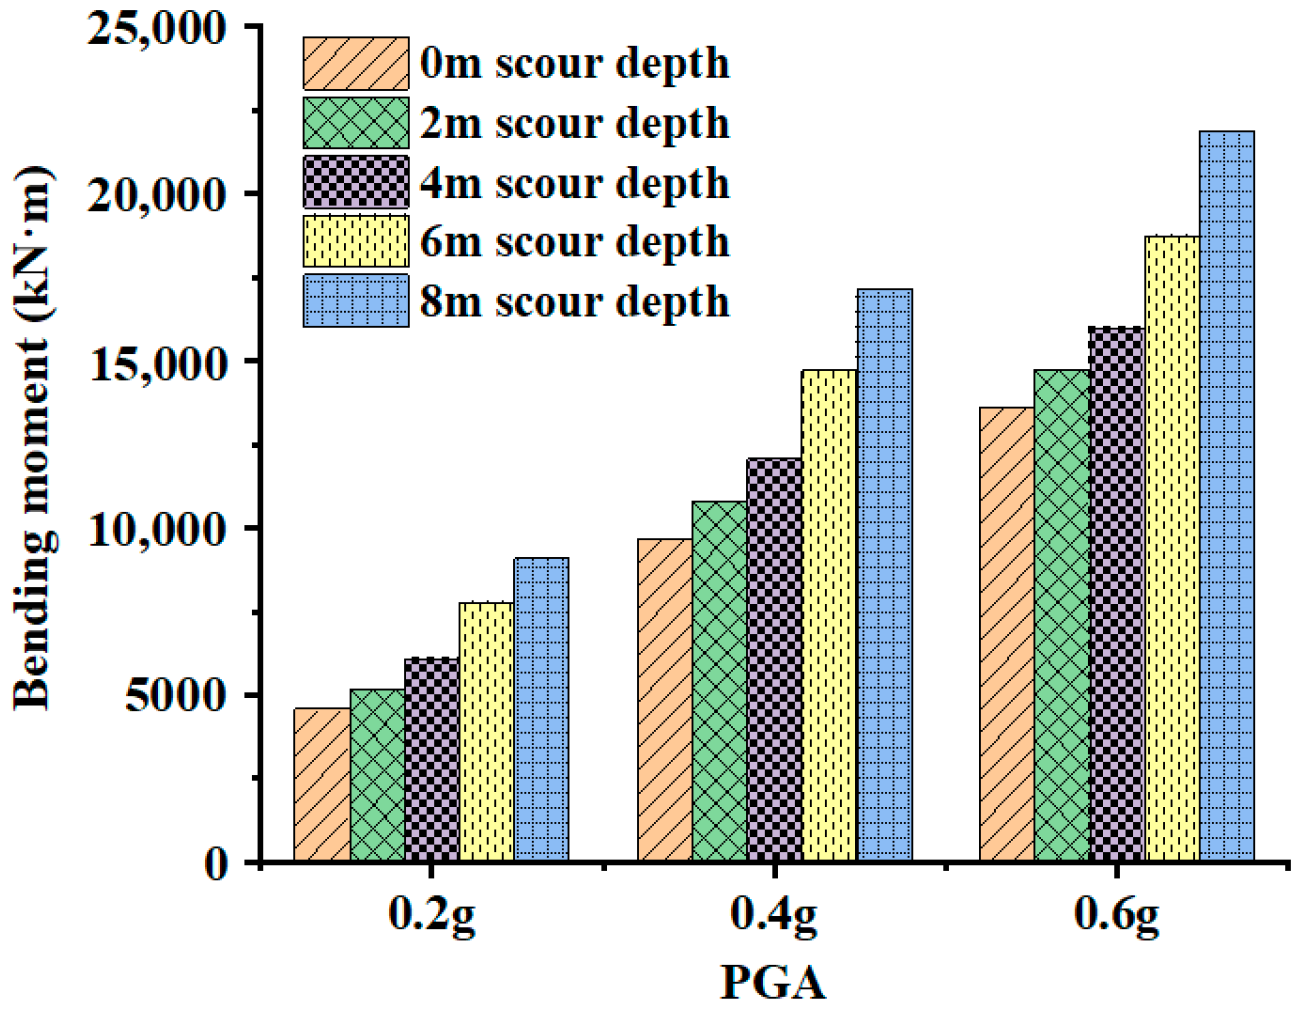
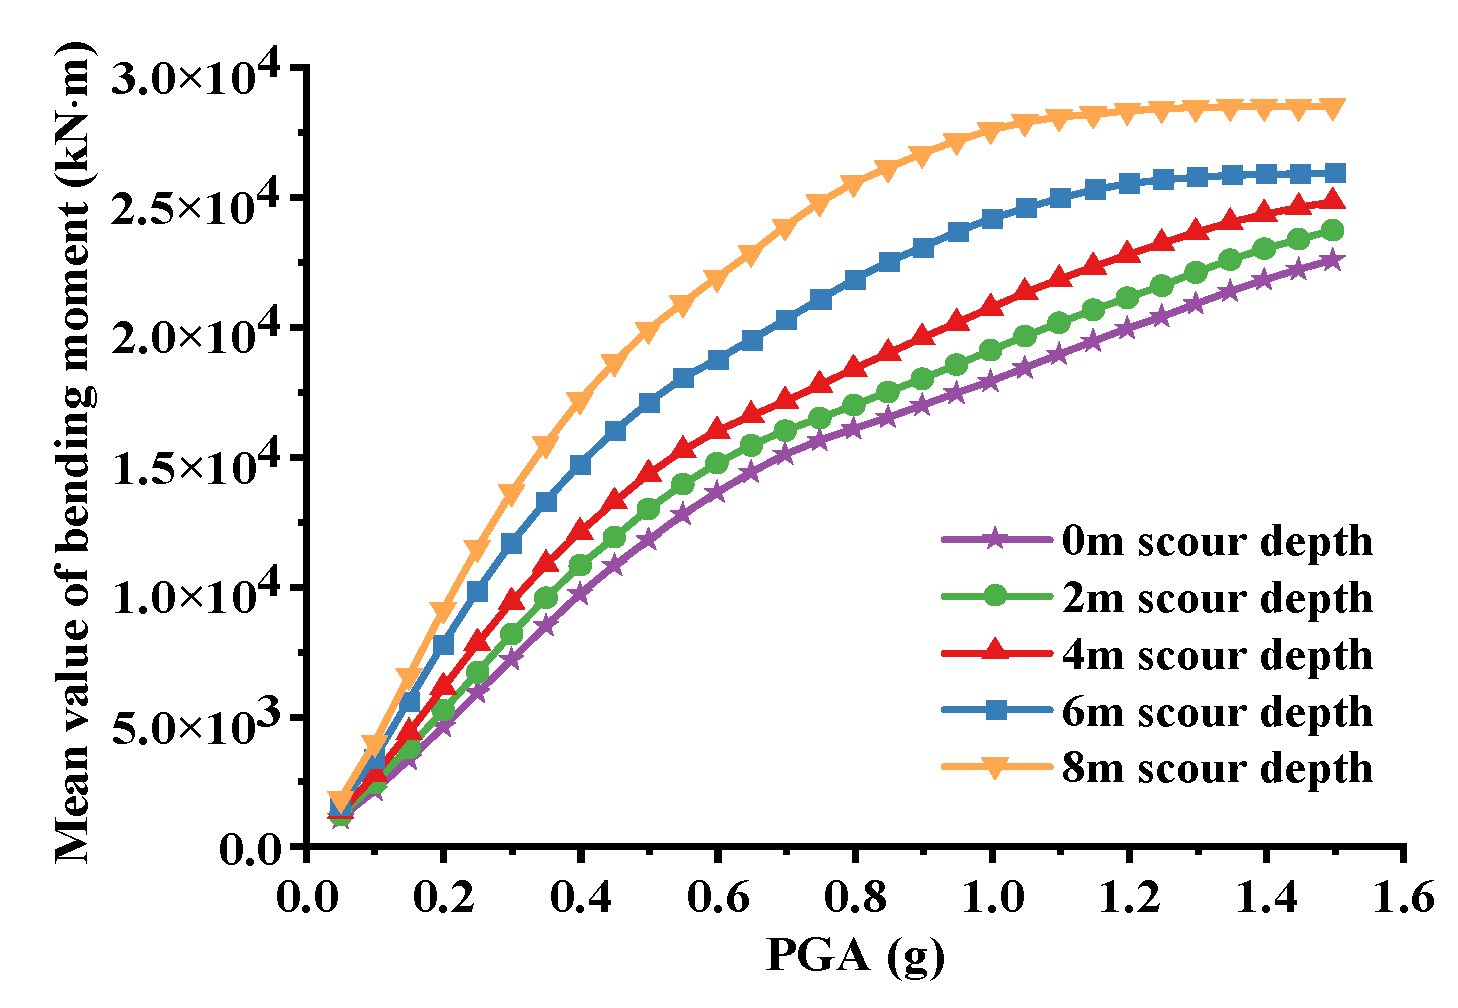
2.2.4. Determination of the Distribution of Seismic Bending Moment under Scour Conditions

The function of cumulative probability density for seismic effect under scour conditions can be determined from the statistical data on mean seismic bending moment and the results of the distribution of PGA cumulative probability density. The curve derived from the function of cumulative probability density for seismic effects under different scour conditions can be determined by non-linearly fitting the sample points of cumulative probability density to the effect of the seismic moment obtained from the values of the bending moment response at different scour depths and from the statistics of corresponding probability density, as shown in Figure 16. On this basis, the distribution function of the cumulative probability density of the bending moment at different scour depths under seismic action can be fitted, which leads to the access to the probability density function of the seismic effect at different scour depths.

2.2.5. Distribution Function of Structural Resistance

The moment–curvature curve of the pile foundation section can be obtained by inputting average axial force under seismic load into the fiber model of the pile foundation section. The standard value of the moment resistance limitation of the pile section was obtained by the analysis of the moment–curvature curve as
R kH = R kS = 27 , 360   kN · m
where R kH , R kS are the standard value of the moment resistance limitation for the pile foundation in the transverse and longitudinal directions, respectively.
The distribution parameters of pile section resistance are available in Table 3 [45].

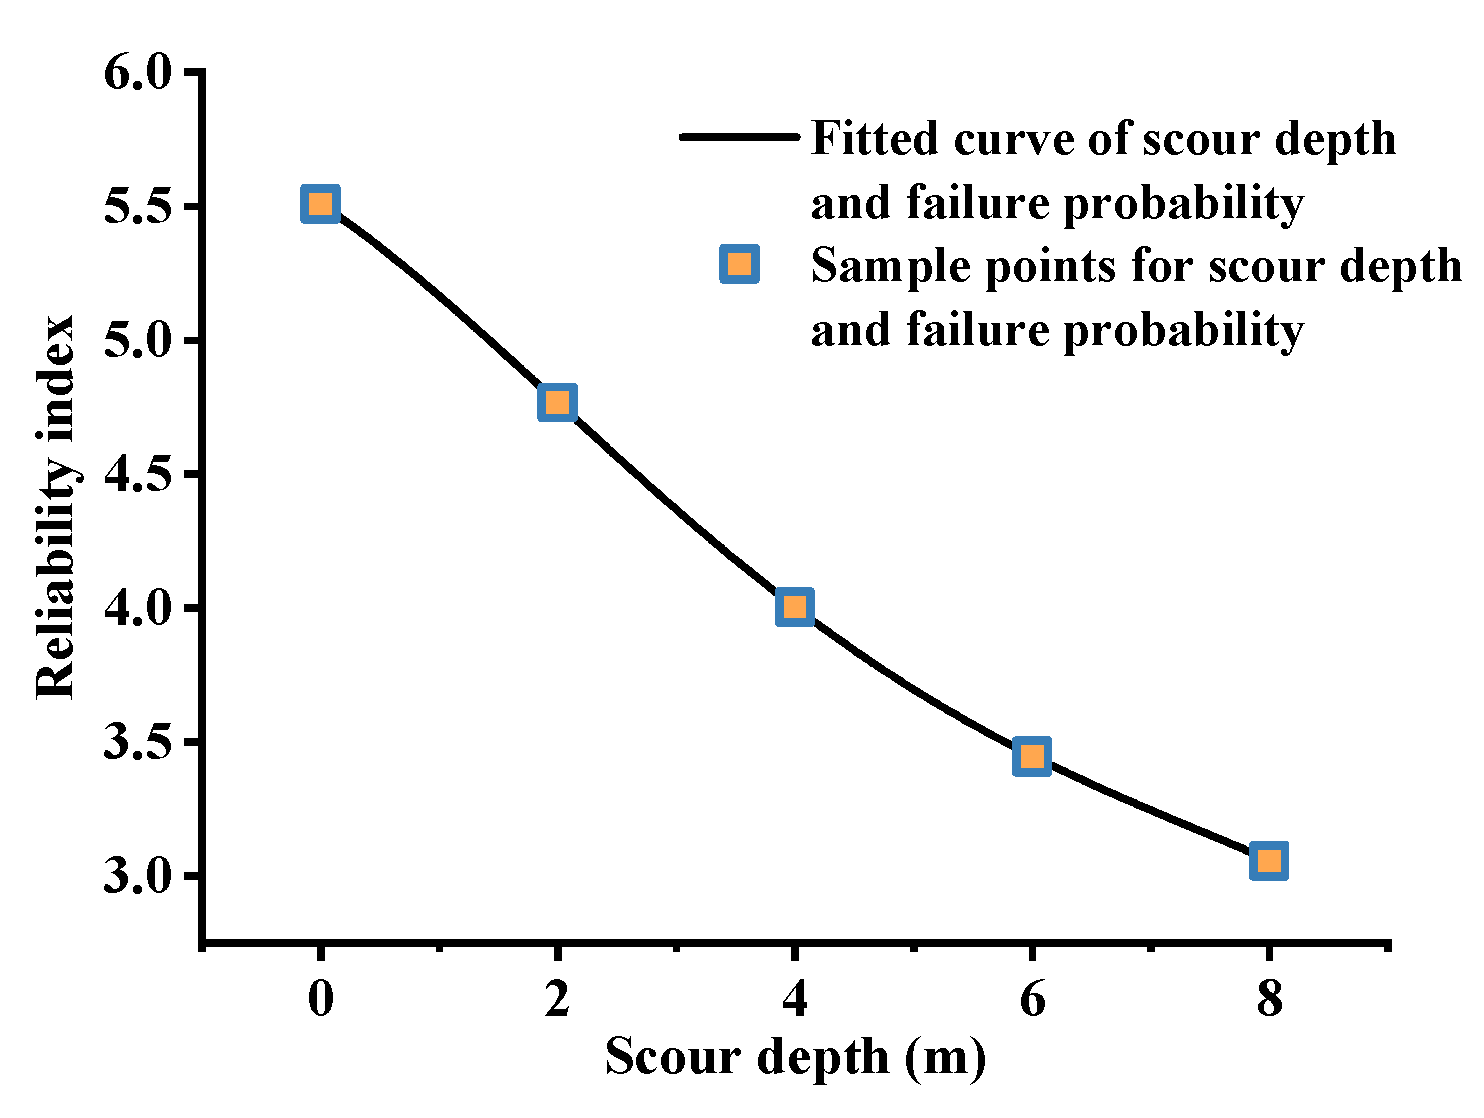
2.2.6. Solution of Structural Failure Probability and Reliability Index

When the distribution function of seismic effect and the distribution of the sectional resistance of the pile foundation under different scour depths were identified, the failure probability and reliability index of the pile foundation could be precisely calculated by means of direct integration. The failure probability is as follows.
P f = P ( S > R ) = + F R ( x ) f S ( x ) d x = + [ 1 F S ( x ) ] f R ( x ) d x
where F S ( x ) is the distribution function of the seismic effect; f R ( x ) is the function of resistance probability density.
The solution of the above integral makes the data on failure probability and the reliability index of pile foundation elements under seismic action in the condition of different scour depths accessible, which were non-linearly fitted, respectively, to determine the failure probability of pile foundations suffering from seismic action under different scour conditions, as shown in Figure 17 and Figure 18. It can be observed that the failure probability climbed with the increase of scour depth while the reliability index declined, both indicating that the seismic performance of the pile foundation will weaken due to scour action.
The fitted nonlinear relationship between the scour depth and reliability index is
β ( H ) = 5.5094 0.29362 H 0.06214 H 2 + 0.01315 H 3 6.98177 E 4 H 4
The nonlinear relationship between the scour depth and failure probability is
P f ( H ) = 1 Φ ( β ( H ) )
where β ( H ) , P f ( H ) are the reliability index and the function of failure probability, respectively, with respect to the scour depth H ; Φ ( · ) is the function of standard normal distribution.
The joint probability density between the scour depth and seismic action is calculated and the average failure probability under the joint probability density is solved as
P f ¯ = 0 H m a x f H ( H ) P f ( H ) d H
where f H ( H ) is the function of probability density related to scour depth H ; P f ( H ) is the failure probability corresponding to scour depth H .
The integration of the above equation gives the expression of average failure probability as
P f ¯ = 9.79 × 10 5
The failure probability is converted into the reliability indicator as
β ¯   =   3.7244

2.2.7. Determination of Combined Partial Coefficient of Scour Action

The reasonable scour depth H for the joint probability density between scour depth and seismic action were both found to be 4.89 m when the average failure probability and the average reliability index were substituted into the fitted non-linear relationships between the scour depth and failure probability and between the scour depth and reliability index, respectively, which verified the sufficient credibility of both non-linear relationships. According to the probability distribution of scour depth, 98% quantile value in the cumulative probability density distribution of the maximum scour depth at a 100-year design reference period was taken as the design value of scour depth, which equaled 6.15 m [16]. The combinatorial coefficient of scour action was defined as the ratio of reasonable scour depth corresponding to the average failure probability under combined action of scour and earthquake to design value of the scour depth during the design reference period, which is derived as
γ S = H ¯ H d = 4.89 6.15 = 0.795
where H ¯ is the reasonable scour depth corresponding to the average failure probability under the combined action of scour and earthquake; H d is the design value of the scour depth during the design reference period.
Further, the combined expressions for effects of the combined action between earthquake and scour can be developed as
S d = S G k + S A Ek ; 0.795 H d
where S d is the design value of the combined effect; S G k is the standard value for the effect of the dead load effect; S A Ek is the standard value of the seismic effect.

2.2.8. Optimal Resistance Value under the Combined Partial Coefficient of Scour Action

The safety grade of the example bridge is the first class and the target reliability index under ductile damage is 4.7. The mean value of resistance models of the structure was multiplied by an amplification factor to achieve the optimal resistance value [46]. The failure and the reliability of resistance models with different amplification factors were solved separately by means of direct integration. It is concluded that the reliability index at the amplification factor equal to 1.2 is the target reliability index. The optimum value of resistance under the target reliability index was identified through the analysis of failure probability under combined seismic and scour conditions with the coefficients of scour action. It is instructive for the design of dimensions and reinforcement ratio of bridge substructure under combined seismic and scour conditions to assure that the bridge structures can withstand extreme loads in the most economical manner with the failure probability in an acceptable range.

3. Effect of C l Corrosion on the Seismic Performance of Bridge Column

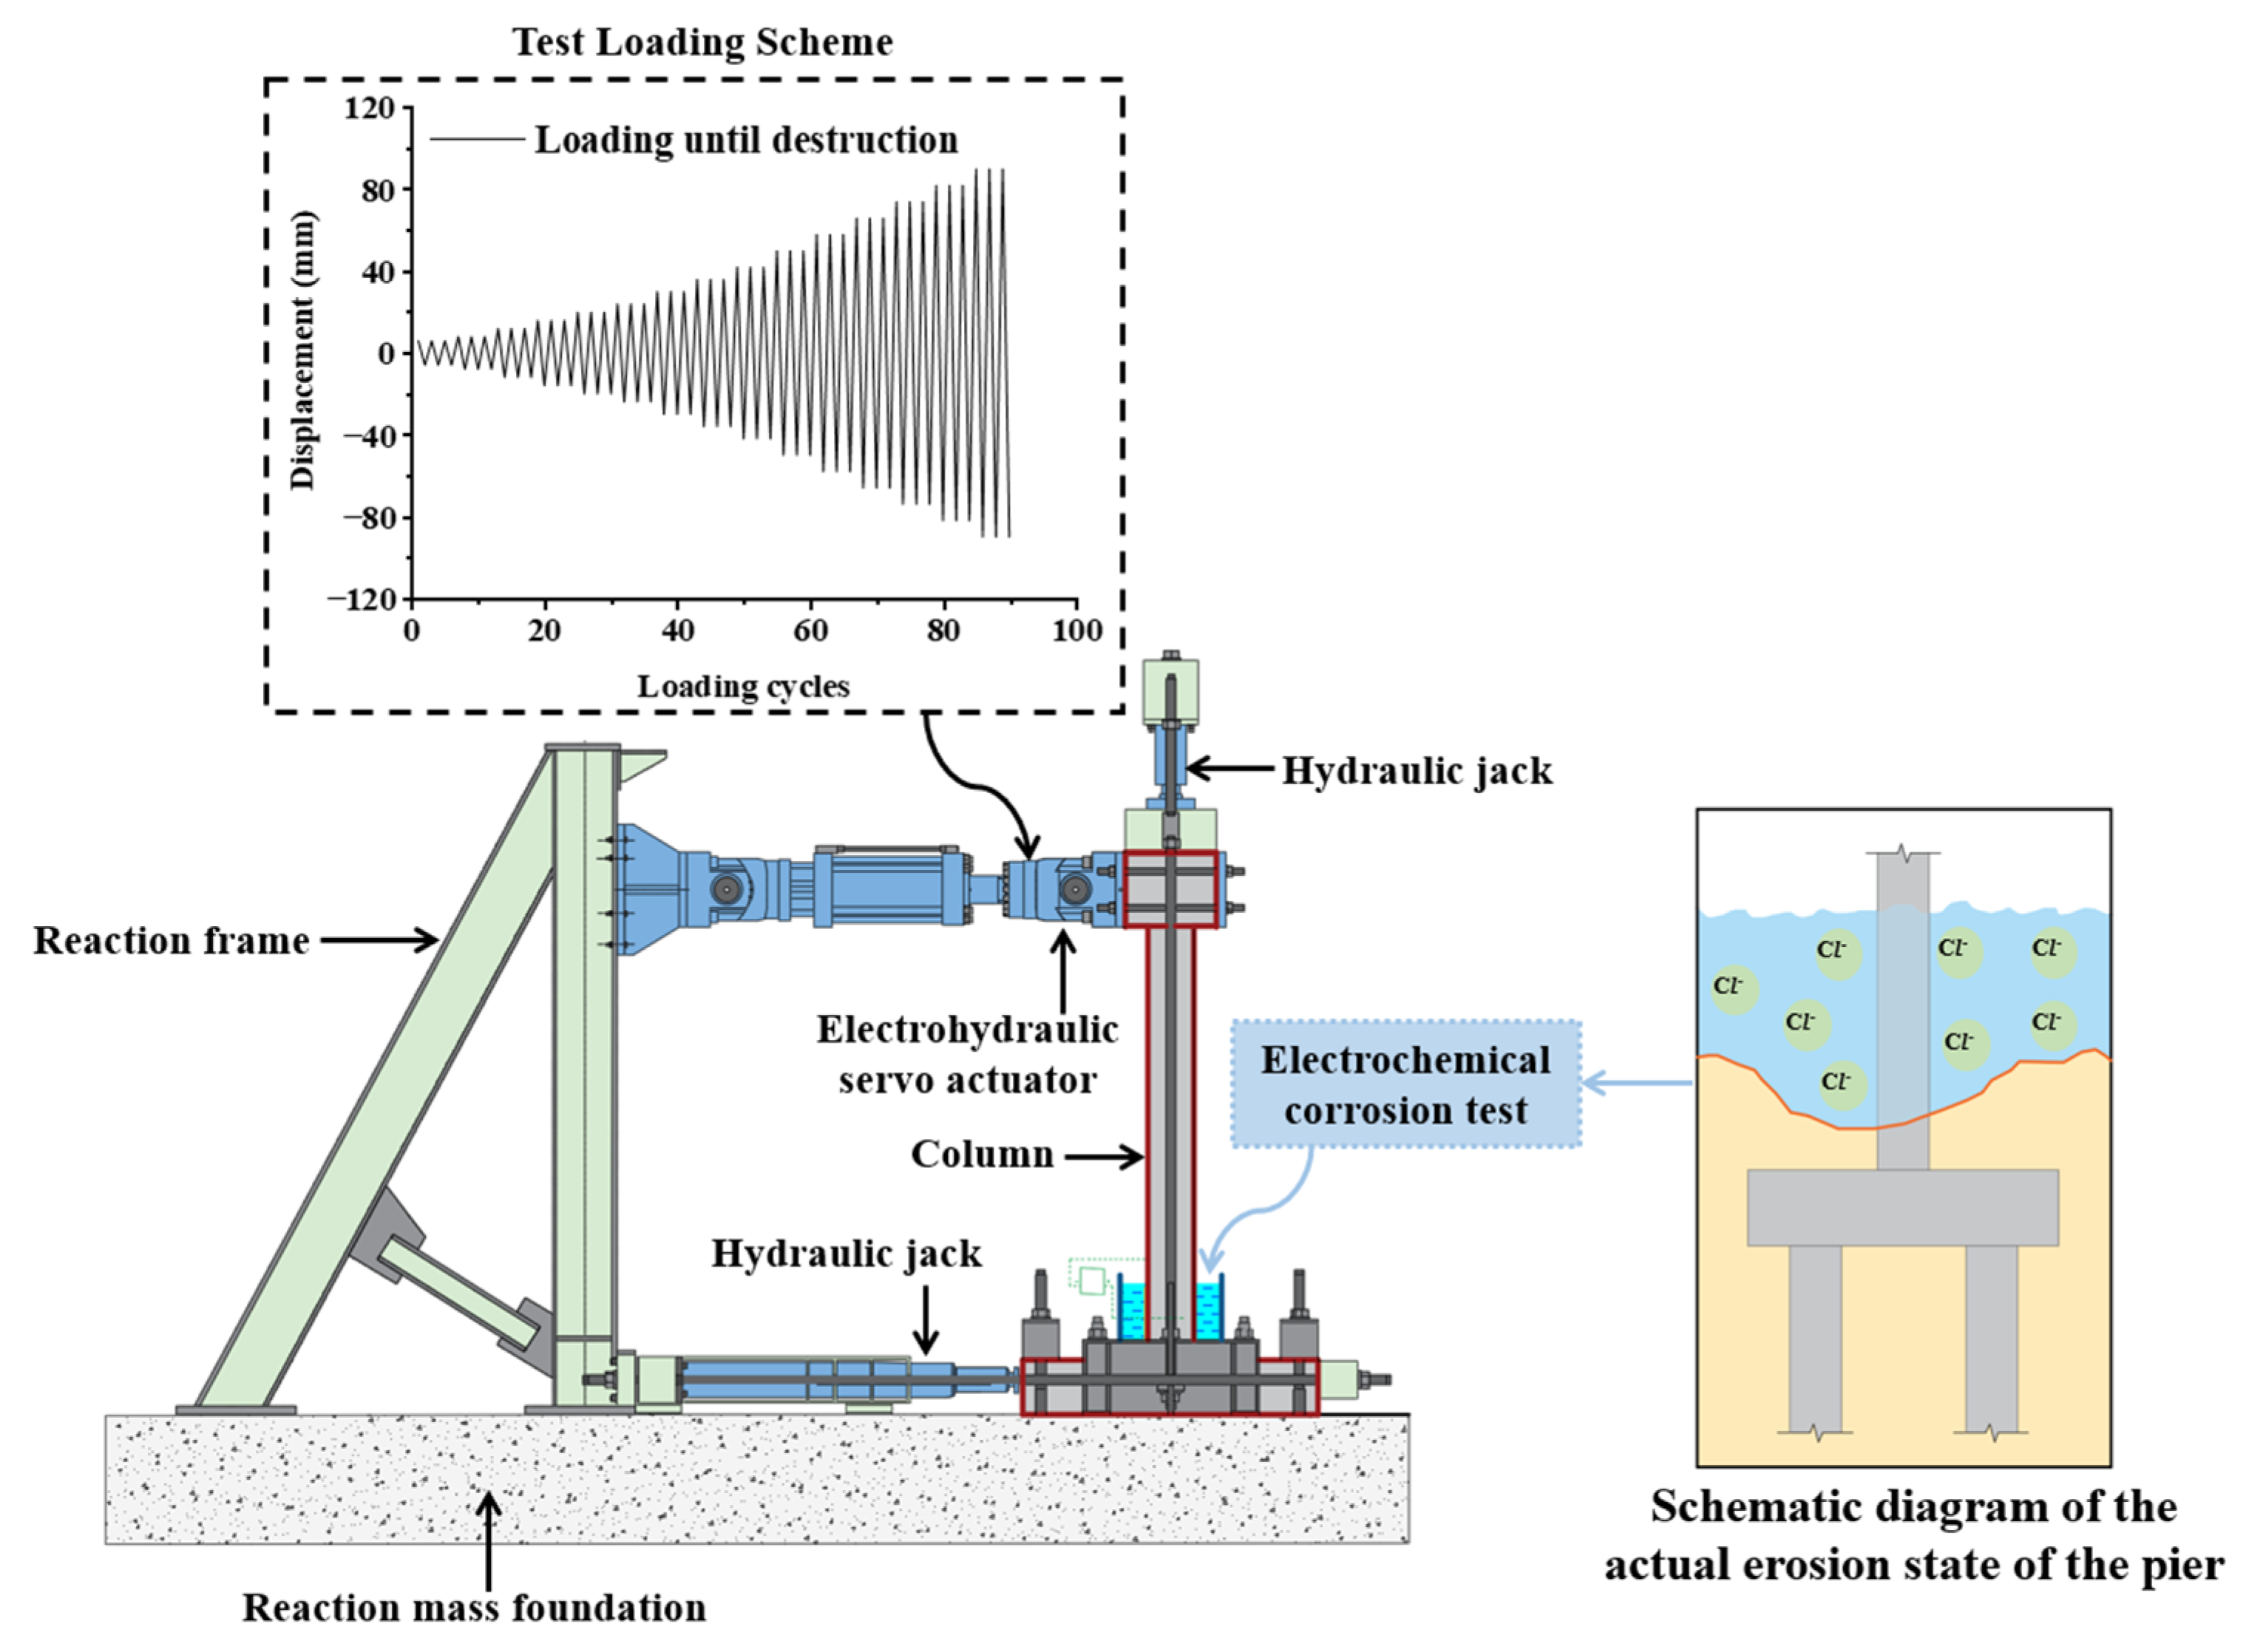
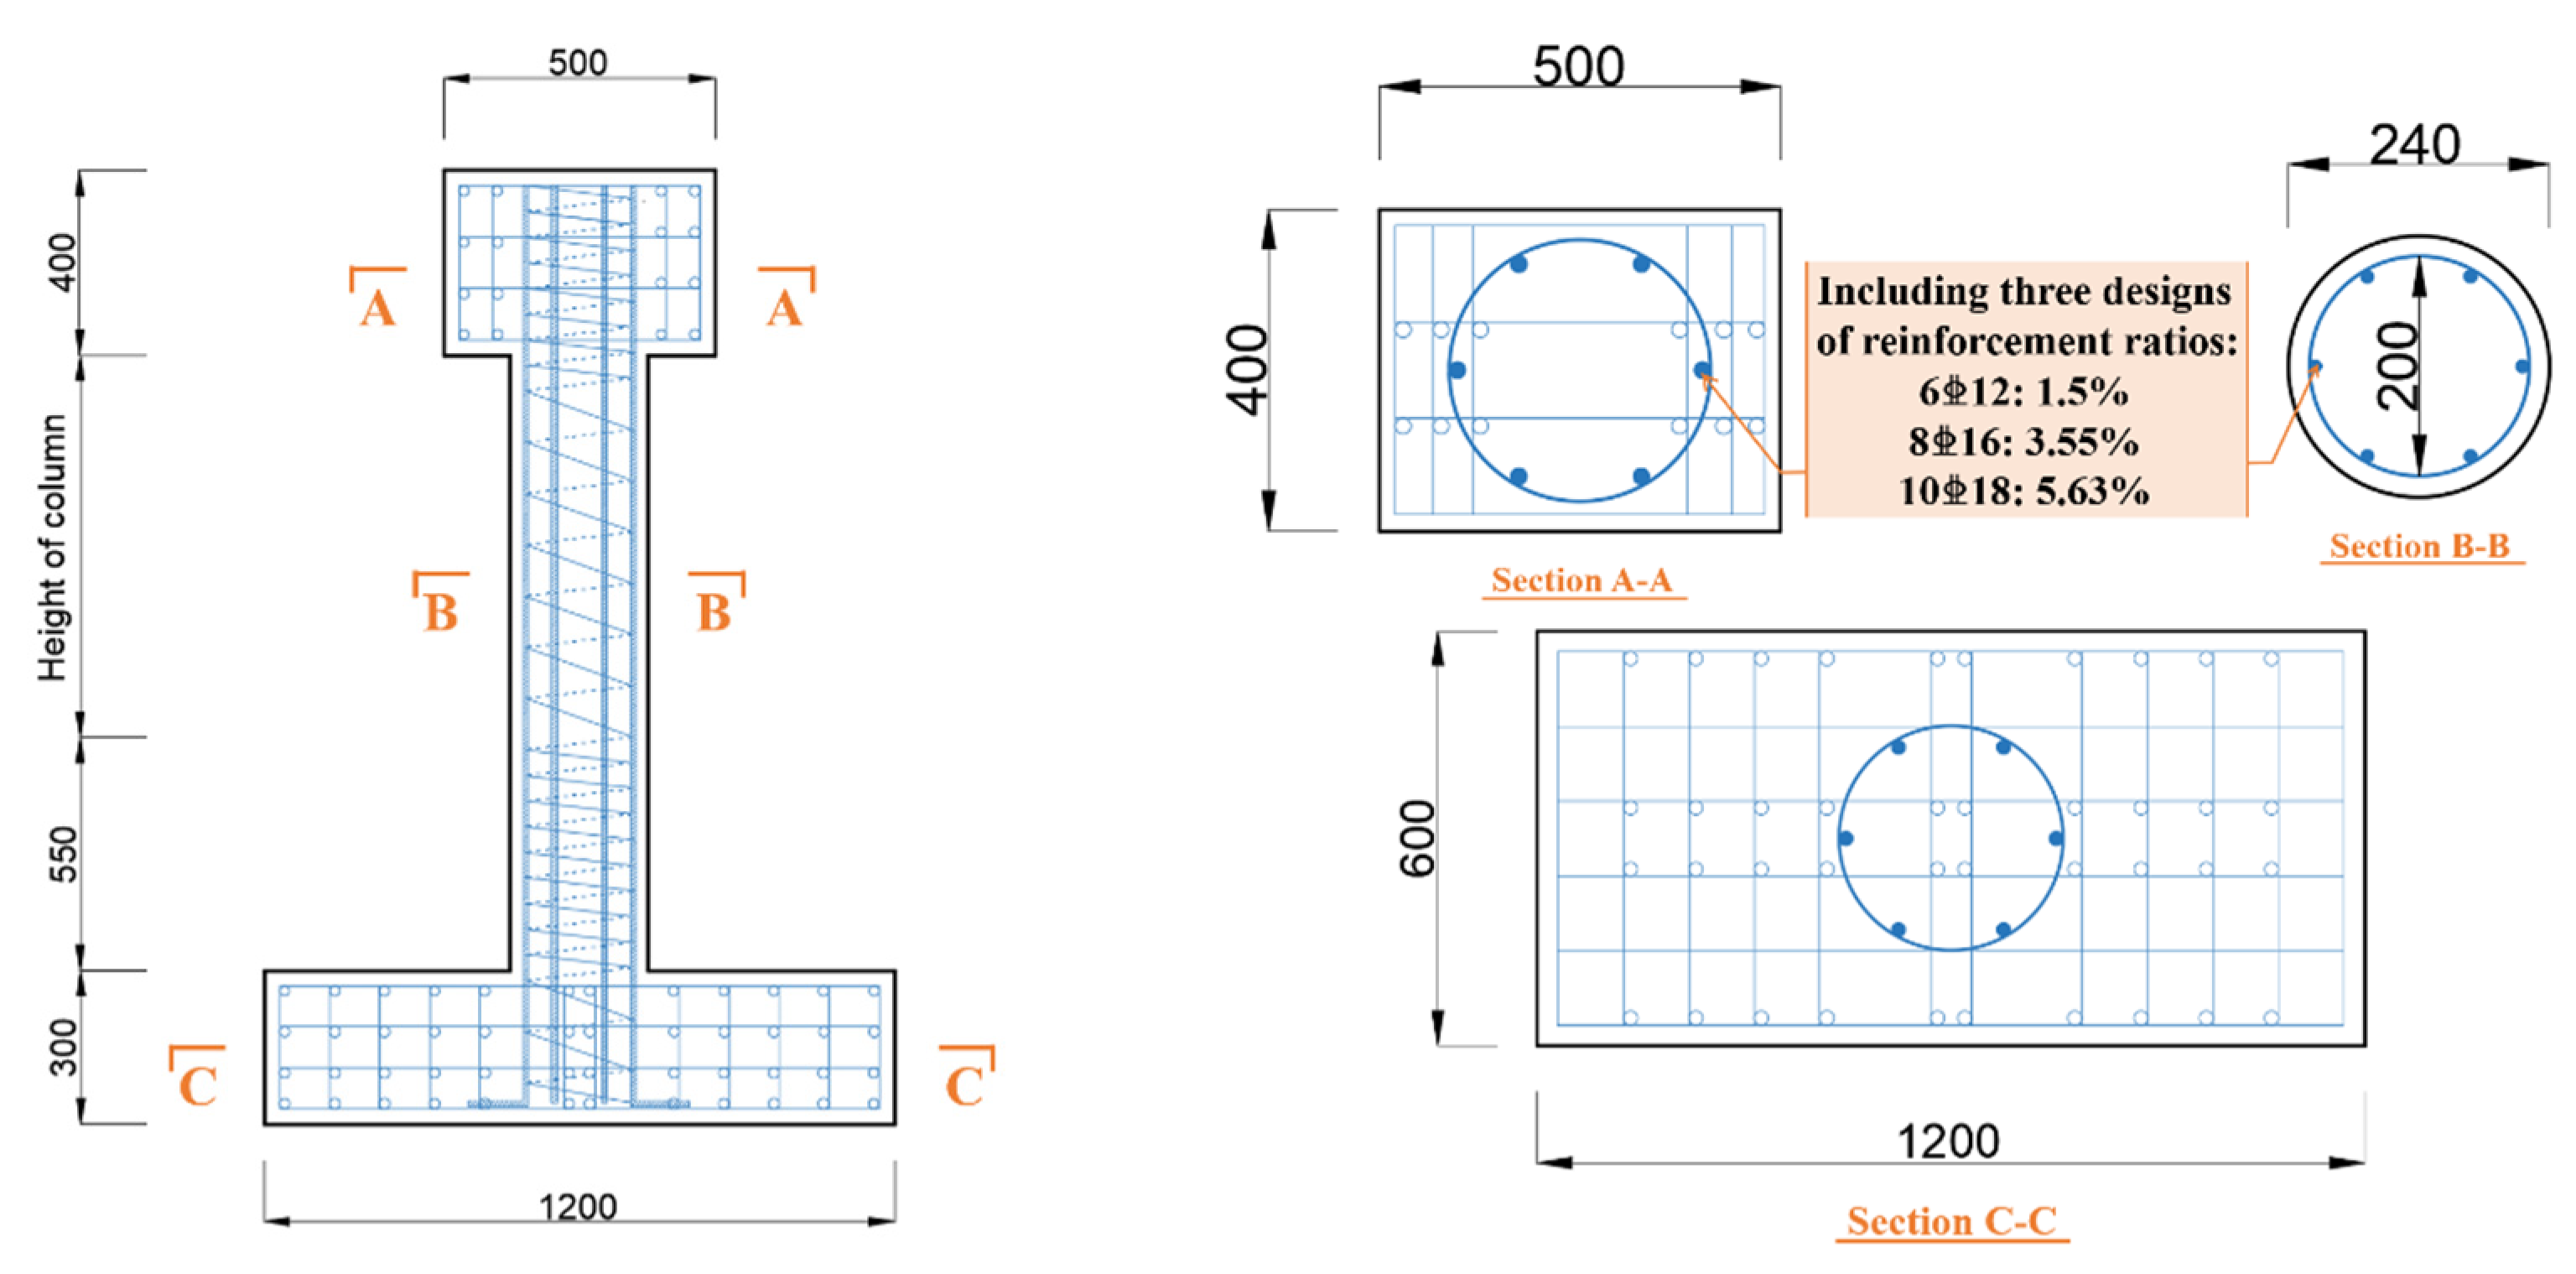
3.1. Specimen Design and Quasi-Static Test

Column specimens were designed with different heights according to the following ideas. (1) The same type of concrete (C40) and reinforcement (HRB400 and HRB335) as the prototype were adopted in specimens; (2) hoops in the specimen were configured in accordance with the principle of equal ratio of reinforcement volume to the prototype; (3) the axial pressure was set in the specimen on the basis of the principle of the same axial pressure ratio as the prototype; (4) the scale ratios for section and height dimensions of both low and middle columns were 1:6.25, 1:8.33, respectively. The quasi-static test and the column specimen are shown in Figure 19 and Figure 20, respectively. The specific design parameters are shown in Table 4. The specimens of high, medium, and low longitudinal reinforcement ratio with a difference of approximately 2% were designed to investigate the difference in seismic performance of bridge columns subjected to Cl corrosion with variable reinforcement ratios [47,48,49,50].

Electrochemical Corrosion of Bridge Columns

Electrochemical corrosion tests on maintained reinforced concrete columns positioned in NaCl solution with a concentration of 5% were carried out under dry and wet cycles. After 12 h immersion, the solution was drained and the evaporation of water in the test column was accelerated by means of fan air supply to achieve 12 h drying, taking a total of 24 h to complete a wet and dry cycle [51,52].
In the test, the axial compression ratio consistent with the prototype bridge project was applied for vertical loading. The mixed control of variable amplitude and constant amplitude displacement was applied for horizontal loading, each level of which was loaded cyclically 3 times. When the lateral force dropped to 85% of the peak lateral force, the specimen was considered damaged and the loading was stopped.

3.2. Degradation of Material Properties by Cl Corrosion

3.2.1. Effect of Cl Corrosion on Concrete Materials

After 30 days of electrochemical erosion under dry–wet cycles, content of Cl , which was detected at the concrete surface, 10 mm away from the concrete surface, and 30 mm away from the concrete surface in plastic hinge region after corrosion, was measured to be 0.85%, 0.60%, and 0.38%, respectively, which indicates that content of Cl decreased with distance increasing from concrete surface. The measured content of Cl was essentially the same due to the identical thickness of the protective layer of concrete and similar corrosive conditions of specimens under all working conditions. During the test, cracks on the specimens corroded by Cl appeared earlier with larger length and width. Obvious rust appeared on the concrete surface at the bottom of the test column. There even were obvious cracks owing to rust expansion on part of protective layer of concrete, which resulted in severe concrete spalling and decline of the bonding effect between concrete cover and steel reinforcement. It was indicated that Cl corrosion has an effect on strength and volume stability of concrete. The phenomenon of concrete damage and spalling is represented in Figure 21. The main reason for the effect of Cl on performance of concrete is that Cl will combine with calcium ions in concrete during the hydration process to produce strength-free calcium chloride, leading to the mixture of calcium chloride without bond strength in cured concrete, which affects the strength of concrete to a great extent.

3.2.2. Effect of Cl Corrosion on the Material Properties of Steel Reinforcement

The damage pattern of columns shows that relatively severe corrosion appeared on the steel reinforcement in corroded specimens. After a quasi-static test of three groups of comparative specimens, six longitudinal rebars divided into two groups from each specimen with middle height were cut out to be subjected to tensile tests. A total of five valid load–displacement curves of uniaxial tensile were obtained apart from one longitudinal rebar broken due to the clamp. The comparison of mechanical properties among longitudinal rebars before and after Cl corrosion is shown in Figure 22. It was found that the average elongation of tensile longitudinal rebars without Cl corrosion was 26.16% and the average elongation of tensile longitudinal rebars subjected to Cl corrosion was 16.5%. The tensile strength of longitudinal rebars changed significantly, with a 4.69% decrease in ultimate breaking strength and a 4.26% decrease in yield strength of corroded rebars.

3.3. Comparison of Quasi-Static Test Results of Columns before and after Cl Corrosion

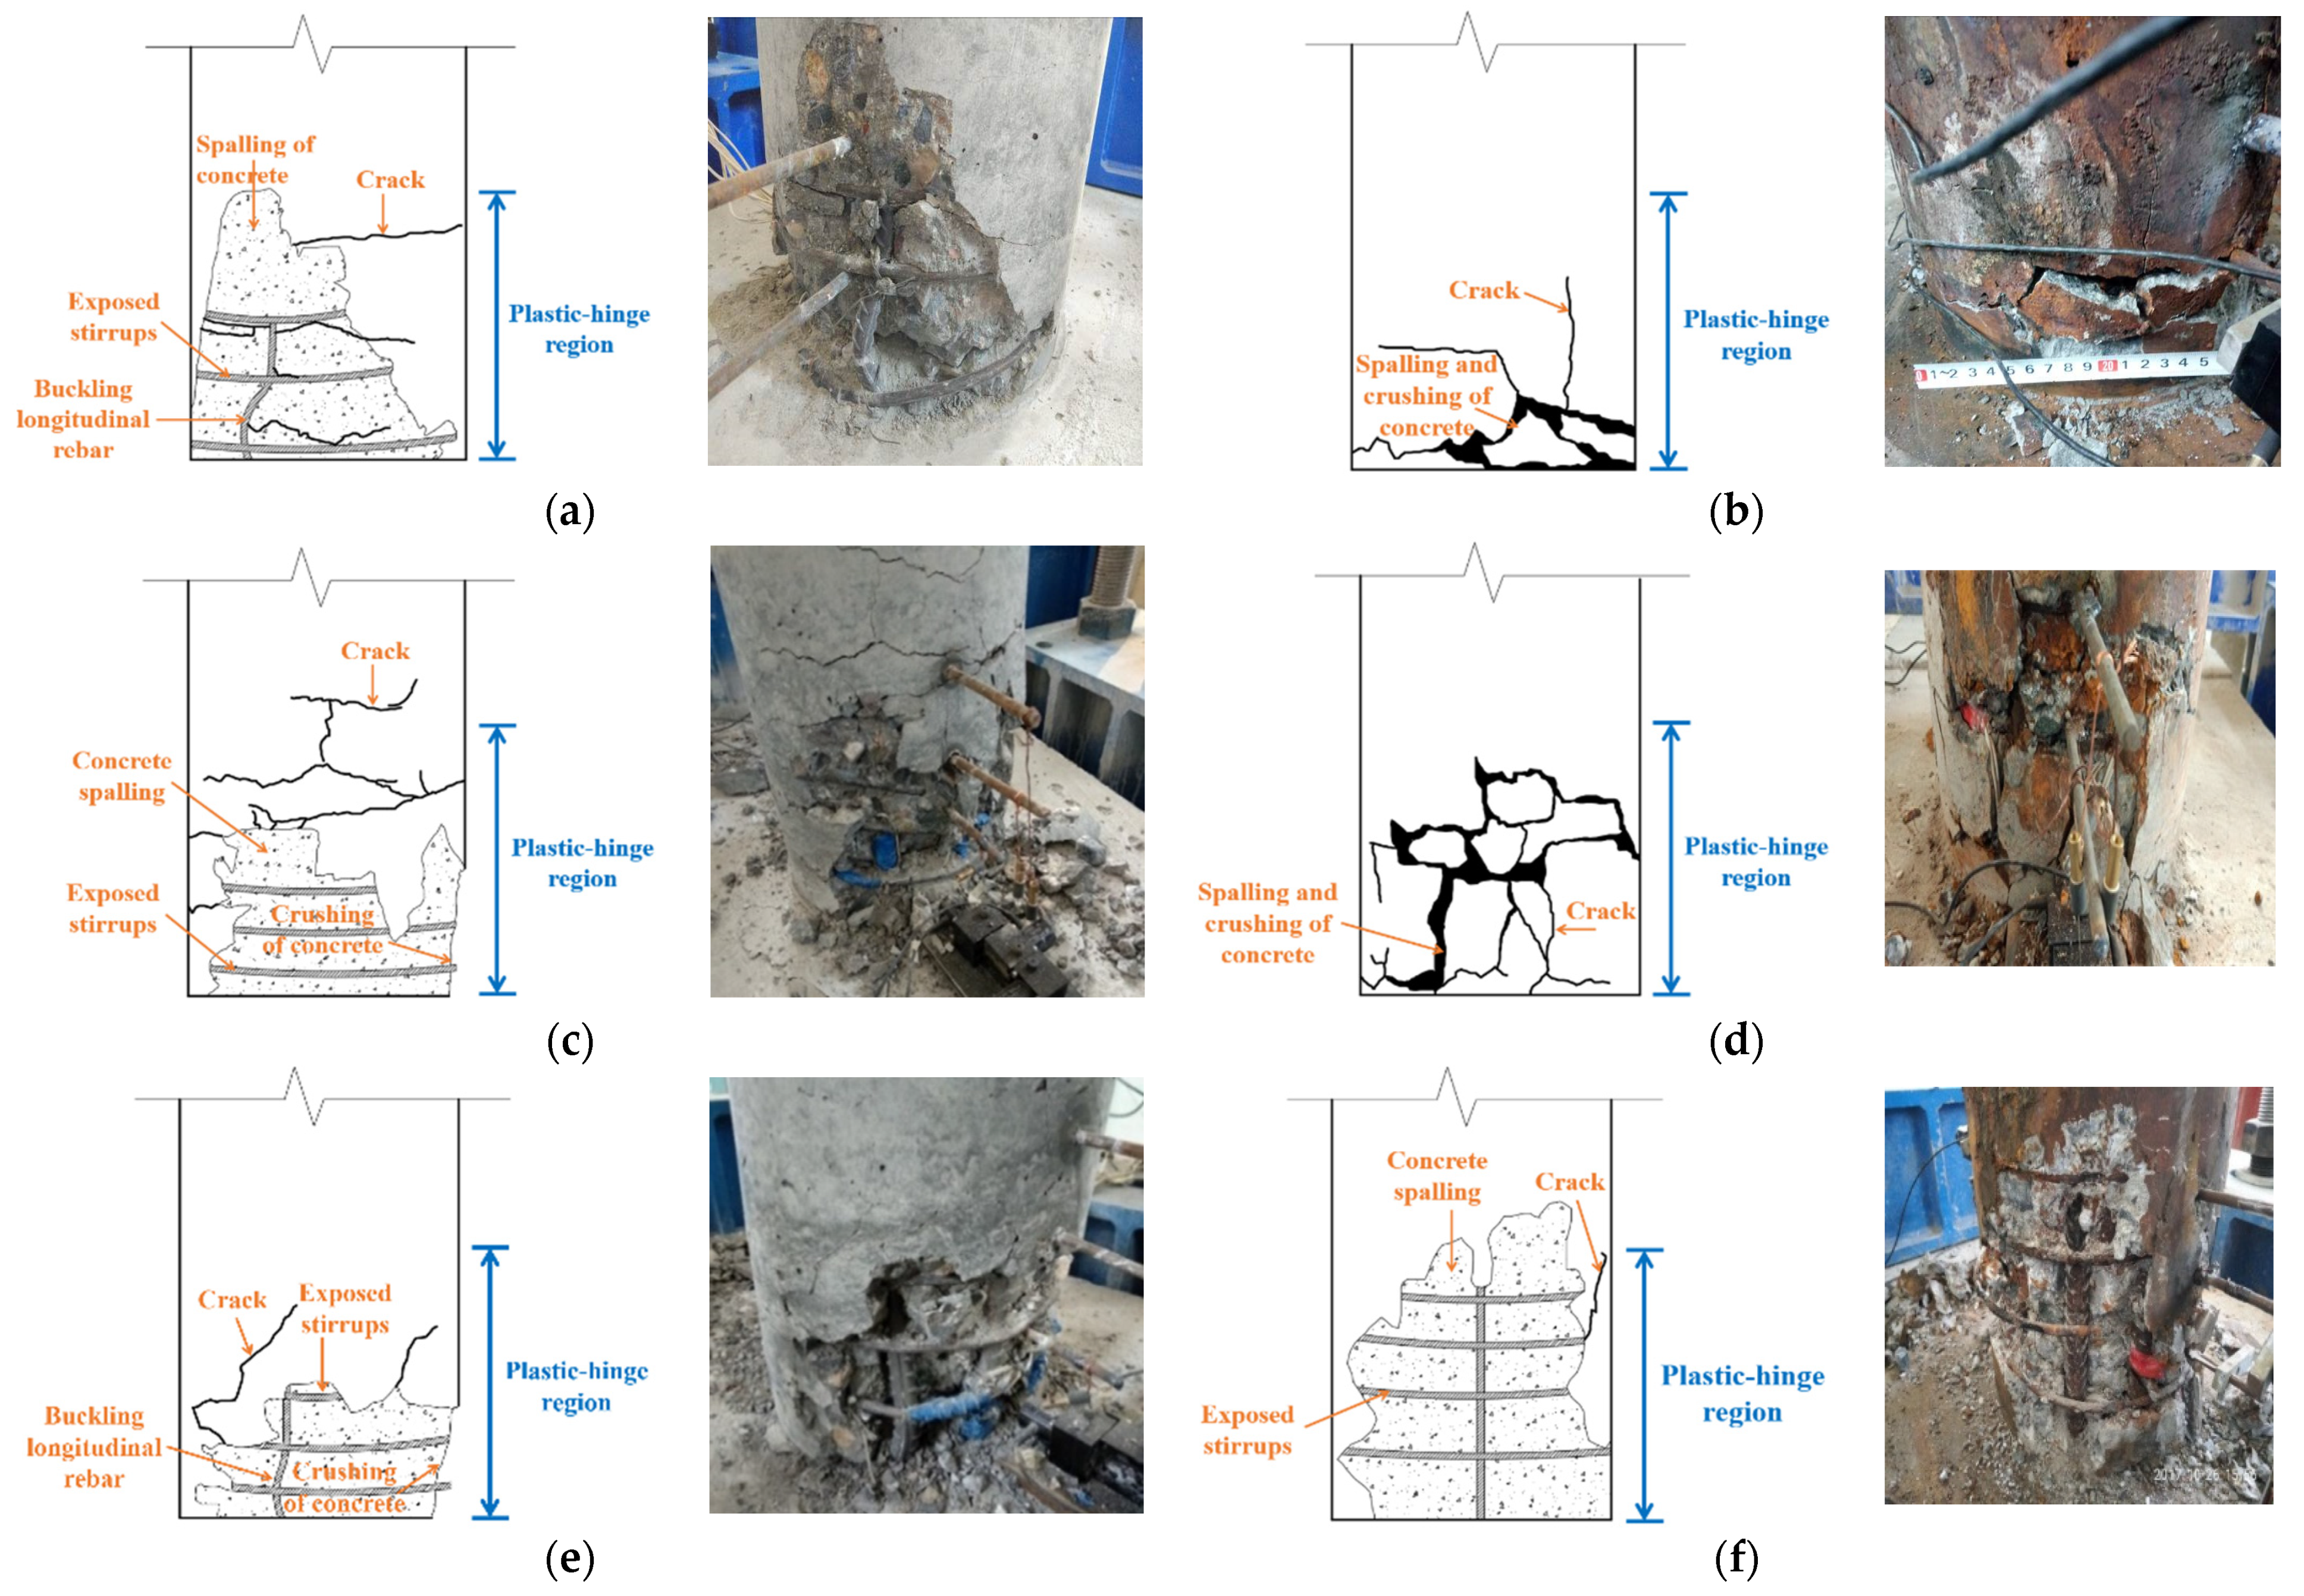
3.3.1. Specimen Damage Phenomenon

Three groups of comparative specimens in the test all demonstrated ductile failure with bending failure as the main feature. Figure 21a–f show the failure forms of specimens LL, LLE, MM, MME, MH, and MHE, respectively. Collapse and spalling of concrete as well as buckling and fracture of longitudinal rebars and stirrups appeared in the plastic hinge region, which formed at the bottom of columns during all tests while only small closable cracks occurred in areas other than plastic hinges. It complies with the requirement of ductile seismic design of bridge columns, which relies on plastic hinges for energy dissipation.

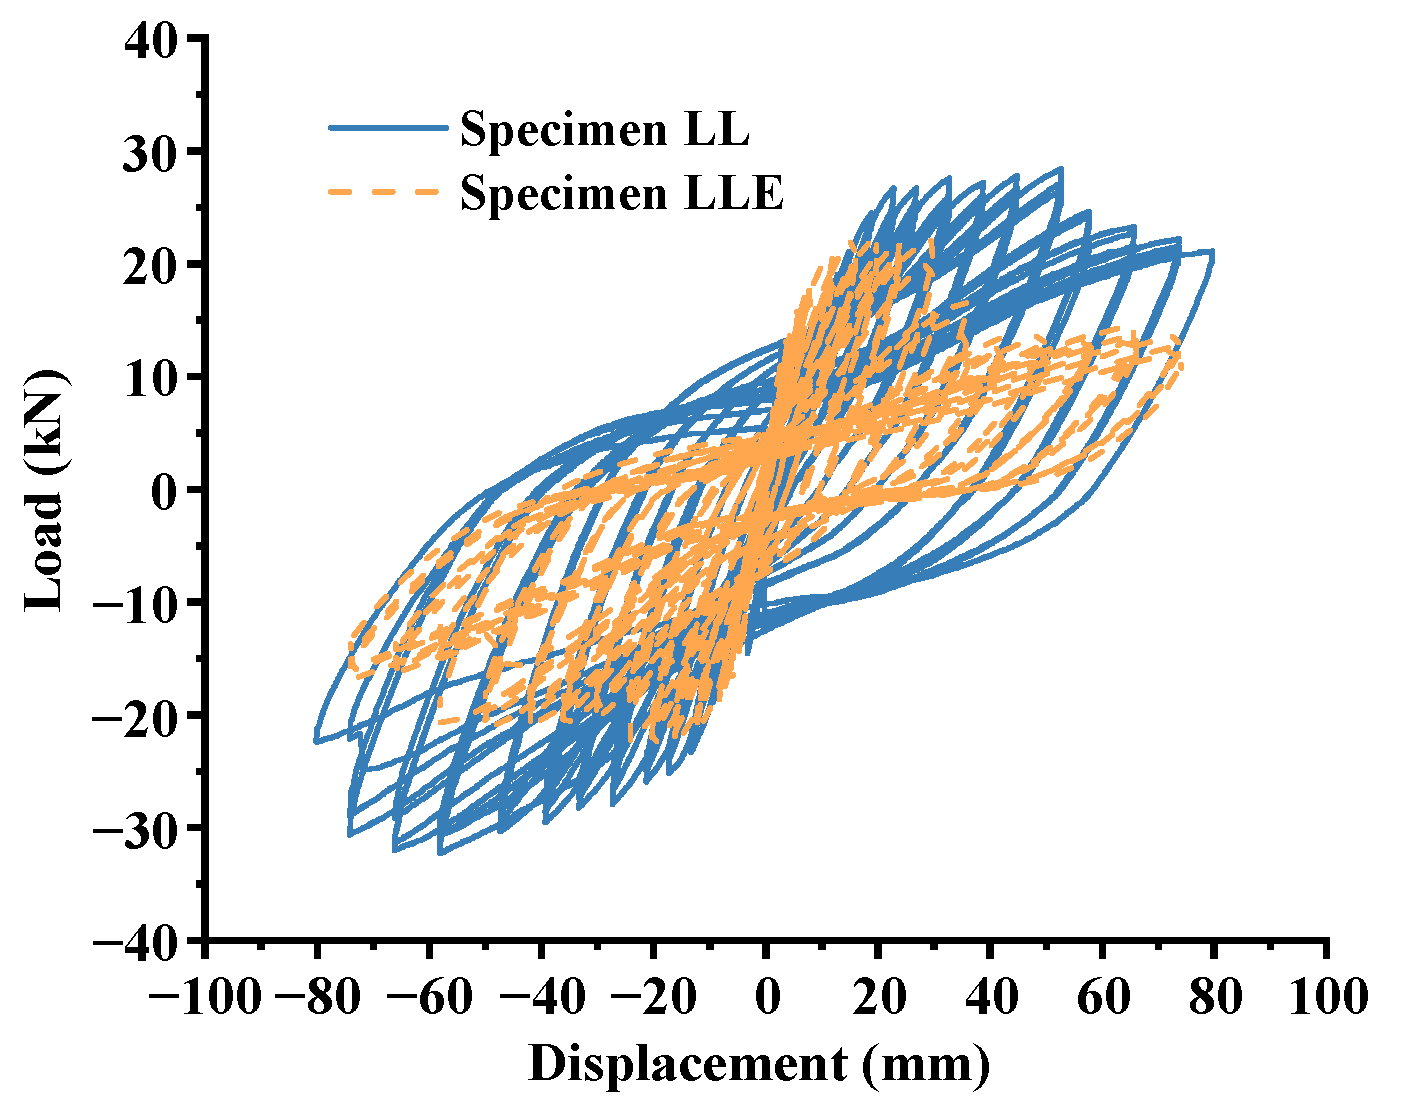
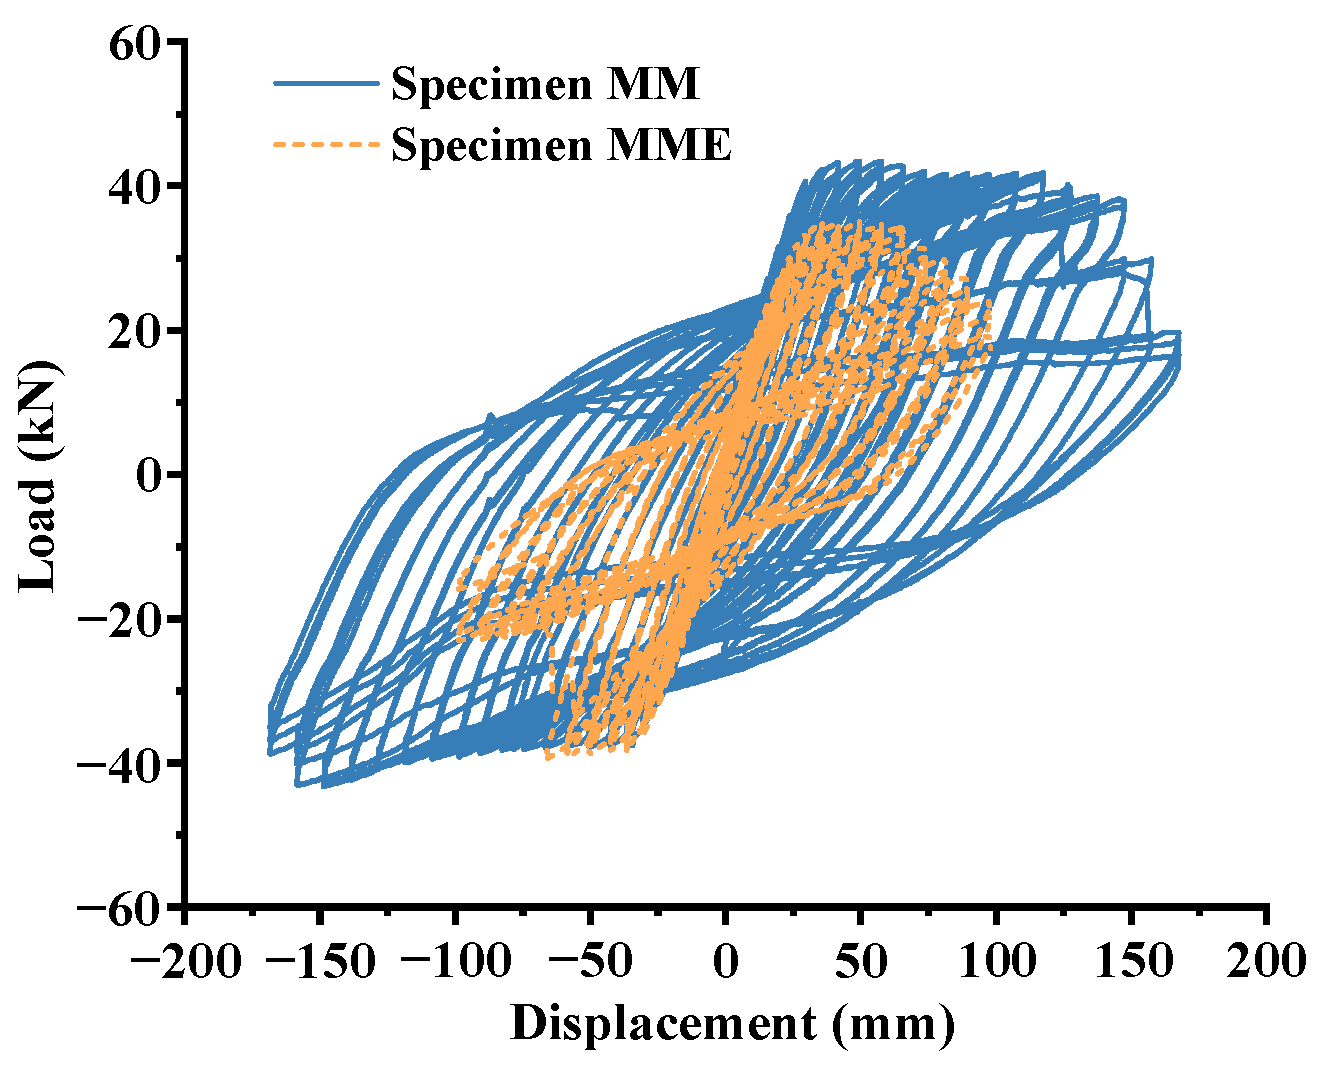
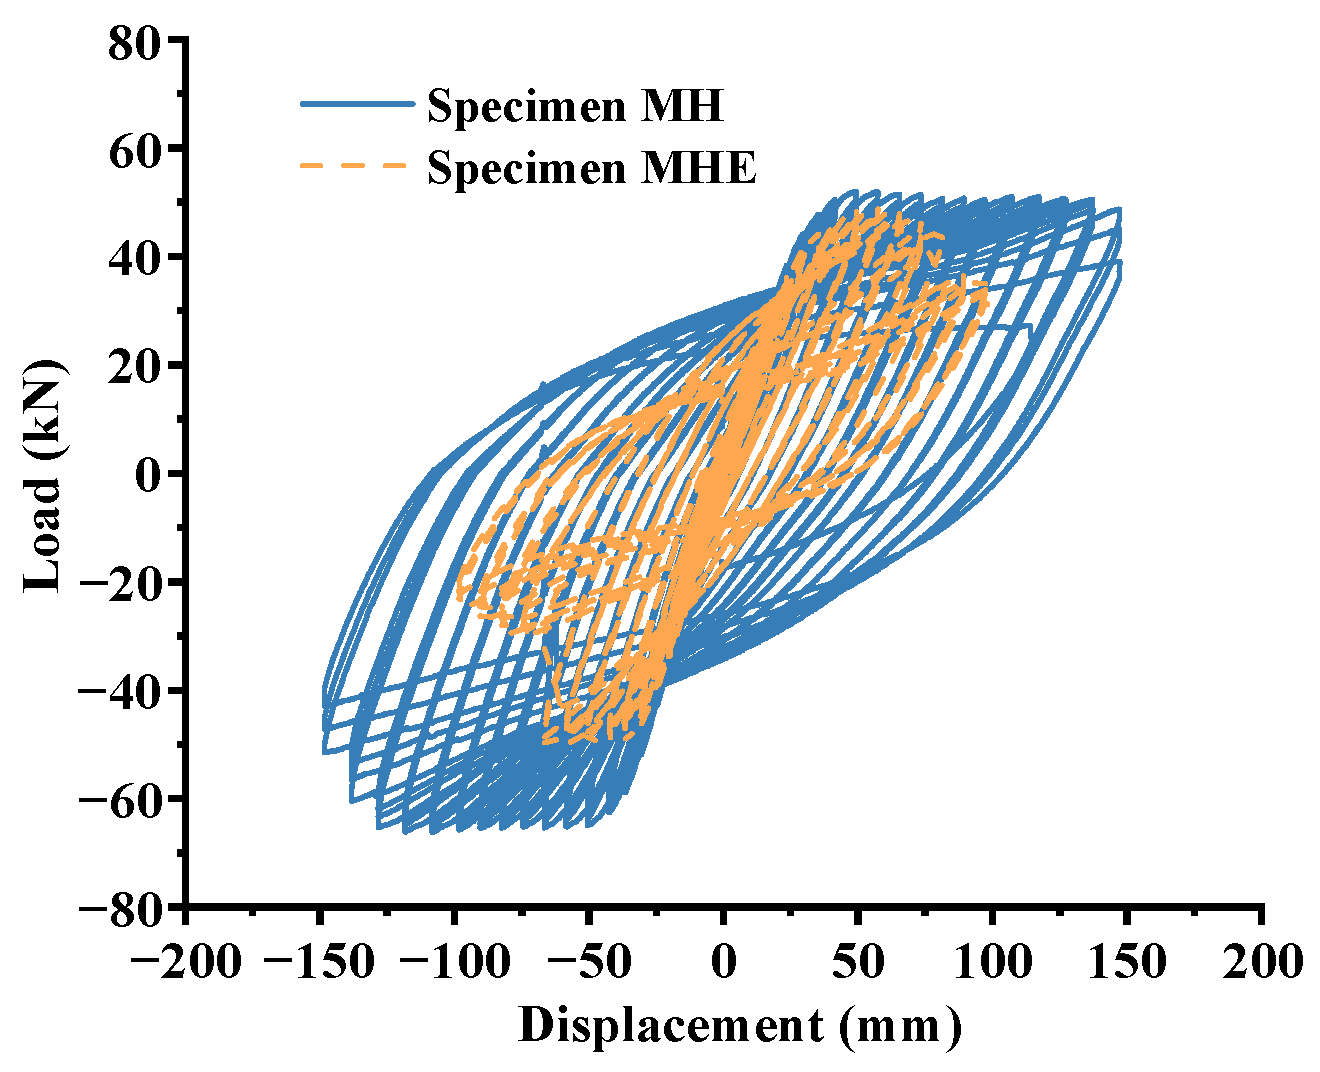
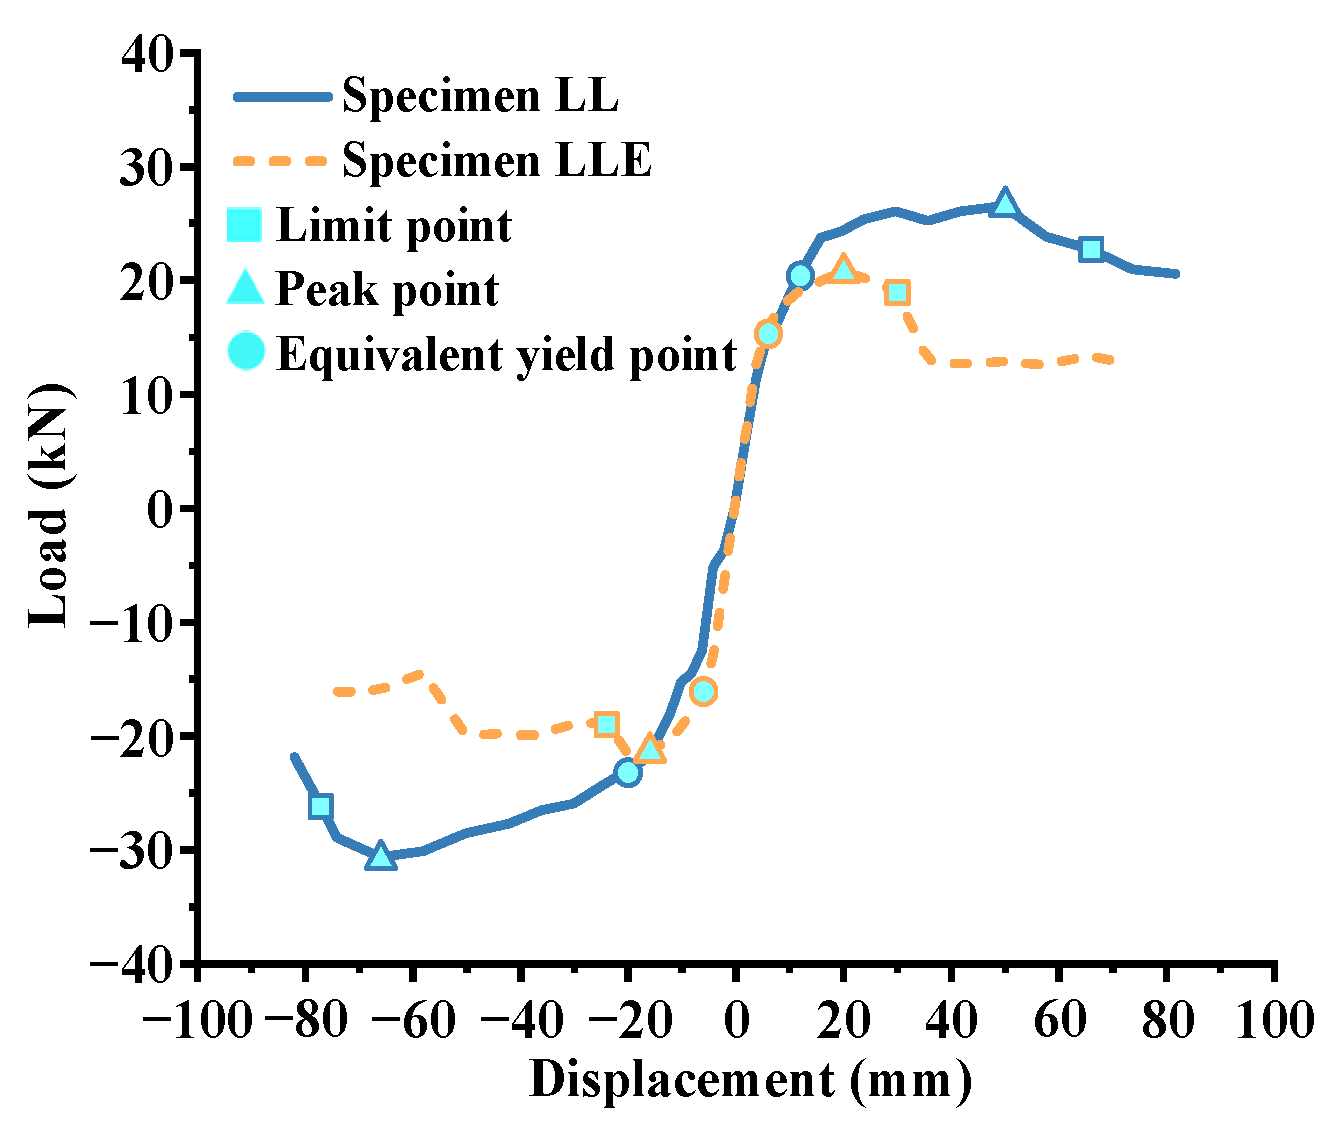
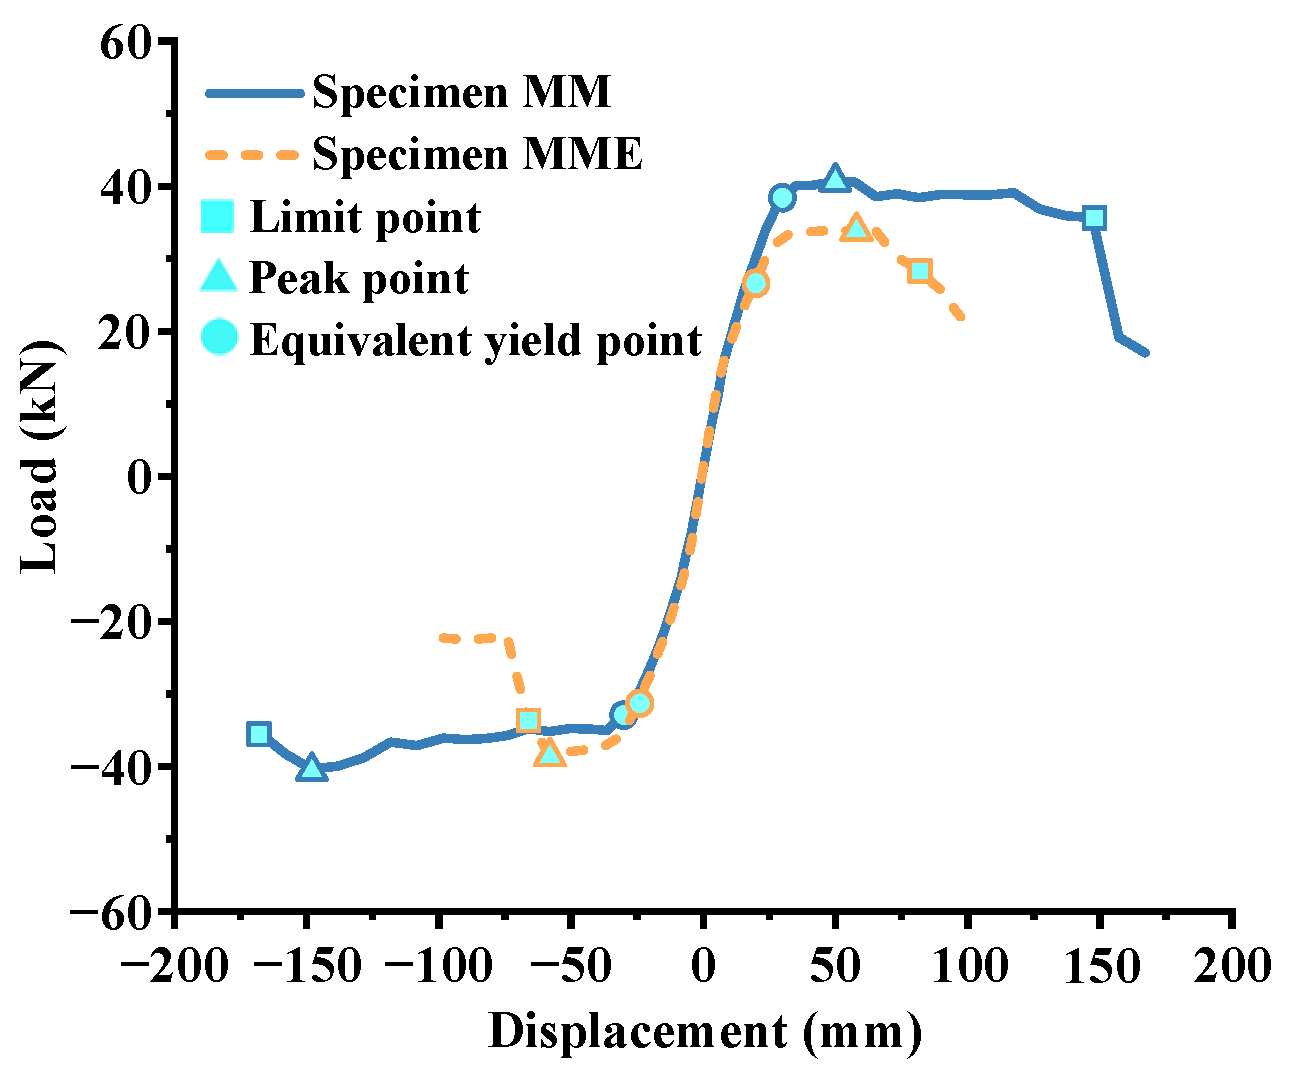
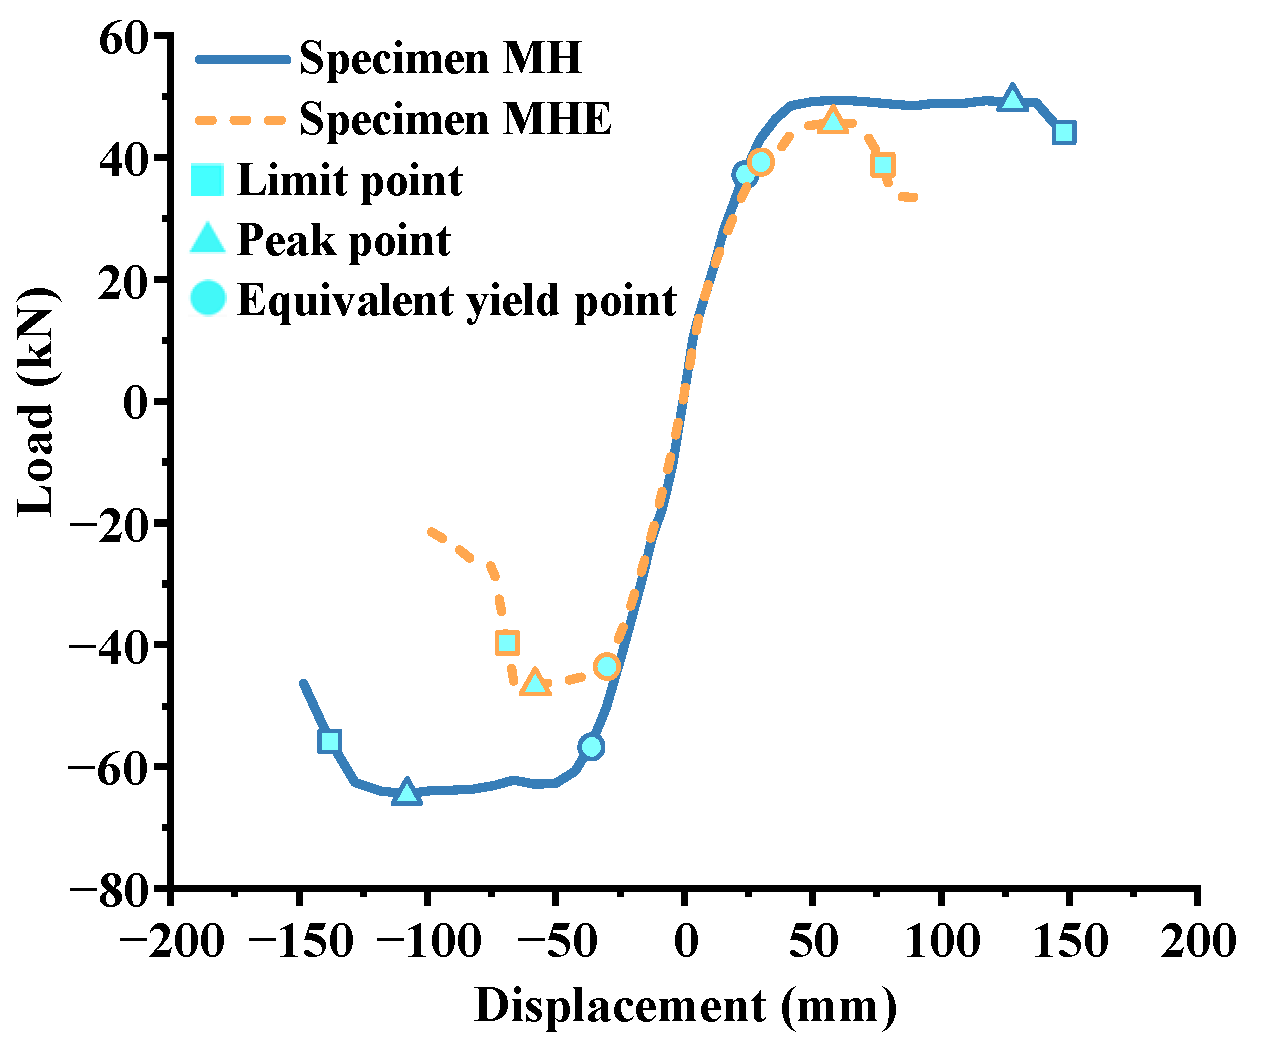
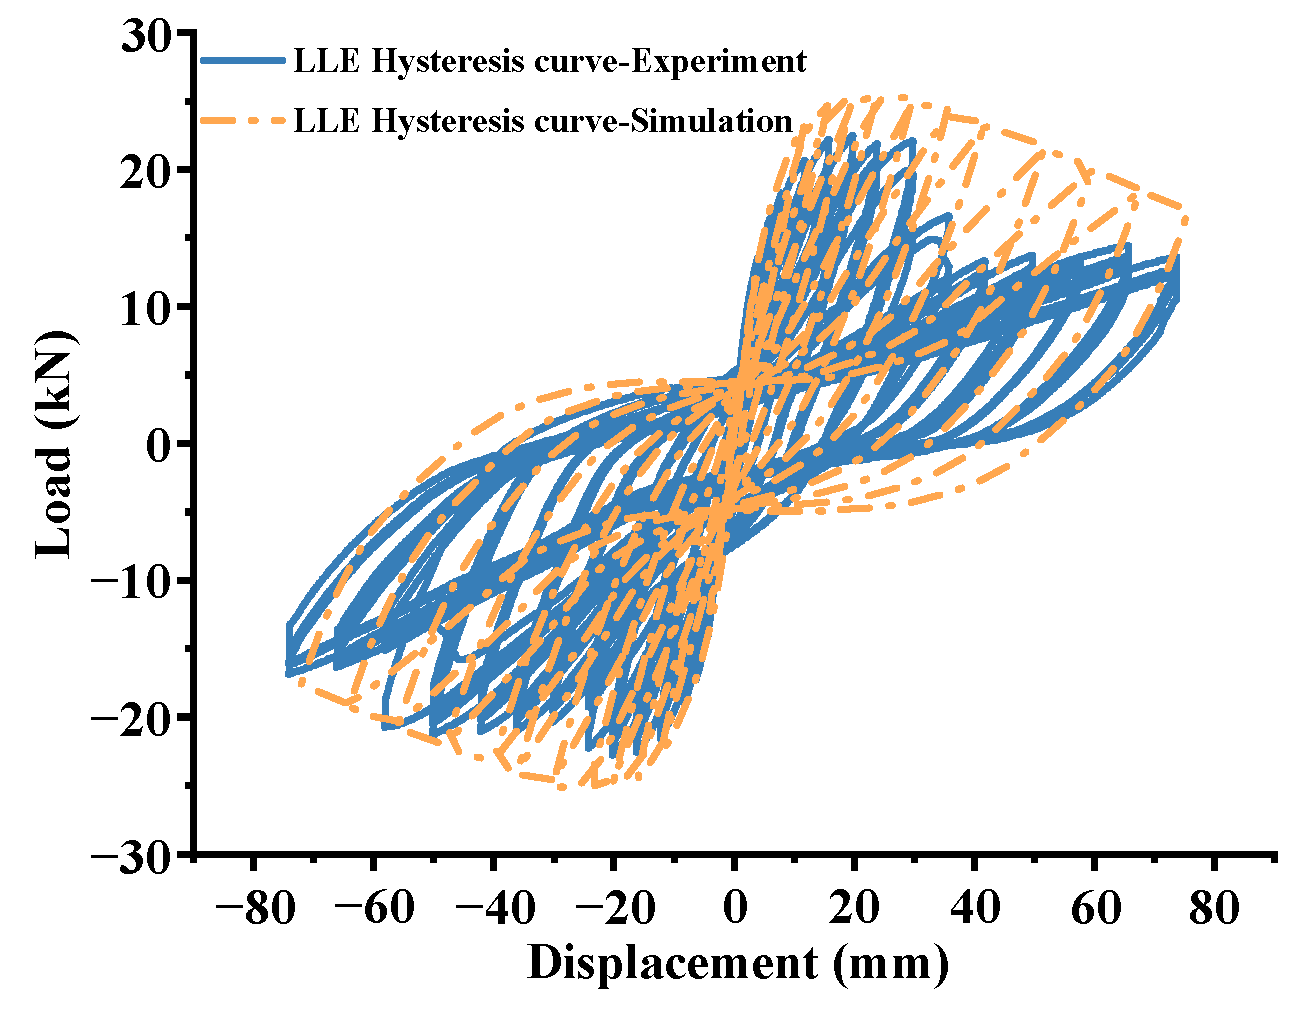
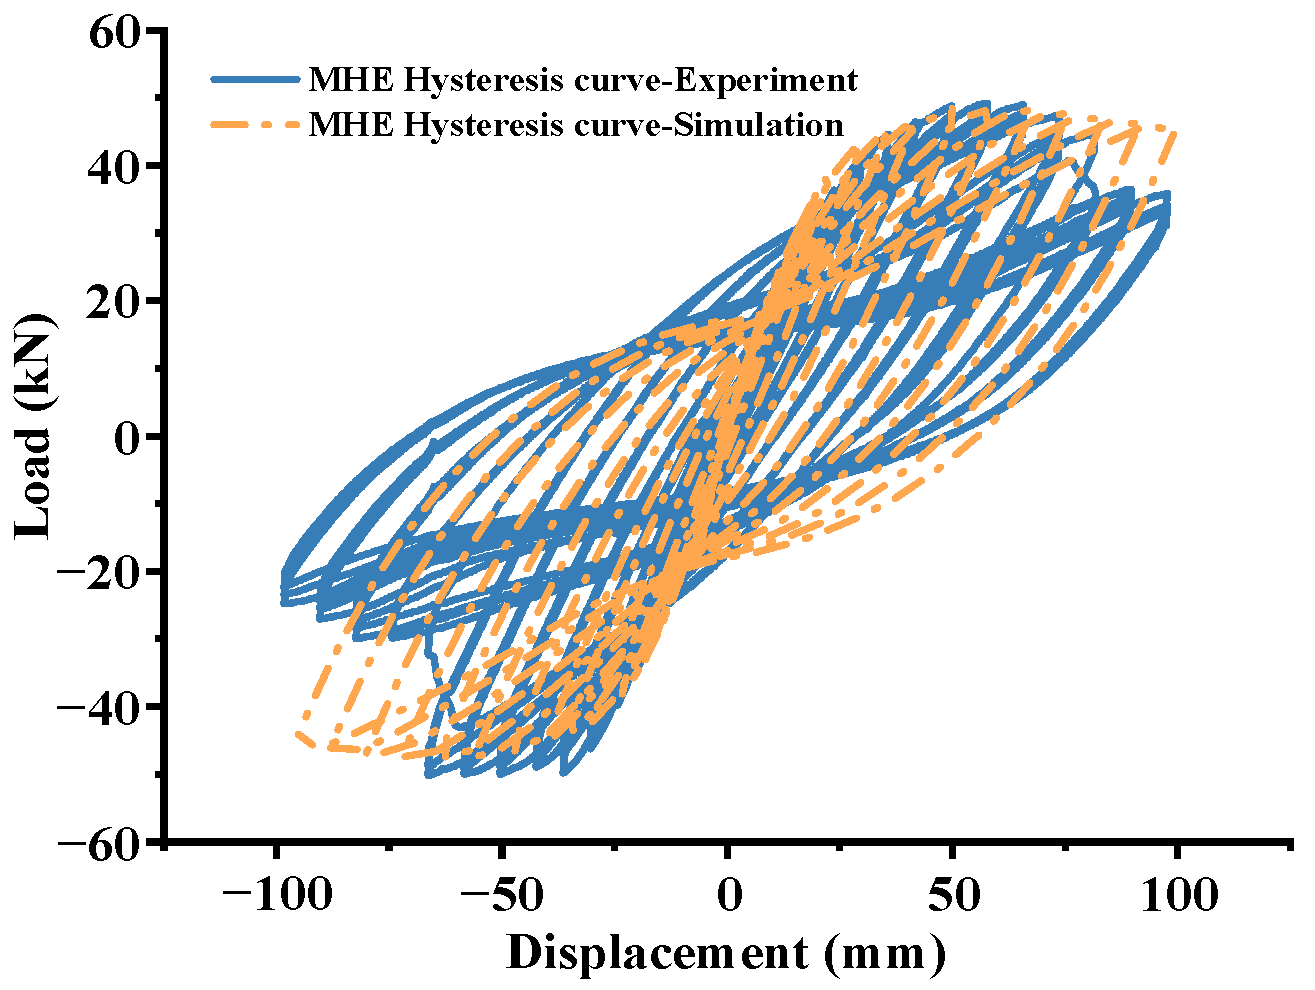
3.3.2. Load–Displacement Hysteretic Curve and Skeleton Curve of Column

The seismic performance of bridge columns can be comprehensively reflected by the load–displacement hysteresis curve under low cyclic loading, which is an important basis for evaluating the level of cumulative hysteretic energy dissipation under seismic action. The indicators of seismic performance such as deformation, stiffness, and ductility at different stages in quasi-static test can be reflected well by skeleton curve. As shown in Figure 23, Figure 24 and Figure 25, the hysteresis loops of specimens LLE, MME, and MHE were far less saturated than the corresponding un-corroded specimens. The area of hysteretic loops shrunk by 56.35%, 88.01%, and 75.2%, respectively. The level of hysteretic energy consumption decreased significantly. As shown in Figure 26, Figure 27 and Figure 28, in forward and reverse directions of loading displacement, the resistance of specimens LLE, MME, and MHE decreased more rapidly with the increase of loading displacement. The yield force, peak resistance, and ultimate lateral force of specimens LLE, MME, and MHE at damage were significantly smaller than those of the corresponding un-corroded specimens, which resulted in a considerable decline of the corresponding yield displacement, peak displacement, and limit displacement. For specimen LLE, values of displacement at three characteristic points dropped by 62.20%, 65.32%, and 59.99%, respectively. For specimen MME, values of displacement at three characteristic points decreased by 20.15%, 39.81%, and 53.90%, respectively. For specimen MHE, values of displacement at three characteristic points declined by 6.26%, 50.08%, and 49.06%, respectively. The above data show that the bearing capacity and ductility of bridge columns subjected to Cl corrosion were on a downward trend.

3.3.3. Displacement Ductility Coefficient of Specimen

Displacement ductility coefficient is one of the important indicators to measure ductility performance of bridge columns. The displacement ductility coefficient of specimens MME and MHE declined by 41.56% and 46.85% before and after corrosion, respectively, indicating that Cl corrosion weakens the ductility properties of bridge columns; in contrast, the displacement ductility coefficient of specimen LLE raised by 3.91% compared with specimen LL, indicating that Cl corrosion had little effect on ductility performance of this specimen with a low height and low longitudinal reinforcement ratio. However, by comparison with specimen LL, the hysteretic loop area of specimen LLE reduced by 49.71%, which indicates that there is a limitation in judging seismic performance of columns only by displacement ductility coefficient. It revealed the necessity of the synthetic evaluation of seismic performance from the perspective of comprehensive indicators such as the level of energy dissipation.

3.3.4. Energy Dissipation Capacity of Specimen

The energy dissipation level of ductile bridge columns is represented by the enclosed area of hysteresis curve, which is a comprehensive index to measure the seismic performance of columns. The index of cumulative hysteretic energy dissipation is defined as the sum of hysteretic loop areas at all levels of displacement amplitudes with quasi-static loading on the structure or component until failure, which reflects the overall energy dissipation level of the specimen in its entire life cycle.
E AD = i = 1 n Δ W i
where E AD is the cumulative hysteretic energy dissipation of components; n is the total number of laps loaded by the test; and Δ W i is the area of hysteresis loop corresponding to the i -th displacement amplitude.
In the three groups of specimens, the relationship curve between the area of three hysteresis loops at the i -th level of displacement amplitude and the displacement before and after corrosion is shown in Figure 29. A comparison of three sets of energy consumption–displacement curves shows that an increase in both ultimate displacement and reinforcement ratio will enhance the energy dissipation capacity of specimen to a certain extent. In addition, for specimens with different column heights and reinforcement ratios, the energy consumption level of specimens subjected to Cl corrosion was significantly lower than those of the corresponding un-corroded specimens. The values of cumulative hysteretic energy dissipation for each specimen from the beginning to the end of loading are listed in Table 5. It shows that the cumulative hysteretic energy dissipation of specimens LLE, MME, and MHE only occupied 43.65%, 20.38%, and 24.8% of the corresponding original un-corroded specimens, respectively.

3.3.5. Equivalent Viscous Damping Coefficient of Specimens

Equivalent viscous damping coefficients reflect the level of energy dissipation in bridge columns at different displacements. In pseudo-static tests for bridge columns with reciprocating loading and unloading processes, absorption and release of energy in components were alternately carried out so that the seismic performance of each specimen before and after corrosion could be measured by the equivalent viscous damping coefficient. It can be observed from the plot of equivalent viscous damping coefficient versus displacement for each group of specimens in Figure 30 that the slope of the curve decreased or even changed from positive to negative at ultimate displacement. The equivalent viscous damping coefficient of specimens corroded by Cl was always greater than those of the corresponding un-corroded specimens before reaching ultimate displacement. At the same stage, plasticity development in the plastic hinge region of the corroded columns was larger, which indicates that corroded columns are more prone to damage.

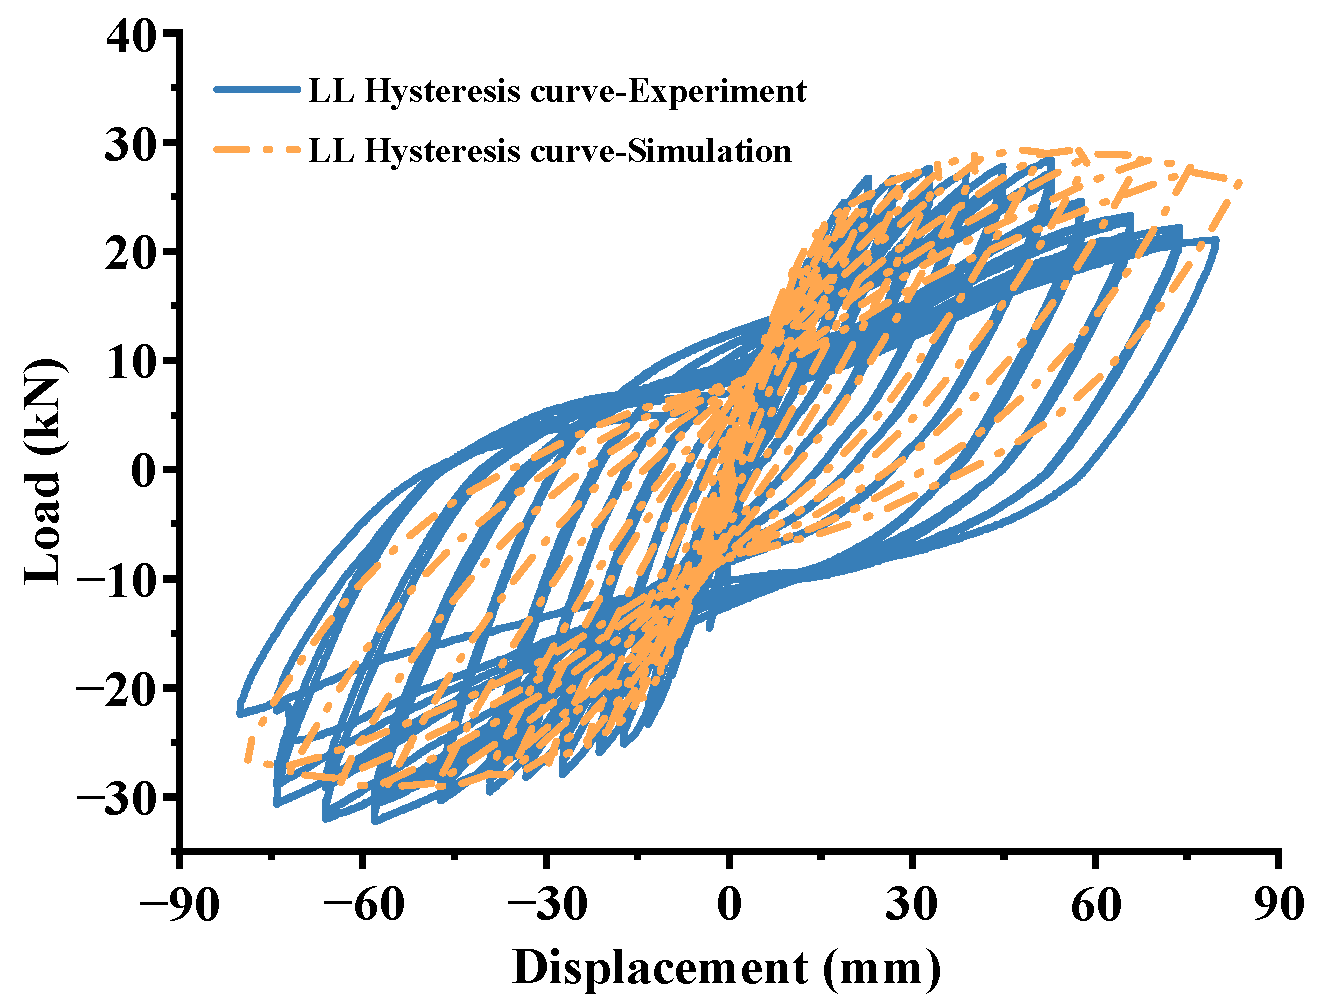
3.3.6. Finite Element Analysis (FEA)

The specimens were numerically simulated by finite element software OpenSees, in which the restoring force model for the structure was identified from the physical stress–strain relationship of the material in its fiber section. The material type Concrete02 [53] was adopted to simulate the concrete in fiber model. The restraining effect of transverse hoops was simulated by varying the peak value of stress and strain and the slope of the softening section in the skeleton curve in the compression zone. This still allows the residual strength of the concrete to be taken into account when the concrete is compressed to its maximum strength while the effect of cracking on the fiber cross-section is considered when the concrete is in tension. Steel02 [54] was adopted to simulate reinforcement in the model. The stress–strain relationship for reinforcement after entering plasticity was simplified to a straight line with a small slope, whose hardening coefficient b = 0.01 , meaning the elastic modulus of reinforcement E s = 0.01 E s . The displacement-based beam-column element was utilized to simulate the pier-column element for low-circumference cyclic loading. The comparison of hysteresis curves between FEA and test for specimen LL and LLE is shown in Figure 31 and Figure 32, respectively, and for specimen MH and MHE is shown in Figure 33 and Figure 34, respectively.
It can be seen from Figure 31 and Figure 33 that the curve of FEA hysteresis of un-corroded specimen is in good agreement with the curve of experimental hysteresis. It can be obtained from Figure 32 and Figure 34 that the curve of FEA hysteresis and the curve of test hysteresis of specimen LLE and MHE had a good consistency before the peak load, at which point a certain deviation occurred. The main reason is that reinforcement of the specimens corroded by Cl deteriorated in material properties and the reinforcement constitutive relationship of the fiber model used in FEA cannot simulate this effect.

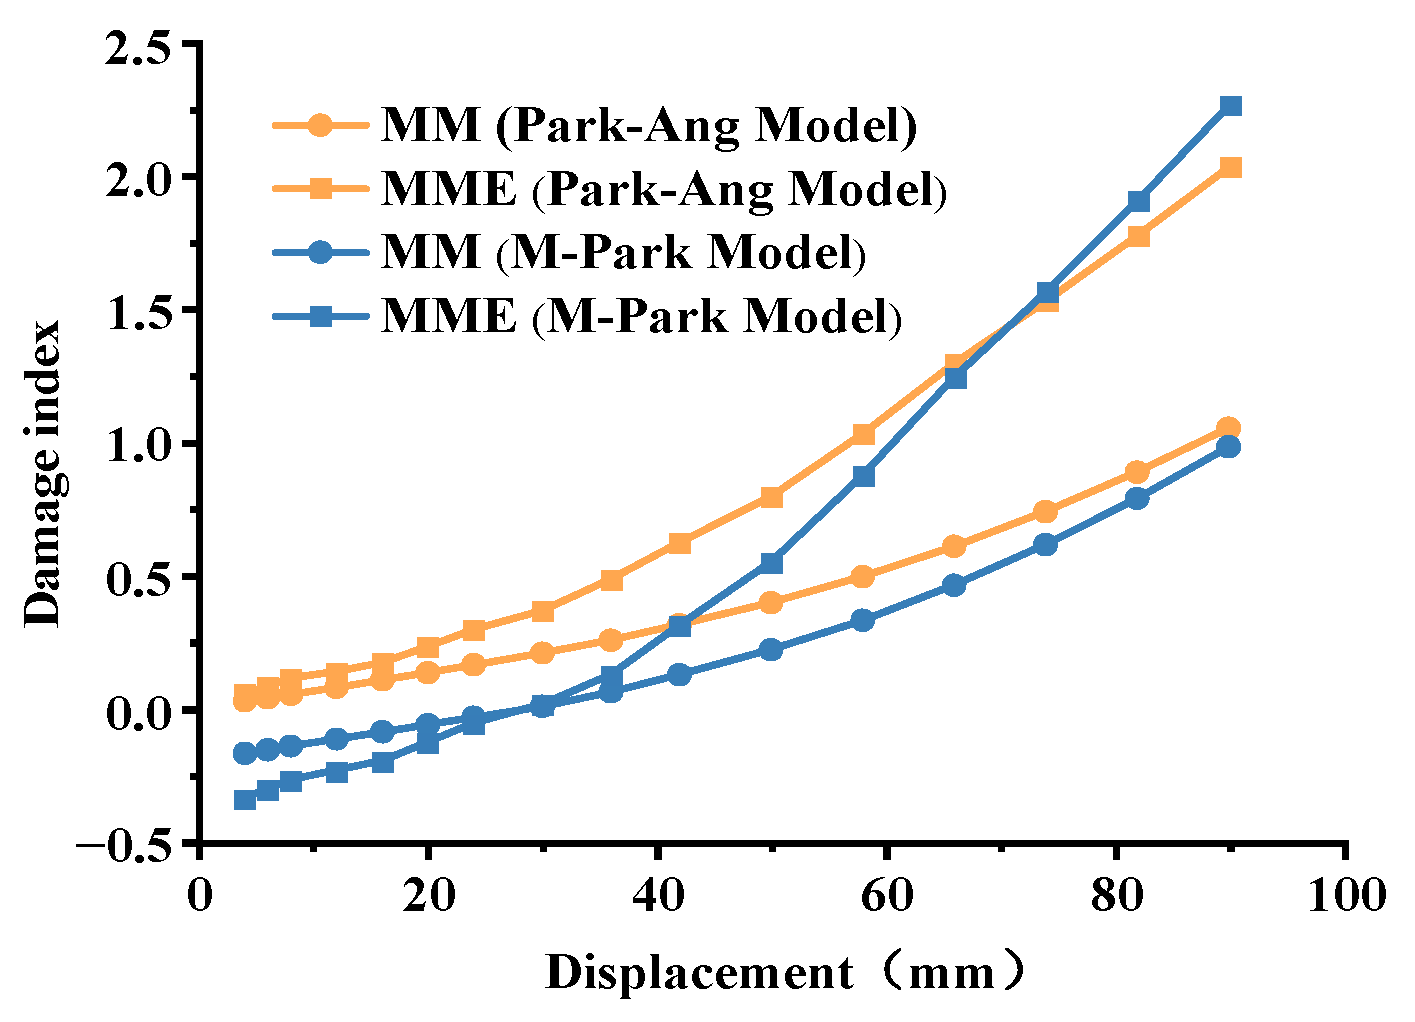
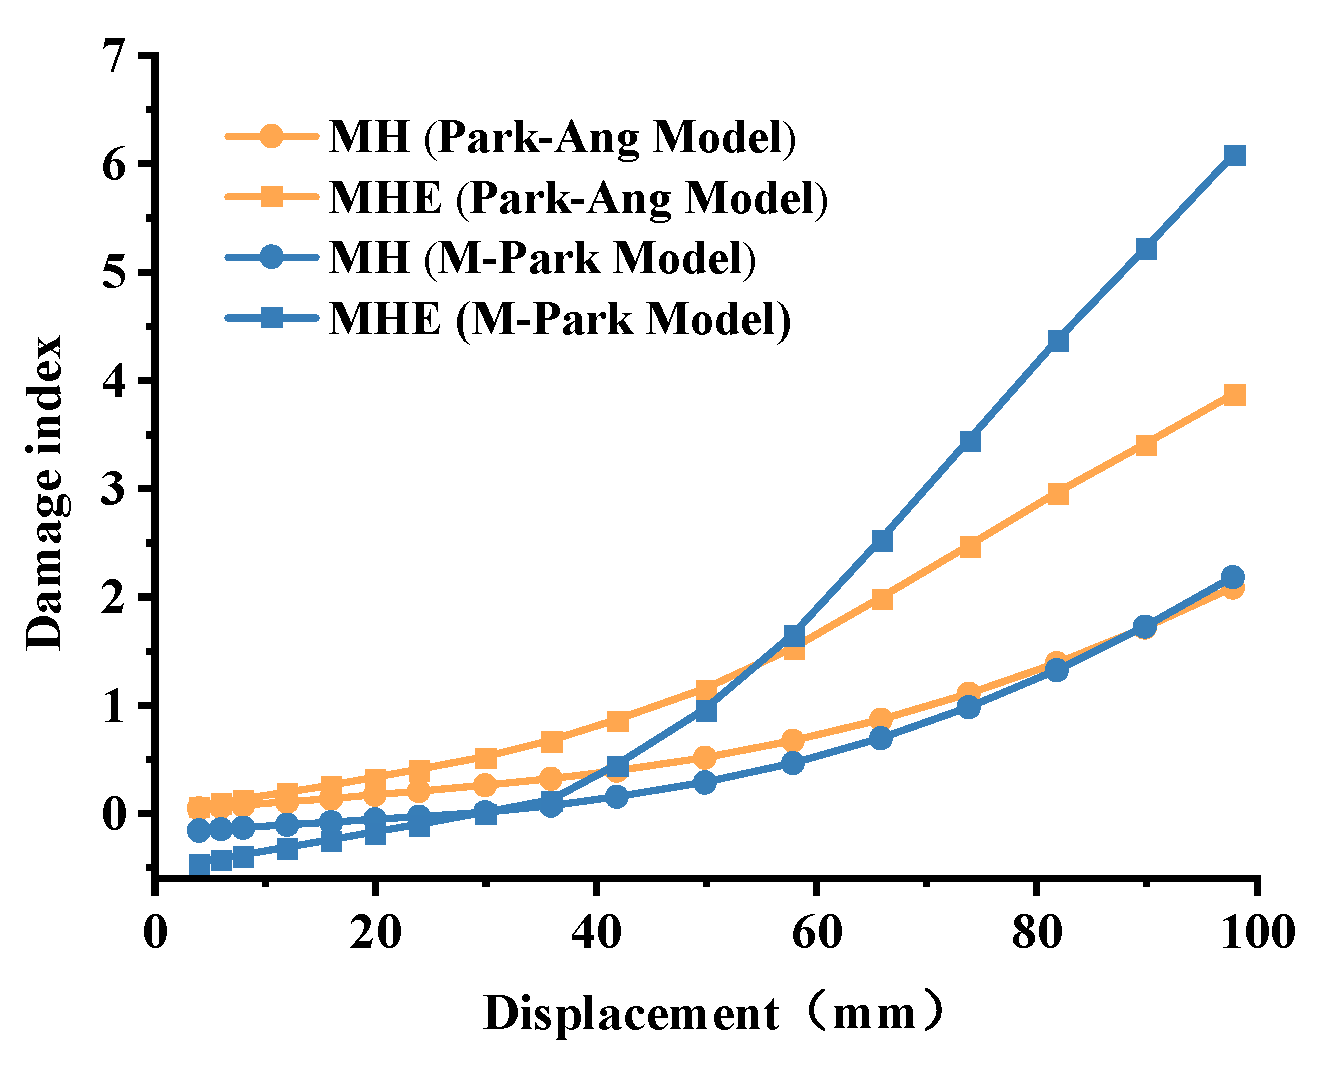
3.4. Two-Parameter Seismic Damage Index

The damage model with a single parameter that either considers displacement or energy dissipation level cannot provide an accurate assessment of the seismic performance of a structure. Therefore, a damage model with two seismic parameters which simultaneously considers the influence of the maximum deformation and the corresponding energy dissipation level on structural failure is put forward.
Based on the Park-Ang model [55,56], which is a damage model considering a linear combination of displacement deformation and hysteretic energy dissipation, the damage indicators of specimens with different column heights and different reinforcement ratios were calculated as Equations (18) and (19).
D = δ m δ u + β d ε Q y δ u
β = ( 0.447 + 0.073 λ + 0.24 n o + 0.314 p t ) × 0.7 ρ w
where δ m is the maximum deformation of the structure or component under seismic action; δ u is the ultimate deformation of the structure under monotonic loading; Q y is the yield strength of the structure or component; d ε is the cumulative demurrage energy dissipation; β is the combination parameter with a value between 0 and 0.85; λ is the shear span ratio, when λ < 1.7 take 1.7; n o is the ratio of axial compression stress to strength, when n o < 0.2 take 0.2; p t is the ratio of longitudinal rebar, when p t < 0.75 % take 0.75%; and ρ w is the ratio of volume stirrup.
In addition, The Park-Ang model is more accurate for larger ductility coefficients, while the damage model is prone to errors due to underestimation of the ultimate energy dissipation level of the component in quasi-static tests at small and medium displacements. Therefore, to improve the reliability of calculated results, Park-Ang model and the improved Park-Ang model (M-Park model) at small and medium displacements were considered comprehensively. The M-Park model is as follows [57].
D = ( 1.0 β ) δ m δ y δ u δ y + β β i E i Q y ( δ u δ y )
β i = { γ E μ i μ o γ E + μ i μ o μ p μ o ( 1.0 γ E ) μ i > μ o
where δ y is the yield displacement of the structure or component; E i is the area enclosed by the i -th hysteresis circle; β i is the weighting factor for energy term related to the loading path; and γ E is the energy equivalent coefficient.
Combined with the results obtained from simulation, including the level of energy consumption as well as the capacity of displacement and bearing of components in the yield state and ultimate state, a comparison of seismic performance was carried out. Based on the two damage models of Park-Ang and M-Park, the damage degree of columns under seismic action was evaluated, from which the damage indexes of specimens LL, LLE, MM, MME, MH, and MHE before and after corrosion could be obtained, as shown in Figure 35, Figure 36 and Figure 37.
The analysis and summarization of the Park-Ang damage model and modified M-Park damage model revealed the fitting accuracy between the variation in damage degree of columns derived from the test and the results of the two-parameter seismic damage model were satisfactory. The damage index calculated by the M-Park damage model was smaller than that calculated by the Park-Ang damage model at small displacement, and larger than that calculated by the Park-Ang damage model at large displacement.
From the perspective of durability, the Cl corrosion played a non-negligible role on the ability of column to resist seismic load and the damage after its own dynamic response. It is clear from the curves of two damage models for specimens LL and LLE that the Cl corrosion aggravated the damage indicators of column, which grew linearly with the increase of horizontal displacement and both were twice as high as the damage index of column in normal conditions. The damage curves of specimens MM, MME, LL, and LLE showed that the ductility of column increased with the growth of column height. In the case of small displacement, the impact of corrosion on the weakening of seismic performance of the column was relatively small. When the displacement was greater than 40 mm, the damage model index of the column in corrosive conditions ascended sharply and could be up to twice the damage index of the column in normal conditions at the peak of displacement. Excessive reinforcement ratio will lead to a significant increase in stiffness of the column and a reduction in its ductility. The MH column, although with a good level of dissipated energy, suffered from premature cracking of concrete and spalling of the protective layer compared with the MM column, which in turn exacerbated damage to the column. As a result, for the two-parameter seismic damage index, the specimen with middle height and medium reinforcement ratio could better take the deformation and energy dissipation into account simultaneously among the three types of specimens. Owing to the corroded effect of Cl on reinforcement, the weakening and deterioration of the reinforcement section in the plastic hinge area of the column with a high reinforcement ratio was more severe, which resulted in a gradual decline of the maximum allowable displacement of the column in corroded conditions with the growth of the reinforcement ratio. That is, necessary precautions ought to be taken against the harsh conditions for columns with high reinforcement ratios.

4. Conclusions

For the joint action of scour and earthquake, the analysis method to obtain sub-factors of the action with reasonable consideration of joint hazards was proposed. Furthermore, the effect of Cl corrosion on seismic performance of bridge columns was investigated by conducting pseudo-static tests on three groups of reinforced concrete columns. The specific conclusions are as follows:
(1)
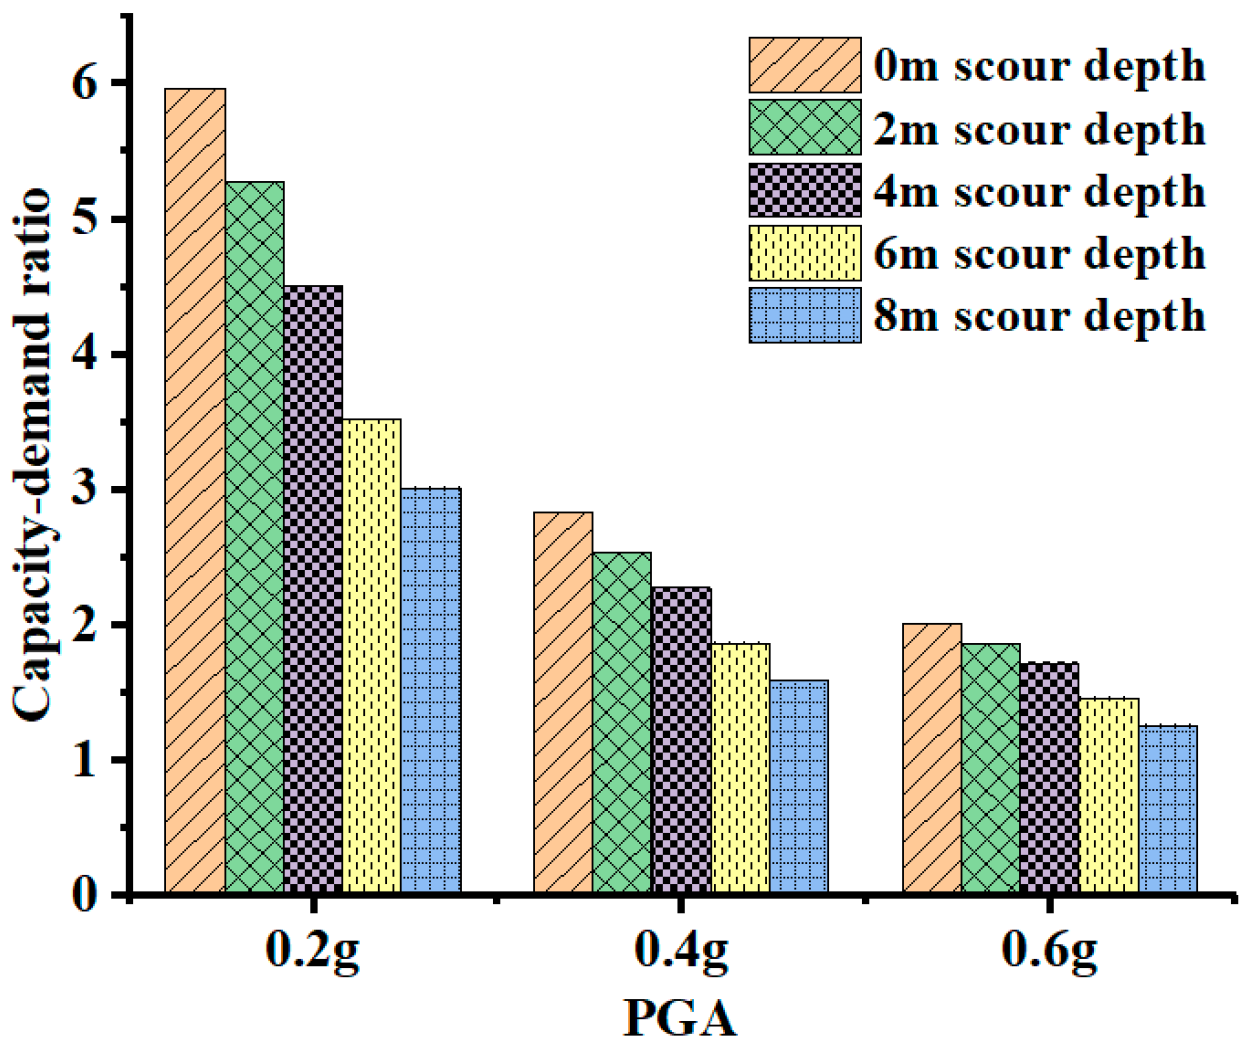
The restraining effect of soil on the pile foundation was weakened due to scour action. It was found that the fragility of bridge columns decreased while the fragility of pile foundation increased with the increase of scour depth. The non-linear relationship between scour depth and failure probability of pile foundation could be determined by vulnerability analysis under the combined action of scour and earthquake.
(2)
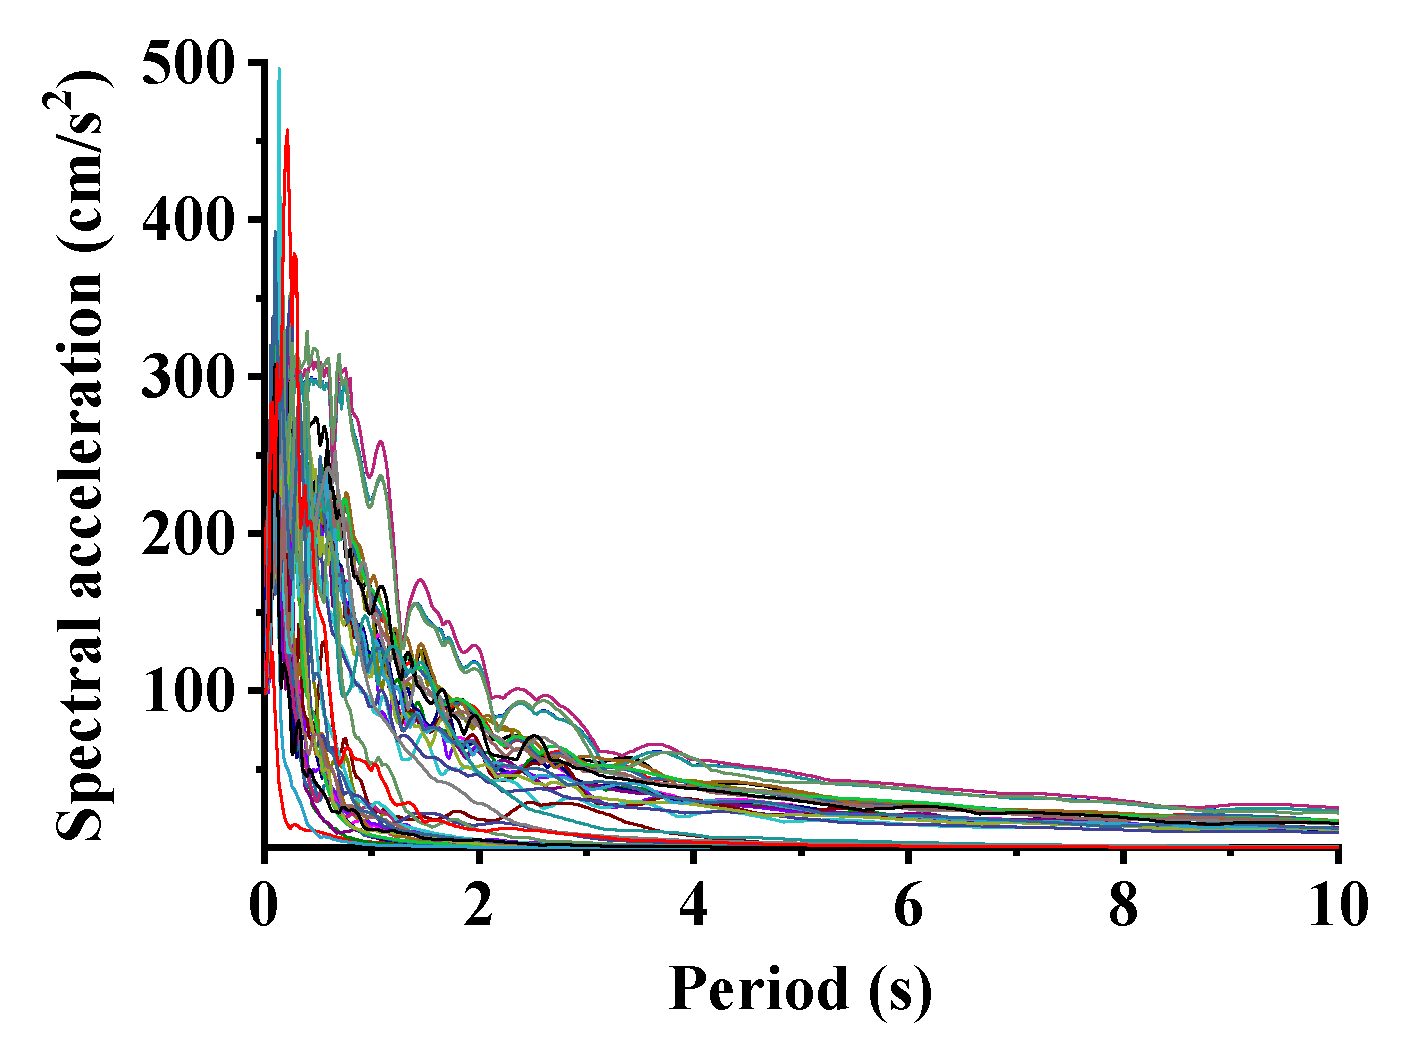
The distribution of PGA corresponding to basic intensity of earthquake in the bridge site area was studied, according to which the distribution of seismic effect could finally be determined. The IDA curve of the seismic effect was established. Both a quantitative description of seismic input and a definite functional expression for the output of the seismic effect could be achieved.
(3)
The joint distribution of scour depth and seismic failure probability was established to determine the reasonable scour depth. The sub-factor considering the combination of scour action was calculated so that the combined expression for the joint action could be obtained as shown in Equation (16).
(4)
Strength and bulk stability of the concrete were affected by Cl corrosion as the result of severe corrosion of the reinforcement, which had a serious impact on the performance and durability of the reinforced concrete columns.
(5)
Cl corrosion caused a remarkable reduction in yield resistance, peak resistance, and ultimate resistance of columns. A decrease of 56.35%, 88.01%, and 75.2% in cumulative hysteretic energy dissipation of columns at ultimate displacement occurred, respectively, due to Cl corrosion. The equivalent viscous damping coefficient of corroded columns was always greater than the corresponding un-corroded columns before ultimate displacement. At the same stage, plasticity development of the corroded columns was larger, which indicates that corroded columns were more prone to damage.
(6)
Ductility properties of medium-high columns with medium and high reinforcement ratios could be significantly weakened by Cl corrosion, whose displacement ductility coefficients dropped by 41.56% and 46.85%, respectively. For columns with low reinforcement ratios and low heights, the displacement ductility coefficient increased by 3.91% while the hysteresis loop area shrunk by 56.35%, which indicated that there is a limitation in judging seismic performance of columns by ductility coefficient only.
(7)
Through the two-parameter model, it was found that the aggravation degree of seismic damage on columns caused by Cl corrosion rose linearly with the increase of displacement, which eventually resulted in the damage index of corroded columns growing to twice that of the uncorroded columns at ultimate displacement. Indexes of displacement and energy dissipation should be taken into account in selecting reinforcement ratio for ductile columns simultaneously.
The bridge type in the project on which this paper is based is relatively homogeneous, which limits the investigation to summarizing the influence of the combination of subfactors on the seismic design condition effects of different bridge types. The quantitative analysis of the coupling between scour and erosion, for instance, the effect of the increased eroded area due to scour on the seismic performance of the bridge substructure, is one of the areas to be further investigated in future studies.

Author Contributions

Conceptualization, M.Z. and S.Y.; methodology, G.Z.; software, J.F.; validation, M.Z., S.Y., G.Z. and J.F.; formal analysis, M.Z. and S.Y.; investigation, M.Z., S.Y., G.Z. and J.F.; resources, M.Z.; data curation, G.Z.; writing—original draft preparation, S.Y.; writing—review and editing, M.Z. and G.Z.; visualization, M.Z. and S.Y.; supervision, M.Z.; project administration, M.Z.; funding acquisition, M.Z. All authors have read and agreed to the published version of the manuscript.

Funding

This work was supported by the National Natural Science Foundation of China (51978062); National Key R&D Program of China (2021YFB1600300); Natural Science Basic Research Program of Shaanxi-Joint Fund Program (2021JLM-47); Supported by the Fundamental Research Funds for the Central Universities, CHD (300102212209).

Conflicts of Interest

The authors declare no conflict of interest.

References

  1. Koks, E.E.; Rozenberg, J.; Zorn, C.; Tariverdi, M.; Vousdoukas, M.; Fraser, S.A.; Hall, J.W.; Hallegatte, S. A global multi-hazard risk analysis of road and railway infrastructure assets. Nat. Commun. 2019, 10, 2677. [Google Scholar] [CrossRef] [PubMed] [Green Version]
  2. Lee, G.C.; Tong, M.; Yen, W.P. Design of Highway Bridges Against Extreme Hazard Events: Issues, Principles and Approaches; MCEER, University at Buffalo, State University of New York, the United States of America: Buffalo, NY, USA, 2008. [Google Scholar]
  3. Ettouney, M.M.; Alampalli, S.; Agrawal, A.K. Theory of multihazards for bridge structures. Bridge Struct. 2005, 1, 281–291. [Google Scholar] [CrossRef]
  4. Wen, Y.K. Minimum lifecycle cost design under multiple hazards. Reliab. Eng. Syst. Saf. 2001, 73, 223–231. [Google Scholar] [CrossRef]
  5. Adey, B.; Hajdin, R.; Brühwiler, E. Risk-based approach to the determination of optimal interventions for bridges affected by multiple hazards. Eng. Struct. 2003, 25, 903–912. [Google Scholar] [CrossRef] [Green Version]
  6. Liu, C.Q.; Fang, D.J.; Zhao, L.J. Reflection on earthquake damage of buildings in 2015 Nepal earthquake and seismic measures for post-earthquake reconstruction. Structures 2021, 30, 647–658. [Google Scholar] [CrossRef]
  7. Liu, C.Q.; Fang, D.J.; Yan, Z.X. Seismic fragility analysis of base isolated structure subjected to near-fault ground motions. Period. Polytech. Civ. Eng. 2021, 65, 768–783. [Google Scholar] [CrossRef]
  8. Crespi, P.; Zucca, M.; Longarini, N.; Giordano, N. Seismic assessment of six typologies of existing RC bridges. Infrastructures 2020, 5, 52. [Google Scholar] [CrossRef]
  9. Causevic, M.; Mitrovic, S. Comparison between non-linear dynamic and static seismic analysis of structures according to European and US provisions. Bull. Earthq. Eng. 2011, 9, 467–489. [Google Scholar] [CrossRef]
  10. Valente, M.; Milani, G. Alternative retrofitting strategies to prevent the failure of an under-designed reinforced concrete frame. Eng. Fail. Anal. 2018, 89, 271–285. [Google Scholar] [CrossRef]
  11. Ma, Y.; Che, Y.; Gong, J.X. Behavior of corrosion damaged circular reinforced concrete columns under cyclic loading. Constr. Build. Mater. 2012, 29, 548–556. [Google Scholar] [CrossRef]
  12. Ma, Y.; Wang, D.S.; Cheng, H.; Shi, Y. Bayesian theory-based seismic failure modes identification of reinforced concrete columns. J. Earthq. Eng. 2021, 1–12. [Google Scholar] [CrossRef]
  13. Zhou, M. Design Methods for Extreme Loads on Bridges with High Pile Bearing Systems; Jilin University Press: Changchun, China, 2018. [Google Scholar]
  14. You, D.; Dan, M.F.; Duygu, S. Time variation sustainability assessment of seismically vulnerable bridges to multiple hazards. Earthq. Eng. Struct. Dyn. 2013, 42, 1451–1467. [Google Scholar]
  15. Prasad, G.G.; Banerjee, S. The impact of flood–induced scour on seismic fragility characteristics of bridges. J. Earthq. Eng. 2013, 17, 803–828. [Google Scholar] [CrossRef]
  16. Wang, Z.H.; Leonardo, D.O.; Jamie, E.P. Influence of scour effects on the seismic response of reinforced concrete bridges. Eng. Struct. 2014, 76, 202–214. [Google Scholar] [CrossRef]
  17. Yang, Y.K.; Ma, R.J.; Chen, A.R. Risk-based reasonable scouring depth for multi-hazard bridges. J. South China Univ. Technol. 2016, 44, 103–109. [Google Scholar]
  18. Zhao, S.C. Failure probability analysis of steel concrete bridge durability induced by chloride ingress compared with that by concrete carbonization in marine environment. Highway 2008, 4, 163–166. [Google Scholar]
  19. Liu, X.L. Fundamental research on safety and durability of major structures in civil and hydraulic engineering. China Civ. Eng. J. 2001, 34, 1–7. [Google Scholar]
  20. Zhang, W.; Niu, D.T.; Li, Q. Stirrups corrosion of concrete column with axial compression for numerical simulation. Build. Sci. Res. Sichuan 2013, 39, 94–97, 111. [Google Scholar]
  21. Zhang, W.P.; Shang, D.F.; Gu, X.L. Study on stress-strain relationship of corroded reinforcement. J. Tongji Univ. Nat. Sci. 2006, 34, 586–592. [Google Scholar]
  22. Ou, Y.C.; Nguyen, N.D. Influences of location of reinforcement corrosion on seismic performance of corroded reinforced concrete beams. Eng. Struct. 2016, 126, 210–223. [Google Scholar] [CrossRef]
  23. Ou, Y.C.; Susanto, Y.T.T.; Roh, H. Tensile behavior of naturally and artificially corroded steel bars. Constr. Build. Mater. 2016, 103, 93–104. [Google Scholar] [CrossRef]
  24. Simon, J.; Bracci, J.M.; Gardoni, P. Seismic response and fragility of deteriorated reinforced concrete bridges. J. Struct. Eng. 2010, 136, 1273–1281. [Google Scholar] [CrossRef]
  25. Ghosh, J.; Padgett, J.E. Aging considerations in the development of time-dependent seismic fragility curves. J. Struct. Eng. 2011, 136, 1497–1511. [Google Scholar] [CrossRef]
  26. Biondini, F.; Camnasio, E.; Palermo, A. Lifetime seismic performance of concrete bridges exposed to corrosion. Struct. Infrastruct. Eng. 2014, 10, 880–900. [Google Scholar] [CrossRef]
  27. Guo, A.; Yuan, W.; Lan, C.; Guan, X.; Li, H. Time-dependent seismic demand and fragility of deteriorating bridges for their residual service life. Bull. Earthq. Eng. 2015, 13, 2389–2409. [Google Scholar] [CrossRef]
  28. Sun, Y.Z.; Niu, D.T.; Jiang, L. Analysis of sulfate attack damage of concrete under dry and wet cycling conditions. Silic. Bull. 2013, 7, 1405–1409. [Google Scholar]
  29. Zhao, G.F.; Jin, W.L.; Gong, J.X. Structural Reliability Theory; China Building Industry Press: Beijing, China, 2000. [Google Scholar]
  30. Wang, S.H.; Zhang, H.X.; Zhou, M. Model of bridge pile-soil dynamic interaction in sandy area. Road Mach. Constr. Mech. 2018, 35, 94–101. [Google Scholar]
  31. Rneso, L.A.; Zevenbe, R.L.W.; Lagasse, P.F. Evaluating Scour at Bridge; Department of Transportation Federal Highway Administration: Washington, DC, USA, 2012. [Google Scholar]
  32. Johnson, P.A.; Dock, D.A. Probabilistic bridge scour estimates. J. Hydraul. Eng. 1998, 124, 750–754. [Google Scholar] [CrossRef]
  33. Liu, H.L. Research on software for moment-curvature analysis of sections of arbitrary reinforced concrete. J. Highw. Transp. Res. Dev. 2015, 31, 69–73. [Google Scholar]
  34. GB50011-2010; Seismic Design Code for Buildings. China Construction Industry Press: Beijing, China, 2016.
  35. American Petroleum Institute. API Recommended Practice for Planning, Designing and Constructing Fixed Offshore Platforms; American Petroleum Institute: Washington, DC, USA, 1977. [Google Scholar]
  36. Feng, Q.H. Analysis of Seismic Vulnerability and Risk Probability of Super-Large Bridges; Tongji University: Shanghai, China, 2008. [Google Scholar]
  37. Gao, X.W.; Bao, Y.B. Probability model of earthquake action and its statistical parameters. Earthq. Eng. Eng. Vib. 1985, 1, 13–22. [Google Scholar]
  38. Ellingwood, B.; Galambos, T.V.; Macgregor, J.G.; Cornell, C.A. Development of a Probability-Based Load Criterion for American National Standard A58: Building Code Requirements for Minimum Design Loads in Buildings and Other Structures; National Bureau of Standards: Washington, DC, USA, 1980. [Google Scholar]
  39. Wen, Y.K. A clustering model for correlated load processes. ASCE J. Struct. Eng. 1981, 107, 965–983. [Google Scholar] [CrossRef]
  40. Zhang, M. Structural Reliability Analysis-Methods and Procedures; Science Press: Beijing, China, 2009. [Google Scholar]
  41. Chen, J.; Pan, Q.Q.; Wang, W.X. Matlab implementation of monte-carlo method for reliability in box girder construction. J. Chongqing Technol. Bus. Univ. 2011, 28, 90–93. [Google Scholar]
  42. Liu, L.D.; Yan, Q.S.; Li, J.W.; Wang, X.W. Analysis of seismic vulnerability of single tower cable-stayed bridge based on incremental dynamic analysis method. Railw. Constr. 2018, 58, 17–21. [Google Scholar]
  43. Yang, K.; Tian, S.Z.; Zhang, C. Evaluation of RC frame structure collapses based on IDA method. Build. Struct. 2018, 48, 106–109. [Google Scholar]
  44. Zhao, R.D.; Gao, N.; Jia, Y.; Qiu, X.L. Analysis of seismic vulnerability of long-span continuous beam bridge based on IDA. J. Shenyang Jianzhu Univ. 2017, 33, 672–679. [Google Scholar]
  45. GB/T 50283-1999; Uniform Standards for Structural Reliability Design for Highway Engineering. China Planning Press: Beijing, China, 1999.
  46. Leeg, C.; Rzhevsky, V. From the WTC Tragedy to the Development of Disaster Engineering for Landmark Buildings—An Extension of the Performance-Based Earthquake Engineering Approach: MCEER-03-SP04; University at Buffalo, State University of New York, the United States of America: Buffalo, NY, USA, 2003. [Google Scholar]
  47. Caltrans Seismic Design Criteria Version 1.6; California Department of Transportation: Sacramento, CA, USA, 2010.
  48. American Association of State Highway and Transportation Officials. AASHTO LRFD Bridge Design Specifications; Customary U.S. Unit; American Association of State Highway and Transportation Officials: Washington, DC, USA, 2012. [Google Scholar]
  49. Specifications for Seismic Design of Highway Bridges; Ministry of Transport of the People’s Republic of China: Beijing, China, 2020.
  50. Code for Seismic Design of Urban Rail Transit Structures; Ministry of Housing and Urban-Rural Development of the People’s Republic of China: Beijing, China, 2014.
  51. Yin, S.P.; Li, Y.; Li, H.D.; Peng, C. Axial compression performance of reinforced concrete column strengthened with TRC under chloride dry-wet cycles. China J. Highw. Transp. 2017, 30, 230–238. [Google Scholar]
  52. Filippou, F.C.; Popov, E.P.; Bertero, V.V. Effects of Bond Deterioration on Hysteretic Behavior of Reinforced Concrete Joints; Report EERC 83-19; Earthquake Engineering Research Center, University of California, Berkeley: Berkeley, CA, USA, 1983. [Google Scholar]
  53. Mohd, H.M.Y. Nonlinear Analysis of Prestressed Concrete Structures under Monotonic and Cycling Loads; University of California, Berkeley: Berkeley, CA, USA, 1994. [Google Scholar]
  54. Lei, C.; Fang, C.Q.; Hu, R.; Yang, S.; Xue, W. Corrosive crack analysis of reinforced concrete columns under wet-dry cycles and corrosive environment. Concrete 2017, 6, 24–27. [Google Scholar]
  55. Park, Y.J.; Ang, H.S. Mechanistic Seismic Damage Model for Reinforced Concrete. J. Struct. Eng. ASCE 1985, 111, 722–739. [Google Scholar] [CrossRef]
  56. Zhu, H.B.; Miao, C.Q.; Bai, L.T.; Shao, Y.F. Park-Ang damage correction model for reinforced concrete columns with low cycle fatigue damage effect. J. Southeast Univ. 2020, 50, 71–80. [Google Scholar]
  57. Wang, D.S.; Feng, Q.M.; Wang, G.X. An improved Park-Ang earthquake damage model with low cycle fatigue life. Chin. J. Civ. Eng. 2004, 37, 41–49. [Google Scholar]
Figure 1. Schematic diagram of solving the failure probability by means of direct integration.
Applsci 12 06680 g001
Figure 2. Finite element model of the example bridge.
Applsci 12 06680 g002
Figure 3. Function of probability density fitting for scour depth.
Applsci 12 06680 g003
Figure 4. Average value of the combined effects of seismic load and constant load on pier in the longitudinal direction.
Applsci 12 06680 g004
Figure 5. Average value of the combined effects of seismic load and constant load on pier in the transverse direction.
Applsci 12 06680 g005
Figure 6. Average value of combined effects of seismic load and constant load on No. 1 pile foundation in longitudinal direction.
Applsci 12 06680 g006
Figure 7. Average value of the combined effects of seismic load and constant load on the No. 1 pile foundation in the transverse direction.
Applsci 12 06680 g007
Figure 8. Average value of combined effects of seismic load and constant load on the No. 2 pile foundation in the longitudinal direction.
Applsci 12 06680 g008
Figure 9. Average value of the combined effects of seismic load and constant load on the No. 2 pile foundation in the transverse direction.
Applsci 12 06680 g009
Figure 10. Bending moment of the No. 1 pile foundation in the longitudinal direction at different scour depths.
Applsci 12 06680 g010
Figure 11. Capacity-demand ratio in the bending moment of the No. 1 pile foundation in the longitudinal direction.
Applsci 12 06680 g011
Figure 12. Bending moment of the No. 1 pile foundation in the transverse direction at different scour depths.
Applsci 12 06680 g012
Figure 13. Capacity-demand ratio in the bending moment of the No. 1 pile foundation in the transverse direction.
Applsci 12 06680 g013
Figure 14. Response spectra of 48 time-history curves (PGA = 0.1 g).
Applsci 12 06680 g014
Figure 15. IDA curve of seismic action under different scour conditions.
Applsci 12 06680 g015
Figure 16. Cumulative probability density function fitting for the seismic bending moment of the pile foundation in the transverse direction under different scour depths.
Applsci 12 06680 g016
Figure 17. Relationship between scour depth and failure probability of the seismic action of the pile foundation.
Applsci 12 06680 g017
Figure 18. Relationship between scour depth and reliability index of the seismic action of the pile foundation.
Applsci 12 06680 g018
Figure 19. Schematic diagram of the quasi-static test.
Applsci 12 06680 g019
Figure 20. Schematic diagram of the column model.
Applsci 12 06680 g020
Figure 21. Damage pattern in the plastic hinge region of column specimens: (a) LL, (b) LLE, (c) MM, (d) MME, (e) MH, and (f) MHE.
Applsci 12 06680 g021
Figure 22. Comparison of load–displacement curves for rebars before and after Cl corrosion.
Applsci 12 06680 g022
Figure 23. Comparison of load–displacement curves between specimens LL and LLE.
Applsci 12 06680 g023
Figure 24. Comparison of load–displacement curves between specimens MM and MME.
Applsci 12 06680 g024
Figure 25. Comparison of load–displacement curves between specimens MH and MHE.
Applsci 12 06680 g025
Figure 26. Comparison of skeleton curves between specimens LL and LLE.
Applsci 12 06680 g026
Figure 27. Comparison of skeleton curves between specimens MM and MME.
Applsci 12 06680 g027
Figure 28. Comparison of skeleton curves between specimens MH and MHE.
Applsci 12 06680 g028
Figure 29. Comparison of energy dissipation–displacement curves of specimens.
Applsci 12 06680 g029
Figure 30. Comparison of equivalent viscous damping coefficient–displacement curves for specimens.
Applsci 12 06680 g030
Figure 31. Comparison of hysteresis curves between FEA and test for specimen LL.
Applsci 12 06680 g031
Figure 32. Comparison of hysteresis curves between FEA and test for specimen LLE.
Applsci 12 06680 g032
Figure 33. Comparison of hysteresis curves between FEA and test for specimen MH.
Applsci 12 06680 g033
Figure 34. Comparison of hysteresis curves between FEA and test for specimen MHE.
Applsci 12 06680 g034
Figure 35. Comparison of damage indicators between specimens LL and LLE.
Applsci 12 06680 g035
Figure 36. Comparison of damage indicators between specimens MM and MME.
Applsci 12 06680 g036
Figure 37. Comparison of damage indicators between specimens MH and MHE.
Applsci 12 06680 g037
Table 1. Probability distribution of scour depth parameters.
VariableAverage ValueCoefficient of VariationProbability Distribution
λ s 0.570.6Normal distribution
K 2 10.05
K 3 1.10.05
Table 2. Dynamic characteristics of the bridge model.
OrderPeriod of Vibration/sFrequency/HzVibration Mode
10.792881.26122Longitudinal drift of main beam and longitudinal vibration of main pier
20.765761.30589Lateral bending of main beam and transverse bending of main pier
30.6321.58227Lateral bending of main beam and transverse positive symmetrical bending of main pier
40.625161.59958Lateral bending of main beam and transverse antisymmetric bending of main pier
50.581521.71962Lateral bending of main beam and longitudinal antisymmetric vibration of main pier
Table 3. Moment resistance value of the pile foundation section.
Average Value μ R / ( kN · m ) Standard Deviation σ R / ( kN · m ) Probability Distribution
33,548.84743.8Lognormal distribution
Table 4. The design parameters of the quasi-static test and column specimen.
Specimen NumberDiameter/mHeight of Column/mLongitudinal Reinforcement RatioConcrete TypeRebar TypeScale RatioRatio of Axial Compression Stress to StrengthThickness of Protective Layer/mm
LL0.241.41.50%C40HRB3351:6.250.05720
LLE0.241.41.50%C40HRB3351:6.250.057
MM0.241.83.55%C40HRB4001:8.330.071
MME0.241.83.55%C40HRB4001:8.330.071
MH0.241.85.63%C40HRB4001:8.330.071
MHE0.241.85.63%C40HRB4001:8.330.071
Note: LL stands for the column with low longitudinal reinforcement ratio and low height; LLE stands for the corroded column with low longitudinal reinforcement ratio and low height; MM stands for the column with medium longitudinal reinforcement ratio and medium height; MME stands for the corroded column with medium longitudinal reinforcement ratio and medium height; MH stands for the column with high longitudinal reinforcement ratio and medium height; MHE stands for the corroded column with high longitudinal reinforcement ratio and medium height.
Table 5. Cumulative hysteresis energy consumption of each specimen.
Specimen NumberLLLLEMMMMEMHMHE
Cumulative hysteresis energy consumption (kN·mm)43,936.5119,178.79255,771.1052,148.20308,940.9076,602.51
Publisher’s Note: MDPI stays neutral with regard to jurisdictional claims in published maps and institutional affiliations.

