Abstract
This work describes the design and implementation of a Zero-Length Column system to measure: diffusion coefficients, adsorption isotherm parameters of pure components and mixtures. In addition, a graphical user interface (GUI) was developed in LabVIEW for the semi-automatic operation of the system. The system is novel because it integrates all the aforementioned functionalities without using mass spectrometry. Two adsorbents, zeolite 5A and Basolite® C300 (Copper benzene-1,3,5-tricarboxylate) and two adsorbates methane and ethane were used to perform the validation of adsorption and diffusion experiments. The Henry constants and diffusion coefficients obtained reproduce those previously reported. The combination of the experimental setup and the GUI significantly reduce the amount of sample and measurement time needed in the characterization of the molecular sieves by conventional volumetric and gravimetric systems. The proposed system is relatively inexpensive, robust, easy to build, and capable of reproducing the results of other techniques.
1. Introduction
Any important developments in the area of new materials should be accompanied by the creation of experimental facilities for studying them. The number of new molecular sieves discovered every day has been increasing. Examples include: zeolites [1,2], metal–organic frameworks [3,4,5], mesoporous silicas [6], microporous carbons [7], polymers of intrinsic microporosity [8,9], and metal–organic framework with dual functionalities [1,4]. This rapid growth of the available molecular sieves imposes the challenge of understanding the sorption kinetics and equilibrium of a large number of adsorbates of industrial interest. Multicomponent kinetic and equilibrium data are also of great interest due to the vast number of applications found in separation science and technologies [10,11]. Consequently, the need arises to develop accurate and efficient experimental techniques that allow the comprehensive evaluation of properties often involving a large number of adsorbent samples [12,13].
The inverse chromatography method known as zero-length column (ZLC) was developed as a simple, inexpensive, and time-efficient method for the determination of adsorption kinetics and equilibrium [14]. The ZLC experiment is quick, uses a small sample mass, and provides good accuracy with reliable results on pure and multicomponent systems [15,16,17]. All these features can be combined in a single experimental setup. However, this is not often the case. Most of the reported experimental setups focus on the study of pure gases. Nevertheless, it has been shown that reliable binary adsorption data can be obtained, subject to certain limitations [18]. When they include multicomponent analysis is because they have mass spectrometers that are significantly more expensive. As far as the authors of this work are aware, no design has been reported that provides the possibility of performing ZLC experiments under kinetic and equilibrium conditions for single and multicomponent systems without the use of mass spectrometers.
An alternative to mass spectrometry is gas chromatography (GC). However, the introduction of GC is accompanied by an increased number of elements in the zero-length column (ZLC) system. This makes ZLC experiments a complex task susceptible to errors [19]. To overcome this challenge, the ZLC could be combined with a powerful tool as a graphical user interface (GUI) for setting and manipulating the elements of the systems, which significantly improved experimental times and measurement errors. Nevertheless, no report offers the design of a ZLC system accompanied by a GUI with open source code, allowing the scientific and industrial community to build and automate the system. In addition, the community effort in the development of the GUI could contribute to reducing the implementation costs and performing more complex experiments and analyses.
This research presents the implementation of a semi-automatic ZLC system (hardware and GUI). The instrument can operate under both kinetic and equilibrium conditions and can also deal with multicomponent systems. The analysis in multicomponent systems is performed on GC basis which makes it more cost-effective than the systems commonly used. Experimental run time is remarkably reduced by avoiding degassing processes between experiments. On the other hand, since the same sample can be used to carry out a complete study, the waste of time and resources required for previous characterizations is avoided. This latter issue is of great relevance in the case of novel prototype materials for which no large sample volume is available. In addition, the same sample for all experiments avoids sampling errors.
2. Mathematical Model of ZLC
Basic theory of ZLC has been extensively discussed in previous contributions [14] and references therein. However, the introduction of the equations to be used later may facilitate the understanding of the analyses performed. That is why we will introduce them in this section.
For a linear equilibrium system, perfectly mixed, with uniform spherical particles of radius R and negligible gas hold-up in the voids of the ZLC bed, the relative concentration of effluent gas as a function of time is given by [20]:
where: is the concentration at any time t, is the initial concentration, D is the diffusion coefficient, is one-third of the ratio of the accumulation in the fluid phase relative to that of the adsorbed phase:
is the mobile phase volume, is the volume of the solid bed, K is the dimensionless Henry’s law constant, L is the time constant ratio:
F is the interstitial gas velocity and is given by the roots of the auxiliary equation:
For gaseous systems and the effect of extra particle retention is negligible [21,22]. In the limit when tends to zero, the parameter L is also the maximum dimensionless gradient of concentration inside the particle and determines in which mode the ZLC is operated. When the solid is effectively at equilibrium with the fluid while for the response is controlled by kinetics inside the particle. Further details about the theory describing the ZLC experiment are given in the supplementary information.
3. Design and Operation of the ZLC
A semi-automatic ZLC system was built to perform desorption experiments under kinetic and equilibrium conditions of pure components and mixtures. The system is composed of a first stage that supplies high purity gases to a gas mixer through drying columns. The mixture obtained is dosed to two 4-way and 6-way electrical switching valves located inside a gas chromatograph, in which the ZLC and the semi-capillary column are placed. In addition, two 3-way ball valves with L-shaped holes (P1 and P2) are required, which operate in positions A and B, respectively. The devices and the chromatograph are controlled by a personal computer via a data acquisition card and LabView version 14.0 from National Instrument (Austin, TX, USA). Once the operator has set up the experiment, the system can run and acquire data automatically. A complete schematic diagram of the experimental setup is shown in Figure 1.
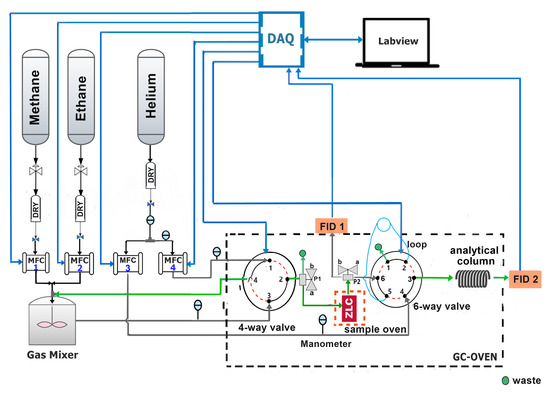
Figure 1.
Schematic drawing of the semi-automatic experimental apparatus to determine: diffusion coefficients and adsorption isotherms of pure gases and mixtures.
The main component of the system is the zero-length column, which consists of a Swagelok joint of , in which a quantity of molecular sieve is packed between two sintered disks of 100 mesh (see Figure 2). This configuration allows performing different experiments after degassing without exposing the sample to the environment. For this purpose, a mini electric oven with a PID controller was incorporated, which heats exclusively the ZLC and reaches temperatures of over 623 . This reduces the experimental times, the amount of sample used, ensures the isothermal conditions in the column and allows degassing of materials demanding higher temperatures than those supported by other elements inside the chromatograph furnace with low working temperature limits.
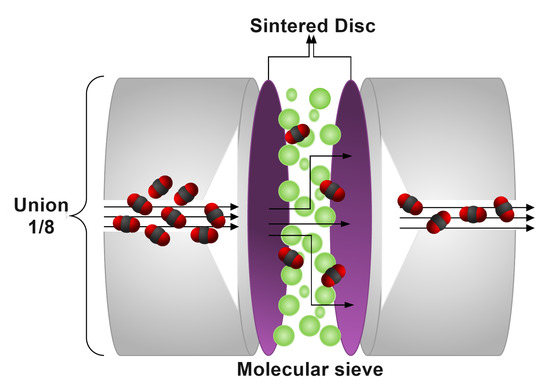
Figure 2.
Schematic diagram of the zero length column.
The small sample size used in the ZLC offers the possibility to determine particle size distribution in an accurate and quick way. Therefore, the complexity in processing the experimental data is reduced, as the determination of particle size distributions is often time-consuming, costly, and can become very complex when crystals are much smaller than 1 [23].
The system also includes a Shimadzu GC-8A gas chromatograph, with two flame ionization detectors (FID-1 and FID-2 in Figure 1). The chromatograph consists of an oven that reaches a maximum temperature of and a signal conditioning stage consisting of a high impedance amplifier with selectable gain and level shifting. The three-way valve P2 allows redirecting the flow at the outlet of the ZLC to the FID-1 or to the flow 6-way selector valve (FSV-6). A standard Restek micro-packed semi-capillary separation column (SCSC) of 1 length and inside diameter was attached to FSV-6 to determine the effluent composition by mean FID-2.
Both the flow 4-way selector valve (FSV-4), model EUH-6C4WT, and the FSV-6, model EUH-6C4WT, were purchased from Vici Valco [24]. They operate in two positions, A and B. Position A is represented by solid black lines and position B by dashed red lines in Figure 1. According to the specifications, the maximum operating temperature indicated is .
The flow rates were controlled by four Horiba Z-500 Mass Flow Controllers (MFCs) (2 for the feed and 2 for the purge) [25]. They operate from 0 to 100 standard cubic centimeter per minute (sccm). Equilibrium and kinetic properties can be then investigated in the same series of experiments, simply using both sets of mass flow controllers. The pressure at each gas line was followed by ConST 211 analog pressure gauge.
The operation of the ZLC starts with the degassing of the sample in the sample oven controlled by PID, this is achieved by switching both selector valves to position B. To determine the diffusion coefficient and adsorption isotherms of pure gas, the 4-way valve is operated in position A to saturate the sample with adsorbate and is switched to position B to record the desorption curve on the FID-1. In this mode of operation, it is not necessary to use the FID-2, so the 6-way valve remains in position B.
For multi-components systems it is necessary to determine the composition of the effluent at the outlet of the SCSC. For this purpose, the FSV-6 is placed in position A and the loop is filled, after a certain time the FSV-6 is returned to position B. In this last position the carrier flows through the loop and injects its contents into the analytical column.The composition of the effluent is recorded in FID-2.
We will dedicate a whole section to binary equilibrium experiments later on, so we will leave the details for that time.
4. Program Design
4.1. Graphical User Interface
A GUI was programmed in LabVIEW software (National Instrument, USA) to perform repeated experiments at different flow rates. A National Instruments USB-6212 card data acquisition (DAQ) with analog inputs/outputs and digital inputs/outputs was used for manipulation and monitoring of the electromechanical devices (MFCs and FSVs) and acquisition of the FID’s signals. Through this GUI it is possible to: configure the measurement routines, enter the experimental parameters, obtain the desorption curves and calculate the adsorption isotherms and diffusion coefficient.
It should be noted that the GUI is designed to work with flame ionization detectors. However, the GUI was designed in such a way that it is scalable, i.e., it allows for new components, such as sensors, detectors, or more complex equipment. In the case of a mass spectrometer, these are generally supplied with their own data acquisition software; nevertheless, they can be configured and manipulated remotely via a physical interface (USB, GPIB, Ethernet connection cable) and a user-designed control program in a LabVIEW programming language.
The functions available on the front panel designed for this paper will be explained according to the numbered blocks showed in Figure 3.
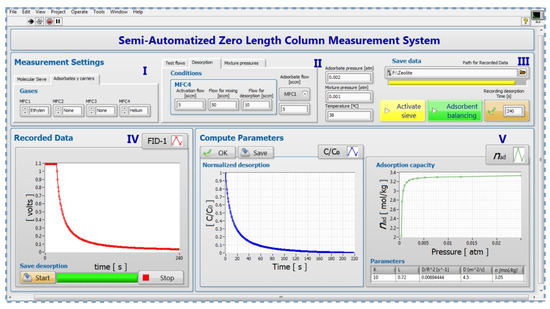
Figure 3.
Labview GUI of semi-automatic experiment setting.
- Block I:
- Consists of two tabs, the first one allows the user to enter the characteristics of the molecular sieve. In the second tab, by means of four control paddles, the study gases are chosen for each mass flow controller.
- Block II:
- It allows the user to configure the conditions for three different work routines: degassing, equilibrium, and desorption process. In this function, the mass flow rates of each MFC for each process are selected. The pressures of pure and mixtures gases are entered by means of numerical indicators. Additionally, the temperature of the chromatography furnace in each process is indicated.
- Block III:
- This block consists of four switches that allow the user to choose which process will be stored, specify the storage path of the measurement parameters and the results obtained, and introduce the frequency of data storage.
- Block IV:
- Plots the raw adsorption and desorption curve in real-time. By means of two switches, the user has the option to start and stop the acquisition of the response graph.
- Block V:
- This block consists of two sections. In the left one, the normalized curve of vs. t is presented. This curve is obtained from the virgin desorption curve (see Section S2 of Supplementary Materials). In the right section, the adsorption capacity vs. p is plotted. In this same section are also calculated: Henry’s constant , time constant ratio , diffusion coefficient , and maximum amount adsorbed . These calculations were performed using equations from Section S2 of the Supplementary Material.
4.2. Data Acquisition and Processing
The code performs a series of actions that guarantee the acquisition of high-quality data and the precise determination of physico-chemical parameters that characterize the adsorbate–adsorbent system under study. This section describes the actions implemented in the code. They also allow the efficient determination of the operating conditions. The actions implemented in the GUI are the following:
- Normalization and extraction of the Signal: The FID signal was recorded continuously through a DAQ card with a sampling rate of 250 samples/second and saved in an Excel file for normalization. The code then normalizes the signal using the Equation (S16) of supplementary information.
- Digital processing of the signal: A digital signal processing stage is applied to the normalized desorption response. In this step, high-frequency fluctuations of the ZLC curve are reduced through a smoothing average filter with a 1000 sample window and a translation in time for compensating the effects of the smoothing filter. The sample window can be modified by the user.
- Linear regression in the long time domain: The linear region of desorption curve log-linear representation is fitted by the least-squares method and the slope and intercept are estimated. The criterion for determining the beginning of the linear region was as follows. The derivative of the ZLC curve is obtained and the beginning of the linear domain is identified with the point whose slope is a certain percent of the maximum of the derivative curve. This percentage can be chosen by the user and in this work it was 5%.
- Determination of kinetic and equilibrium parameters: The time constant ratio is calculated from the intercept calculated above. If this parameter is greater than 1, then the diffusion time constant is estimated from the slope also calculated previously. Otherwise, the slope allows to estimate Henry’s constant (see Section S2.2 of the Supplementary Materials). To achieve the condition of it is necessary to perform experiments at different flow rates. The GUI allows the identification of kinetic conditions in an efficient way by reducing analysis times.
5. Materials and Methods
Two samples were used to test the performance of the ZLC system: zeolite 5A and Basolite® C300. Zeolite 5A was obtained from Sigma–Aldrich (CAS number 69912-79-4 with the molecular formula: , and a particle diameter less than 10 μm. The Basolite® C300 (Copper benzene-1,3,5-tricarboxylate) was produced by BASF and distributed by Sigma-Aldrich with a particle diameter of 75 μm. The results of the characterization of the adsorbents with analytical techniques, as well as other characteristics reported by the suppliers, can be found in the Supplementary Materials.
To pack the ZLC, a sintered disk was inserted in one extreme of the inches Swagelok junction. A mass sample from 5 mg to 15 mg was packed. To ensure that the sample does not escape into the chromatograph, the other side of the column was sealed with a second disk. Finally, the junction was placed inside the GC-8A oven to continue with the degassing procedure.
Before each experiment, the samples must be degassed to remove water molecules in the adsorbent. This experimental setup allows the sample to be regenerated and tested avoiding any contact with ambient humidity. During the regeneration, the temperature is slowly increased from room temperature to a temperature that allows complete dehydration with no damage to the sample. The adsorbents were degassed for 1 at 10 of Helium 6.0 from Praxair. The degassing temperature for zeolite 5A was and for Basolite® C300 was 343 .
After degassing, the oven temperature was reduced to the experimental temperature and the baseline was recorded. The equilibration stage can begin when the oven temperature is held constant. After achieving a stable baseline, the sample is equilibrated with a constant flow of a 10% mixture of the adsorbate in the carrier gas (Helium 6.0 from Praxair). For methane and ethane, equilibration times from 20 min to 30 min were sufficient.
The desorption process was initiated after the equilibrium was reached. At that time, the inlet flow was switched to pure helium and the effluent concentrations at the outlet of the chromatograms were measured using both flame ionization detectors (flame ionization detector 1 (FID-1) and flame ionization detector 2 (FID-2)). Hydrogen (Infra, purity 99.99%) and air (Infra, extra dry air) were used to ignite the FIDs. The experiment ends when the signal reaches the baseline.
To validate the proposed semi-automatic ZLC system, the diffusivity and Henry constants for methane (Infra, ultra-high purity) and ethane (Infra, purity 99.99%) in zeolite 5A and Basolite® C300 were determined at 298 and 308 . All samples were analyzed at two different flow rates that ensured equilibrium (L < 1) and kinetic (L > 1)conditions.
6. Results and Discussion
6.1. Case Study I: Methane and Ethane Adsorption on Zeolite 5A and Basolite® C300
The aim of this case study is to evaluate the dimensionless Henry law constant in zeolite 5A for methane () and ethane (). In addition, the adsorption capacities of zeolite 5A and Basolite® C300 will be compared by using the desorption curves. We measured ZLC desorption curves for 10% methane and ethane on each adsorbent. All experiments were conducted at small volumetric flow rates ( 5 ) to ensure low L values (Table 1). Under these conditions the solid is effectively at equilibrium with the fluid.

Table 1.
Experimental temperature (T), time constant ratio (L) and dimensionless Henry law constant (K) for equilibrium measurements of methane and ethane on zeolite 5A.
Figure 4a,b shows the vs. curves for each material in this study, where F is the purge flow rate, t the time, M is the mass of the sample, and is the concentration in the gas phase normalized by the initial concentration . Figure 4a shows that the area under the relative ZLC curve for methane is smaller than the area under curve for ethane (Figure 4b) for both zeolite 5A and Basolite® C300. This suggests a lower methane adsorption capacity. For ethane, there is a greater difference in the areas under the curve, being higher in Basolite® C300 than zeolite 5A (Figure 4b).
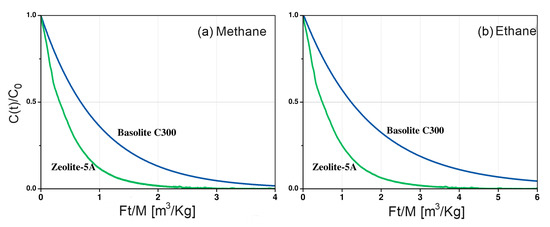
Figure 4.
Comparison of the adsorbent capacity of Zeolite 5A and Basolite® C300 of (a) methane and (b) ethane in helium at 298 K, and 5 sccm.
According to the experimental data, zeolite 5A and Basolite® C300 exhibit similar adsorption preferences, showing a higher affinity for ethane. Both adsorbates have similar kinetic diameters ( Å) [28]. Therefore, steric hindrance cannot explain the affinity for ethane of both adsorbates. However, the electrical characteristics of the adsorbates and adsorbent surfaces can shed light on the understanding of the observed behavior. Ethane has a quadrupole moment of [29] while the moment of methane is negligible. For this reason, cation in the zeolite framework are expected to interact stronger with ethane than with methane due to the quadrupole-field gradient interaction that exists between ethane and framework. Garcia L. et al. observed similar behavior in zeolite 5A [30]. Basolite® C300 also exhibits these interactions mainly due to the existence of open metal sites. After removal of the host molecules, the partial positive charges on the metal sites are available to interact electrostatically with molecule quadrupole, improving the adsorption capacity [31].
The areas under the curve shows that the adsorption capacity of methane and ethane is higher in Basolite® C300 than in zeolite 5A, which is consistent with previous reports [32,33], validating the methodology used in the ZLC setup. This is due to the difference in porosity between the two frameworks. In zeolite, the free aperture of the pore is Å, which causes strong interactions of the adsorbed molecules with the surface. This produces strong confinement effects and hinders the diffusion of methane and ethane within the micropores [34], preventing access to the active sites of the zeolite [35]. On the other hand, the Basolite® C300 has a microporous structure formed by two types of cavities. One of them are large cavities, connected by 9 Å windows, which can adsorb large molecules. The other cavity type is small side pockets connected to the large one through Å windows. This type of porosity improves the diffusivity of the adsorbates allowing access to the metal sites in the Basolite® C300.
Equilibrium ZLC desorption curves of methane and ethane on zeolite 5A shows pure exponential decays (Figure 5). This behavior suggests that the adsorbate–adsorbent system is described by a Henry isotherm. The nonlinear behavior of the ethane desorption curve at short times is due to the higher L values with which these experiments were run. However, at long times a linear behavior is observed which allows for estimating Henry’s constant. The estimated values of Henry’s constants are within the range reported for these systems (Table 1). As expected, the constants for ethane are higher than those for methane due to more intense interactions with the adsorbent surface as explained above. The inverse correlation between Henry’s constant and temperature was also observed.
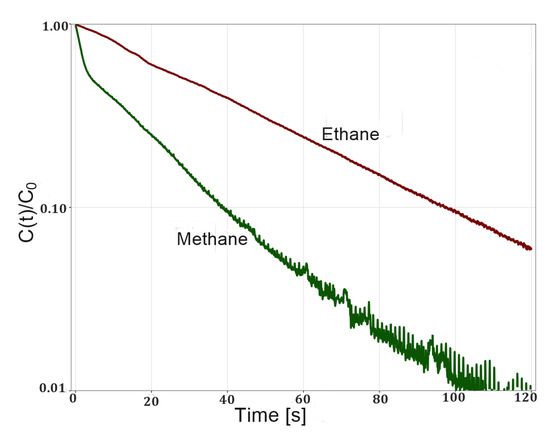
Figure 5.
Experimental ZLC desorption curves of methane and ethane on zeolite 5A at 298 K and flow rate of 5 sccm.
6.2. Binary Equilibrium in Zeolite 5A
The system described in Figure 1 also provides information about the equilibrium of binary mixtures in the ZLC. This type of study begins by degassing the sample. To do this, FSV-4 must be placed in position B, ball valve P1 in position A, ball valve P2 in position A, FSV-6 in position B, the sample furnace must be heated to degassing temperature, and the MFC-4 must supply a controlled flow of . For zeolite 5A, the He flow rate was 10 , the degassing temperature , and the heating time 1 . At the end of degassing, the sample is isolated in atmosphere by placing valve P2 in OFF position and valve P1 in B position. Subsequently, the mixture is prepared by setting FSV-4 in position A and setting the desired flow rates on the mass controllers MFC-1, MFC-2, and MFC-4. These flows were in our case: 2, 2 and 16 , respectively. The mixture is flowed long enough for the lines to purge and the mixture to reach the desired composition. When this has been achieved, valves P1 and P2 are placed in positions A and B, respectively, and the FID-1 signal is recorded until it reaches a constant value. This means that equilibrium has been reached between the mixture and the adsorbent. From that point on, the flow is maintained for an additional time to ensure equilibrium. In the case of zeolite 5A and the methane/ethane mixture, this additional time was 30 . Once equilibrium is reached, valve P2 is placed in position A and the line to FSV-6 is purged with the saturation mixture. Simultaneously, or some time before, is flowed through the loop and SCSC to prepare them for analysis. Helium flow is controlled by the MFC-3 (4.6 sccm in this work). If necessary, the SCSC can be heated. With these steps, the system is ready to perform the binary equilibrium studies.
The FID-2 detector must be properly calibrated following standard procedures prior to any analysis. Since these procedures have been extensively described in the literature, we will omit them. Before sampling the desorption curve it is convenient to measure the composition of the saturation mixture as a control measure. To do this, FSV-6 is simply placed in position A for a sufficient time to fill the loop (in this work the loop was 500 and 2 of filling were sufficient) and then returned to position B. In the latter position, the carrier flows through the loop and injects its contents into the column. The retention time for methane using the above flow rate and at 298 was about 140 , while that for ethane was about 360 (Figure 6). These retention times do not allow more than one sampling on the desorption curves without facing the risk of overlapping peaks at the SCSC output. It was for this reason that the binary equilibrium experiments were performed by sampling only once on each desorption curve. This has the disadvantage that the saturation procedure described above has to be repeated for each sampling. Consequently, the experiment is more time-consuming than when using mass spectrometry. However, it is less expensive and allows to test some simple theoretical models.
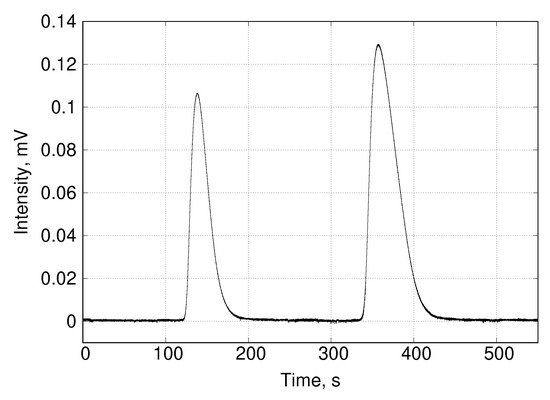
Figure 6.
Chromatogram corresponding to the methane/ethane mixture in the analytical column.
Desorption is initiated with the FSV-6 in position B and changing the FSV-4 to position B so that the flow of from the MFC-4, causes the desorption in the sample (Figure 1). Desorption curve sampling was performed switching the FSV-6 to position A and filling the loop for 2 , before returning it to position B and FSV-6 in position B allows the carrier gas to flow through the loop and injects its contents into the column. Once the sampling is finished, the saturation process described above is restarted. Care must first be taken to isolate the sample by setting valve P2 to OFF and P1 to B to prevent the sample from hydrating while the mixture is being prepared and the lines are purged again.
The number of experiments required to obtain bicomponent ZLC desorption curves rules out any kinetic study. However, it is possible to use these results to test simple isotherm models that do not include a large number of parameters. Figure 7 illustrates this by comparing the experimental results with those simulated using Equation (1) and the results obtained for pure components. This was possible in this case because the experimental conditions the binary solution in the adsorbed phase should behave as an ideal adsorbed solution and the corresponding binary curves could be predicted. Otherwise, it is possible to estimate the parameters of some model by optimization algorithm.
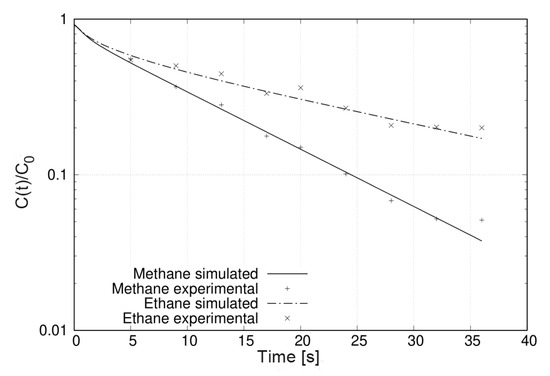
Figure 7.
Bicomponent ZLC desorption curves of methane an ethane on zeolite 5A at 298 and flow rate of 5 . The simulated curves using Equation (1) are represented by lines while the experimental data are represented by symbols.
The ethane molecule is retained more than the methane molecule over the entire range of times studied (Figure 7). This selectivity of zeolite 5A for ethane can be understood based on the properties of the adsorbates and the adsorbent. On the one hand, zeolite 5A contains and counter-ions that turn its surface highly polar. On the other hand, the ethane molecule has quadrupole momentum [29] with which it can interact with the field
gradients created by the zeolite 5A cations, a property that the methane molecule does
not have due to its high symmetry. Another important aspect is polarizability. Ethane has
higher polarizability [36] than methane[37] which
allows the former to interact more strongly than the latter at the expense of its induced
dipole. Finally, there are dispersive interactions, which also favor ethane because it has a
larger number of atoms.
Experiments under kinetic conditions can be carried out following a procedure similar to that of experiments under equilibrium conditions. No additional modification of the GUI or the system is required to perform them.
7. Case Study II: Methane and Ethane Diffusion in Zeolite 5A and Basolite® C300
To determine the diffusion control in the system, experiments were performed at different desorption fluxes. According to the ZLC mathematical model, one way to verify this condition is by a semi-log plot of normalized concentration vs. (flux rate per time). For equilibrium-controlled processes, the response curves should be independent of flow rate, which implies an overlapping of the curves, whereas for a kinetically controlled process the curves diverge. In the diffusion-controlled regime, in the long time region, a log-linear plot of vs. t the long time, asymptote approximates a straight line, therefore, from the slope and the intercept L and can be extracted [38].
To validate the diffusion time constant extracted with this approach (long time analysis), experiments with different flow rates are needed. The resulting response curves will be characterized by similar slopes of the long time asymptote, but different intersections due to different values of the L parameter (flow dependent). ZLC experiments were conducted using of zeolite 5A at flow rate of 20 . The resulting desorption curves for ethane at 298 are shown in Figure 8. Both desorption curves at the same temperature have similar slopes over time, ensuring that the system is controlled by kinetics.
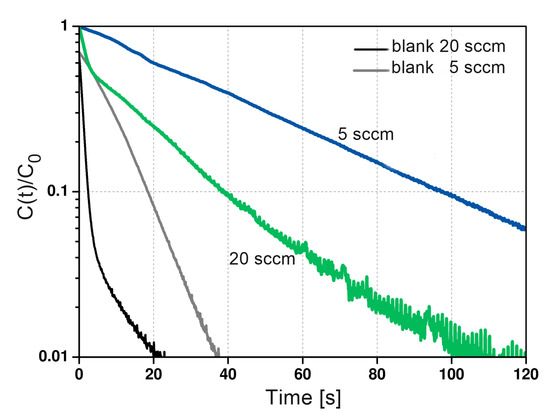
Figure 8.
Experimental ZLC desorption curves of ethane on zeolite 5A at 298, and a desorption rate of 5 and 20 , respectively.
Semi-logarithmic plots of vs. for Basolite® C300 are shown in Figure 9. The representative response curves at four different purge rates cross each other and are divergent, confirming non-equilibrium conditions. The diffusivities and L parameters for ethane and methane on both adsorbents were determined from the desorption curves under kinetic conditions. Considering the L values obtained (Table 2) it can be concluded that diffusion is the controlling step and that the transport process is controlled by intra-particle diffusion rather than equilibrium [39]. All L values obtained from the fits are significantly greater than 10, which explains the non-linearity in the curves [14].
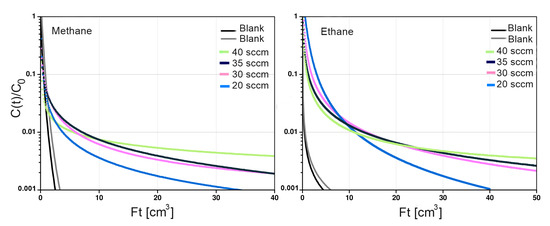
Figure 9.
Desorption curves of Basolite® C300 at different methane and ethane flow rates at 298 kelvin.
Table 2.
Diffusivity of methane and ethane in zeolite 5A and Basolite® C300 under kinetic conditions.
The diffusivity data reported in this work using ZLC agree with measurements made using other techniques. The results obtained are summarized in Table 2. It should be noted that our D values in some cases are much lower and in others higher than the values reported in the literature, but all remain in the same order of magnitude. These small differences in diffusivity could be due to unequal crystal sizes, which can lead to subtle differences in diffusivity. Another point that could be discussed is that the investigations were not carried out with identical materials and coatings, such a discrepancy could occur, if there was a strong dependence of concentration and/or cation content on diffusion. Considering these facts the results obtained by the ZLC setup are consistent with what has been reported [26,44,45,46,47].
The crystal structures of zeolite 5A and Basolite® C300 are similar. However, maximum diameter of a sphere that can diffuse along the main channel of zeolite 5A framework is Å [48], while the main channel diameter of Basolite® C300 has around 9 Å [49]. This difference in channel diameter explains why both adsorbates diffuse faster in Basolite® C300 than in zeolite 5A (Table 2).
Diffusion in zeolite 5A is driven by the probability of the occurrence of adsorbate molecule hopping between cavities. Only one molecule of methane or ethane can hop between cages at any given time in the zeolite 5A [50]. The adsorbate-adsorbent interaction is more intense for ethane and the potential barrier between the hopping is higher. Consequently, there is a reduction in the diffusivity of this molecule relative to methane as observed experimentally in this work (Table 2).
The diffusion process in Basolite® C300 is more complex than in zeolite 5A. The Basolite® C300 framework contains cavities like those of zeolite 5A but larger and pockets [31]. Diffusivity and volumetric filling have a positive correlation when the latter is small due to the reduction in the energy barriers to inter-cavity hopping, caused by repulsive interactions between adsorbate molecules. When the volumetric filling tends to one, the probability of hopping decreases, and the diffusivity tends to zero. That is why the data taken from the literature in Table 2 is a range and not a value. However, experimentally it was only possible to measure one of these values. Apparently, the lower polarity of the Basolite surface, the larger size of its pores, and the greater complexity of its lattice prevent observing a significant difference between diffusivities.
It is noteworthy that the estimated values of the diffusion coefficients, using the system developed in this work, are very similar to those reported in previous works (Table 2). This demonstrates the effectiveness of the system and GUI implemented to perform this type of measurement.
8. Conclusions
The designed system can measure parameters that characterize the adsorbate–adsorbent equilibrium, as well as the diffusion coefficient of pure components and mixtures. The selected case studies showed that the data obtained reproduce those reported using other techniques. The developed GUI can be easily modified to incorporate other components, such as TCD or mass detectors. The GUI also allows experiments with mixtures without using a mass spectrometer. It does not replace it, however, it allows test simple isotherms and transport models of mixtures on adsorbents with a significantly lower investment than that required by a mass spectrometer. These system features significantly reduce measurement time and costs. In this sense, the proposed system is more versatile than most of conventional volumetric and gravimetric systems.
Supplementary Materials
The following supporting information can be downloaded at: https://www.mdpi.com/article/10.3390/app12136694/s1, Table S1: Analog connectors of Mass Flow Controller Z512; Figures S1, S2 and S3: Calibration curves for methane, ethane and helium; Figure S4: (a) Signal as acquired from GC-8A shimadzu. (b) The response curve show the representative ZLC normalized curve; Figure S5: (a) Comparison between the empty column and zeolite. (b) Study of Blank response with and without sinter disc; Figures S6 and S7: LabView graphical code; Table S2: Physical properties of zeolite 5A; Figure S8: SEM micrograph of Zeolite 5A powder and particle size distribution; Figure S9: (A) Infrared spectra and (B) Thermogravimetric curve of zeolite 5A; Table S3: Physical properties of Basolite C300; Figure S10: SEM micrograph of Basolite C300 powder and particle size distribution; Figure S11: (A) Infrared spectra and (B) Thermogravimetric curve of Basolite C300; Figures S12 and S13: ZLC response curves at different purge rates for methane and ethane on Basolite C300; Figures S14, S15, S16 and S17: Desorption curves for methane and ethane on zeolite 5A at different purge rates; Figure S18: Comparison of the adsorbent capacity of Zeolite 5A and Basolite C30; Table S4: Standard data for peak area calculation; Figure S19: Standard calibration curve for methane and ethane or peak area calculation. References [20,21,22,38,39,51,52,53,54,55,56] are cited in the supplementary materials.
Author Contributions
Conceptualization, J.V.-B., J.B. and P.M.-O.; methodology, J.V.-B., J.B. and P.M.-O.; software, P.M.-O. and J.V.-B. instrumentation, J.V.-B. and J.B.; validation, J.B.; formal analysis, J.B., U.T.-H. and J.V.-B.; research, J.V.-B. and J.B.; experimentation, J.V.-B. and J.B. Experimentation, J.V.-B. and D.A.-A.; resources, J.B.; data curation, J.V.-B. and J.B.; writing and preparation of the original draft, J.V.-B. and J.B.; writing, revising and editing, J.V.-B., U.T.-H. and J.B.; supervision, J.B.; project management, J.B.; fund acquisition, J.B. All authors have read and agree with the published version of the manuscript.
Funding
This research was funded by PAPIIT under project IG100618.
Institutional Review Board Statement
Not applicable.
Informed Consent Statement
Not applicable.
Data Availability Statement
The GUI code is available free of charge to anyone who requests it via email to the authors.
Acknowledgments
The authors thank the financial support provided by DGAPA-UNAM through PAPIIT project IG100618 and by the National Council for Science and Technology (CONACyT). In memory of Luis Felipe del Castillo for sharing his knowledge and time dedicated to this work. We also thank the technical support of: Samuel Tehuacanero, Salvador López Morales, Eriseth Morales, Alejandro Pompa and Alberto López.
Conflicts of Interest
The authors declare no conflict of interest. The funders had no role in the design of the study; in the collection, analyses, or interpretation of data; in the writing of the manuscript, or in the decision to publish the results.
Acronyms
| DAQ | Data Acquisition |
| FID-1 | Flame Ionization Detector 1 |
| FID-2 | Flame Ionization Detector 2 |
| FSV-4 | Flow 4-way Selector Valve |
| FSV-6 | Flow 6-way Selector Valve |
| GUI | Graphical User Interface |
| MFC | Mass Flow Controller |
| sccm | standard cubic centimeter per minute |
| SCSC | Semi-Capillary Separation Column |
| ZLC | Zero-Length Column |
Glossary
| C | Molar concentration of adsorbate in fluid phase, [mol/m3] |
| Molar concentration of adsorbate in fluid phase at t = 0, [mol/m3] | |
| Total molar concentration in the fluid phase | |
| Intraparticle diffusivity [] | |
| D | Diffusion coefficient [] |
| Axial dispersion coefficient of the compound in the bulk-fluid phase [] | |
| F | Total volumetric flow rate, [] |
| Total volumetric flow rate at ZLC inlet, [] | |
| i | Component i |
| K | the dimensionless Henry law constant |
| L | Time constant ratio, see Equation (3) |
| Amount adsorbed at pressure (p = bar) | |
| Average sorbate concentration through a particle [mol/m] | |
| q | Molar concentration of adsorbate in the stationary phase [mol/m] |
| The adsorbed phase concentration at equilibrium [mol/m] | |
| R | Radius of the particle |
| t | Time variable |
| Volume of mobile phase | |
| Volume of stationary phase | |
| y | Mole fraction of sorbate in the gas phase, defined as C/CT |
| Mole fraction of sorbate in the gas phase at ZLC outlet |
References
- Weckhuysen, B.M.; Yu, J. Recent advances in zeolite chemistry and catalysis. Chem. Soc. Rev. 2015, 44, 7022. [Google Scholar] [CrossRef] [PubMed]
- Eldridge, R.B. Olefin/paraffin separation technology: A review. Ind. Eng. Chem. Res. 1993, 32, 2208–2212. [Google Scholar] [CrossRef]
- Herm, Z.R.; Bloch, E.D.; Long, J.R. Hydrocarbon Separations in Metal–Organic Frameworks. Chem. Mater. 2014, 26, 323–338. [Google Scholar] [CrossRef]
- Lin, R.B.; Xiang, S.; Xing, H.; Zhou, W.; Chen, B. Microporous Metal–Organic Framework with Dual Functionalities for Efficient Separation of Acetylene from Light Hydrocarbon Mixtures. Chem. Rev. 2017, 378, 4897–4902. [Google Scholar]
- Bao, Z.; Chang, G.; Xing, H.; Krishna, R.; Ren, Q.; Chen, B. Potential of microporous metal–organic frameworks for separation of hydrocarbon mixtures. Energy Environ. Sci. 2016, 9, 3612–3641. [Google Scholar] [CrossRef]
- Kim, H.J.; Yang, H.C.; Chung, D.Y.; Yang, I.H.; Choi, Y.; Moon, J.K. Functionalized Mesoporous Silica Membranes for CO2 Separation Applications. J. Chem. 2015, 2015, 202867. [Google Scholar] [CrossRef]
- Ke, Z.; Xiao, H.; Wen, Y.; Du, S.; Zhou, X.; Xiao, J.; Li, Z. Adsorption Property of Starch-Based Microporous Carbon Materials with High Selectivity and Uptake for C1/C2/C3 Separation. Ind. Eng. Chem. Res. 2021, 60, 4668–4676. [Google Scholar] [CrossRef]
- Antonangelo, A.R.; Hawkins, N.; Carta, M. Polymers of intrinsic microporosity (PIMs) for catalysis: A perspective. Curr. Opin. Chem. Eng. 2022, 35, 100766. [Google Scholar] [CrossRef]
- Aristizábal, S.L.; Habboub, O.S.; Pulido, B.A.; Cetina-Mancilla, E.; Olvera, L.I.; Forster, M.; Nunes, S.P.; Scherf, U.; Zolotukhin, M.G. One-Step, Room Temperature Synthesis of Well-Defined, Organo-Soluble Multifunctional Aromatic Polyimides. Macromolecules 2021, 54, 10870–10882. [Google Scholar] [CrossRef]
- Li, Y.; Yi, H.; Tang, X.; Li, F.; Yuan, Q. Adsorption separation of CO2/CH4 gas mixture on the commercial zeolites at atmospheric pressure. Chem. Eng. J. 2013, 229, 50–56. [Google Scholar] [CrossRef]
- Jiang, M.; Eić, M. Transport Properties of Ethane, Butanes and Their Binary Mixtures in MFI-Type Zeolite and Zeolite-Membrane Samples. Adsorption 2003, 9, 225–234. [Google Scholar] [CrossRef]
- Motelica, A.; Bruinsma, O.S.; Kreiter, R.; den Exter, M.; Vente, J.F. Membrane Retrofit Option for Paraffin/Olefin Separation—A Technoeconomic Evaluation. Ind. Eng. Chem. Res. 2012, 51, 6977–6986. [Google Scholar] [CrossRef]
- Amedi, H.R.; Aghajani, M. Economic Estimation of Various Membranes and Distillation for Propylene and Propane Separation. Ind. Eng. Chem. Res. 2018, 57, 4366. [Google Scholar] [CrossRef]
- Brandani, S.; Mangano, E. The zero length column technique to measure adsorption equilibrium and kinetics: Lessons learnt from 30 years of experience. Adsorption 2021, 27, 319–351. [Google Scholar] [CrossRef]
- Vidoni, A.; Ruthven, D.M. Diffusion of C2H6 and C2H4 in DDR Zeolite. Ind. Eng. Chem. Res. 2012, 51, 1383–1390. [Google Scholar] [CrossRef]
- Hu, X.; Brandani, S.; Benin, A.I.; Willis, R.R. Development of a Semiautomated Zero Zength Column Technique for Carbon Capture Applications: Study of Diffusion Behavior of CO2 in MOFs. Ind. Eng. Chem. Res. 2015, 54, 5777–5783. [Google Scholar] [CrossRef]
- Brandani, S. Effects of Nonlinear Equilibrium on Zero Length Column Experiments. Chem. Eng. Sci. 1998, 53, 2791–2798. [Google Scholar] [CrossRef]
- Brandani, F.; Ruthven, D. Measurement of Adsorption Equilibria by the Zero Length Column (ZLC) Technique Part 2: Binary Systems. Ind. Eng. Chem. Res. 2003, 42, 1462–1469. [Google Scholar] [CrossRef]
- Mangano, E. Rapid Screening of Novel Nanoporous Materials for Carbon Capture Separations. Ph.D. Thesis, The University of Edinburgh, Edinburgh, UK, 2013. [Google Scholar]
- Eic, M.; Ruthven, D.M. A New Experimental Technique for Measurement of Intracrystalline Diffusivity. Zeolites 1988, 8, 840–845. [Google Scholar] [CrossRef]
- Brandani, S.; Ruthven, D.M. Analysis of ZLC desorption curves for liquid systems. Chem. Eng. Sci. 1995, 50, 2055–2059. [Google Scholar] [CrossRef]
- Brandani, S.; Ruthven, D.M. Analysis of ZLC Desorption Curves for Gaseous Systems. Adsorption 1996, 2, 133–143. [Google Scholar] [CrossRef]
- Duncan, W.L.; Moller, K.P. The effect of a crystal size distribution on ZLC experiments. Chem. Eng. Sci. 2002, 57, 2641–2652. [Google Scholar] [CrossRef]
- Valco, V. Valco Home Page. Available online: https://www.vici.com/ (accessed on 16 August 2020).
- Horiba. Horiba Home Page. Available online: https://www.horiba.com/int/ (accessed on 16 August 2020).
- Ruthven, D.; Derrah, R.; Loughlin, K. Diffusion of Light Hydrocarbons in 5A Zeolite. Can. J. Chem. 1973, 51, 3514–3519. [Google Scholar] [CrossRef]
- Triebe, R.; Tezel, F.; Khulbe, K. Adsorption of methane, ethane and ethylene on molecular sieve zeolites. Gas Sep. Purif. 1996, 10, 81–84. [Google Scholar] [CrossRef]
- Dasani, D.; Wang, Y.; Tsotsis, T.T.; Jessen, K. Laboratory-Scale Investigation of Sorption Kinetics of Methane/Ethane Mixtures in Shale. Ind. Eng. Chem. Res. 2017, 56, 9953–9963. [Google Scholar] [CrossRef]
- Weitz, S.L.; Potoff, J.J. Effect of quadrupole moment on the phase behavior of binary mixtures containing ethene. Fluid Phase Equilibria 2005, 234, 144–150. [Google Scholar] [CrossRef]
- Garcia, L.; Poveda, Y.; Khadivi, M.; Rodríguez, G.; Görke, O.; Esche, E.; Godini, H.; Wozny, G.; Orjuela, A. Synthesis and Granulation of a 5A Zeolite-Based Molecular Sieve and Adsorption Equilibrium of the Oxidative Coupling of Methane Gases. J. Chem. Eng. Data 2017, 62, 1550–1557. [Google Scholar] [CrossRef]
- García-Pérez, P.; Gascón, J.; Morales, F.V.; Castillo, J.M.; Kapteijn, F.; Calero, S. Identification of Adsorption Sites in Cu-BTC by Experimentation and Molecular Simulation. Langmuir 2009, 25, 1725–1731. [Google Scholar] [CrossRef]
- Millward, A.R.; Yaghi, O.M. Metal Organic Frameworks with Exceptionally High Capacity for Storage of Carbon Dioxide at Room Temperature. J. Am. Chem. Soc. 2005, 127, 17998. [Google Scholar] [CrossRef]
- Cavenati, S.; Grande, C.; Rodrigues, A. Metal Organic Framework Adsorbent for Biogas Upgrading. Ind. Eng. Chem. Res. 2008, 47, 6333–6335. [Google Scholar] [CrossRef]
- Ruthven, D.M. Principles of Adsorption & Adsorption Processes; John Wiley & sons: Hoboken, NJ, USA, 1984. [Google Scholar]
- Karger, J.; Ruthven, D.M. Diffusion in Zeolites and Other Microporous Solids; Willey Interscience: New York, NY, USA, 1992. [Google Scholar]
- Pei, J.; Wang, J.X.; Shao, K.; Yang, Y.; Cui, Y.; Wu, H.; Zhou, W.; Li, B.; Qian, G. Engineering microporous ethane-trapping metal–organic frameworks for boosting ethane/ethylene separation. J. Mater. Chem. A 2020, 8, 3613–3620. [Google Scholar] [CrossRef]
- Mofarahi, M.; Gholipour, F. Gas adsorption separation of CO2/CH4 system using zeolite 5A. Microporous Mesoporous Mater. 2014, 200, 1–10. [Google Scholar] [CrossRef]
- Brandani, F.; Ruthven, D.M.; Coe, C.G. Measurement of Adsorption Equilibrium by the Zero Length Column (ZLC) Technique Part 1: Single-Component Systems. Ind. Eng. Chem. Res. 2003, 42, 1451–1461. [Google Scholar] [CrossRef]
- Guimaraes, P.; Möller, A.; Staudt, R.; de Azevedo, D.C.; Lucena, M.; Cavalcante, L.C., Jr. Diffusion of linear paraffins in silicalite studied by the ZLC method in the presence of CO2. Adsorption 2010, 16, 29–36. [Google Scholar] [CrossRef]
- Kärger, J.; Caro, J.; Caro, J. Intracrystalline self-diffusion of methane in 5A molecular sieves. J. Colloid Interface Sci. 1975, 52, 623–625. [Google Scholar] [CrossRef]
- García-Sánchez, A.; García-Pérez, E.; Dubbeldam, D.; Krishna, R.; Calero, S. A Simulation Study of Alkanes in Linde Type A Zeolites. Adsorpt. Sci. Technol. 2007, 25, 417–427. [Google Scholar] [CrossRef]
- Liu, J.; Yang, X.; Wang, C.; Ye, L.; Sun, H. Synthesis of hierarchical 5A zeolites to improve the separation efficiency of n-paraffins. Adsorpt. Sci. Technol. 2019, 37, 530–544. [Google Scholar] [CrossRef]
- Ruthven, D.M.; Derrah, R.I. Transition state theory of zeolitic diffusion. Diffusion of CH4 and CF4 in 5A zeolite. J. Chem. Soc. Faraday Trans. 1 1972, 68, 2332–2343. [Google Scholar] [CrossRef]
- Keskin, S.; Liu, J.; Johnson, J.K.; Sholl, D.S. Testing the Accuracy of Correlations for Multicomponent Mass Transport of Adsorbed Gases in Metal-Organic Frameworks: Diffusion of H2/CH4 Mixtures in CuBTC. Langmuir 2008, 24, 8254–8261. [Google Scholar] [CrossRef]
- Schlayer, S.; Pusch, A.K.; Pielenz, F.; Beckert, S.; Peksa, M.; Horch, C.; Moschkowitz, L.; Einicke, W.D.; Stallmach, F. X-Nuclei NMR Self-Diffusion Studies in Mesoporous Silica Foam and Microporous MOF CuBTC. Materials 2012, 5, 617–633. [Google Scholar] [CrossRef]
- Wehring, M.; Gascon, J.; Dubbeldam, D.; Kapteijn, F.; Snurr, R.Q.; Stallmach, F. Self-Diffusion Studies in CuBTC by PFG NMR and MD Simulations. J. Phys. Chem. C 2010, 114, 10527–10534. [Google Scholar] [CrossRef]
- Prabhudesai, S.A.; Sharma, V.K.; Mitra, S.; Mukhopadhyay, R. Molecular dynamics simulation studies on ethane and acetylene mixture in CuBTC metal organic framework. AIP Conf. Proc. 2014, 1591, 1300–1302. [Google Scholar] [CrossRef]
- Baerlocher, C.; McCusker, L.B. Database of Zeolite Structures. Structure Commission of the International Zeolite Association. Available online: http://www.iza-structure.org/databases/ (accessed on 9 June 2021).
- Kärger, J.; Ruthven, D.M.; Theodorou, D.N. Diffusion in Nanoporous Materials; Wiley-VCH Verlag GmbH & Co. KGaA: Weinheim, Germany, 2012. [Google Scholar]
- Chmelik, C.; Kärger, J.; Wiebcke, M.; Caro, J.; van Baten, J.M.; Krishna, R. Adsorption and diffusion of alkanes in CuBTC crystals investigated using infra-red microscopy and molecular simulations. Microporous Mesoporous Mater. 2009, 117, 22–32. [Google Scholar] [CrossRef]
- Brandani, F. Development and Application of the Zero Length Column (ZLC) Techique for Measuring Adsorption Equilibria. Ph.D. Thesis, University of Penobscot County, Orono, ME, USA, 2002. [Google Scholar]
- Brandani, F.; Brandani, S.; Coe, C.G.; Ruthven, D.M. Measurement of Henry Constants and Equilibrium Isotherms by the ZLC Technique. Fundam. Adsorp. 2002, 7, 21–28. [Google Scholar]
- Brandani, S. A Simple Graphical Check of Consistency for Zero Length Column Desorption Curves. Chem. Eng. Technol. 2016, 39, 1194–1198. [Google Scholar] [CrossRef]
- Crank, J. The Mathematics of Diffusion; Clarendon Press: Oxford, UK, 2003. [Google Scholar]
- Schneider, C.; Rasband, W.; Eliceiri, K. NIH Image to ImageJ: 25 years of image analysis. Nat. Methods 2012, 9, 671–675. [Google Scholar] [CrossRef]
- Wang, H.; Brandani, S.; Lin, G.; Hu, X. Flowrate Correction for the Determination of Isotherms and Darken Thermodynamic Factors from Zero Length Column (ZLC) Experiments. Adsorption 2011, 17, 687–694. [Google Scholar] [CrossRef]


Publisher’s Note: MDPI stays neutral with regard to jurisdictional claims in published maps and institutional affiliations. |
© 2022 by the authors. Licensee MDPI, Basel, Switzerland. This article is an open access article distributed under the terms and conditions of the Creative Commons Attribution (CC BY) license (https://creativecommons.org/licenses/by/4.0/).