Abstract
Identifying technological opportunities early on is critical for the development of radical inventions (RIs). Patents are recognized as one of the most reliable resources for identifying technological opportunities. In line with this, this study aimed to suggest a novel approach for the identification of technological opportunities for RIs, based on the International Patent Classification (IPC), whose design knowledge has not been fully utilized. In this approach, technological opportunities for RIs are identified by measuring the value of technological novelty (VON) of each technology manifested in a patent set, and the value of difficulty (VOD) of each R&D theme contained in the patent set. Specifically, VONs are calculated through a novel map of technological changes over time, based on structured data from the patent set; and VODs are determined using natural language processing, K-means cluster analysis, and complex network analysis of the unstructured data from the patent set. The feasibility and operability of the proposed approach are verified in a case study of unmanned aerial vehicles. The proposed approach can help designers maximize the use of designs and expert knowledge in patent libraries, to formulate technical strategies for RIs.
1. Introduction
Radical inventions (RIs) can boost a company’s market position, by improving product competitiveness in the marketplace [1]. However, companies are more inclined to carry out incremental inventions that conform to a continual process of checking with optimization [2]. This is because the technological opportunities of incremental inventions can be directly identified from the problems of existing products [3], while the technological opportunities of RIs are manifested in the emergence of a distinctly different technology [4]. Hence, designers need to pay special attention to the identification of technological opportunities for RIs.
Previous studies made attempts at combining the knowledge/technology of different domains [5,6], creating markets [7], and developing criteria [8], to search for technological opportunities for RIs. However, these studies were mostly derived from innovation management strategies. Little is known about the effective identification of technological opportunities for RIs from technical information, and research based on patents for RIs is rarely discussed. Hence, further identification methods of technological opportunities for RIs need to be studied.
Patents are considered one of the most reliable data resources for technological opportunity identification [9,10,11], due to their integrity of technical information, standardization of document management, and availability of data. Studies have suggested methods of identifying technological opportunities through drawing patent citation networks, to identify core patents as technological opportunities [12,13,14], establishing a morphological matrix to identify prioritized combinations of patents as technological opportunities [15], and constructing semantic patent maps, to identify patents hotspots and outlier patents as technological opportunities [16,17,18]. In recent years, with the development of natural language processing technology, innovative designs based on patent semantic information have received much attention [19,20,21]. However, the valuable information contained in the International Patent Classification (IPC) has been underestimated.
The IPC is systematic and hierarchical, and the theme represented by each IPC symbol is mainly based on the function and structure of inventions, supplemented by the application of inventions [22]. Most previous studies have used the IPC as a patent classification/search tool, or further developed an IPC co-occurrence matrix, to measure technological distance [23]. Nevertheless, little effort has been made to investigate these features of the IPC system as a basis for developing a tool with which to identify technological opportunities.
Having recognized these gaps, this paper proposes a method for identifying technological opportunities for RIs based on the IPC. For identifying technological opportunities for RIs, it is necessary to distinguish these from general technological opportunities based on the characteristics of RIs. RIs show a differentiated creativity, because they come from solving inventive problems using new technology. Thus, the value of difficulty (VOD) of the problems solved and the value of technological novelty (VON) of the new technology are applied to distinguish technological opportunities for RIs from others. Using IPC symbols and the order of filing dates of the patent set, technology manifested in a patent set with higher VONs is searched using a map of technological changes over time. Using the unstructured patent data, R&D themes of a patent set are decided by natural language processing and K-means clustering, and analyzed using complex network analysis to determine the VOD of each R&D theme. Finally, patents of technological opportunities for RIs are identified using an IPC-based coordinate system, based on VOC and VOD.
The rest of this paper is structured as follows: In Section 2, previous studies on technological opportunity identification for radical inventions and patent-based identification methods for technological opportunities are reviewed. Section 3 introduces a two-dimensional coordinate system, along with a framework for identifying technological opportunities for radical inventions. The proposed approach is applied to analyze patents granted to Dajiang Innovation (DJI), to verify its feasibility and operability in Section 4, followed by a discussion of the contributions of this research in Section 5. In Section 6, the conclusions of this research are used to give possible directions for future studies.
2. Related Works
2.1. Technological Opportunities Identification for Radical Inventions
According to McDermott and O’Connor [24], radical inventions (RIs) provide a more than five-times improvement in product performance, or more than 30% reduction in product cost. A more abstract concept explains that RI-based products have a major effect on markets and the economic activities surrounding them [25]. Such an explanation is suitable for research on the market effect of RIs, but not for analysis of the formation mechanism of RIs. To this end, some scholars have introduced an S-shaped path of technological evolution, to analyze the inherent features of RIs. Specifically, RIs are repeated climbs and jumps between S-curves of technology/product evolution, which distinguish them from incremental inventions, depicted as a lengthened single S-curve [26]. This description coincides with the definition of RIs proposed by later scholars. Dahlin and Behrens [27] considered that RIs are novel, unique, and related to future technology. Sood and Tellis [4] stated that RIs are accompanied by the emergence of a distinctly different technology. Liu et al. [28] put forward that RIs provide a significant difference from existing designs.
Based on these concepts, scholars have investigated the technological opportunities of RIs, as well as the design process of RIs [29]; barriers [30,31] and stimulations [32] to RIs; and evaluation methods for technological opportunities of RIs [28]. Vergragt and Brown [33] stated that a ‘‘possibility space” represented by “vision” has the power to create RIs. In terms of patent analysis, Schoenmakers and Duysters [5] found that the main source of the technology applied in RIs is the reorganization of existing knowledge in different fields. Later, Maine et al. [6] confirmed that the confluence of technology in distinct fields can trigger technological opportunities for RIs. O’Connor and Rice [7] proved that active market creation can seize technological opportunities for RIs more proactively than passive identification methods. More recently, Herrmann et al. [8] designed a scale consisting of four dimensions: markets, team members, users, and companies, to identify ideas as technological opportunities in the early phases of RIs. However, these studies were mostly derived from innovation management strategies and consider little about the characteristics of the technology applied in RIs. Hence, further identification methods for technological opportunities for RIs need to be studied.
2.2. Patent-Based Identification Methods for Technological Opportunities
Schwartz [34] first proposed the term “technology innovation opportunity” as a technology that activates innovative activities in industry or causes a huge turn in the R&D of industry. Two decades later, Porter and Detampel [35] developed a technology opportunity analysis software for knowledge mining, based on patent libraries and computer-aided technology. From that point on, technological opportunity identification entered a growth era.
To extract more design knowledge from patents, a large number of scholars have expanded their targeted objects from the structured information of patents, such as annual application numbers, inventors, citations network, etc., to unstructured information of patents; that is, text data. Kim et al. [36] used keywords from patents, the earliest filing date of the keywords, and their frequency, to create patent maps for presenting the evolution of technology and identifying emerging technology. Geum and Kim [37] identified infrequent trends within patents, based on Keygraph with words other than high-frequency keywords. Kim et al. [14] combined textual data with citation networks of the patent collection to find patent pairs for converging on a new invention.
To obtain deeper semantic information on patents, Yoon and Kim [13] extracted key concepts of patents using a subject–action–object (SAO) structure, to construct a patent map of the up-to-date status of a given technology. Park et al. [38] extracted inventive findings of patents using this method, to identify technology trends, significant patents, potential infringements, and novel technology. Yang et al. [19] extracted the technical process, operation method, and functions of patents’ SAO structures, to identify core technological components, which proved useful in monitoring and forecasting new technology. Similarly, Lee et al. [39] suggested a two-stage method for identifying technology opportunities customized to small and medium enterprises, including identifying action-object (AOs) basic opportunities and exploring non-traditional opportunities. To refine SAOx for an in-depth semantic examination, Kim et al. [20] extracted the purpose and effect of patents from the “for” and “to” phrases in patent sentences. Moreover, he introduced 39 engineering parameters from TRIZ to match technology-designative terms, for exploring technology opportunities.
Previous research found that selecting helpful patent information and learning from it provided technological opportunities for designers to develop products. However, the design knowledge contained in the IPC (International Patent Classification) is underestimated. Song et al. [40] extracted the characteristics of each of the technologies present in patents from the descriptions of their classification symbols. These features are classified into “purpose”, “function”, “structure”, “material”, “methods”, “processing and operation procedure” and “control means”, and they considered that the technical attributes that have not been used in target products but are commonly used in the other products could be helpful to detect new technological opportunities. However, the classification symbols they used were F-term, not IPC. Once applied for, patents must be submitted through the Japan Patent Office (JPO), which limits the applicability of this method. Given that the International Patent Classification (IPC) is more authoritative and universal, IPC-based identification methods are more suitable for promotion and application. The IPC can be used, not only as a classification basis for patents, but also as a criterion for evaluating the value of a patent [41], measuring the proximity of inter-domain knowledge bases and the possibility of cross-domain diversification [23]. Moreover, Liu et al. [22] believed that the function, effect, and structure of an invention can be obtained from the title and description of IPC symbols. Much less is known, however, about whether the IPC is helpful for identifying technological opportunities for radical inventions. This research will address the above research gaps.
3. Proposed Method
3.1. A Two-Dimensional Coordinate System for Classifying Different Technological Opportunities
The problem-oriented process for innovative designs states that solving simple problems and solving inventive problems use different techniques for generating solutions [42]. As a result, inventions show a differentiated creativity, depending on whether they are produced by creative methods or not. To control costs or respond quickly to market changes, designers are asked to solve simple problems by optimizing present technologies. This task can utilize personal experience or company internal knowledge. Therefore, this type of design activity leads to technological opportunities for lower inventions.
The TRIZ (theory of inventive problem solving) defines inventive problems as technical problems that are difficult to clarify, analyze, and solve [42]. It is often said that an accurate definition of a problem solves 90 percent of problems. Scholars have suggested listing as many attributes of a product as possible, as the plausible root causes of product problems using a problem explorer [43], function/attribute analysis [44], ideal final result [45], and the Cynefin framework [46]. Since the studies above suggest leaps and intuitive thinking rather than a synthetic methodology, and recommend using fewer resources or existing technology to solve difficult problems, the quality of the creative ideas looked for is uneven. Hence, inventions created from these types of design activities cannot reach a high innovation level effectively, and they are more in line with the technological opportunities for incremental innovation.
According to Christensen [47], disruptive inventions come from markets where mainstream products have not maintained innovation. Rafii and Kampas [48] pointed out that a disruptive invention is a technology, product, or process that typically offers lower performance and less functionality. Guo et al. [49] generated disruptive inventions by achieving a different package of function and performance features from the existing product. Thus, the introduction of new technology is the main means of facilitating disruptive inventions. Since disruptive inventions are initially developed for low-end customer needs, which can be acquired from market research and observation, a problem-oriented approaches are more in line with the features of the simple problems. Therefore, using new technology to cope with simple problems leads to technological opportunities for disruptive inventions.
This research studies another high-creativity invention, which aims to improve product performance greatly [50]. In the problem definition of radical inventions (RIs), what daunts both designers and entrepreneurs is whether a product and the timing is suitable for RIs, which product performance improvement has the potential to disrupt the current market, and whether there is room for substantial improvement [51]. Thus, RIs face inventive problems [42]. The design process for RIs based on innovation knowledge management emphasizes that technology that has been developed in other fields but not applied in the current field is the best option for use as innovative knowledge to solve inventive problems [52]. Therefore, technological opportunities produced by relatively new and cross-domain technology focusing on inventive problems are considered for RIs.
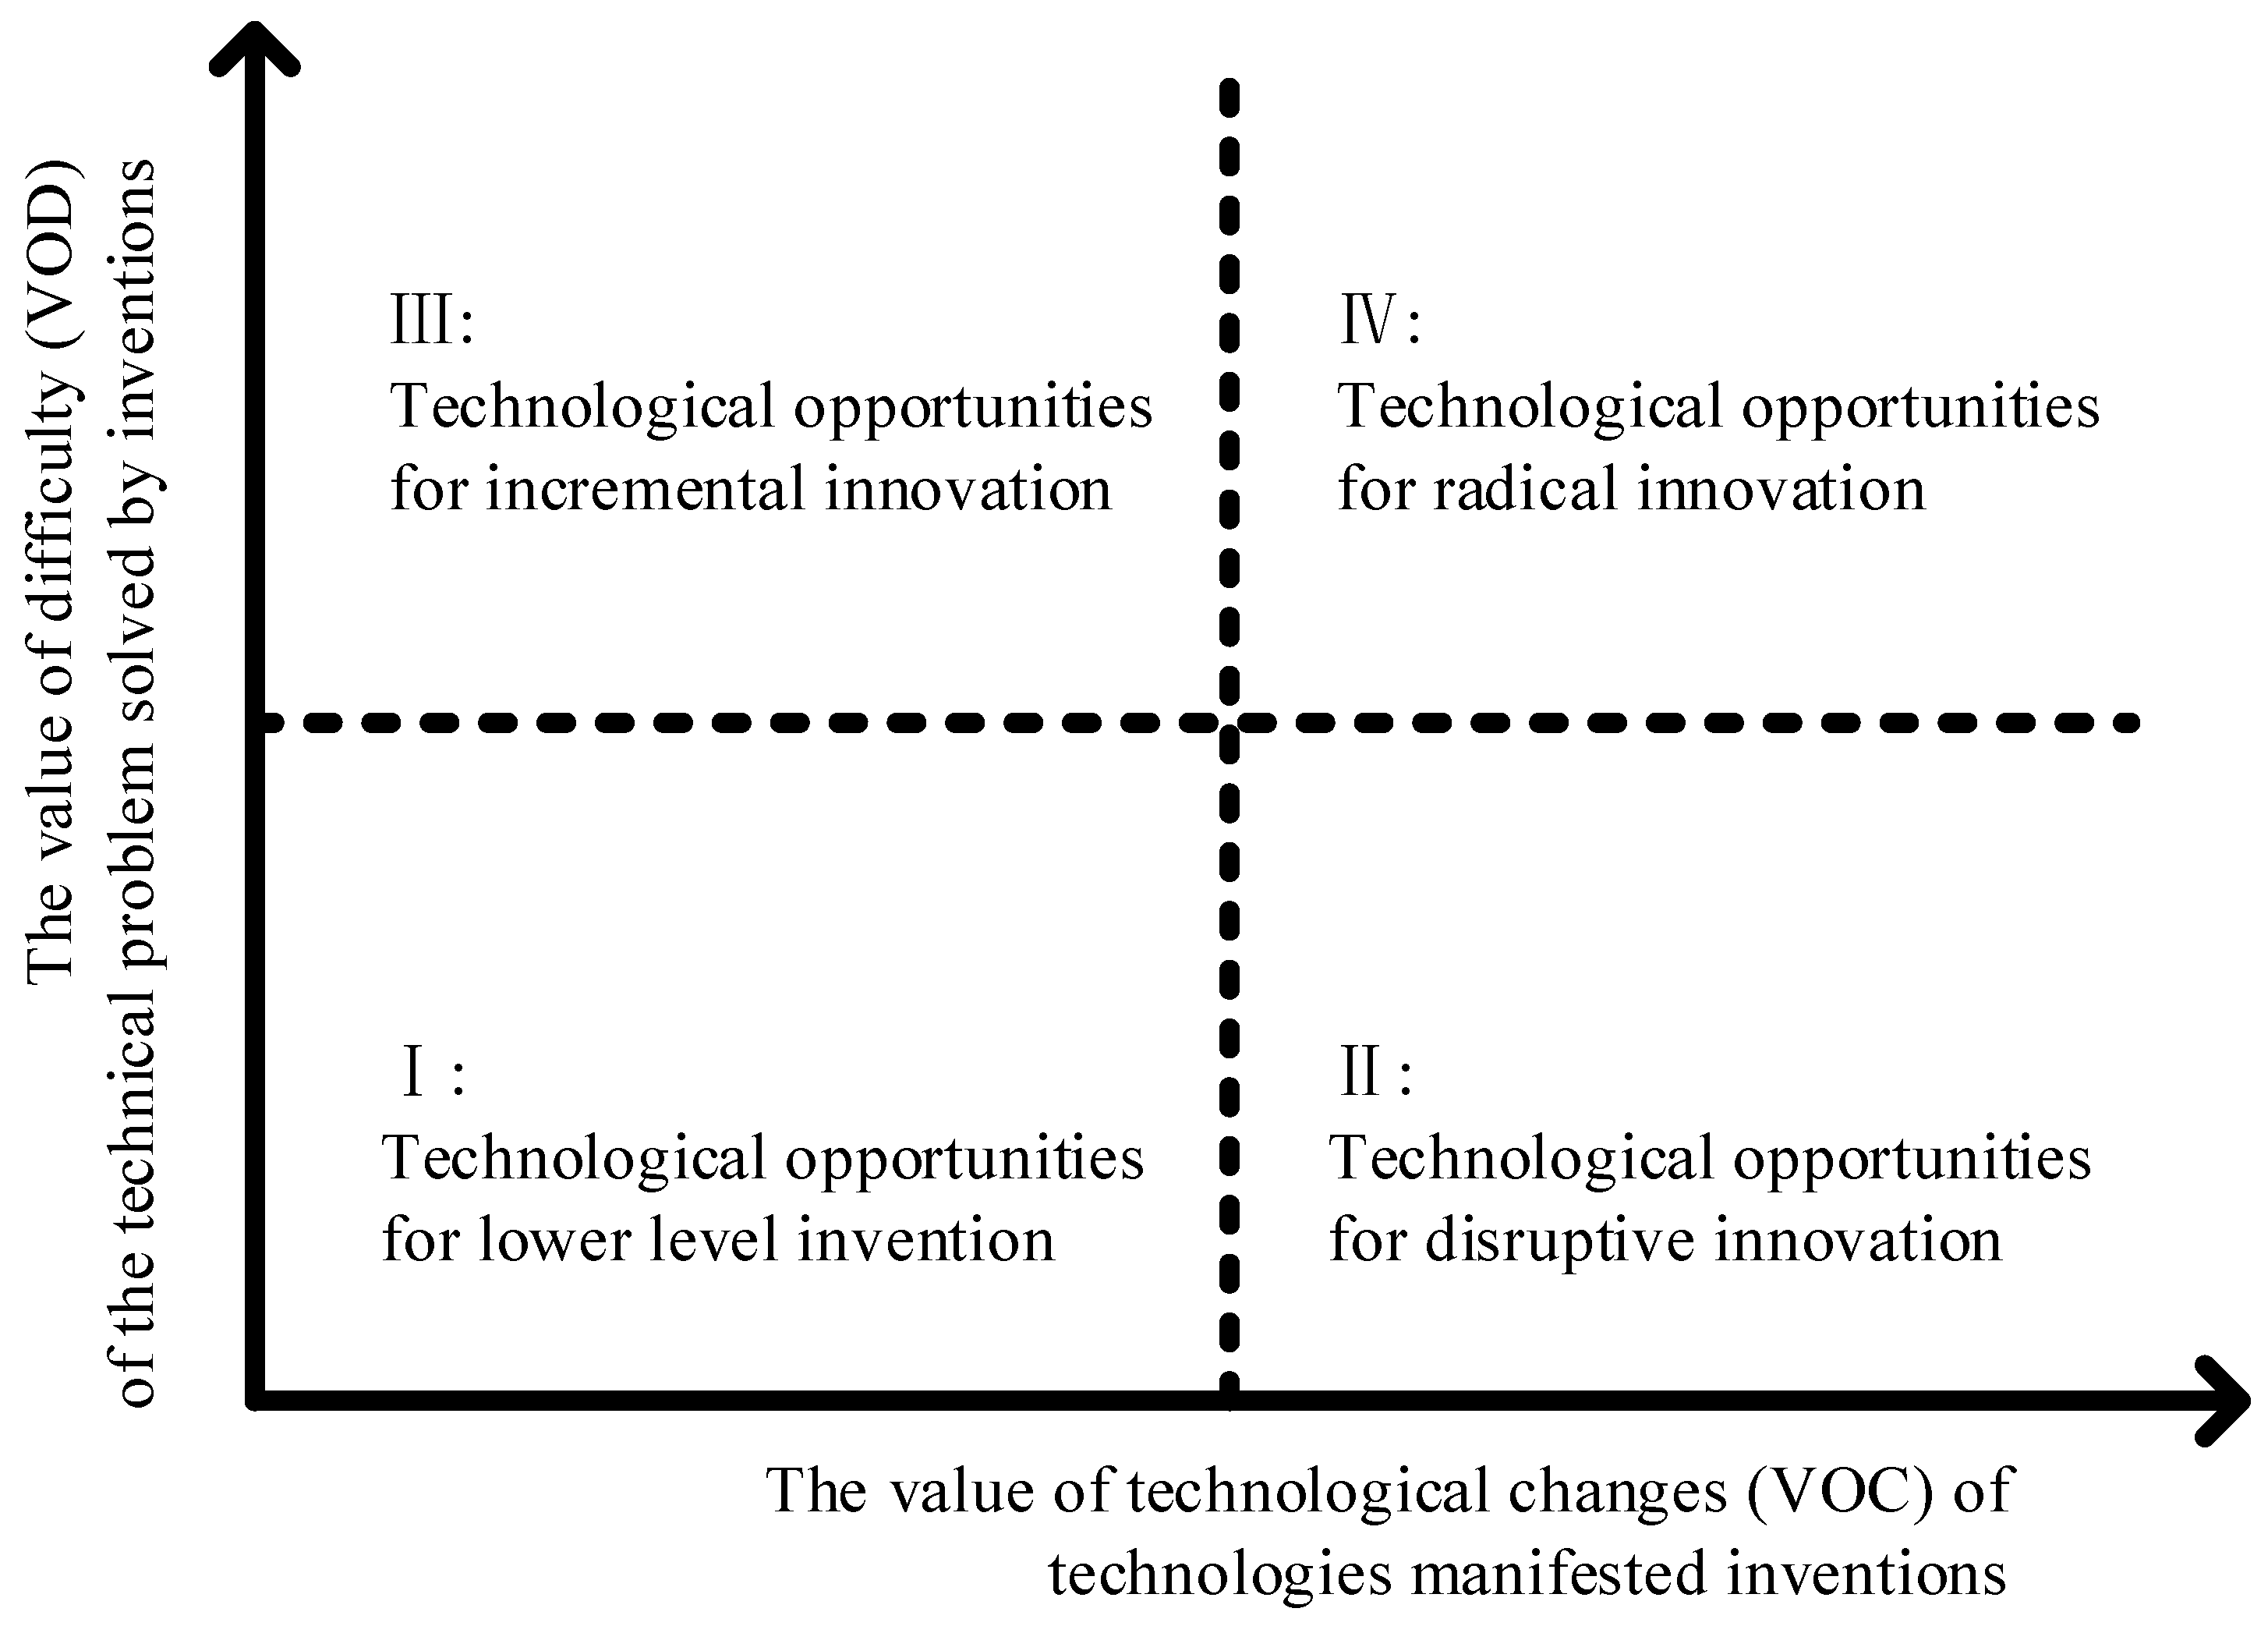
In general, there are two important indicators to distinguish technological opportunities for RIs. The first is the value of difficulty (VOD) of the problems solved, and the other is the value of technological novelty (VON) of the new technology applied. Hence, technological opportunities are categorized in a two-dimensional coordinate system in this research, with the y-axis representing VOD and the x-axis representing VON, as shown in Figure 1. Technological opportunities in quadrant I appear when dealing with simple problems using optimized present technology. Technological opportunities in quadrant II arise when using new technology to cope with simple problems. Technological opportunities in quadrant III emerge when using present technology for difficult problems, and technological opportunities in quadrant IV arise when using new technology to implement difficult problems. Hence, technological opportunities in quadrant IV are more likely to lead to RIs. Section 3.2 describes how technological opportunities for RIs can be identified based on the IPC.

Figure 1.
Two-dimensional coordinate system for classifying different technological opportunities.
3.2. Overall Procedure
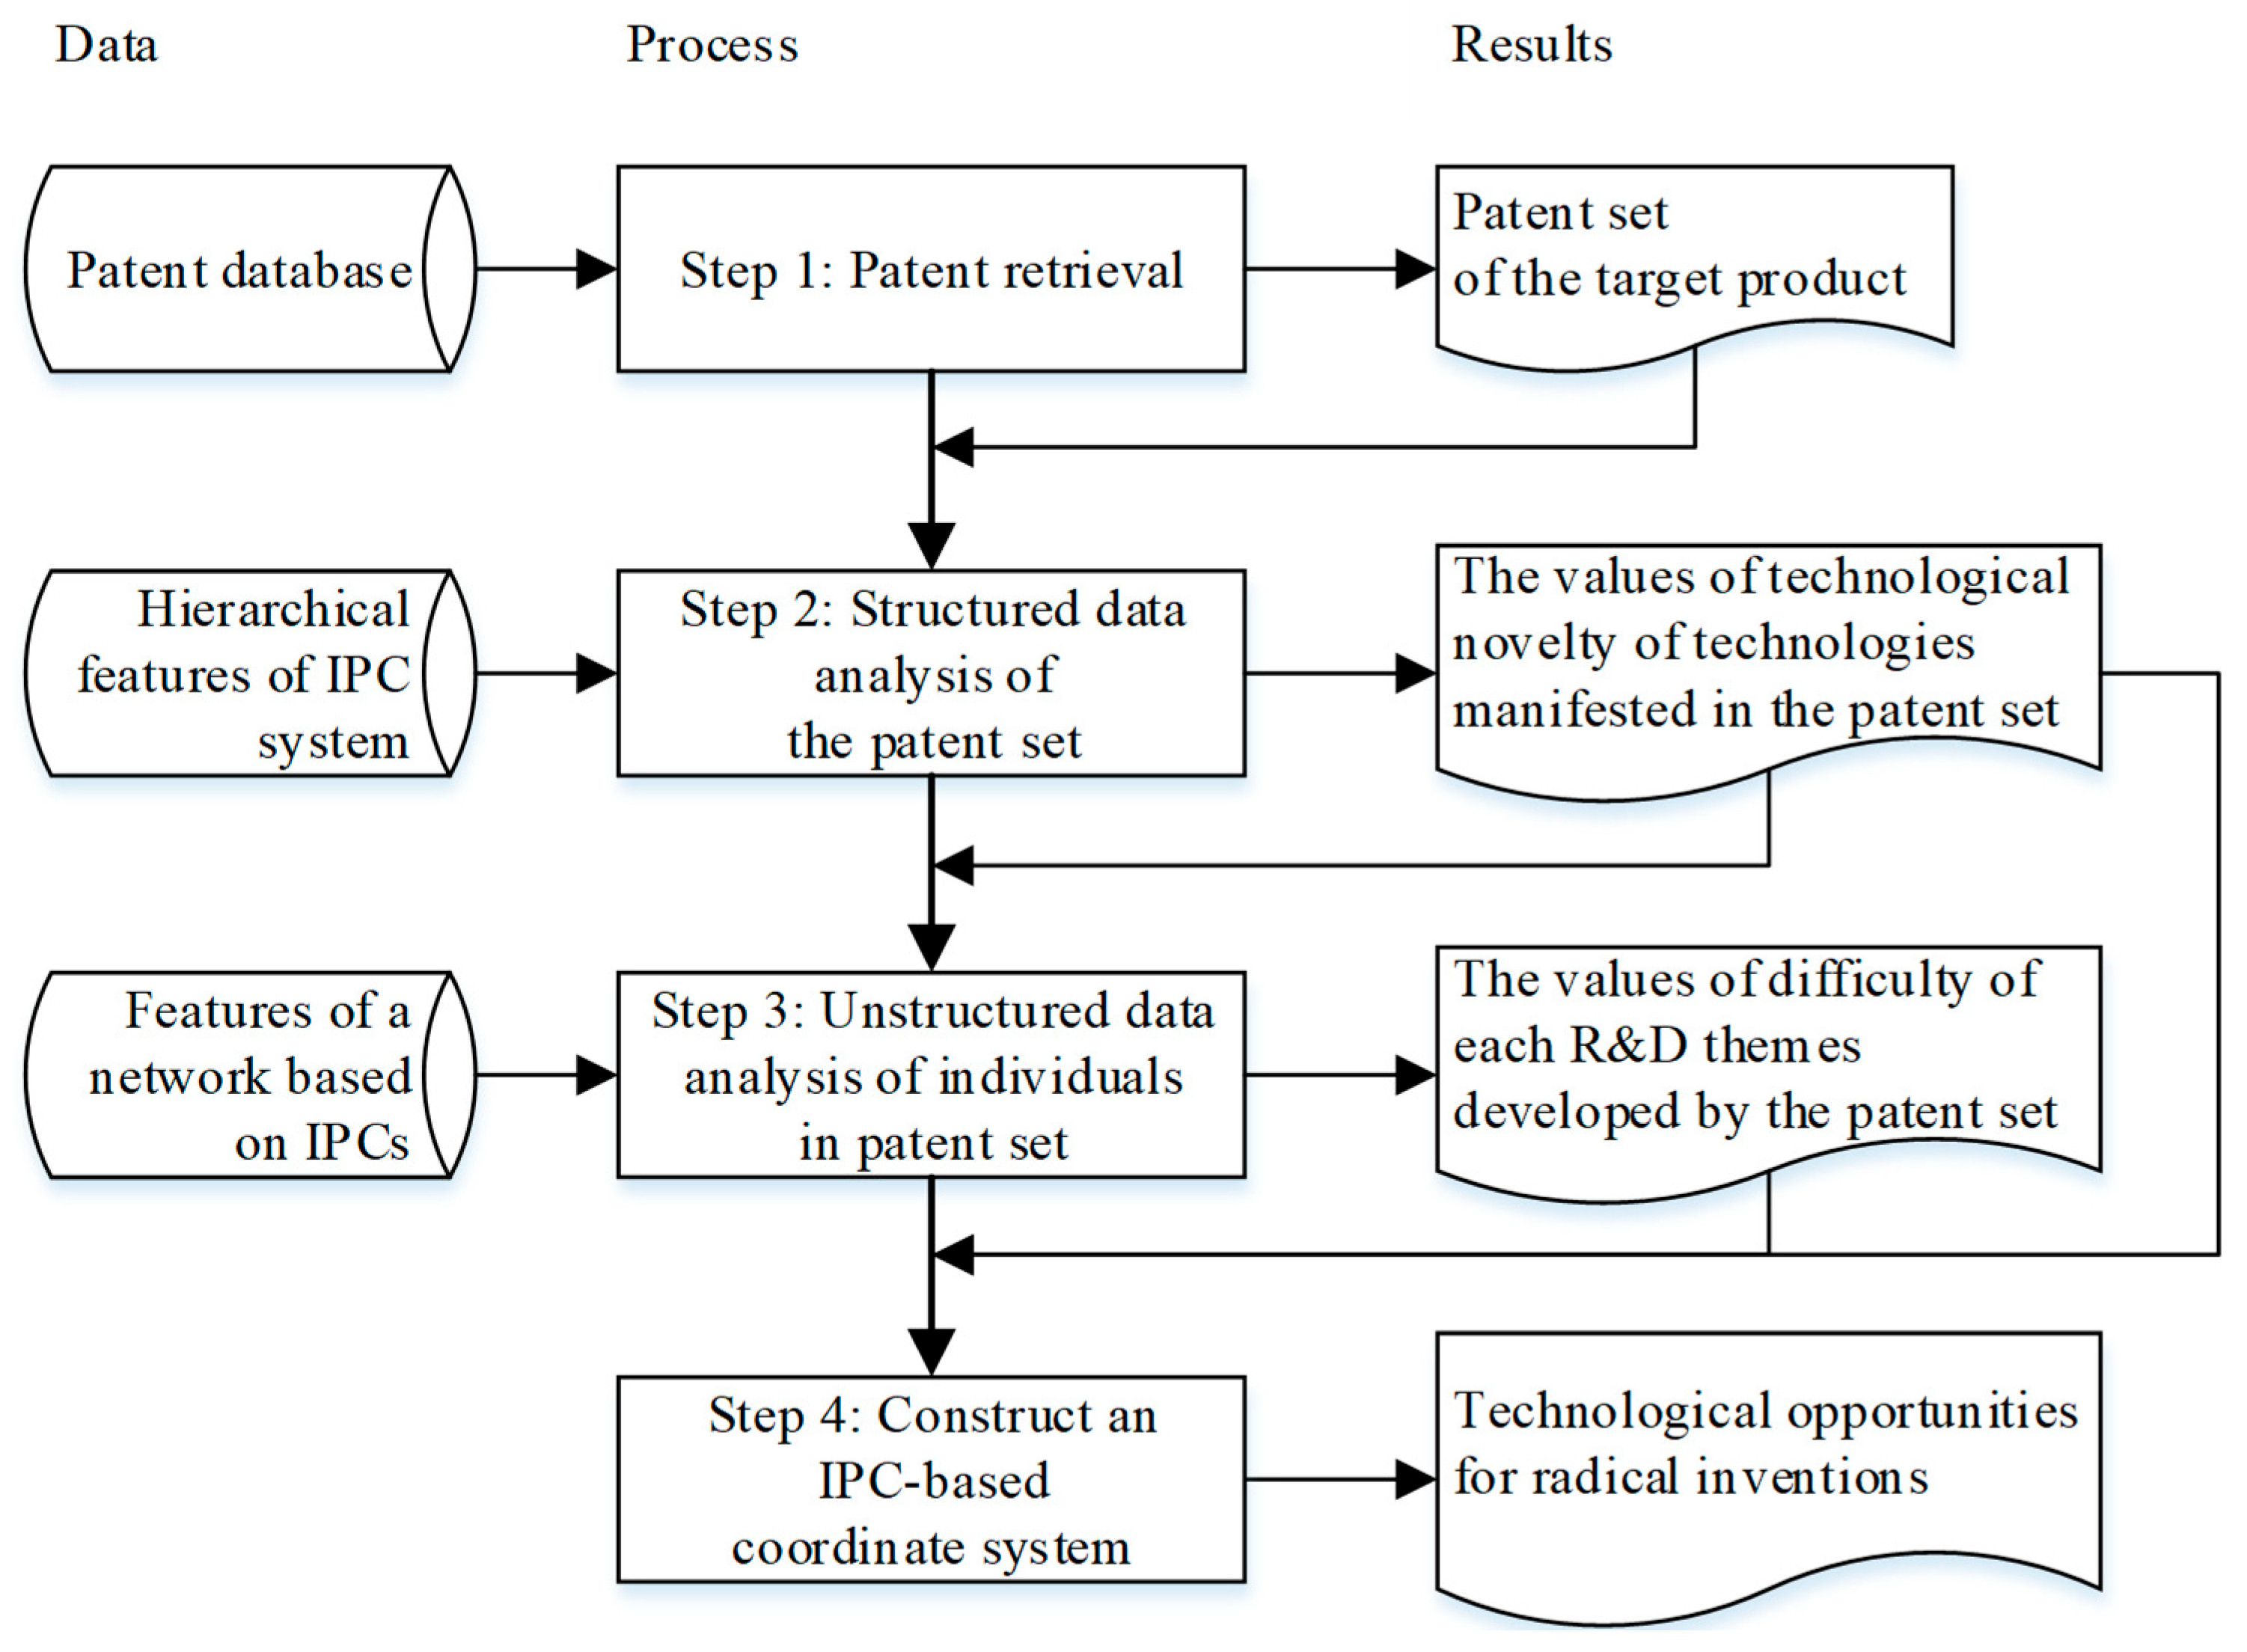
The overall flow of the proposed identification approach based on the IPC is shown in Figure 2. First, a search query is used to find a patent set from the patent databases. Second, structured data of the patents, such as the IPC symbols and application dates, are gathered for the determination of the value of technological novelty (VON) of each technology manifested in the patent set. In this step, bifurcation and the hierarchical features of the IPC system are used to find difference of the IPC symbols, which determines the novelty of technical features among patents after attaching time attributes. Third, R&D themes and their values of difficulty (VOD) are decided, by analyzing the unstructured data of individuals in the patent set. In this step, features of a complex network composed of IPC symbols are used as the value of difficulty. Then, an IPC-based coordinate system is built based on VON and VOD, to identify technological opportunities for radical inventions. The details of these steps are as follows:
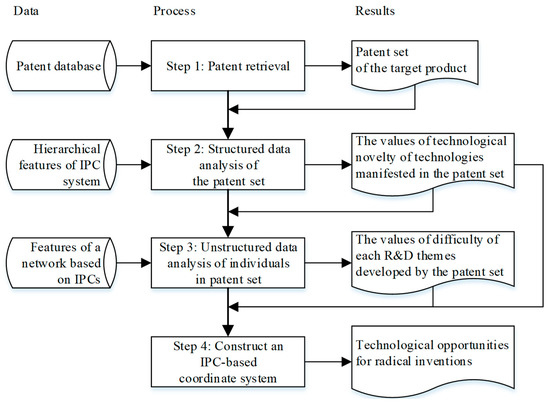
Figure 2.
Framework for identifying technological opportunities of radical inventions.
3.2.1. Patent Retrieval
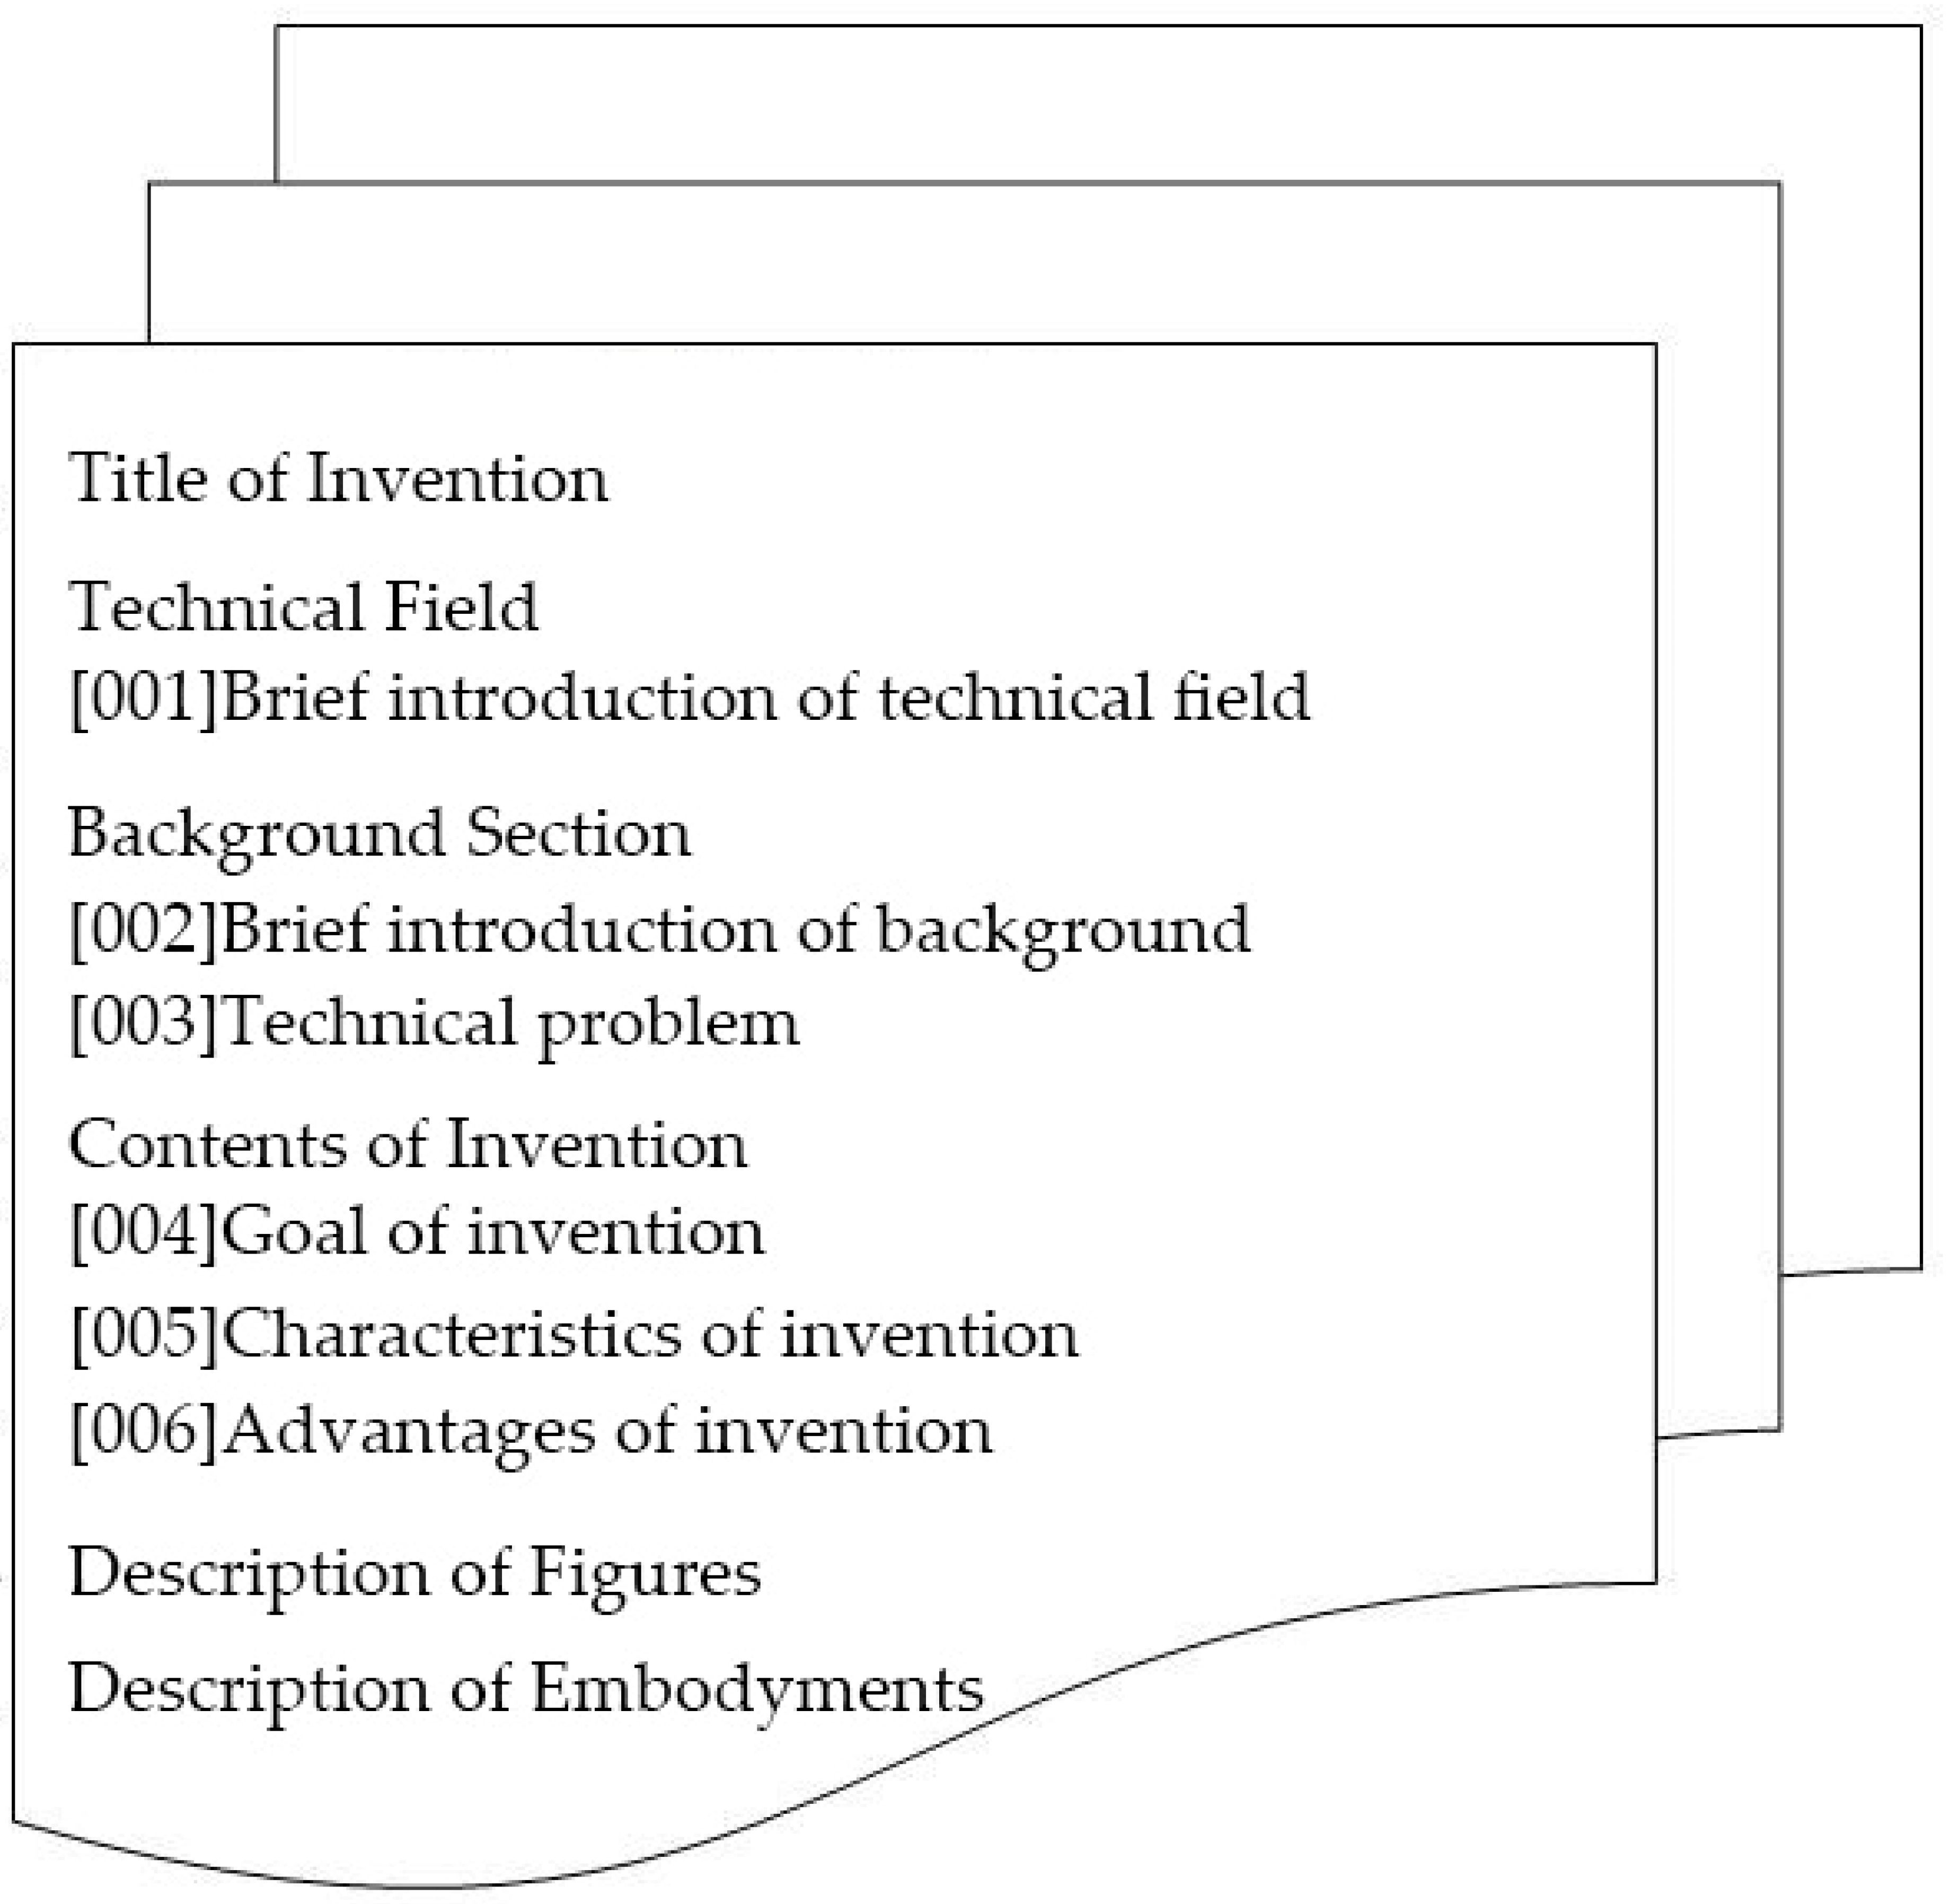
To ensure the accuracy of data, patent data are retrieved from online databases managed by national offices or authoritative enterprises, such as the United States Patents and Trademark Office (USPTO), Derwent Innovations IndexSM, State Intellectual Property Office of PRC (SIPO), China Intellectual Property Right Net (CNIPR), etc. In addition, inventions, differently from utility models and designs, have to undergo a strict examination for novelty and creativity, referring to lots of technical documents. Accordingly, they are assumed as appropriate data sources for this study. Then, the application dates, IPC symbols, and description sections of the patents are collected.
Figure 3 shows the standard description section of a Chinese invention. The description section of a patent contains the technical field, technical problems, technical characteristics, and advantageous effects of the invention, etc. Since the background section is a detailed description of the current state of the patented technology field and explains the problems of existing products, this research recommends choosing it as the research object for the subsequent unstructured data analysis.
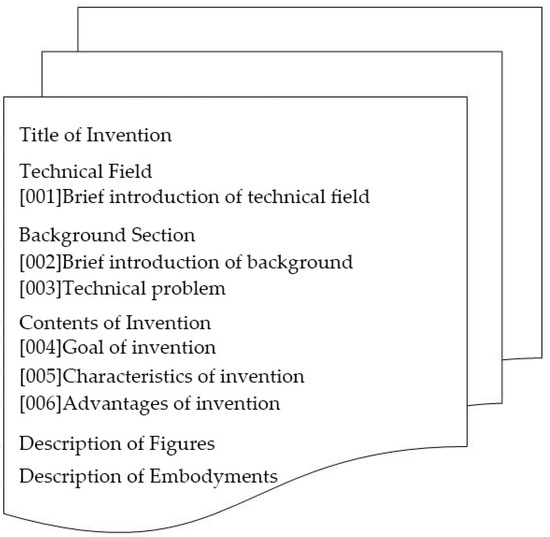
Figure 3.
Structure of the description section of a Chinese invention.
3.2.2. Structured Data Analysis
The values of the technological novelty (VON) of a technology manifested in a patent are determined using a novel map of technology changes over time, based on structured data of the patent set, as shown in Figure 4. This reveals the emergence of new technologies. A three-step process is introduced to draw a map for calculating VON, as follows:

Figure 4.
A map of technological changes over time.
- 1.
- Fill in an IPC/date matrix, as shown in Table 1. The application dates are in the first column of the matrix (the date interval can be yearly, quarterly, monthly, etc.), and the IPC symbols of each patent in the patent collection are in the first row. The number of patents that meet both the application date and IPC symbol is placed in the corresponding position in the matrix. The application date set is Y = {Y1, Y2, Y3, …, Yi, …, Yj, …, YM} and the IPC symbol set is IPC = {IPC1, IPC2, IPC3, …, IPCn, …, IPCN}.
 Table 1. IPC/date matrix.
 - 2.
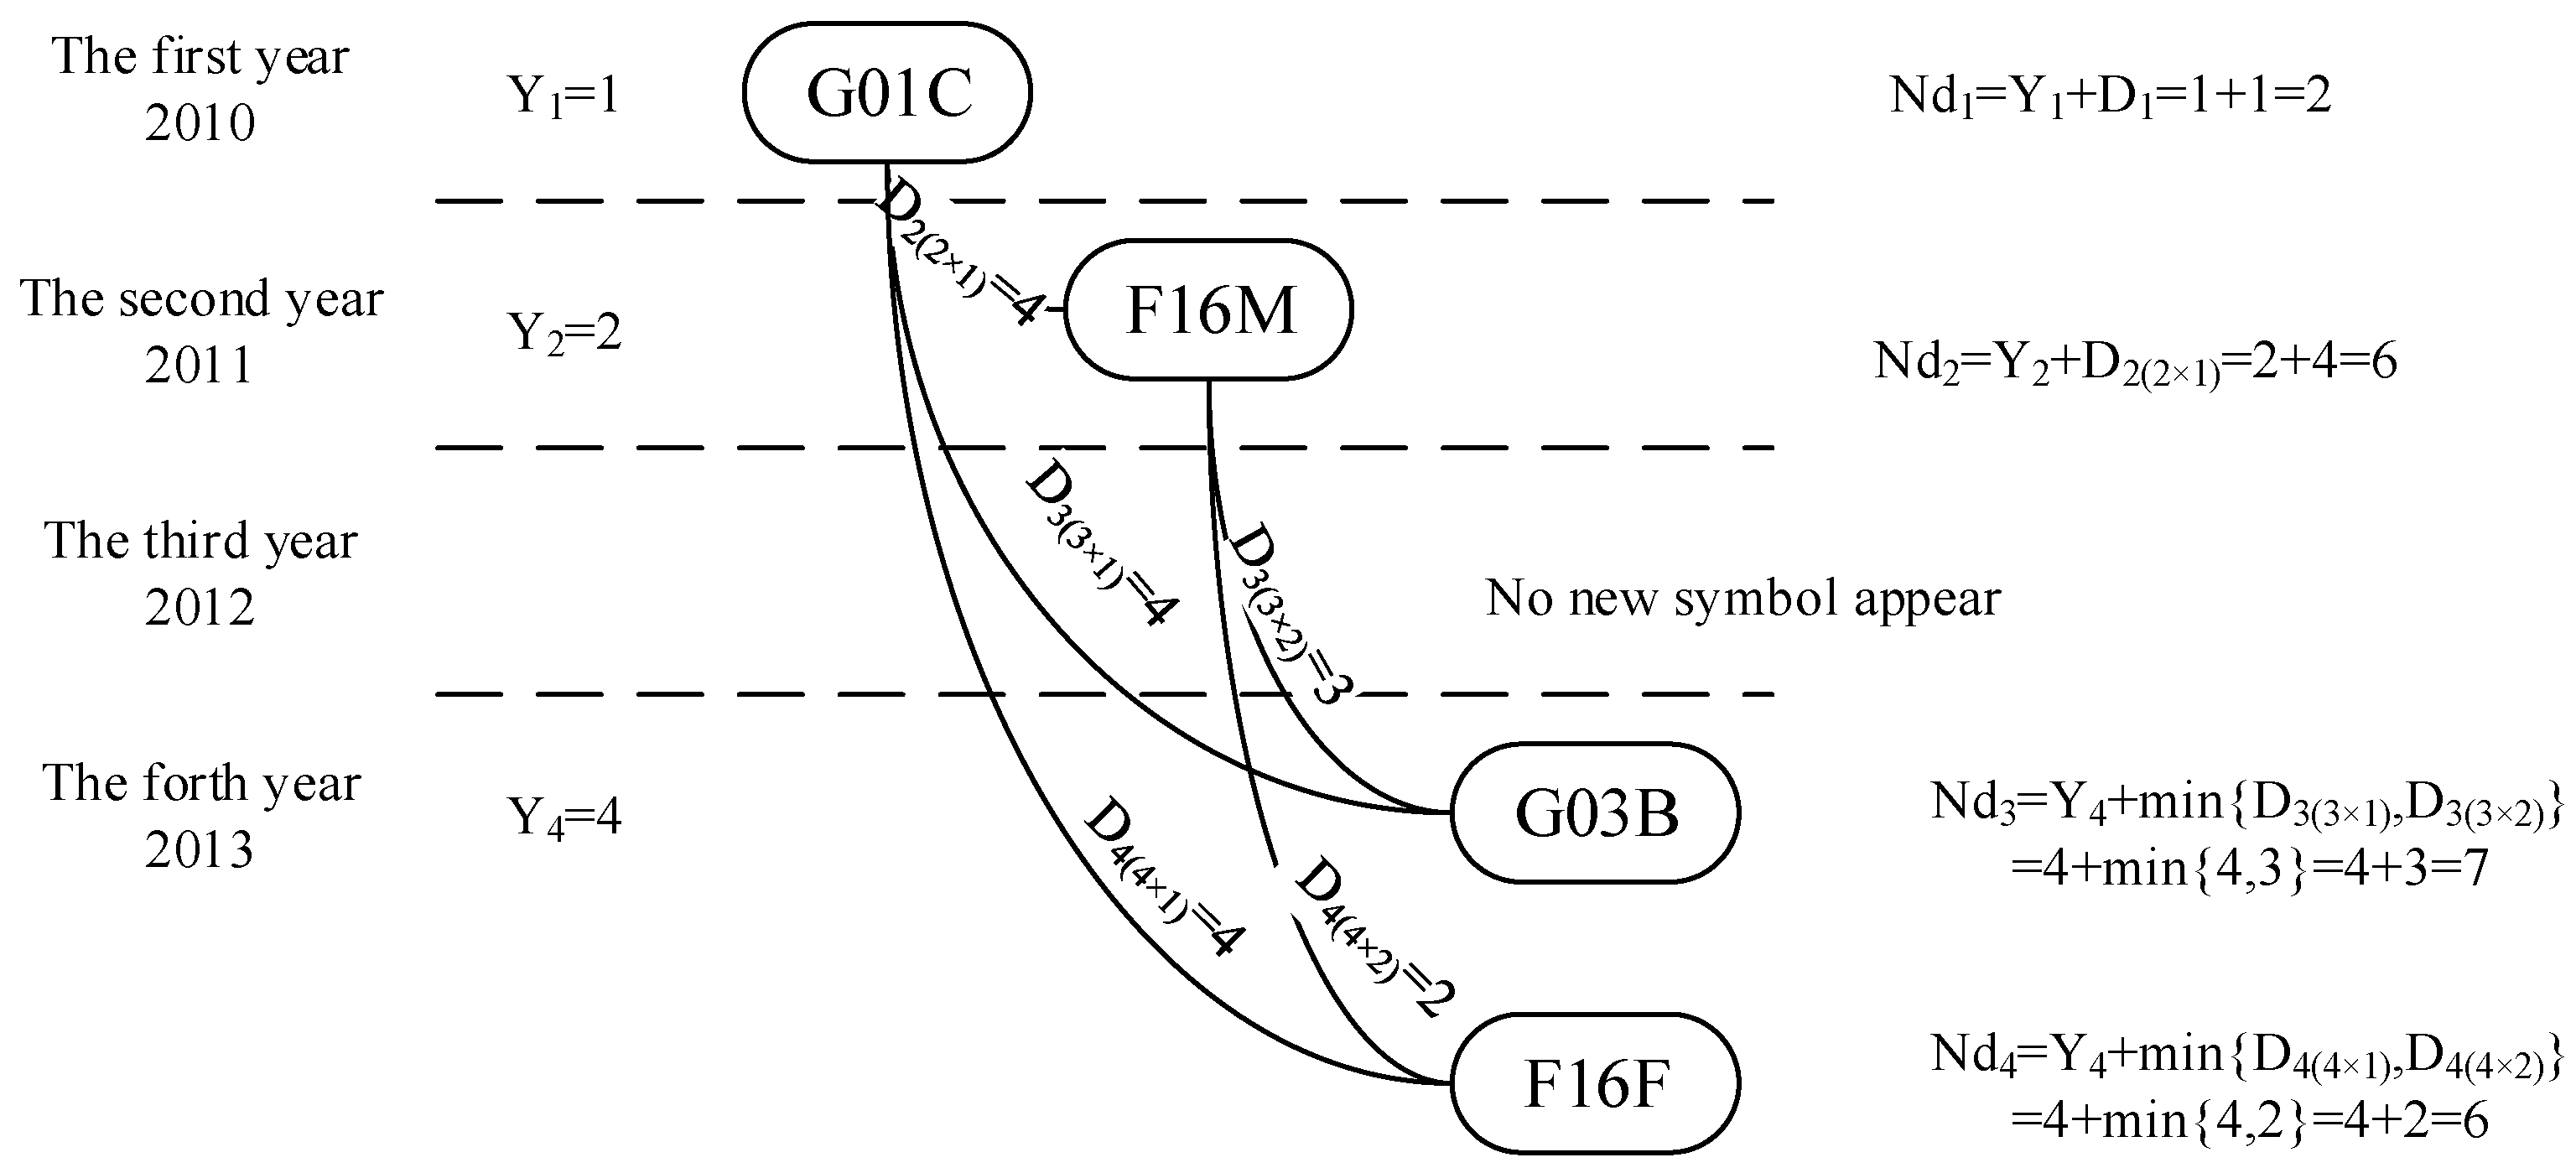
- Use the IPC/date matrix as the input to a map of technological changes over time. Use application year as the time interval for illustration. The nodes in the map are all IPC symbols, to which patents belongs in the first year and new IPC symbols in each subsequent year. Then, the nodes distributed in different years are connected, and connections are weighted based on the difference between pairwise IPC symbols. The difference is marked as Dn(j×i), its value represents the degree of difference between the IPCj and IPCi, where j > i and IPCj appear for the first time in Yn. Assign values based on the following rules: Dn is 2 if the difference exists only in the last English letter between two IPC symbols, 3 for the same chapter symbols, and 4 for inconsistent chapter symbols.
- 3.
- The degree of novelty set of IPC symbols is Nd = {Nd1, Nd2, Nd3, …, NN}. The degree of novelty of an IPC symbol depends on both its difference from existing IPC symbols and the year when it first appeared, which can be decided as:where y is the mark of an IPC that first appeared in year i.Ndy = Yi + min{Dy(i×(i–1)), Dy(i×(i–2)), …, Dy(i×2), Dy(i×1)},
Therefore, the larger the Ndx, the higher the degree of novelty of IPC symbols.
Taking Figure 4 as an example, G01C first appeared in 2010, so the degree of novelty of G01C is Nd1 = Y1 + D1 = 1 + 1 = 2. In the second year, only F16M emerged; thus, the degree of novelty of F16M is Nd2 = Y2 + D2(2×1) = 2 + 4 = 6. No new IPC symbols originated in 2012, and G03B and F16F arose in 2013; therefore, the degree of novelty of G03B is Nd3 = Y4 + min{D3(3×1), D3(3×2)} = 4 + min{4, 3} = 4 + 3 = 7; and the degree of novelty of F16F is Nd4 = Y4 + min{D4(4×1), D4(4×2)} = 4 + min{4, 2} = 4 + 2 = 6. The results show that there are three categories: G01C that appears first, F16F and F16M with higher values of technological novelty (VON), and G03B with the highest VON.
3.2.3. Unstructured Data Analysis
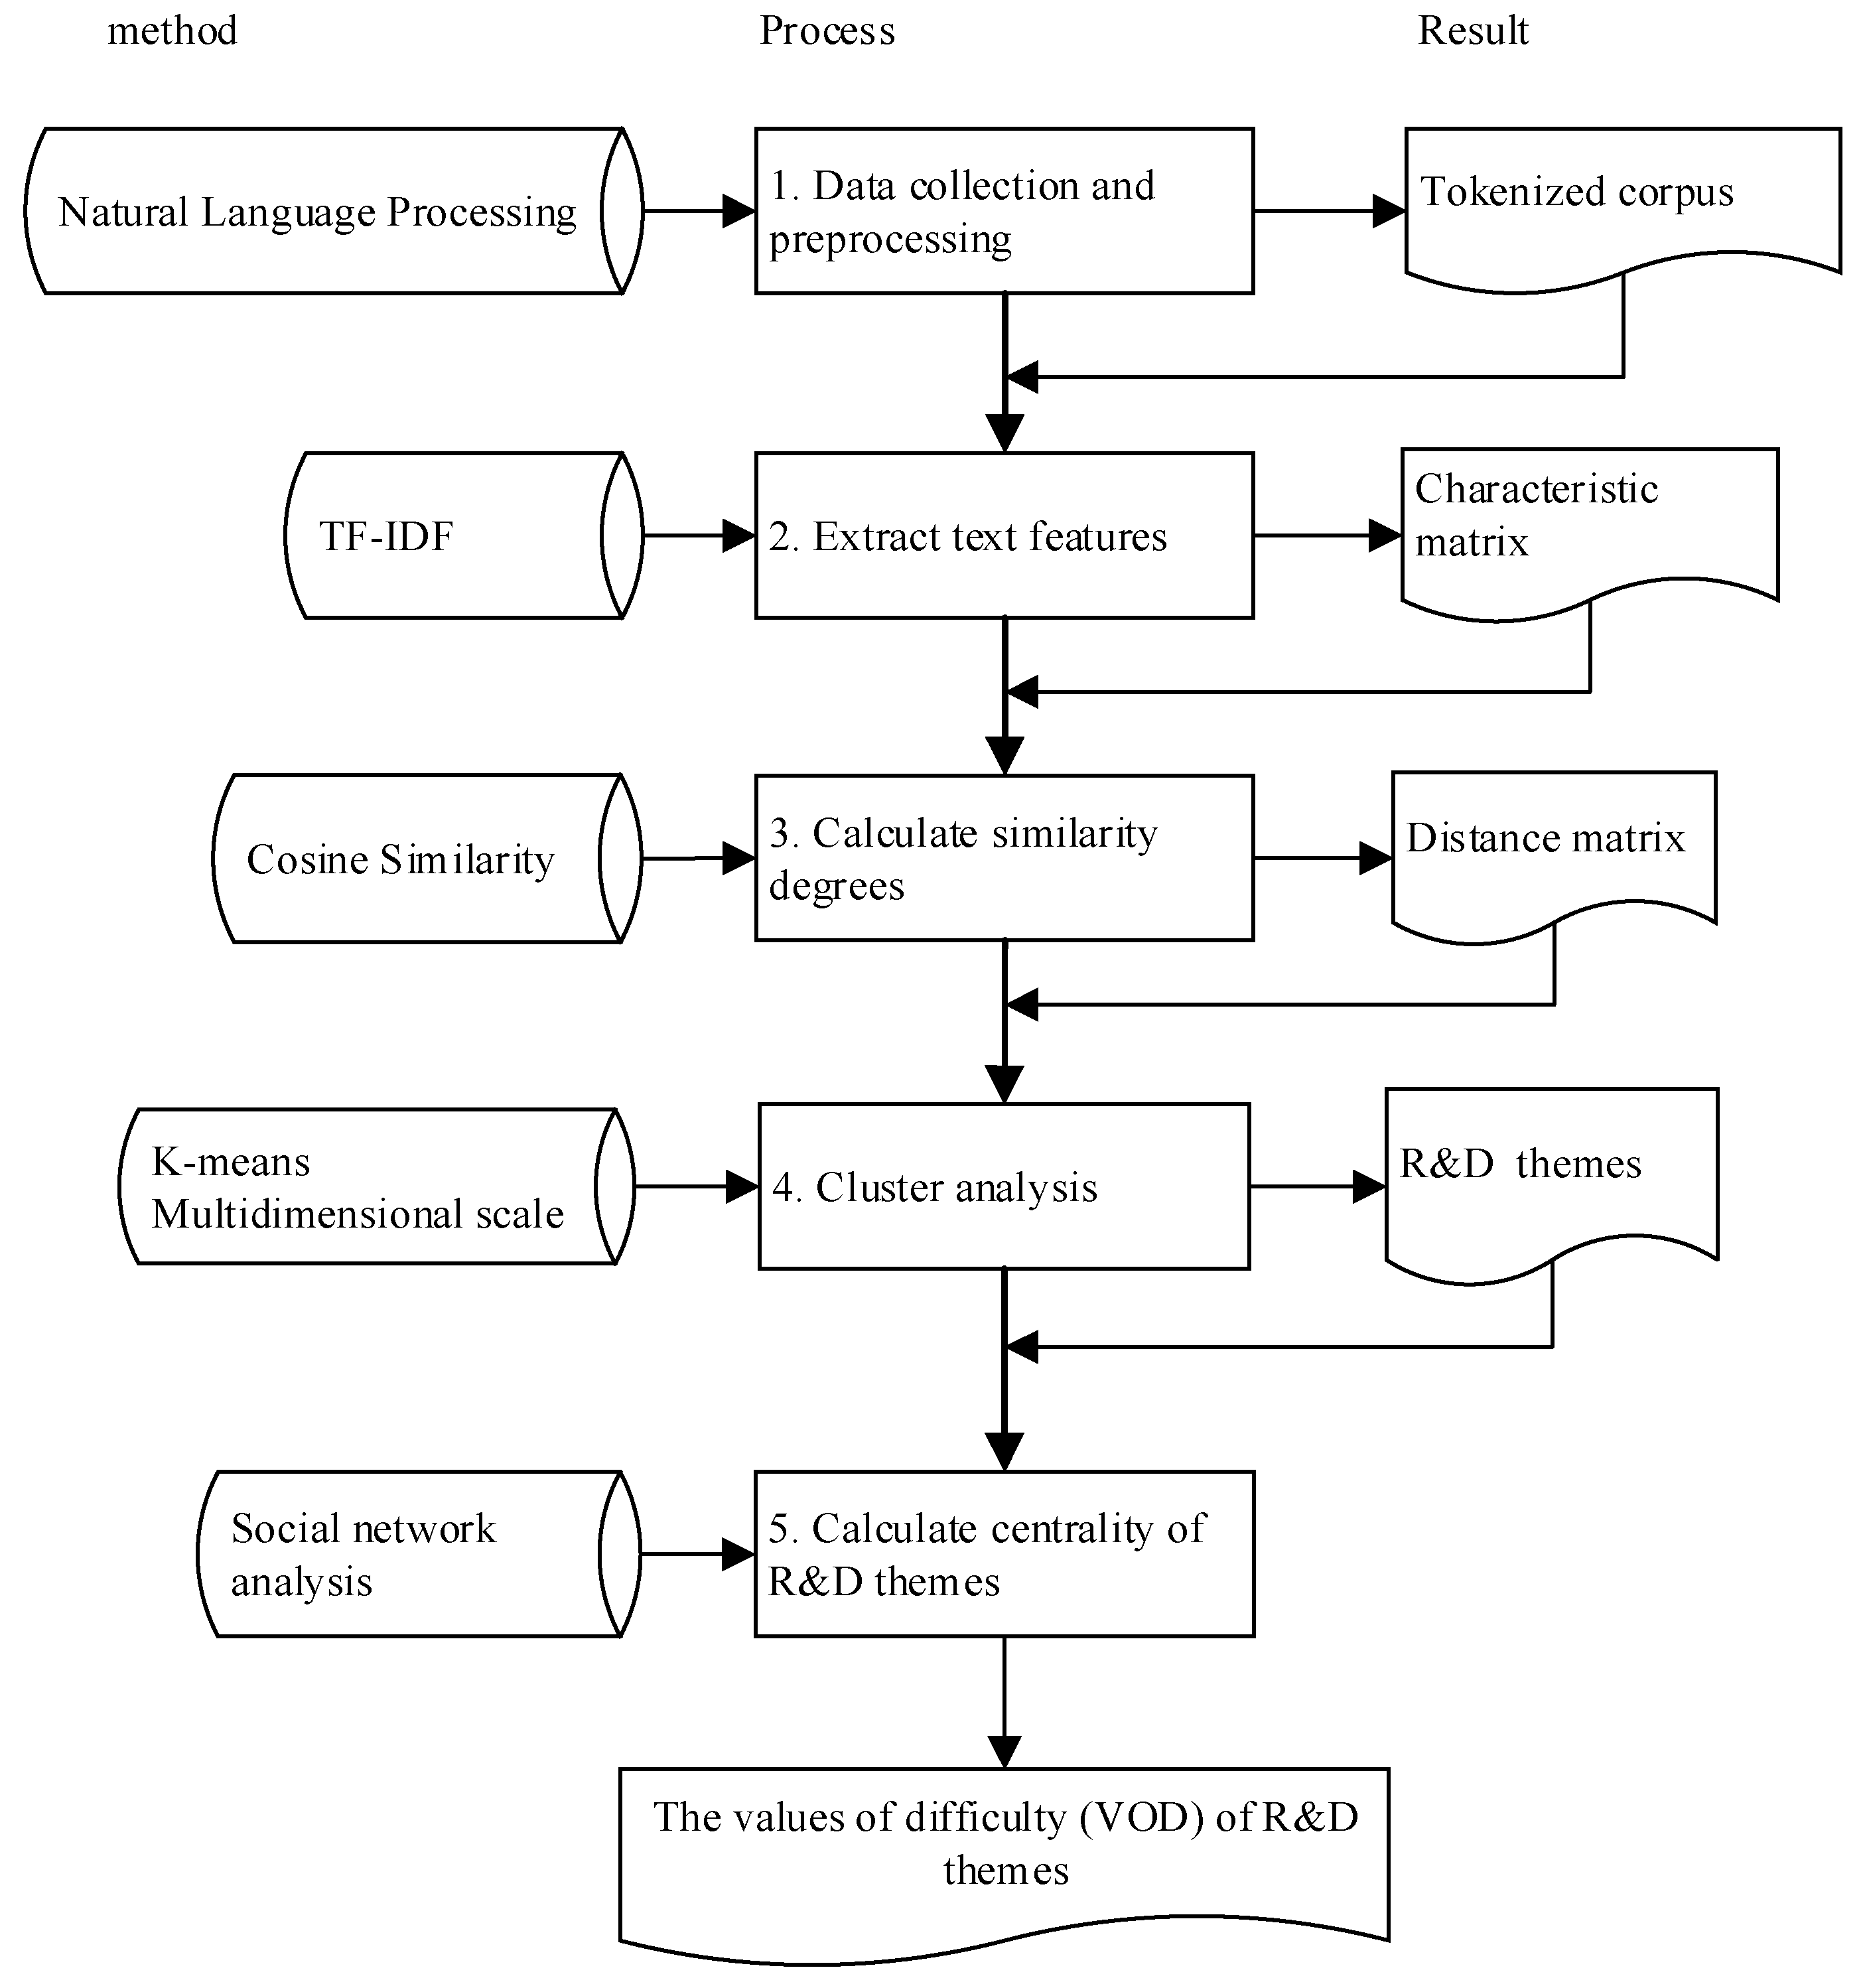
To determine the technical problems solved by the patent set and obtain their values of difficulty (VOD) effectively, natural language processing, K-means cluster analysis, and network analysis are recommended, to process the unstructured data of the patent set. A five-step process is proposed, as shown in Figure 5.
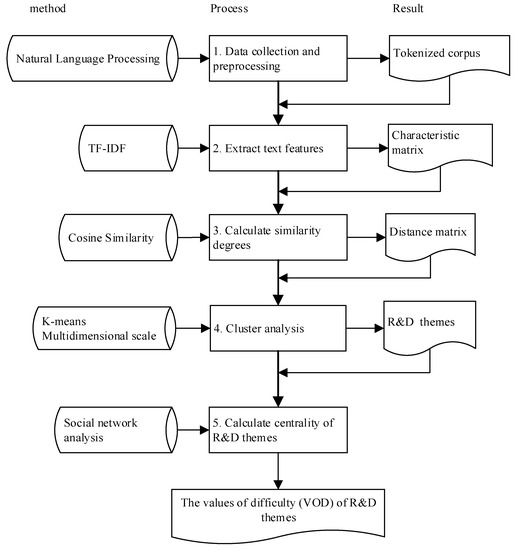
Figure 5.
Workflow of the natural language process and cluster analysis of patent specifications.
The details are as follows:
- Data collection and preprocessing: This includes loading a user dictionary, removing stop words and text segmentation (used to indicate boundaries of words, such as Chinese and Japanese, etc. those languages without any spaces between words), and tagging words, etc., to obtain a tokenized patent corpus. Nltk (or jieba, to segment a Chinese sentence) in Python is used to implement preprocessing, with the aim of simplifying the process and improving the analysis results.
- Text feature extraction: This uses term frequency–inverse document frequency (TF–IDF) [53] to highlight words that differ greatly from one patent to another, to extract the technical features of a patent. The proprietary technical features of the patent reflect its R&D theme, which to a certain extent is the technical problem solved by the patent. Each patent is represented by a vector, which is constructed from the TF-IDF value of each keyword. Then, the vector normalization features of all the patents are built in a characteristic matrix.
- Calculation of degree of similarity: The cosine similarity is decided between patents and constructed using a cosine distance matrix.
- Cluster analysis: K-means clustering is used to obtain the classified R&D themes of the patent set. The number of clusters should be determined before using the K-means clustering. The latent Dirichlet allocation’s perplexity is selected, to estimate the appropriate number of clusters, since it is the most extensively used and well-developed process. Scikit-learn in Python is used to implement the K-means cluster analysis, with the aim of simplifying the process and improving the analysis results. Figure 6 shows the Python implementation codes for the previous four steps.
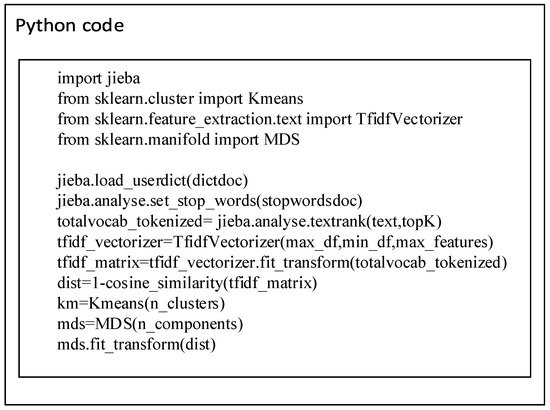 Figure 6. Python implementation code for natural language processing and K-means clustering.
- 5.
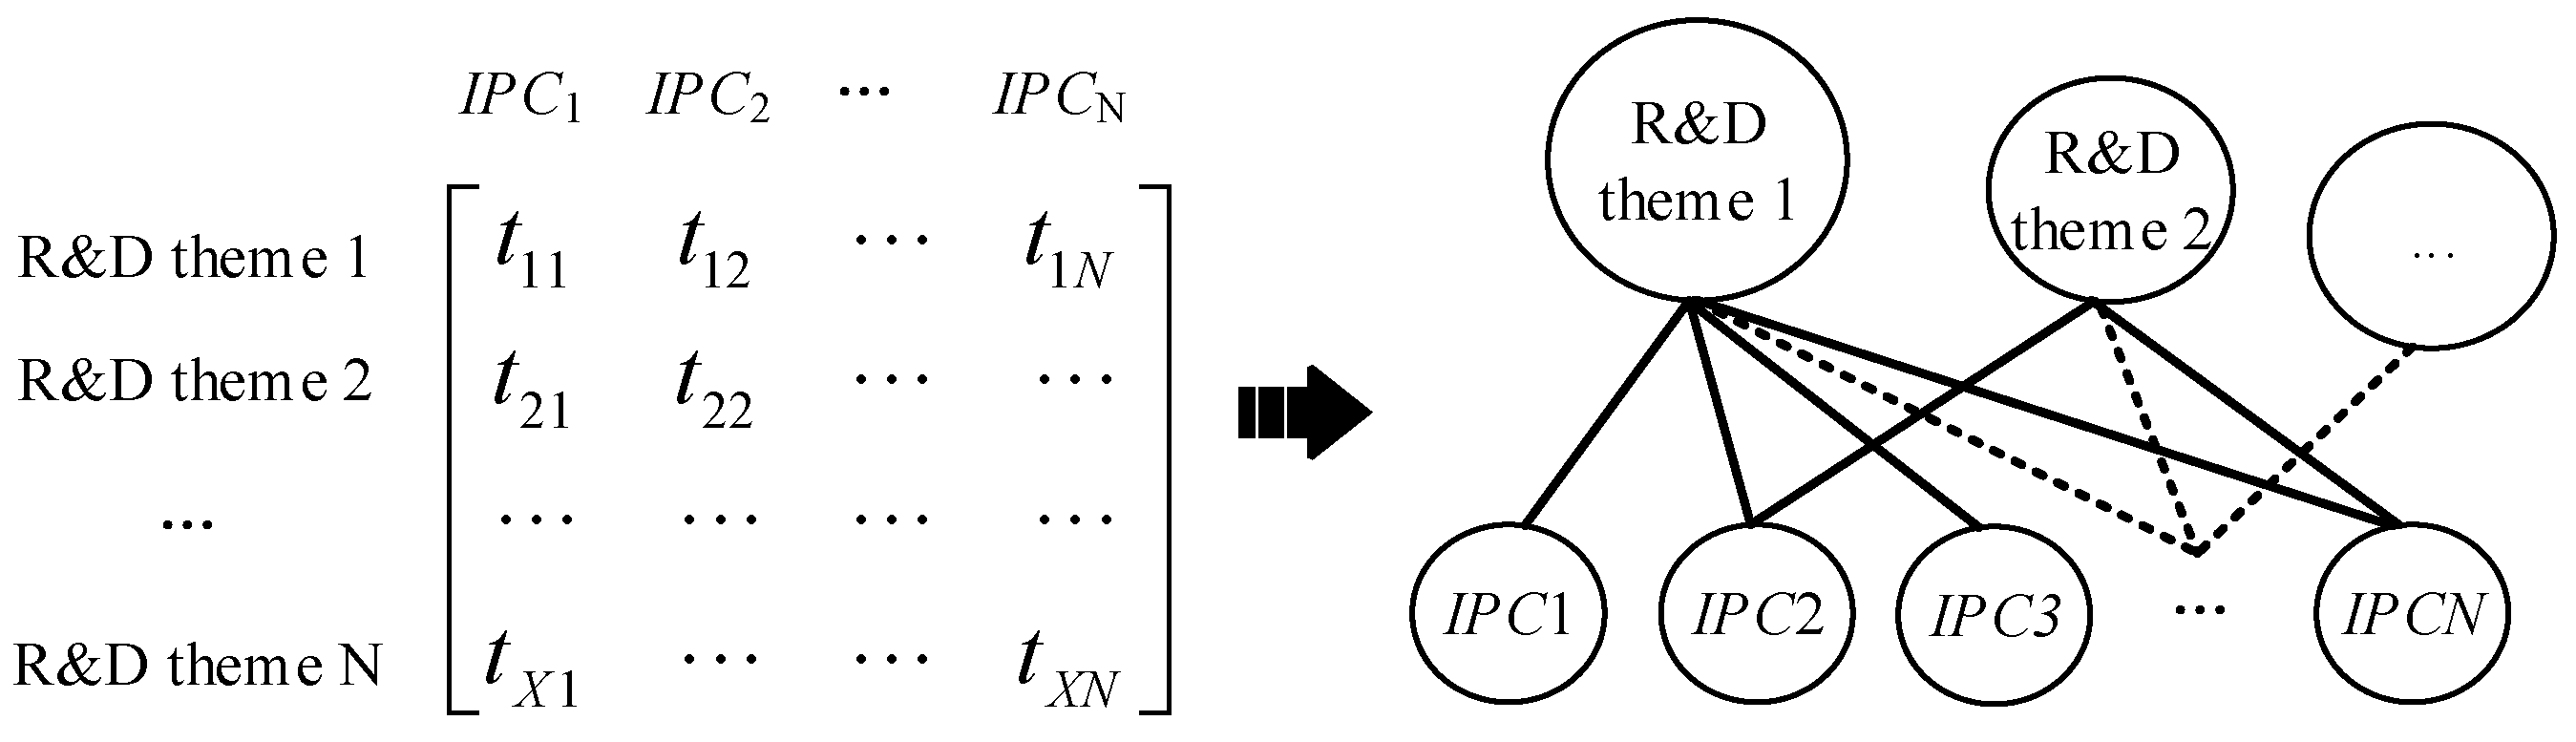
- Calculating the centrality of R&D themes: An IPC network is built to measure the value of difficulty (VOD) of R&D themes. This research developed an IPC and R&D theme matrix, as shown in Figure 7, and used this matrix as the input to the IPC network analysis.
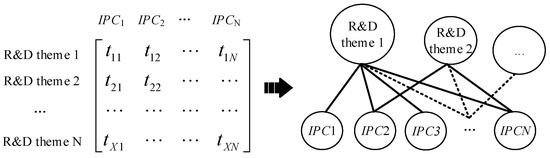 Figure 7. Network analysis using based on IPC nodes and R&D theme nodes.
As shown in Figure 7, the nodes represent each IPC and R&D theme of the patent set. More IPC symbols connected to a R&D theme node means that the technology used to solve the problem is more inclined to cross-domain characteristics. For each R&D theme node, network indicators are calculated. The degree of centrality represents the sum of the R&D theme nodes connected to IPC nodes. That is, the bigger the centrality of a R&D theme node, the higher the VOD of the R&D theme. In this way, R&D themes are finally sorted by difficulty. The degree of centrality of R&D theme p in the IPC network can be measured as:
3.2.4. IPC-Based Coordinate System
In this paper, technological opportunities for RIs are defined as “patents using higher VOC technology to solve higher VOD problems”. For technological opportunities for RIs, this research constructed an IPC-based coordinate system based on VON and VOD. First, IPC symbols obtained in Section 3.2.2 are arranged on the x-axis direction of a coordinate system according to the VON, and the R&D themes are arranged on the y-axis direction, according to VOD. Patents that meet both the x and y values are then placed at the intersection of values x and y. Thus, patents farther from the coordinate origin are more in line with the characteristics of technological opportunities for RIs, and the blank space around these patents or the use of the newest technology applied in R&D themes farther away from the x-axis are also more likely to produce radical inventions.
4. Case Study
To illustrate the effectiveness and efficiency of our proposed method, we present identification results using patents related to unmanned aerial vehicles (UAVs). UAVs are widely used in military, transportation, agroforestry, and contemporary disaster-relief work, to perform tasks such as investigation, transport, and filming, due to their advantages of light weight, flexible maneuverability, and user-friendly control. In recent years, more and more companies have invested in the development of UAVs. A total of 19235 patents were gathered from Patsnap (https://analytics.zhihuiya.com, accessed on 12 November 2019) using the search query “DESC: (“unmanned aerial vehicle” OR “UAV”) AND PATENT_TYPE: (granted) AND APD: [20000101 TO 20191112]” (date: 12 November 2019).
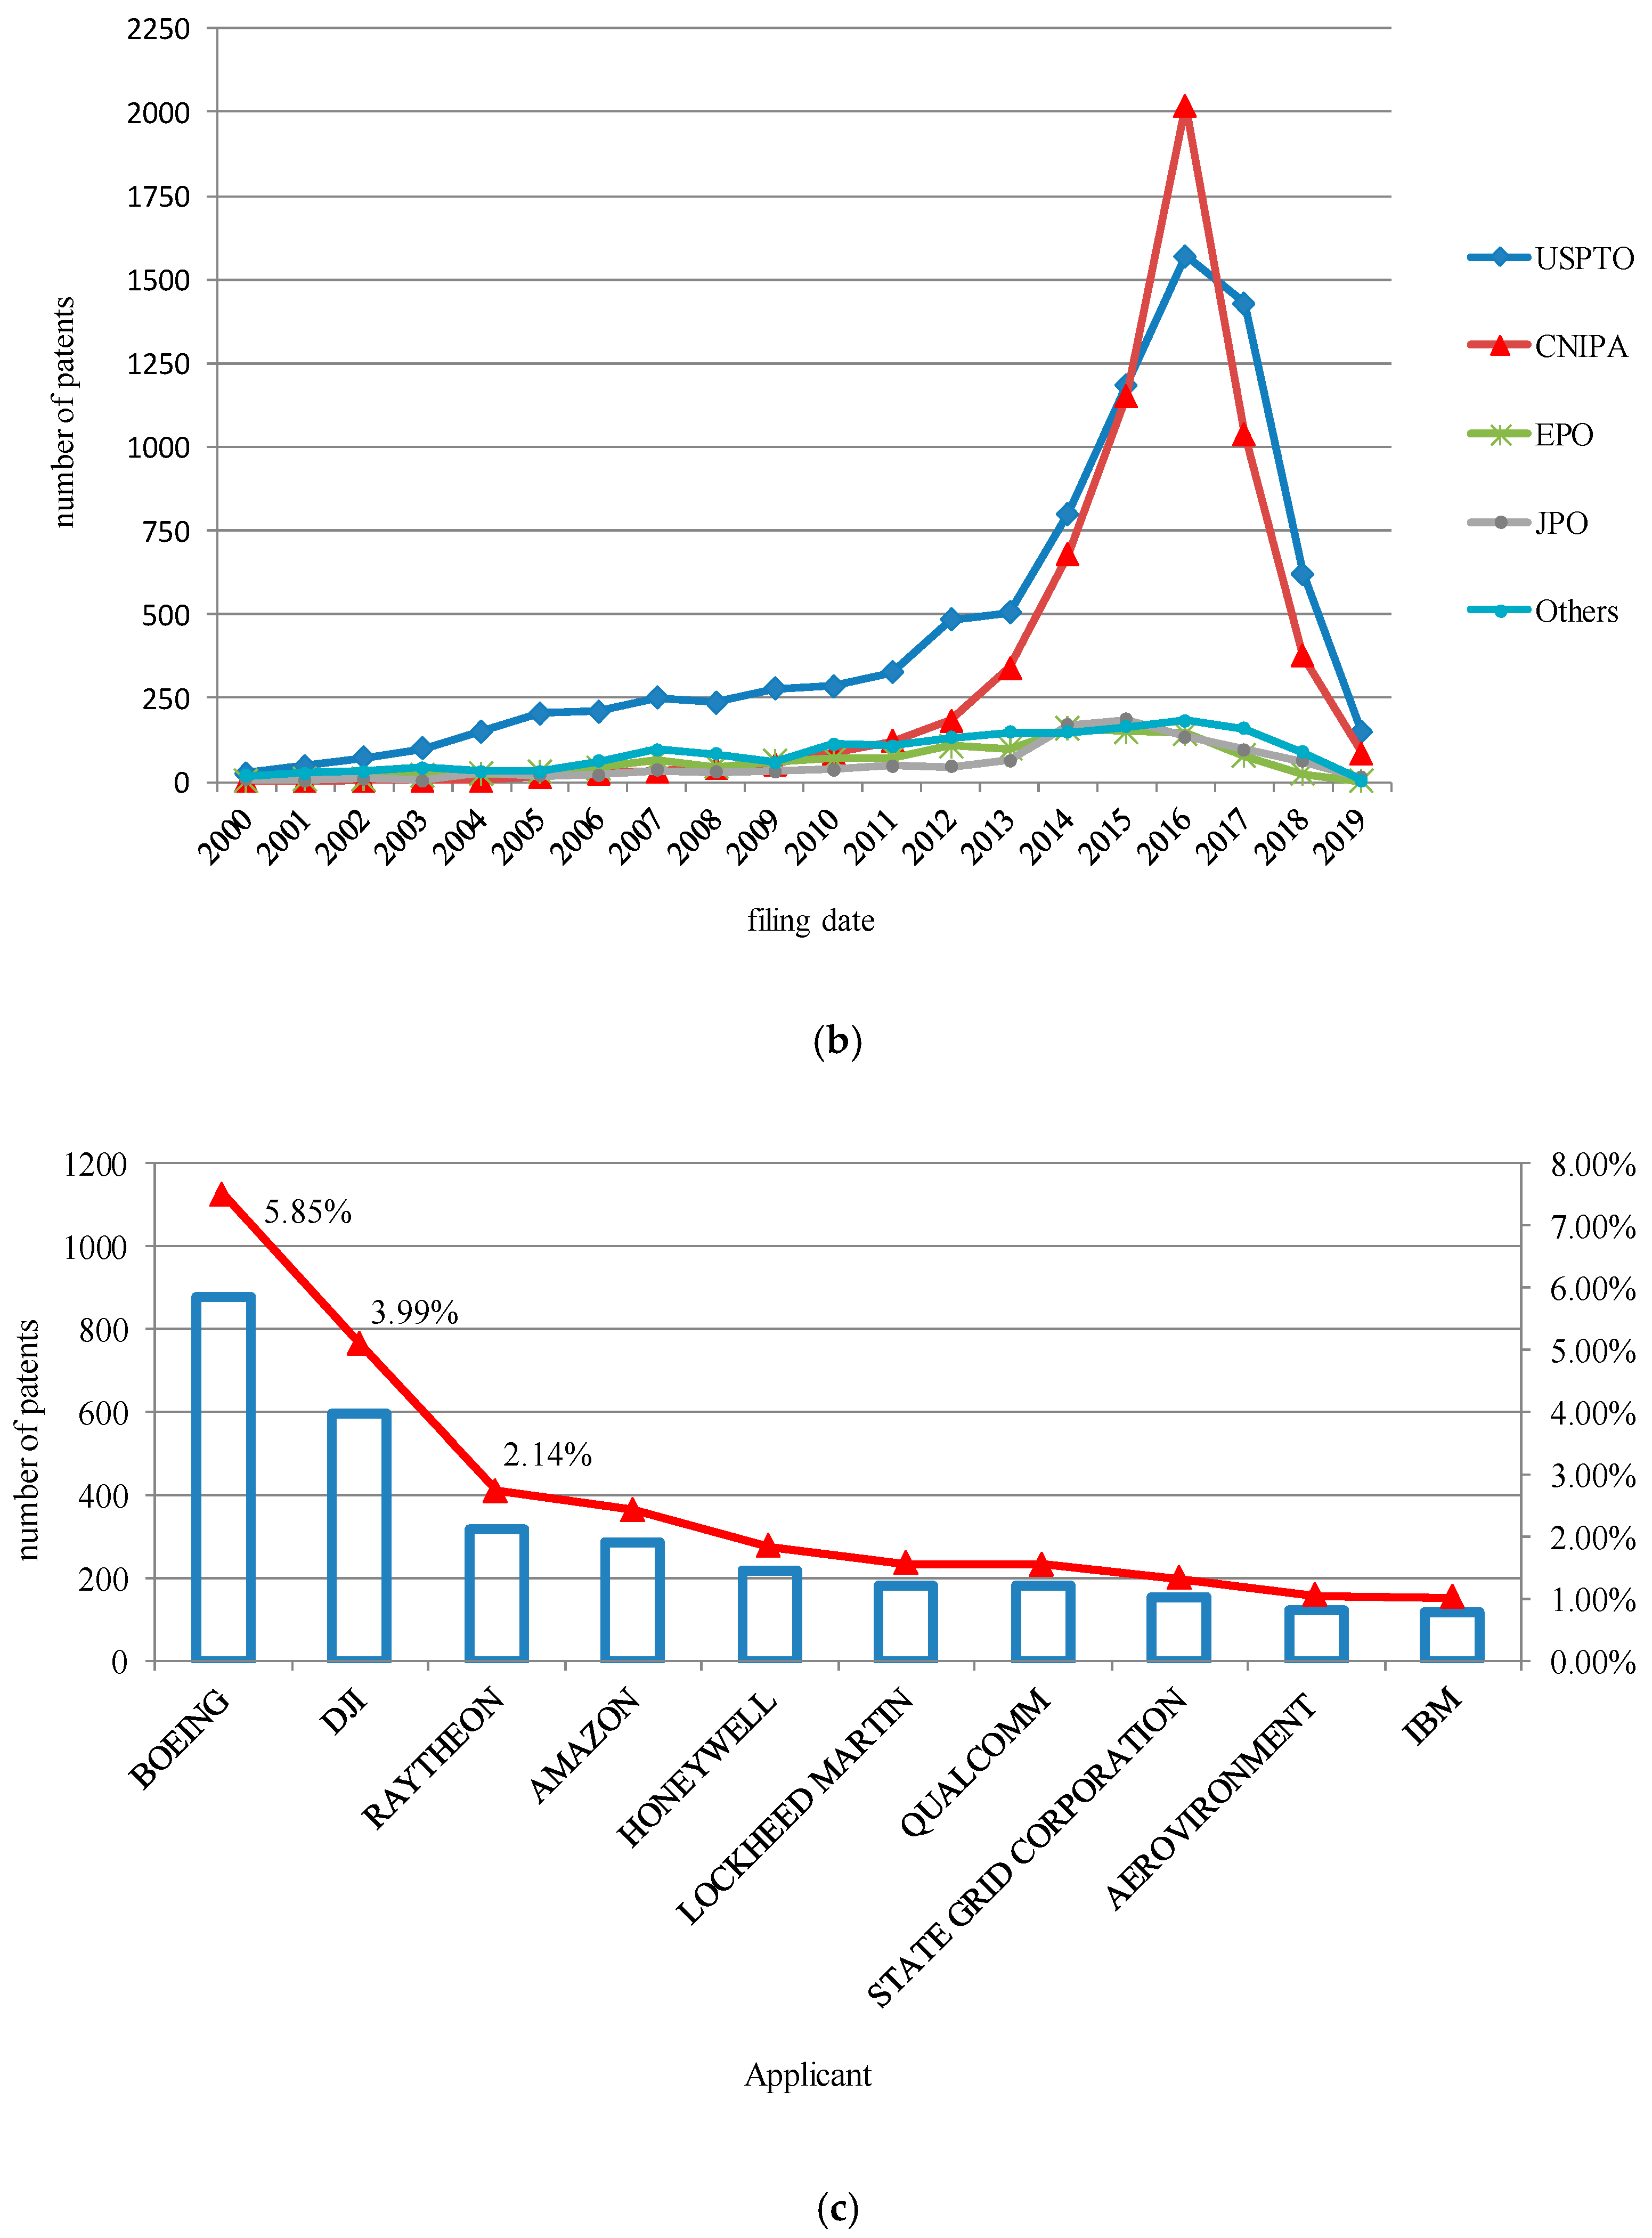
Figure 8 illustrates the statistics of the granted patents retrieved. In general, the yearly filing number of UAV patents increased moderately from 2000 to 2010, which indicates that UAV technology was developing slowly during that time. After 2010, the patent number witnessed a significant growth and reached at its peak in 2016, as shown in Figure 8a. This shows that UAV technology has been constantly adapting to market demand and constantly being upgraded. The patent numbers from 2017 to 2019 were slightly decreased because of incomplete data, due to the invention review process. Figure 8b shows the annual filing number of UAV patents for each geographical authority. The United States Patent and Trademark Office (USPTO) and China National Intellectual Property Administration (CNIPA) have the most patents applied. In particular, the growth of annual filing of UAV patents in CNIPA has kept pace with the progress of global technology. Although the initial development was slow, it has moved rapidly since 2013, and surpassed the USPTO in 2016, becoming the competitive center of UAV technology. Boeing, Dajiang Innovation (DJI), and Raytheon were the top three companies in terms of the total number and share of filed UAV patents, as shown in Figure 8c. DJI has gradually become a leading enterprise in UAV technology, since 2014 (Figure 8d).
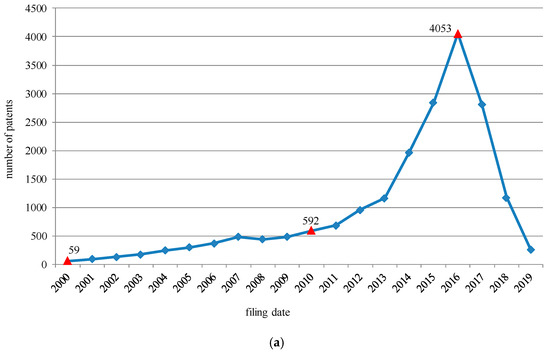
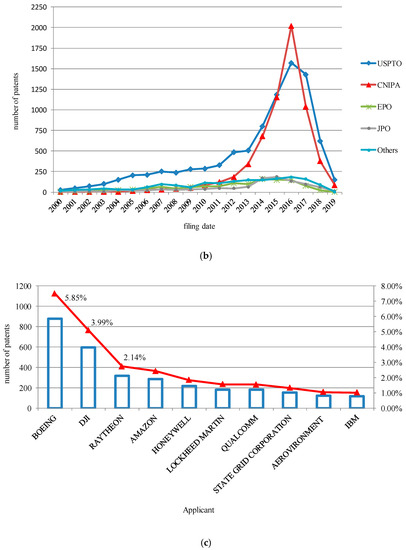
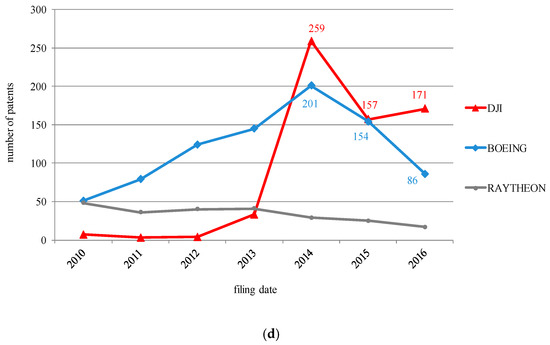
Figure 8.
(a) Yearly filing number of UAV patents; (b) Annual filing number of UAV patents for different geographical authorities; (c) Total number and share of patents granted to and owned by the top ten companies; (d) Yearly filing number of patents applied for by DJI, BOEING, and RAYTHEON.
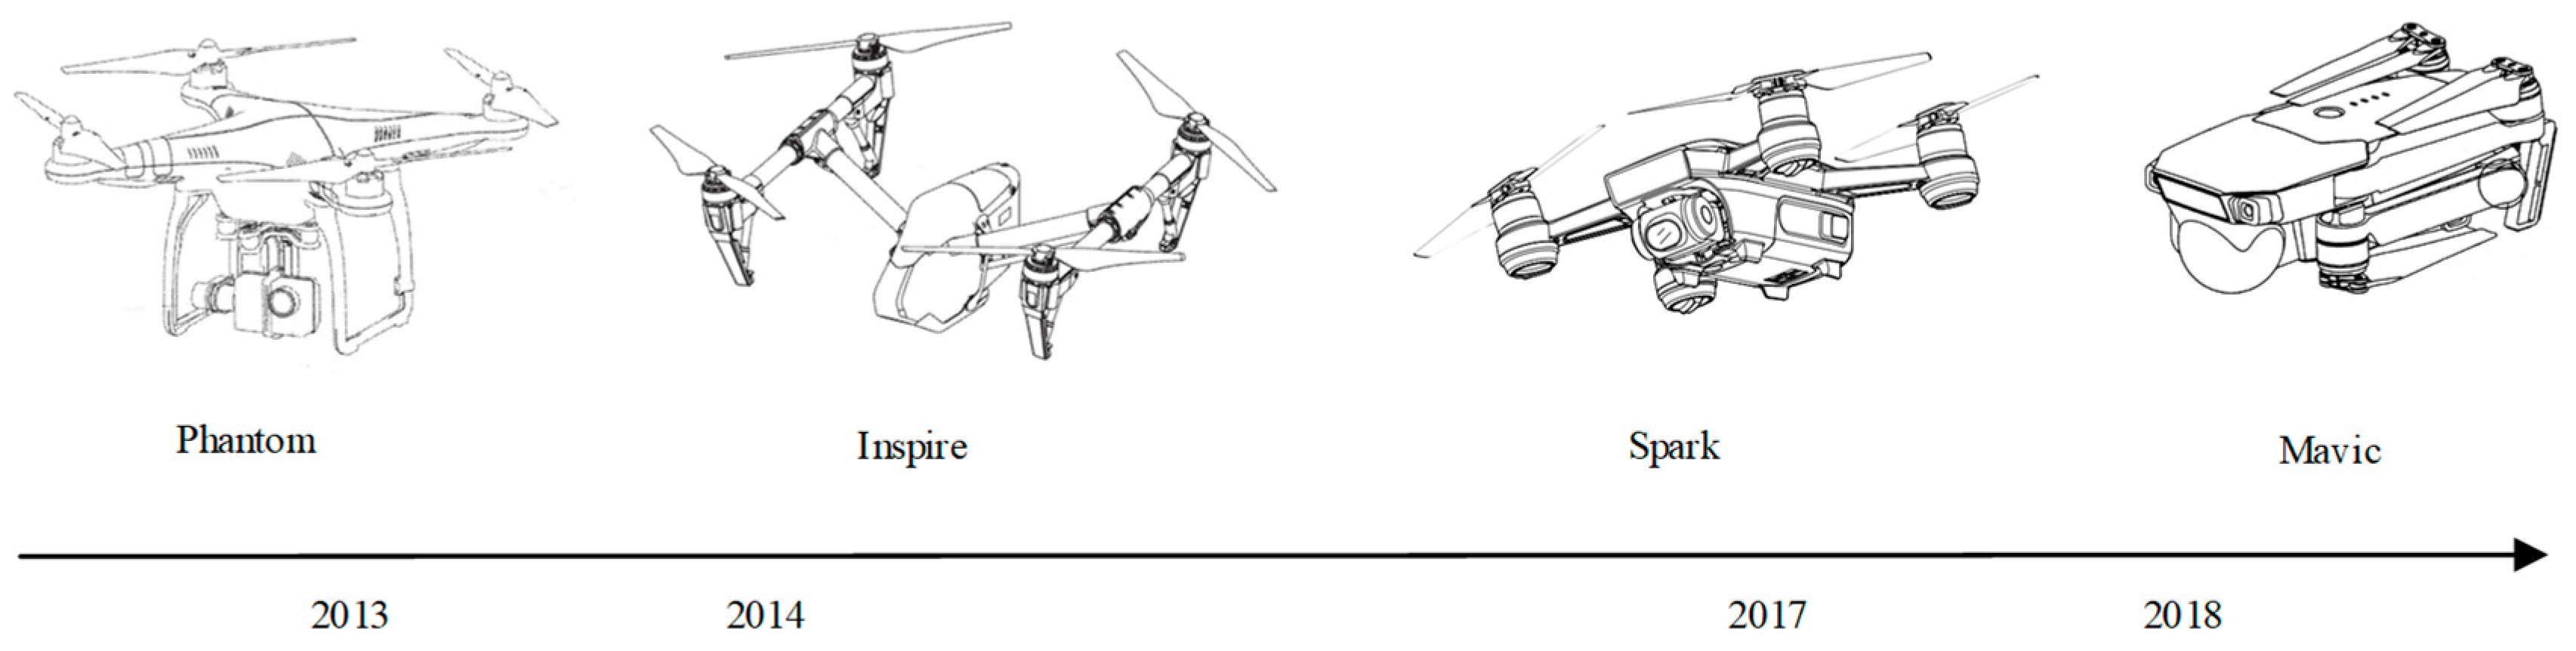
Figure 9 shows the evolution of DJI’s UAV series products. In terms of market performance, DJI’s global sales climbed about 160-fold from 2011 to 2016 [54]. In 2017, DJI was listed as one of 50 smartest companies by the MIT Technology Review. In addition, it was selected as the “2019 Forbes China Most Innovative company”. Considering its excellent technological competence and market performance, DJI has achieved radical inventions in UAVs [55]. Therefore, DJI’s patents were further selected as experimental data to demonstrate the proposed method more clearly.
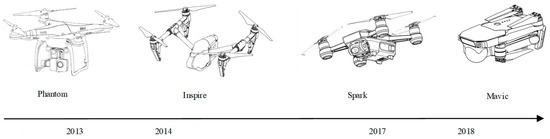
Figure 9.
DJI’s unmanned aerial vehicle series products.
4.1. Patent Retrieval and Data Collection
Patents belong to DJI were gathered from the SIPO using the search query “Inventor = (Shenzhen Dajiang Innovation) AND DESC = (“unmanned aerial vehicle” OR “UAV” OR “camera drone”) AND Invention_Type = (Invention) AND Application_Date ≤ (20220622)” (date: 23 June 2022), and 720 patents were collected.
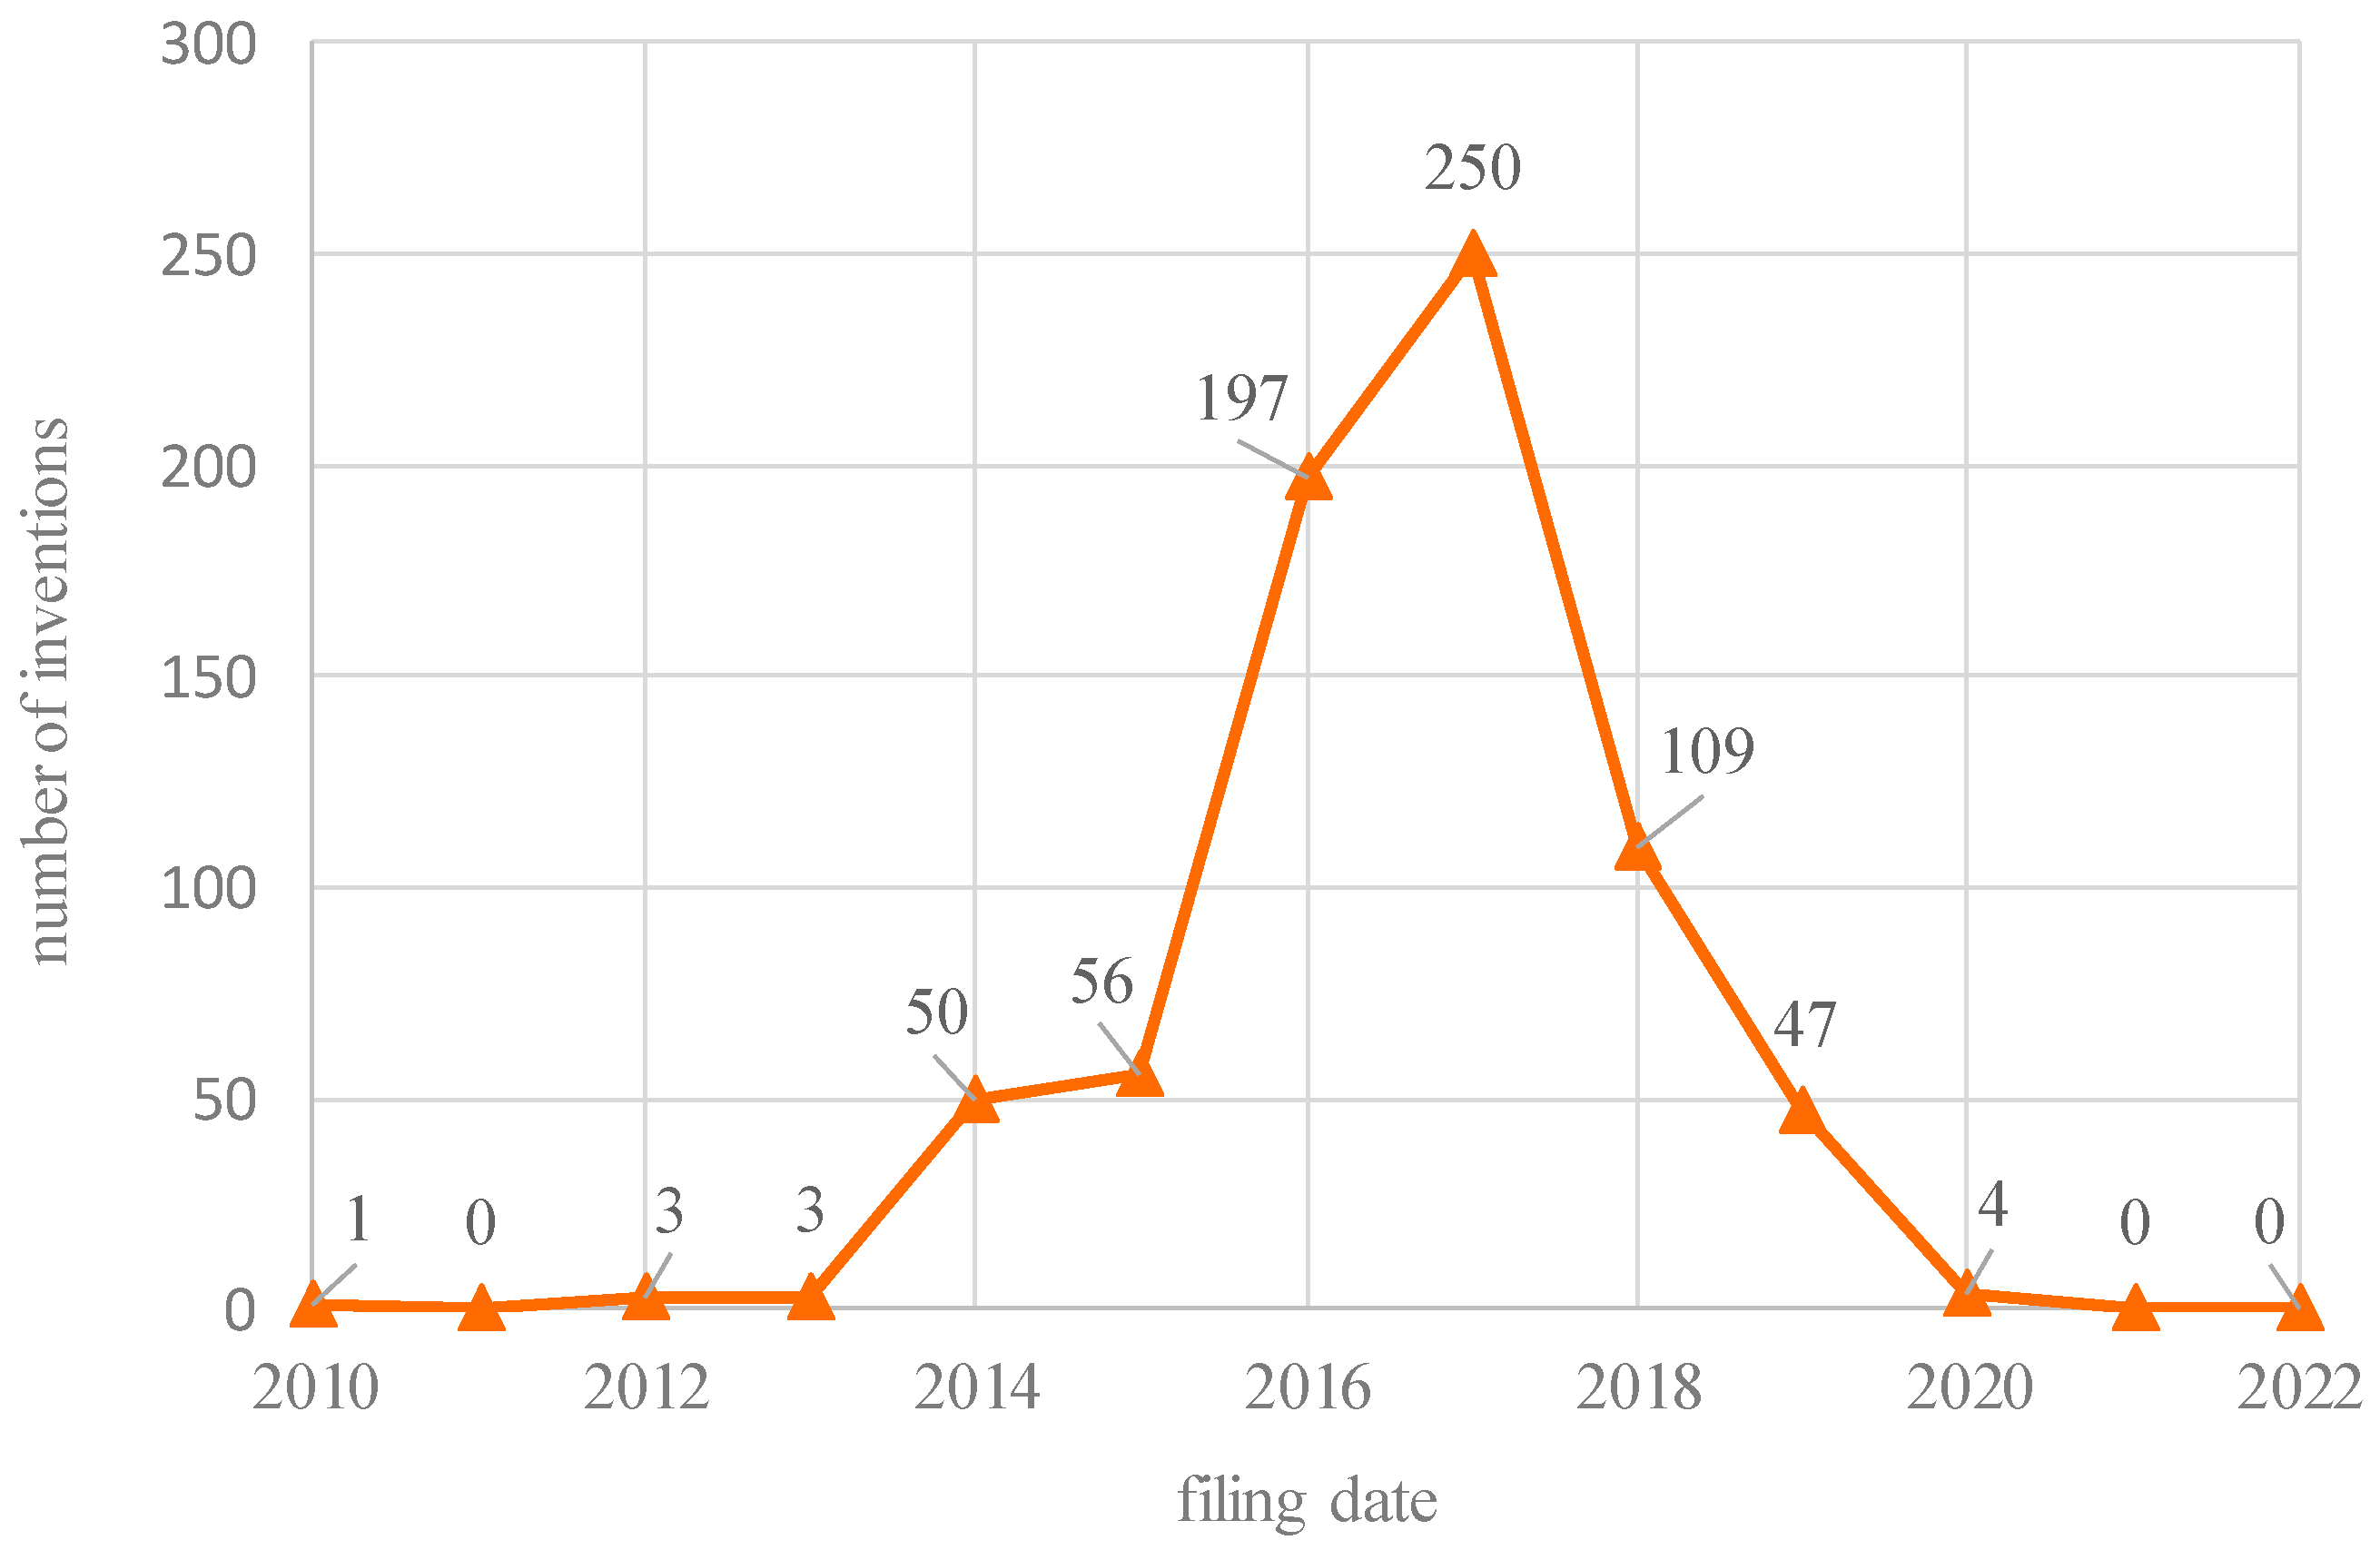
Figure 10 illustrates the number of inventions about UAV DJI applied for patents for from 2010 to 2022. As presented in the graph, the number of applications for UAV inventions from 2010 to 2013 was only 1, 0, 3, and 3, respectively. However, there was a substantial growth in the number of inventions DJI applied for; 50 in 2014, and 56 in 2015. The change in the number of inventions in 2013 and 2014 matches the fact that DJI first launched a drone named “Phantom” in early 2013 and “Inspire” in 2014, followed by the “Spark” series and “Mavic” series in the following years. It is clear from the data that the number of annual applications remained high for the next two years (197 inventions in 2016 and 250 inventions in 2017). In other words, DJI continued to maintain and even enhance its innovation capabilities. In addition, the number of filed patents in 2021 and 2022 shown in the figure are zero, which does not mean that DJI applied for no patents in these two years. It is more likely that the patents filed by DJI in 2021 and 2022 have not been granted yet, as it takes about 2 years for Chinese patents to be granted after the initial disclosure. Likewise, the downward trend in the number of patents shown in the graph from 2018 to 2020 does not reflect a recent lack of innovation at DJI, as there may have been patents filed during this period not yet granted.

Figure 10.
UAV inventions that DJI applied for patents for from 1 January 2010 to 22 June 2022.
Finally, 720 inventions for UAVs constitute a patent set. Their application dates, IPC symbols, and description sections were extracted.
4.2. Structured Data Analysis
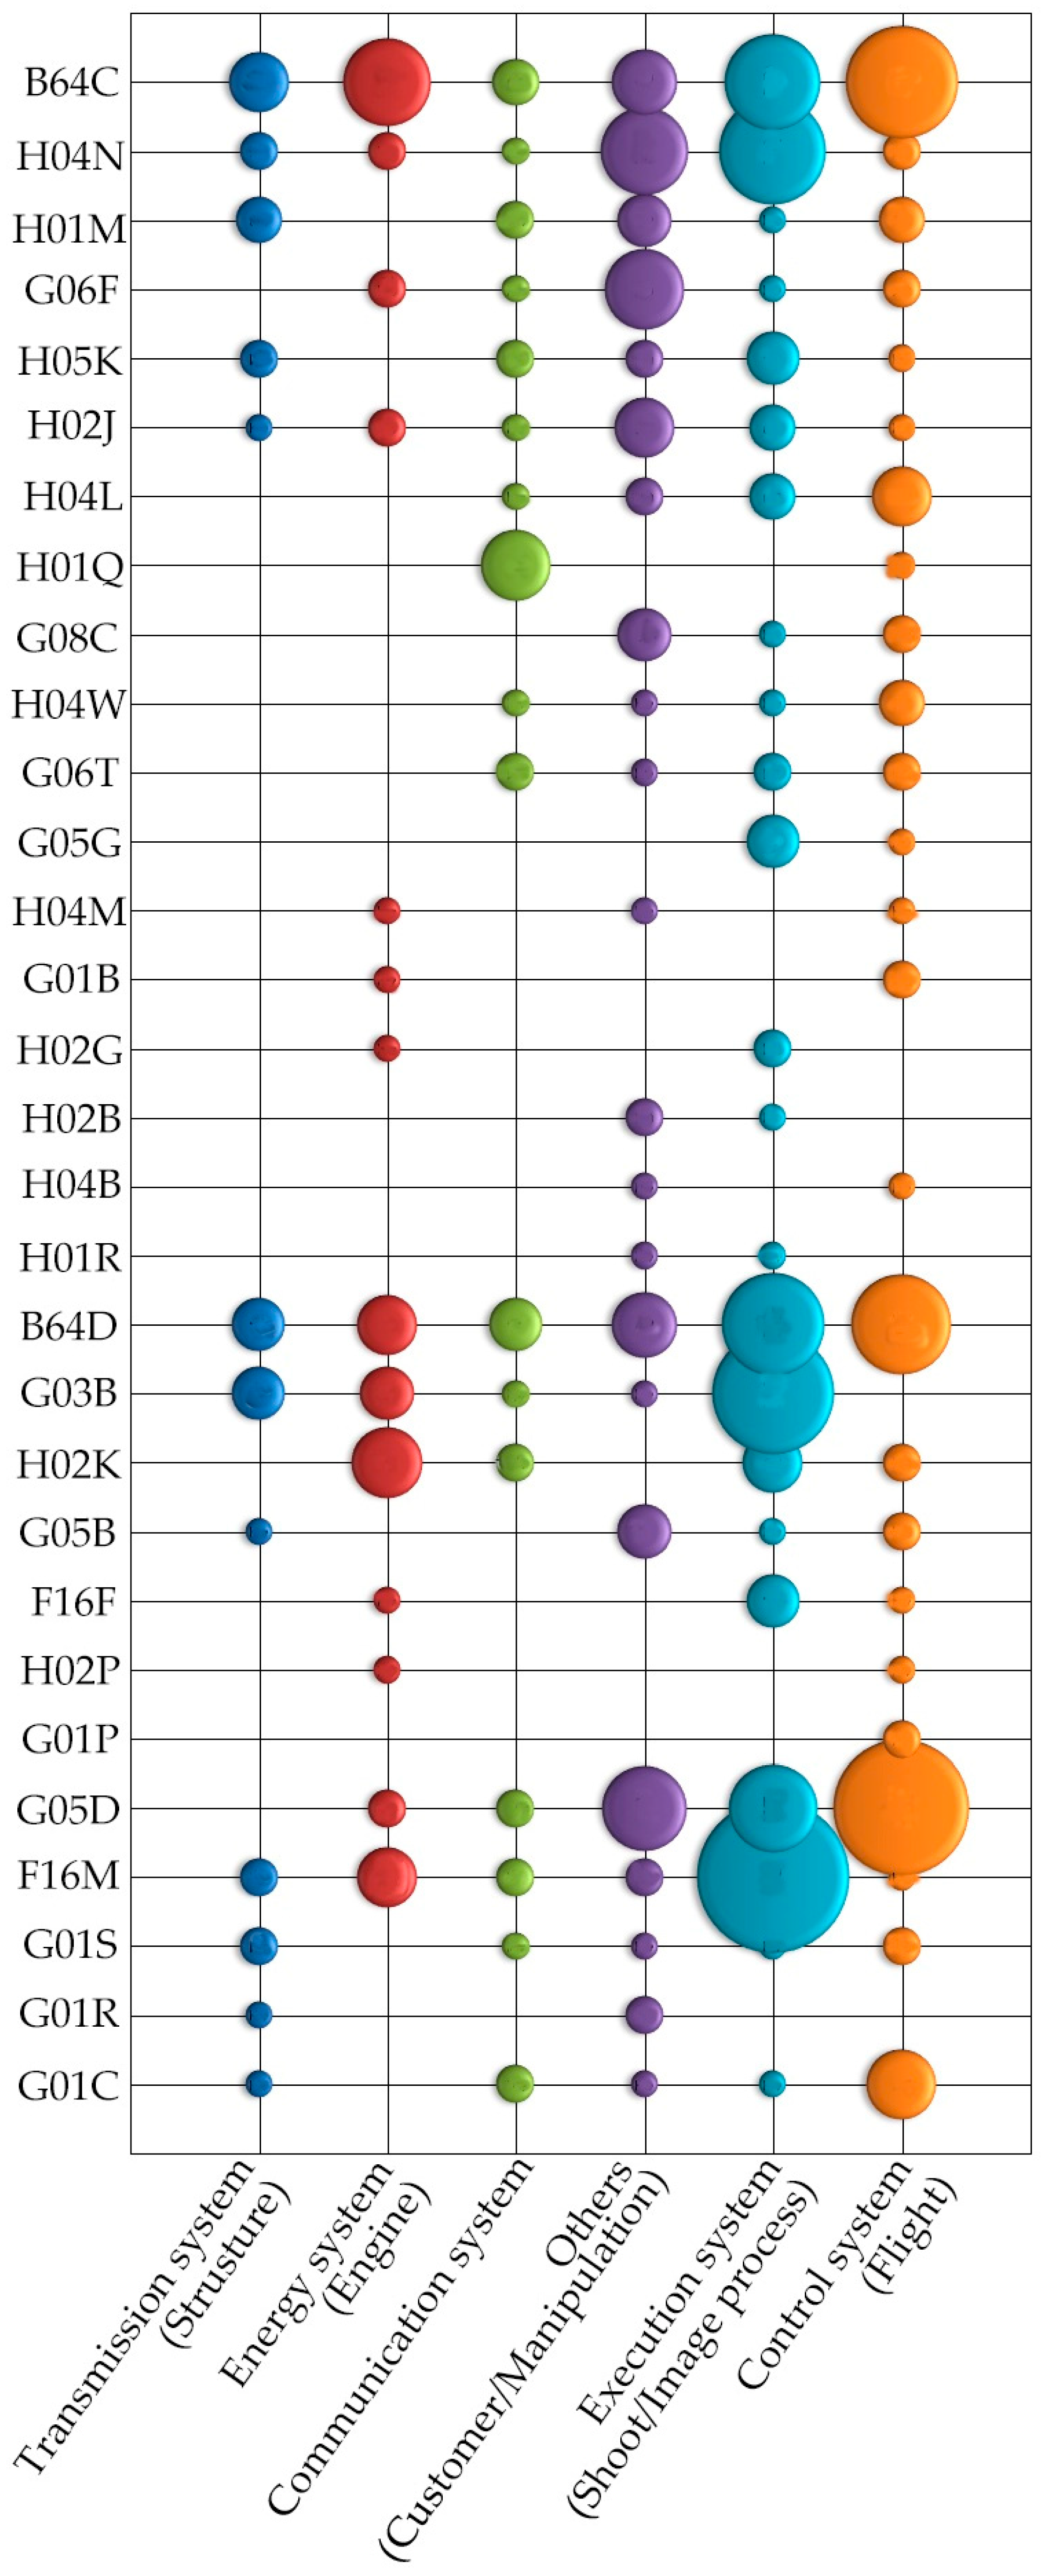
Figure 11 is a visualization of the IPC/data matrix constructed from the patent set selected in the previous step. The analysis excluded IPC symbols that were related to only one patent during these years and used contingency. For example, the description of A63H is toys, e.g., tops, dolls, hoops, or building blocks; B63H is marine propulsion or steering; G08G is traffic control system; and H04R is loudspeakers, which are far away from UAVs. The matrix shows that the range of technology concerned in the patents DJI applied for became more extensive from 2010 to 2020. Between 2010 and 2013, it mainly focused on three technologies, since DJI applied for few patents: (1) measuring distances, levels, or bearings (G01C); (2) aerolanes; helicopters (B64C); (3) radio direction-finding; radio navigation; determining distance or velocity by use of radio waves; locating or presence-detecting by use of the reflection or reradiation of radio waves; analogous arrangements using other waves (G01S). These are for the inertia measuring model (navigation system), the overall system, and remote control equipment of a UAV. In the next three years, DJI applied for many patents and also became involved in more technical domains, such as apparatus for taking photographs or viewing them (G03B), dynamo-electric machines (H01M and H02K), and wireless communication networks (H04N and H04W). These are shown in Figure 11 as patents with larger dots.
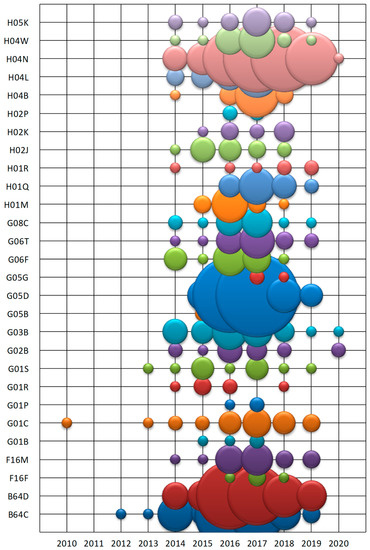
Figure 11.
Visualization of the IPC/date matrix based on patents DJI applied for from 2010 to 2020.
A technology change map was then built using the rules discussed in Section 3.2.3, to decide the value of technological novelty of each IPC symbol, according to Equation (1); the results are shown in Table 2.
Table 2.
IPCs and their value of technological novelty.
4.3. Unstructured Data Analysis
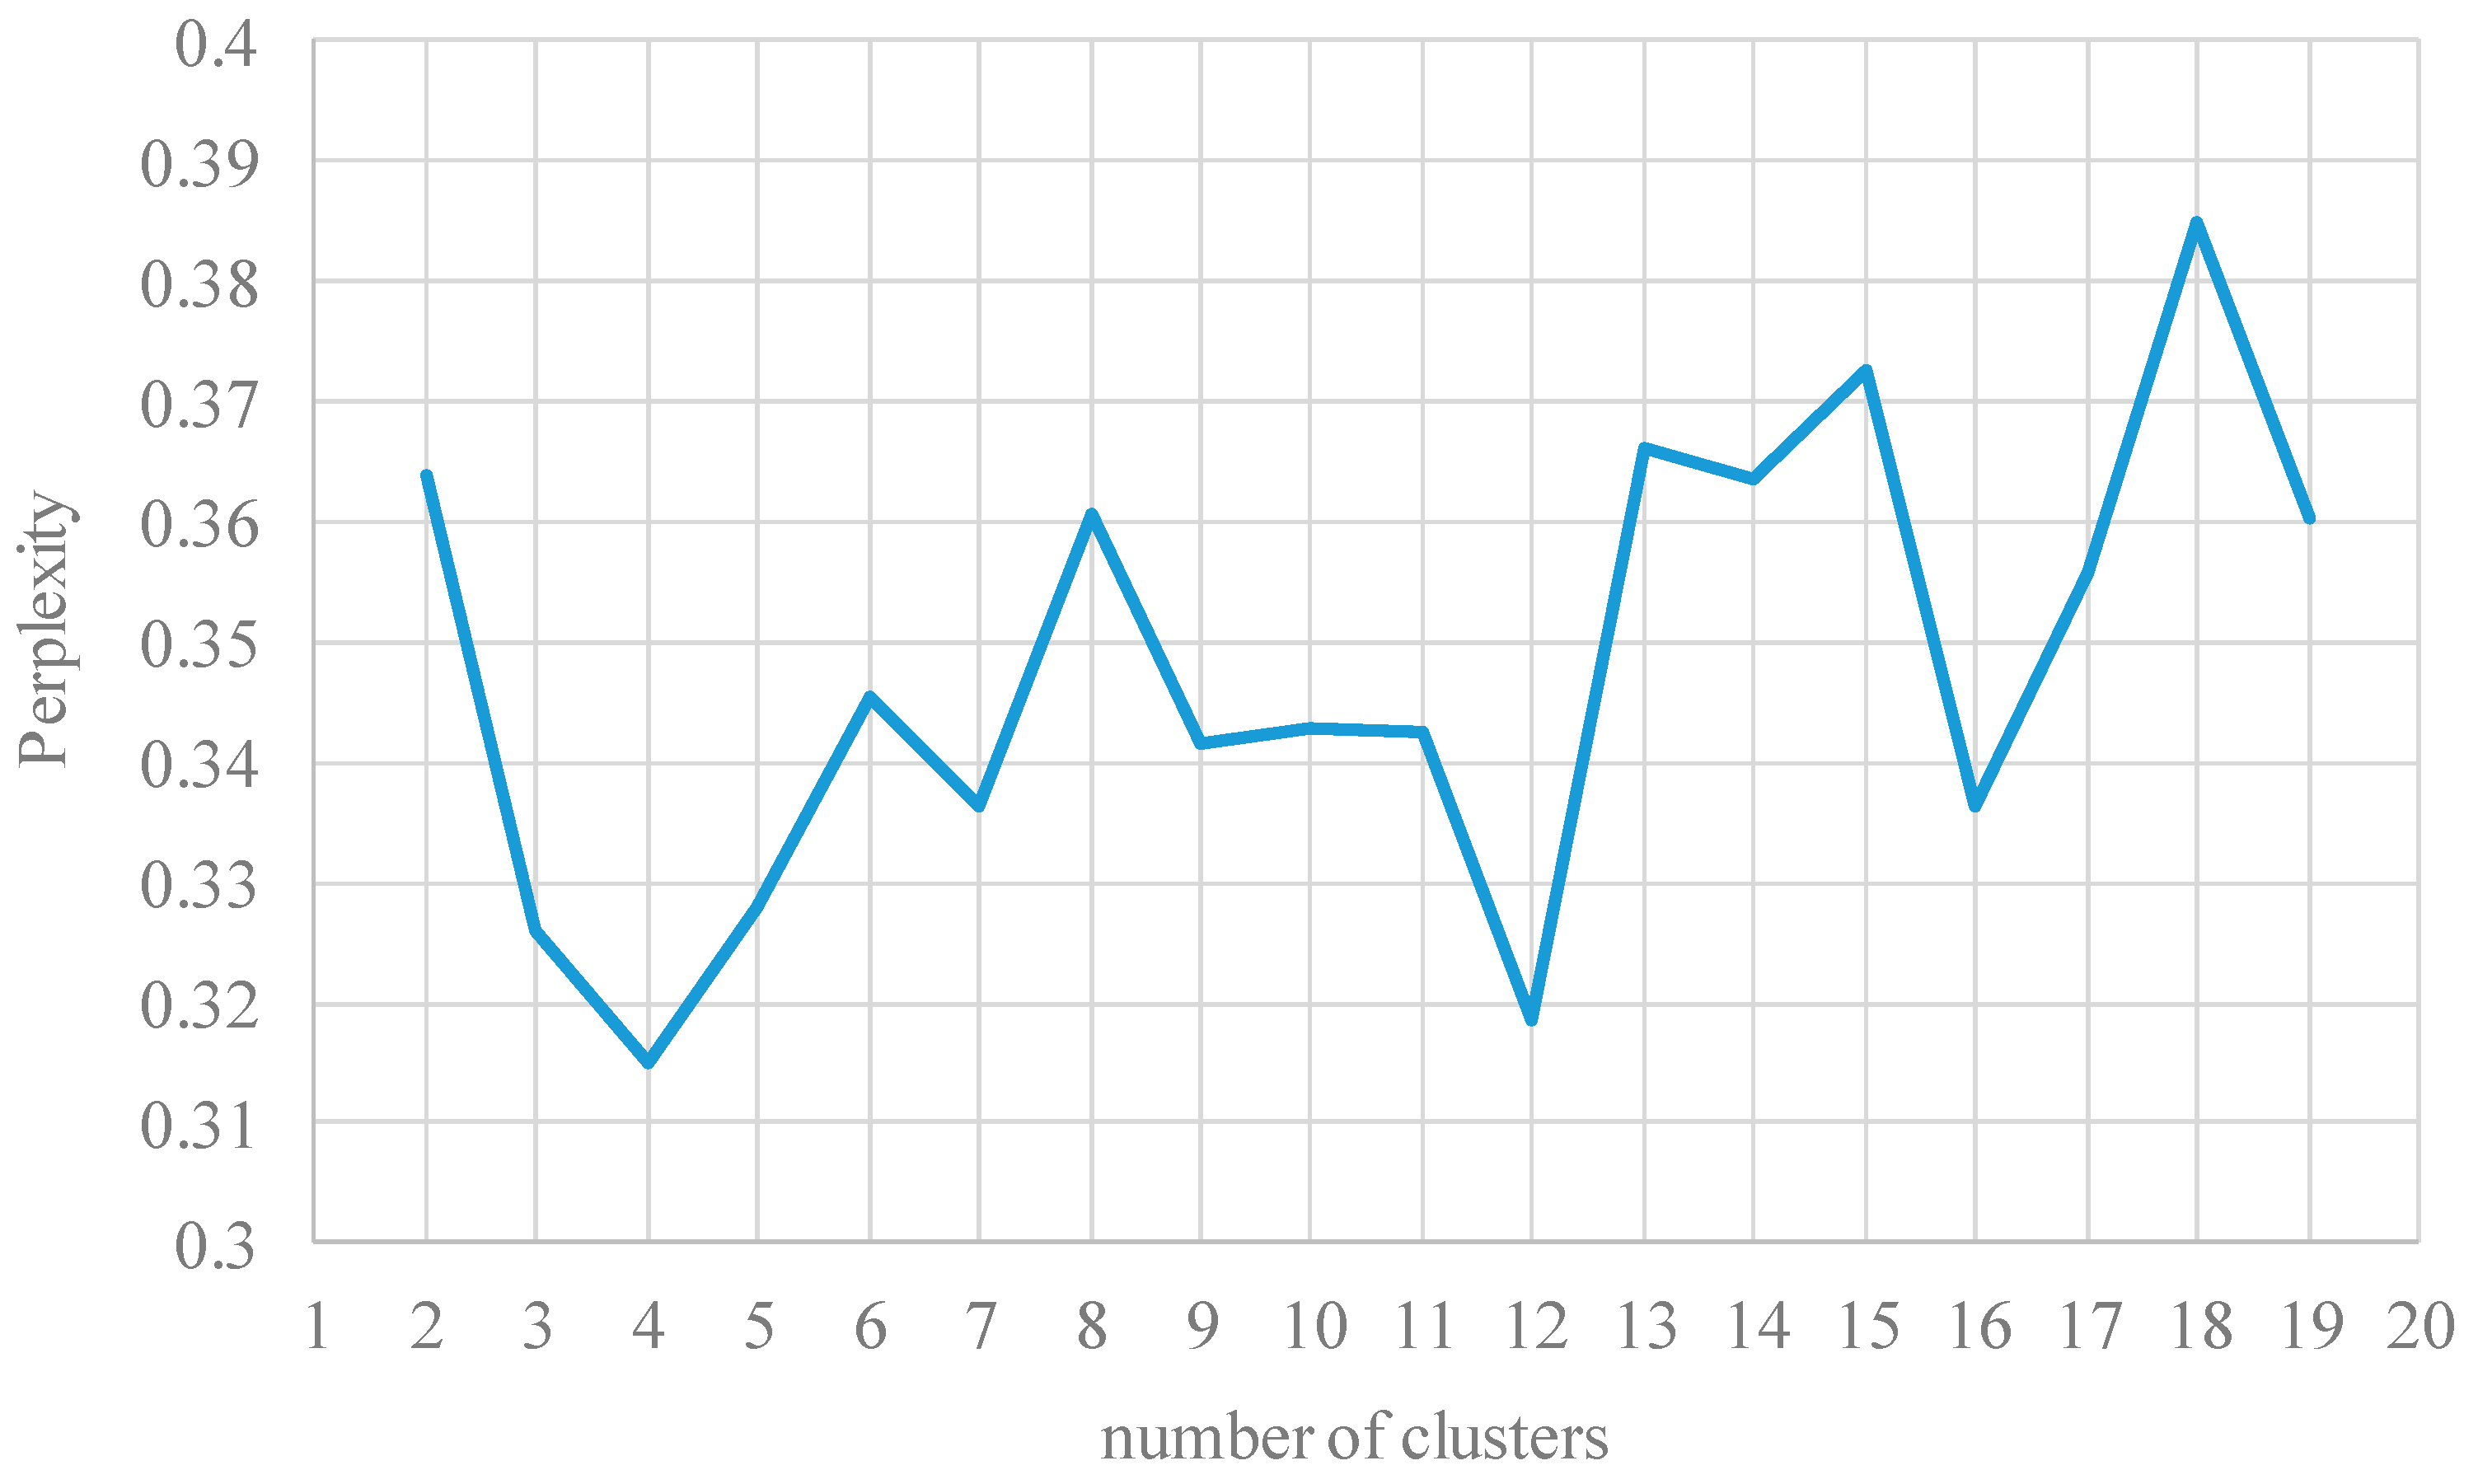
In this step, Spyder was used as an auxiliary tool. Spyder provides an interactive Python language development environment, and it has advanced editing, interactive testing, debugging, and introspection features [56]. Due to the standard structure of a Chinese patent, Regular Expression “re.findall(r’background(.+)contents’,text)” was used to extract each patent’s background section. Then, a maximum of 200 verbs or nouns were extracted from each background section using TextRank. Here, the frequency of keywords in TF-IDF was set from 10 to 90%. Next, a coherence model in Gensim was used to estimate the appropriate number of clusters. The perplexity for different clusters is shown in Figure 12. It shows that a smaller perplexity value indicates a more appropriate number of clusters. The cluster K value was thus set to 12.
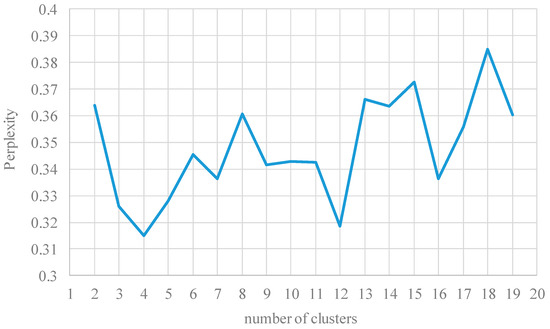
Figure 12.
The perplexity for each number of clusters.
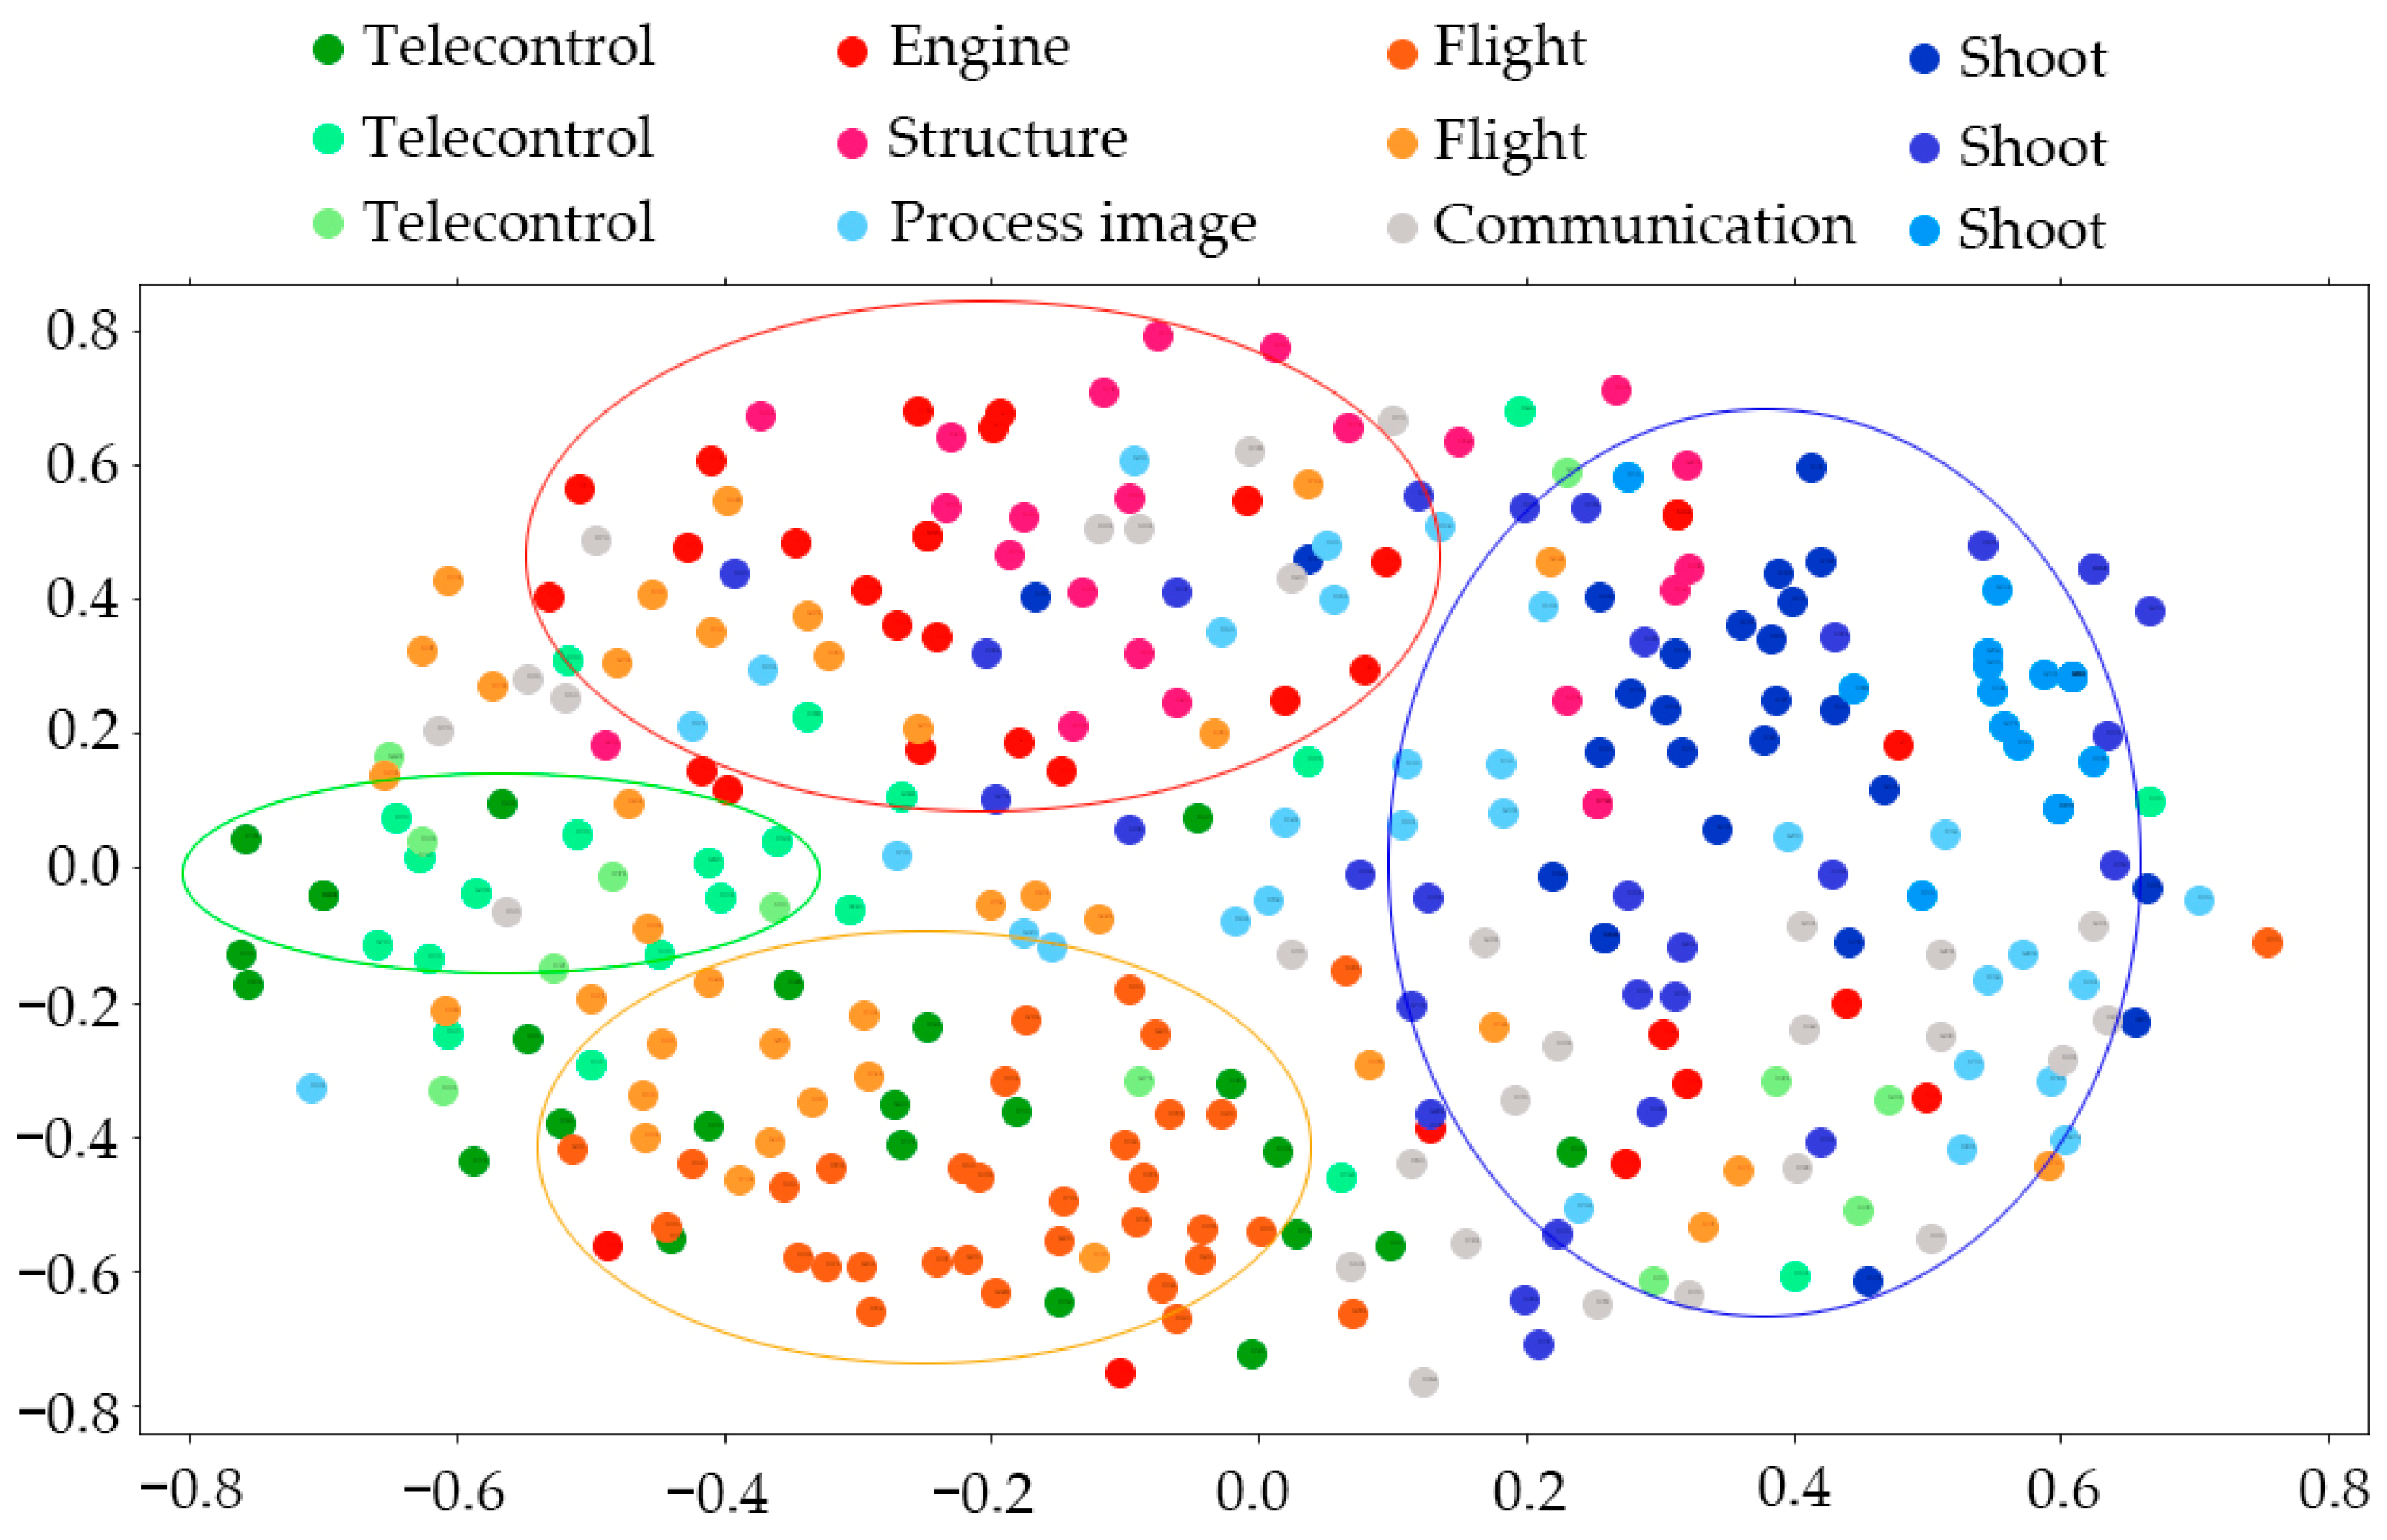
Table 3 lists the final 12 classifications with 10 keywords (the closest to each center). Figure 13 shows the clustering results. The rightmost blue dot area is composed of four classifications. According to the keywords, they can be summed up as a “shoot or process image”, corresponding to the execution system of a UAV under the law of system integrity. The orange dot area is composed of two categories, they can be summed up as “control or flight”, according to the keywords, corresponding to the control system of a UAV under the law of system integrity. The leftmost green area is composed of three categories, and they all relate to “telecontrol”, according to their keywords. The red dot area above contains two categories. According to their keywords, they can be summed up as “engine or structures”, corresponding to the energy system and transmission system of an UAV under the law of system integrity. The last category of gray dots can be summed up as “communication” based on the keywords. Together, the patent set was regrouped into six patent classifications. Based on these proprietary technical features, six R&D themes were summarized, as in the last column of Table 3. They are the problem areas of existing products.
Table 3.
Top 10 keywords of the 12 clusters, and the possibility distribution of six R&D themes.
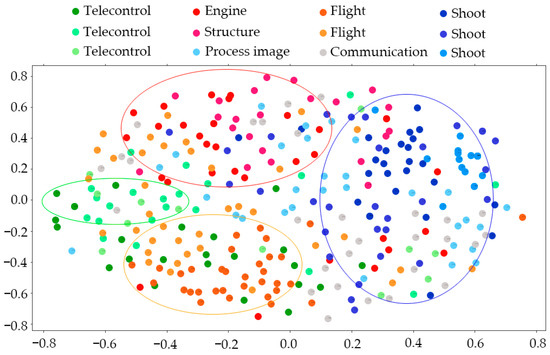
Figure 13.
Result of K-means clustering.
NetworkX [57] was used to draw an IPC network, as shown in Figure 14. NetworkX is a python package for the creation, manipulation, and study of the structure, dynamics, and functions of complex networks. The degree of centrality of each R&D theme node was calculated according to Equation (2), and the results are shown in Table 4. Note that the value of the degree of each R&D theme node was obtained using the NetworkX. By comparison, the most difficult R&D theme was the “control system relating to flight”, the second most difficult was the “execution system relating to shoot and process image”, then the “telecontrol and communication system”, and finally the “energy system and the transmission system”.
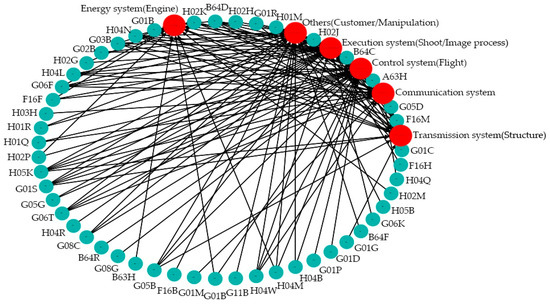
Figure 14.
IPC network.
Table 4.
Degree of centrality of the six R&D themes’ nodes in the IPC network.
4.4. IPC-Based Coordinate System and Opportunity Identification
An IPC-based coordination system of DJI’s patents was formed according to Section 3.2.4, and the results are shown in Figure 15. Patents in the region where the value of technological novelty is 8, which belongs to the top two most difficult domains, are technological opportunities with radial invention features, found at the upper right corner of Figure 15.
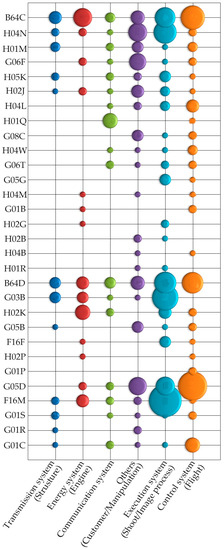
Figure 15.
IPC-based coordinate system.
Patents represented by the orange part in the upper right corner are patents with radical invention features, mainly in the “control system” of a UAV. Eight core patents are listed in Table 5. This illustrates that DJI’s flight technology for a UAV implemented radical inventions, from smooth flight controlled by a throttle, to flight position controlled by distance, and angle to hover controlled by error and its error contribution rate. In addition, future radical inventions for the control system could be generated in the empty spaces of the first line. After a feasibility analysis, G02B (optical elements) could be used for adding interactive virtual content and guidance (AR) to assist flight control. This claim was confirmed by patent CN108700741B, titled “Headsets and Video Glasses for UAV”, published on 21 August 2021.
Table 5.
Patents with radical invention features for the control system of UAVs.
Patents represented by the blue part at the upper right corner of the second line are patents with radical invention features and featured in the executive system of a UAV. Twelve core patents are listed in Table 6, showing that DJI’s shooting technology for UAV implemented radical inventions, from remote zooming to tracking focused to ultra-wide range shooting by controlling the rotation and angle of the lens in the horizontal and vertical direction; and image processing technology grew from adjusting the brightness of images to controlling the fill light using exposure parameters. In addition, future radical inventions in the executive system could be generated in the blank areas of the second line. After a feasibility analysis, H04B (electric communication technique, transmission) can be used for designing a synchronous shooting system, having multiple cameras for three-dimensional images.
Table 6.
Patents with radical invention features in the executive system of UAVs.
Finally, future technological opportunities of radical inventions are predicted for UAVs. As drones spread to different industries, the boundaries of “civilian” and “industrial” UAVs are unclear. A growing number of applications use mission-driven UAVs with powerful computing capabilities. Therefore, G06Q (data processing system or methods, specially adapted for supervisory of forecasting purposes) can be applied to implement the flight function in the control system. This technology has not been used in UAVs before. The first attempts at the control system of UAVs use different technology to implement difficult functional elements. After the feasibility analysis, a flight control intelligent data analysis and decision support system could be achieved to confirm the safety of the flight control, monitor the real-time flight data, and forecast future operational states. In addition, the future sales of UAVs depend on the demand for video creation in the film and television industry and entertainment market. G11B (recording, storing, or playback of information) can be applied to implement image processing functions in the execution system. The functions of aided shooting and aided editing, as well as planning video content in advance can be attached to UAVs. These functions will enable both professionals and amateurs to efficiently create professional videos using UAVs.
5. Discussion
A framework for identifying technological opportunities for radical inventions (RIs) is established in a novel way. Previous studies did not demonstrate a clear understanding of the conditions under which radical inventions (RIs) form, usually identifying a large number of general technological opportunities before screening them out. This kind of post-screening is costly, with limited guidance for improving the effectiveness of the identification process. The method proposed in this study considers the characteristics of RIs at an early stage, and uses the value of difficulty (VOD) of the problems solved and the value of technological novelty (VON) of new technology applied to directly identify technological opportunities for RIs, without extra costs in processing noisy data. This is helpful for managers and designers to quickly and accurately identify technological opportunities for RIs.
Patent maps were developed for evaluating the technological novelty of patents. Previous studies have tended to utilize technical details in patent texts. However, after extracting a large number of micro-technical details from the patent text, it is still necessary to summarize this information into macro-technical points, to represent the patent technology, which is not only time-consuming but also misleading. In comparison, using patent filing dates and international patent classification codes (IC), we built a novel patent map to determine the VON of patent technology. This method allows innovation managers to quickly locate novel patents based on the high VON of IC, to determine the novelty of patents classified under the IC. At the same time, this method can help industrial firms to improve the utilization of structured patent data.
The use of natural language processing, K-means clustering, and complex network analysis in unstructured patent data has been applied to various tasks. Natural language processing pre-processes unstructured patent data into structured data, and combines the analysis results of K-means clustering and complex network analysis to obtain the desired information intelligently. In this study, we used the intelligent computation of VOD for each patent. With the spread of artificial intelligence, theoretical research and the practical application of intelligent technological opportunity analysis using patent data mining are continuously being developed. This will reduce the difficulty of technology development and encourage more firms into radical innovation.
6. Conclusions
A plethora of studies have suggested methods for discovering technological opportunities based on patents. The motivation of this study was similar, but the scope of our research extended to the identification of technological opportunities for radical inventions, providing specific guidelines for creating new technological ideas for radical inventions. Generally, previous studies applied innovation management strategies to investigate technological opportunities for radical inventions. However, this paper proposed an IPC-based, natural language processing, K-means cluster analysis and complex network analysis-aided approach, to effectively identify technological opportunities of radical inventions.
This research employed a coordination system based on the values of the technological novelty (VON) of each technology manifested in a patent set and the values of difficulty (VOD) of each R&D theme developed by a patent set, to distinguish potential technological opportunities for radical inventions. As a result, technological opportunities with both a higher VON of technology manifested in patents, and a higher VOD of technical problems solved by patents, seem more likely to result in radical inventions. Moreover, the expert knowledge in the IPC system was further investigated, as well as keywords being extracted from patent documents. Methods of determining VON and VOD were proposed based on the bifurcation and hierarchical features of the IPC system, distribution characteristics of the IPC symbols, and keywords in a patent set.
There are also several limitations of the proposed approach. Although the features of the IPC system can reflect the difference between technologies, the results are still approximate for analyzing sophisticated cutting-edge technology. In future studies, semantic analysis will be applied to investigate the titles of IPC symbols, for further measurement of technological distance. In addition, natural language processing was used to extract meaningful keywords from the background section of patents, but the results contained some noisy data. In future, methods to facilitate the extraction of features and reduce noise will be introduced, by adding updated natural language processing technology and using deep learning algorithms, such as subject–action–object analysis, dependency parsing, and structure topic models. To achieve better analysis results, we will also add multi-criteria to input variables and run a post-analysis on the results, such as a MANOVA test. Last but not the least, here we focused on one Chinese firm’s UAV patenting, and in future studies we will evaluate this approach on multiple datasets, to check its generalizability, such as with other UAV firms’ patents, semiconductors, and drug patents, etc.
Author Contributions
Conceptualization, W.Y. and G.C.; methodology, W.Y. and J.Z.; writing—original draft preparation, W.Y.; writing—review and editing, Q.P. and C.H.; visualization, W.Y.; supervision, G.C.; funding acquisition, G.C. All authors have read and agreed to the published version of the manuscript.
Funding
This research was funded by the National Science Foundation of China, grant number 51805142, the National Innovation Method Work Special Project of China, grant number 2019IM020200, the Hebei Province Innovative Ability Uplifting Project of China, grant number 21567657H.
Institutional Review Board Statement
Not applicable.
Informed Consent Statement
Not applicable.
Data Availability Statement
The data that support the findings of this study are available in [Patsnap] at [https://analytics.zhihuiya.com] (accessed on 12 June 2022).
Conflicts of Interest
The authors declare that there are no conflict of interest regarding the publication of this paper.
References
- Zhang, J.; Tan, R. Radical concept generation inspired by cross–domain knowledge. Appl. Sci. 2022, 12, 4929. [Google Scholar] [CrossRef]
- Escrig-Tena, A.B.; Segarra-Cipres, M.; Beatriz-Juan, B. Incremental and radical product innovation capabilities in a quality management context: Exploring the moderating effects of control mechanisms. Int. J. Prod. Econ. 2021, 232, 107994. [Google Scholar] [CrossRef]
- Coccia, M. Sources of technological innovation: Radical and incremental innovation problem–driven to support competitive advantage of firms. Technol. Anal. Strateg. Manag. 2017, 29, 1048–1061. [Google Scholar] [CrossRef]
- Sood, A.; Tellis, G.R. Technological evolution and radical innovation. J. Mark. 2005, 69, 152–168. [Google Scholar] [CrossRef]
- Schoenmakers, W.; Duysters, G. The technological origins of radical inventions. Res. Policy 2010, 39, 1051–1059. [Google Scholar] [CrossRef] [Green Version]
- Maine, E.; Thomas, V.J.; Utterback, J. Radical innovation from the confluence of technology: Innovation management strategies for the emerging nanobiotechnology industry. J. Eng. Technol. Manag. 2014, 32, 1–25. [Google Scholar] [CrossRef] [Green Version]
- O’Connor, G.C.; Rice, M.P. New market creation for breakthrough innovations: Enabling and constraining mechanisms. J. Prod. Innov. Manag. 2012, 30, 209–227. [Google Scholar] [CrossRef]
- Herrmann, T.; Roth, D.; Binz, H. Approach for identifying and initially assessing radical product ideas. In Proceedings of the 2018 IEEE International Conference on Engineering, Technology and Innovation (ICE/ITMC), Stuttgart, Germany, 17–20 June 2018. [Google Scholar]
- Yang, X.; Liu, X.; Song, J. A study on technology competition of graphene biomedical technology based on patent analysis. Appl. Sci. 2019, 9, 2613. [Google Scholar] [CrossRef] [Green Version]
- Lee, M.T.; Su, W.N. Search for the developing trend by patent analysis: A case study of lithium–lon battery electrolytes. Appl. Sci. 2020, 10, 952. [Google Scholar] [CrossRef] [Green Version]
- Park, S.; Jun, S. Patent analysis using Bayesian data analysis and network modeling. Appl. Sci. 2022, 12, 1423. [Google Scholar] [CrossRef]
- Tseng, C.Y. Technology development and knowledge spillover in Africa: Evidence using patent and citation data. Int. J. Technol. Manag. 2009, 45, 50–61. [Google Scholar] [CrossRef]
- Yoon, J.; Kim, K. Identifying rapidly evolving technological trends for R&D planning using SAO–based semantic patent networks. Scientometrics 2011, 88, 213–228. [Google Scholar]
- Kim, B.; Gazzola, G.; Lee, J.M.; Kim, D.; Kim, K.; Jeong, M.K. Inter–cluster connectivity analysis for technology opportunity discovery. Scientometrics 2014, 98, 1811–1825. [Google Scholar] [CrossRef]
- Wang, X.F.; Ma, P.P.; Huang, Y.; Guo, J.F.; Zhu, D.H.; Porter, A.L.; Wang, Z.N. Combining SAO semantic analysis and morphology analysis to identify technology opportunities. Scientometrics 2017, 111, 3–24. [Google Scholar] [CrossRef]
- Lee, S.; Kim, M.S.; Park, Y.; Kim, C. Identification of a technological chance in product–service system using KeyGraph and text mining on business method patents. Int. J. Technol. Manag. 2016, 70, 239–256. [Google Scholar] [CrossRef]
- Li, X.; Zhou, Y.; Xue, L.; Huang, L.C. Roadmapping for industrial emergence and innovation gaps to catch–up: A patent–based analysis of OLED industry in China. Int. J. Technol. Manag. 2016, 72, 105–143. [Google Scholar] [CrossRef]
- Feng, L.; Niu, Y.; Wang, J. Development of morphology analysis–based technology roadmap considering layer expansion paths: Application of TRIZ and text mining. Appl. Sci. 2020, 10, 8498. [Google Scholar] [CrossRef]
- Yang, C.; Zhu, D.H.; Wang, X.F.; Zhang, Y.; Zhang, G.Q.; Lu, J. Requirement–oriented core technological components’ identification based on SAO analysis. Scientometrics 2017, 112, 1229–1248. [Google Scholar] [CrossRef]
- Kim, K.; Park, K.; Lee, S. Investigating technology opportunities: The use of SAOx analysis. Scientometrics 2018, 118, 45–70. [Google Scholar] [CrossRef]
- Liu, L.F.; Li, Y.; Xiong, Y.; Cavallucci, D. A new function–based patent knowledge retrieval tool for conceptual design of innovative products. Comput. Ind. 2020, 115, 103154. [Google Scholar] [CrossRef]
- Liu, H.; Li, W.; Li, Y. A new computational method for acquiring effect knowledge to support product innovation. Knowl. Based Syst. 2021, 231, 107410. [Google Scholar] [CrossRef]
- Yan, B.W.; Luo, J.X. Measuring technological distance for patent mapping. J. Assoc. Inf. Sci. Technol. 2016, 68, 423–437. [Google Scholar] [CrossRef] [Green Version]
- McDermott, C.M.; O’Connor, G.C. Managing radical innovation: An overview of emergent strategy issues. J. Prod. Innov. Manag. 2002, 19, 424–438. [Google Scholar] [CrossRef]
- Penker, M.; Khoh, S.B. Cultivating growth and radical innovation success in the fourth industrial revolution with big data analytics. In Proceedings of the 2018 IEEE International Conference on Industrial Engineering and Engineering Management (IEEM), Bangkok, Thailand, 16–19 December 2018. [Google Scholar]
- Asthana, P. Jumping the technology s–curve. IEEE Spectr. 1995, 32, 49–54. [Google Scholar] [CrossRef]
- Dahlin, K.B.; Behrens, D.M. When is an invention really radical? Defining and measuring technological radicalness. Res. Policy 2005, 34, 717–737. [Google Scholar] [CrossRef]
- Liu, W.; Tan, R.H.; Cao, G.Z.; Zhang, Z.Y.; Huang, S.Y.; Liu, L.M. A proposed radicality evaluation method for design ideas at conceptual design stage. Comput. Ind. Eng. 2019, 132, 141–152. [Google Scholar] [CrossRef]
- Lecossier, A.; Pallot, M. UX–FFE model: An experimentation of a new innovation process dedicated to a mature industrial company. In Proceedings of the 2017 International Conference on Engineering, Technology and Innovation (ICE/ITMC), Madeira, Portugal, 27–29 June 2017. [Google Scholar]
- Story, V.M.; Daniels, K.; Zolkiewski, J.; Dainty, A.R.J. The barriers and consequences of radical innovations: Introduction to the issue. Ind. Mark. Manag. 2014, 43, 1271–1277. [Google Scholar] [CrossRef] [Green Version]
- De Bont, C.; Liu, S.X. Breakthrough innovation through design education: Perspectives of design–led innovators. Des. Issues 2017, 33, 18–30. [Google Scholar] [CrossRef]
- Saliminamin, S.; Becattini, N.; Cascini, G. Sources of creativity stimulation for designing the next generation of technical systems: Correlations with R&D designers’ performance. Res. Eng. Des. 2019, 30, 133–153. [Google Scholar]
- Vergragt, P.J.; Brown, H.S. Sustainable mobility: From technological innovation to societal learning. J. Clean. Prod. 2007, 15, 1104–1115. [Google Scholar] [CrossRef]
- Schwartz, P. Technological innovation opportunities. Comput. People 1974, 23, 33. [Google Scholar]
- Porter, A.L.; Detampel, M.J. Technology opportunities analysis. Technol. Forecast. Soc. Chang. 1995, 49, 237–255. [Google Scholar] [CrossRef]
- Kim, Y.G.; Suh, J.H.; Park, S.C. Visualization of patent analysis for emerging technology. Expert Syst. Appl. 2008, 34, 1804–1812. [Google Scholar] [CrossRef]
- Geum, Y.; Kim, M. How to identify promising chances for technological innovation: Keygraph–based patent analysis. Adv. Eng. Inform. 2019, 46, 101155. [Google Scholar] [CrossRef]
- Park, H.; Kim, K.; Choi, S.; Yoon, J. A patent intelligence system for strategic technology planning. Expert Syst. Appl. 2013, 40, 2373–2390. [Google Scholar] [CrossRef]
- Lee, Y.; Kim, S.Y.; Song, I.; Park, Y.; Shin, J. Technology opportunity identification customized to the technological capability of SMEs through two–stage patent analysis. Scientometrics 2014, 100, 227–244. [Google Scholar] [CrossRef]
- Song, K.; Kim, K.S.; Lee, S. Discovering new technology opportunities based on patents: Text–mining and F–term analysis. Technovation 2017, 60–61, 1–14. [Google Scholar] [CrossRef]
- Altuntas, S.; Dereli, T.; Kusiak, A. Forecasting technology success based on patent data. Technol. Forecast. Soc. Chang. 2015, 20, 202–214. [Google Scholar] [CrossRef]
- Problem Solving Methodology for Innovation: TRIZ/USIT, Its Philosophy, Methods, Knowledge Bases, and Software Tools. Available online: https://the-trizjournal.com/problem-solving-methodology-innovation-trizusit-philosophy-methods-knowledge-bases-software-tools/ (accessed on 25 March 2021).
- Overall Dataflow Structure Creative Problem Solving TRIZ/USIT. Available online: https://the-trizjournal.com/overall-dataflow-structure-creative-problem-solving-trizusit/ (accessed on 25 March 2021).
- Tool, Object, Product (TOP) Function Analysis. Available online: https://the-trizjournal.com/tool-object-product-top-function-analysis/ (accessed on 25 March 2021).
- Using the Ideal Final Result to Define the Problem to Be Solve. Available online: https://the-trizjournal.com/using-ideal-final-result-define-problem-solved/ (accessed on 25 March 2021).
- Shao, P.; Tan, R.; Peng, Q.; Zhang, L.; Wang, K.; Dong, Y. Problem–solving in product innovation based on the Cynefin framework–Aided TRIZ. Appl. Sci. 2022, 12, 4157. [Google Scholar] [CrossRef]
- Christensen, C.M. The ongoing process of building a theory of disruption. J. Prod. Innov. Manag. 2006, 23, 39–55. [Google Scholar] [CrossRef]
- Rafii, F.; Kampas, P.J. How to identify your enemies before they destroy you. Harv. Bus. Rev. 2002, 80, 115–134. [Google Scholar]
- Guo, J.; Tan, R.H.; Sun, J.G.; Cao, G.Z.; Zhang, L. An approach for generating design Scheme of new market disruptive products driven by function differentiation. Comput. Ind. Eng. 2016, 102, 302–315. [Google Scholar] [CrossRef]
- O’Connor, G.C.; Rice, M.P. A comprehensive model of uncertainty associated with radical innovation. J. Prod. Innov. Manag. 2013, 30, 2–18. [Google Scholar] [CrossRef]
- Radical Innovation and Design Research. Available online: https://the-trizjournal.com/radical-innovation-design-research/ (accessed on 25 March 2021).
- Liu, W.; Tan, R.H.; Cao, G.Z.; Yu, F.; Li, H. Creative design through knowledge clustering and case–based reasoning. Eng. Comput. 2020, 36, 527–541. [Google Scholar] [CrossRef]
- Salton, G.; Yang, C.S.; Yu, C.T. A theory of term importance in automatic text analysis. J. Am. Soc. Inf. Sci. 1975, 26, 33–44. [Google Scholar] [CrossRef] [Green Version]
- Dialogue DJI’s CEO Luo Zhenhua: How Did DJI Open up Overseas Markets. Available online: https://www.thepaper.cn/newsDetail_forward_2795499 (accessed on 25 March 2021).
- Sze, H.C.; Chun, Y.S.; Yau, K.Y.; Zhang, Y.F. Da Jiang Innovation, DJI: The future of possible. Acad. Asian Bus. Rev. 2017, 3, 83–109. [Google Scholar]
- Spyder. Available online: https://www.spyder–ide.org (accessed on 25 March 2021).
- NetworkX. Available online: https://networkx.org/documentation/stable/install.html (accessed on 25 March 2021).


Publisher’s Note: MDPI stays neutral with regard to jurisdictional claims in published maps and institutional affiliations. |
© 2022 by the authors. Licensee MDPI, Basel, Switzerland. This article is an open access article distributed under the terms and conditions of the Creative Commons Attribution (CC BY) license (https://creativecommons.org/licenses/by/4.0/).