Article

Experimental and Numerical Study on the Performance of Double Membrane Wing for Long-Endurance Low-Speed Aircraft

School of Aeronautical Science and Engineering, Beihang University, Beijing 100191, China
*
Author to whom correspondence should be addressed.
Appl. Sci. 2022, 12(13), 6765; https://doi.org/10.3390/app12136765
Submission received: 6 June 2022 / Revised: 1 July 2022 / Accepted: 1 July 2022 / Published: 4 July 2022
(This article belongs to the Section Aerospace Science and Engineering)

Abstract

:

Featured Application

This study is meaningful for the design and analysis of the flexible skin wings for long-endurance low-speed aircraft.

Abstract

Flexible membrane structure is generally used as wing skin for long-endurance low-speed aircraft, such as solar aircraft, to control the structure weight within the allowable range. Predictably, the elastic deformation of the membrane under complex loads will cause uncertain impacts on the aerodynamic performance. The existing research indicates that the deformation of the membrane wing is helpful to improve the aerodynamic characteristics. However, most of the research objects are non-thickness membrane wings. In this paper, wind tunnel experiments are performed on double membrane wings. The experiment results indicate that the membrane deformation behavior is related to the surface curvature distribution and will change the camber and thickness of the airfoil. The deformation has little effect on lift but has a significant effect on drag and pitching moment. On this basis, a high-precision fluid structure coupling analysis method for the wider range of research is introduced. The numerical analysis indicates that the deformation can delay the stall angle by 1°. Furthermore, based on the numerical results, suggestions on prestress setting during membrane skin laying are provided, and the numerical simulation results of two flexible skin wings are compared. The research results of this paper provide a scientific basis for the aerodynamic design and analysis of long-endurance low-speed aircraft.

1. Introduction

Long-endurance low-speed aircraft, represented by solar aircraft, has the advantage of high cruise efficiency and is widely used in low-speed reconnaissance [1,2,3]. For such aircraft, the traditional rigid skin cannot meet the requirements of rigidity and weight at the same time, so the skin material is usually flexible membrane [4,5,6]. In the design and flight experiment of a solar unmanned aerial vehicle (UAV), the project team discovered that the deviation between aerodynamic data and numerical results is larger than that of conventional UAV, and the uncertain effect of membrane deformation should be an important reason for this phenomenon.
The influence of membrane deformation on wing aerodynamic characteristics is reflected in multiple dimensions. On the two-dimensional level, the aerodynamic load presents asymmetric suction and pressure on the upper and lower surfaces, respectively, and the camber and thickness of the cross-section airfoil will change. On the three-dimensional level, the wing surface is no longer regular, and the spanwise disturbance caused by the periodic fluctuation will affect the K-H instability, resulting in three-dimensional effects on the flow behavior [7].
In an early study of fluid structure coupling of membrane wings, the deformation measurement was generally realized by numerical method [8,9]. Liu et al. [10] carried out numerical simulation of airship membrane structure by using the nonlinear finite element method and improved the accuracy of nonlinear calculation by updating the incremental method of Lagrange scheme. Yang et al. [11] used the four-node reduced integral membrane element to simulate the deformation of inflatable wing under internal pressure, and obtained the influence of internal and external pressure difference on wing surface stiffness and buckling characteristics. Currently, with the progress of measurement technology, the research of membrane wing is generally performed based on deformation real-time capture technology, and the mainstream measurement methods include the stereo vision measurement method and the optical fiber sensing method. Benoît et al. [12] installed two cameras with an angle of 40° between the optical axes on the upper surface of the membrane wing and solved the three-dimensional coordinates of 230 points on the membrane by using the direct linear transformation method (DLT), so as to realize the measurement of the deformation behavior through the stereo photogrammetry technology. Zhang et al. [13] used the optical fiber sensing method to monitor the polyimide skin and performed the sensing and reconstruction the membrane shape based on the surface-fitting algorithm of the sensing point curvature. The error between the monitoring results and photogrammetry is less than 5%.
With respect to numerical calculation of aerodynamic characteristics, with the maturity of computational fluid dynamics (CFD) method, the algorithm based on Reynolds’s averaged N–S equation has become the mainstream solution method. Among them, the γ-Re transition model is commonly used to solve the aerodynamic characteristics of solar aircraft, which was proposed by Langtry and Menter et al. [14,15] by combining the SST k-ω model with a transition equation. Liu et al. [16] used the S–A turbulence model to conduct static and dynamic analysis on fluid structure-coupling characteristics of large aspect ratios and large flexible wings. The results indicate that the S–A model can improve the calculation efficiency on the premise of ensuring the calculation accuracy. Large eddy simulation (LES) and direct numerical simulation (DNS) have higher accuracy than the above methods, but they also have the disadvantage of a large amount of calculation [17]. With respect to experiments, the PIV method is the mainstream method to observe the flow field structure. Mustafa et al. [18] observed the unsteady flow field of the rectangular membrane wing with a small aspect ratio via the PIV method. The research indicates that the combination of wingtip vortex and detached vortex brings a complex flow field structure and aerodynamic characteristics to the wing.
Combined with the deformation and aerodynamic data acquisition methods above, scholars have studied the fluid structure coupling problems of membrane structure in the aviation field. With respect to lift drag characteristics, Benoît et al. [12] conducted wind tunnel experiments on the deformed membrane wing. The results indicate that the active deformation makes the aircraft maintain a high lift drag ratio under multiple flight conditions. Fairuz et al. [19] studied the influence of membrane deformation on the aerodynamic performance of flapping wings by using a three-dimensional numerical simulation method. It was discovered that compared with rigid wings and prestressed membrane wings, highly flexible wings presented the best time-averaged lift–drag ratio. Additionally, some scholars have studied the stall characteristics of membrane wings. Hu et al. [20] studied the membrane airfoil by an experimental method, and quantitatively analyzed the transient behavior of a vortex on the airfoil surface by using an image velocimetry system. The research indicates that the membrane airfoil can automatically adjust the inflow by changing the radian to balance the pressure difference between the upper and lower regions, inhibit the air flow separation on the upper surface, and delay the stall of the airfoil. Guo et al. [21] conducted wind tunnel experiments on a simplified aircraft model equipped with flexible membrane wings. The research indicates that under optimal conditions, the membrane wing achieves a stall delay of 5° compared with the rigid wing, which is closely related to the flow coupling caused by membrane deformation and vibration. Furthermore, some scholars performed research on the aeroelasticity of membrane wings. Liu [10] established the coupling mathematical model of large deformation membrane structure and three-dimensional flow field, analyzed the coupling aerodynamic characteristics of inflatable airship, and studied the aeroelastic characteristics of stratospheric airship in level flight. Petrović et al. [22] performed experimental research on the aerodynamic and static aeroelastic problems of the deformed membrane wing. The research indicates that Young’s modulus of the membrane material is the key parameter affecting the aerodynamic characteristics of the membrane wing. Lang et al. [23] studied the effects of membrane materials on the aerodynamic characteristics and deformation process of flexible flapping wings. It was discovered that wings with a higher-elastic modulus membrane could generate more lift but at the cost of more power.
Although research has explained the aerodynamic generation mechanism of membrane wings, there are still some deficiencies, mainly including two aspects. Firstly, the existing research on the aerodynamic mechanism of membrane wing is generally performed for small-scale models. For example, the Reynolds number of the research model is generally lower than 105 and the turbulence is less than 0.1%, while the Reynolds number of long-endurance low-speed aircraft in flight is usually 105~106, and the real membrane skin, such as flexible photovoltaic skin, is generally rough, which will increase the turbulence. Conversely, the current studies are generally performed for single-membrane wings, which means the thickness of the wing is ignored. However, this kind of wing cannot reflect the real application of long-endurance low-speed UAV. Therefore, this paper performs experimental and numerical research on double-membrane wings with actual size, of which the chord length is 0.91 m. The second chapter introduces the wind tunnel experiment device and highlights the deformation measurement method based on the principle of binocular vision. The third chapter portrays the wind tunnel experiment results and analyzes the membrane deformation mechanism under combined actions of prestress and aerodynamic force. This chapter also compares the aerodynamic characteristics of the two types of membrane wing and rigid-skin wing. In Chapter 4, based on the verification of experimental data, a high-precision fluid structure coupling analysis method suitable for long-endurance low-speed aircraft is established. In Chapter 5, the numerical simulation method is used to broaden the scope of research. The influence of membrane deformation on the stall performance is studied, the action mechanism of different prestress on the wing performance are analyzed, and the numerical results of the two flexible-skin wings are compared, providing a theoretical basis for the laying of membrane skin. The research conclusion of this paper has guiding significance for the aerodynamic/structure/energy integrated design of a long-endurance low-speed aircraft.

2. Experimental Model and Facilities

2.1. Double Membrane Wing Model

The double-membrane wing model originates from a solar UAV with a wingspan of 15 m (in Figure 1). The flight altitude of this aircraft fluctuates between 0~15,000 m, indicating different flight speeds and Reynolds numbers. The primary parameters of the aircraft are portrayed in Table 1.
The wing of the aircraft consists of one rectangular section in the middle and one trapezoidal section on each side. As portrayed in Figure 1, a rectangular wing with four-rib spacing is taken as the force measuring section. The chord length of the section is 0.91 m and the span length is 2.018 m. The leading edge consists of the outer carbon fiber shell and the internal PMI foam. There is an isolation section on each side of the experiment section to minimize the impact of vortices generated at the end of the wing.
The skin materials used by this UAV vary according to different flight stages. In the short-endurance test flight stages, to reduce the flight cost, the polyimide membrane containing longitude and latitude glass fiber is used as the skin material. This type of skin is relatively smooth, but it does not have power generation capacity. During long-endurance flight, the wing skin is the flexible photovoltaic cell membrane based on polyurethane material. As portrayed in Figure 2, the experimental wing covers three skin materials: A. carbon fiber skin wing, which is used as the benchmark for the experiment; B. polyimide membrane wing; C. photovoltaic membrane skin wing.
Both membrane materials contain multilayer structures. Through the tensile experiment, the equivalent mechanical properties of the membranes are obtained, as demonstrated in Table 2.

2.2. Wind Tunnel

As demonstrated in Figure 3, the FD-09 wind tunnel is a single-reflux closed low-speed wind tunnel. The experiment section is 14 m long, and the effective cross-sectional area of the experiment section is 8.7854 m2. The left and right tunnel walls of the experiment section are parallel to each other, and the upper and lower tunnel walls have a 0.2° expansion angle, in order to eliminate the influence of the increase of boundary layers on the downstream wind tunnel wall and minimize the axial static pressure gradient. The turbulence of the wind tunnel is less than 0.1%, and the dynamic pressure stability is less than 0.003.
As the angle of attack changes, the blockage of the wing in the wind tunnel duct is portrayed in Figure 4. The curve in the figure indicates that when the angle of attack exceeds 6°, the blockage will be close to 6%, and the experimental results will become unreliable [24]. On the one hand, the expansion and compression of the channels on the upper and lower surfaces will affect the flow itself and make the experiment results deviate from the reality. On the other hand, the change of air pressure will bring additional aerodynamic load to the membrane and further affect the performance of the wing. Therefore, with respect to mechanism research, the wind tunnel experiment results can be used to study the deformation and flow behavior in the range of small and medium angles of attack. With respect to method research, the wind tunnel experiment can help explore numerical calculation methods with high accuracy and provide technical means for the study in a wider range.

2.3. Measurement

As demonstrated in Figure 5, to reduce the influence of wing-bending deformation, both sides of the wing are fixed with the wind tunnel wall. Two identical three-component force-measuring balances were designed for this experiment, which were placed at both ends of the model. The balance is a high lift–drag ratio balance, each component has high measurement accuracy, and the accuracy is checked by the in situ calibration system before the experiment.
Based on the stereo vision measurement method, the membrane deformation behavior was monitored. As demonstrated in Figure 6a, we placed one binocular-vision camera above and below the membrane wing to monitor the deformation of the upper and lower surfaces, respectively. As demonstrated in Figure 6b, we considered 50% of the area in the middle of the skin the deformation measurement area, drew a grid on the membrane with a spacing of 25 mm, and the corners of the grid were the measurement points. The binocular-vision system reconstructs the surface in real time according to the node deformation recorded by the camera. Through the adjustment of camera position and error correction, we controlled the deformation measurement accuracy within the allowable range.

3. Experiment Results

3.1. Membrane Deformation in Cruise State

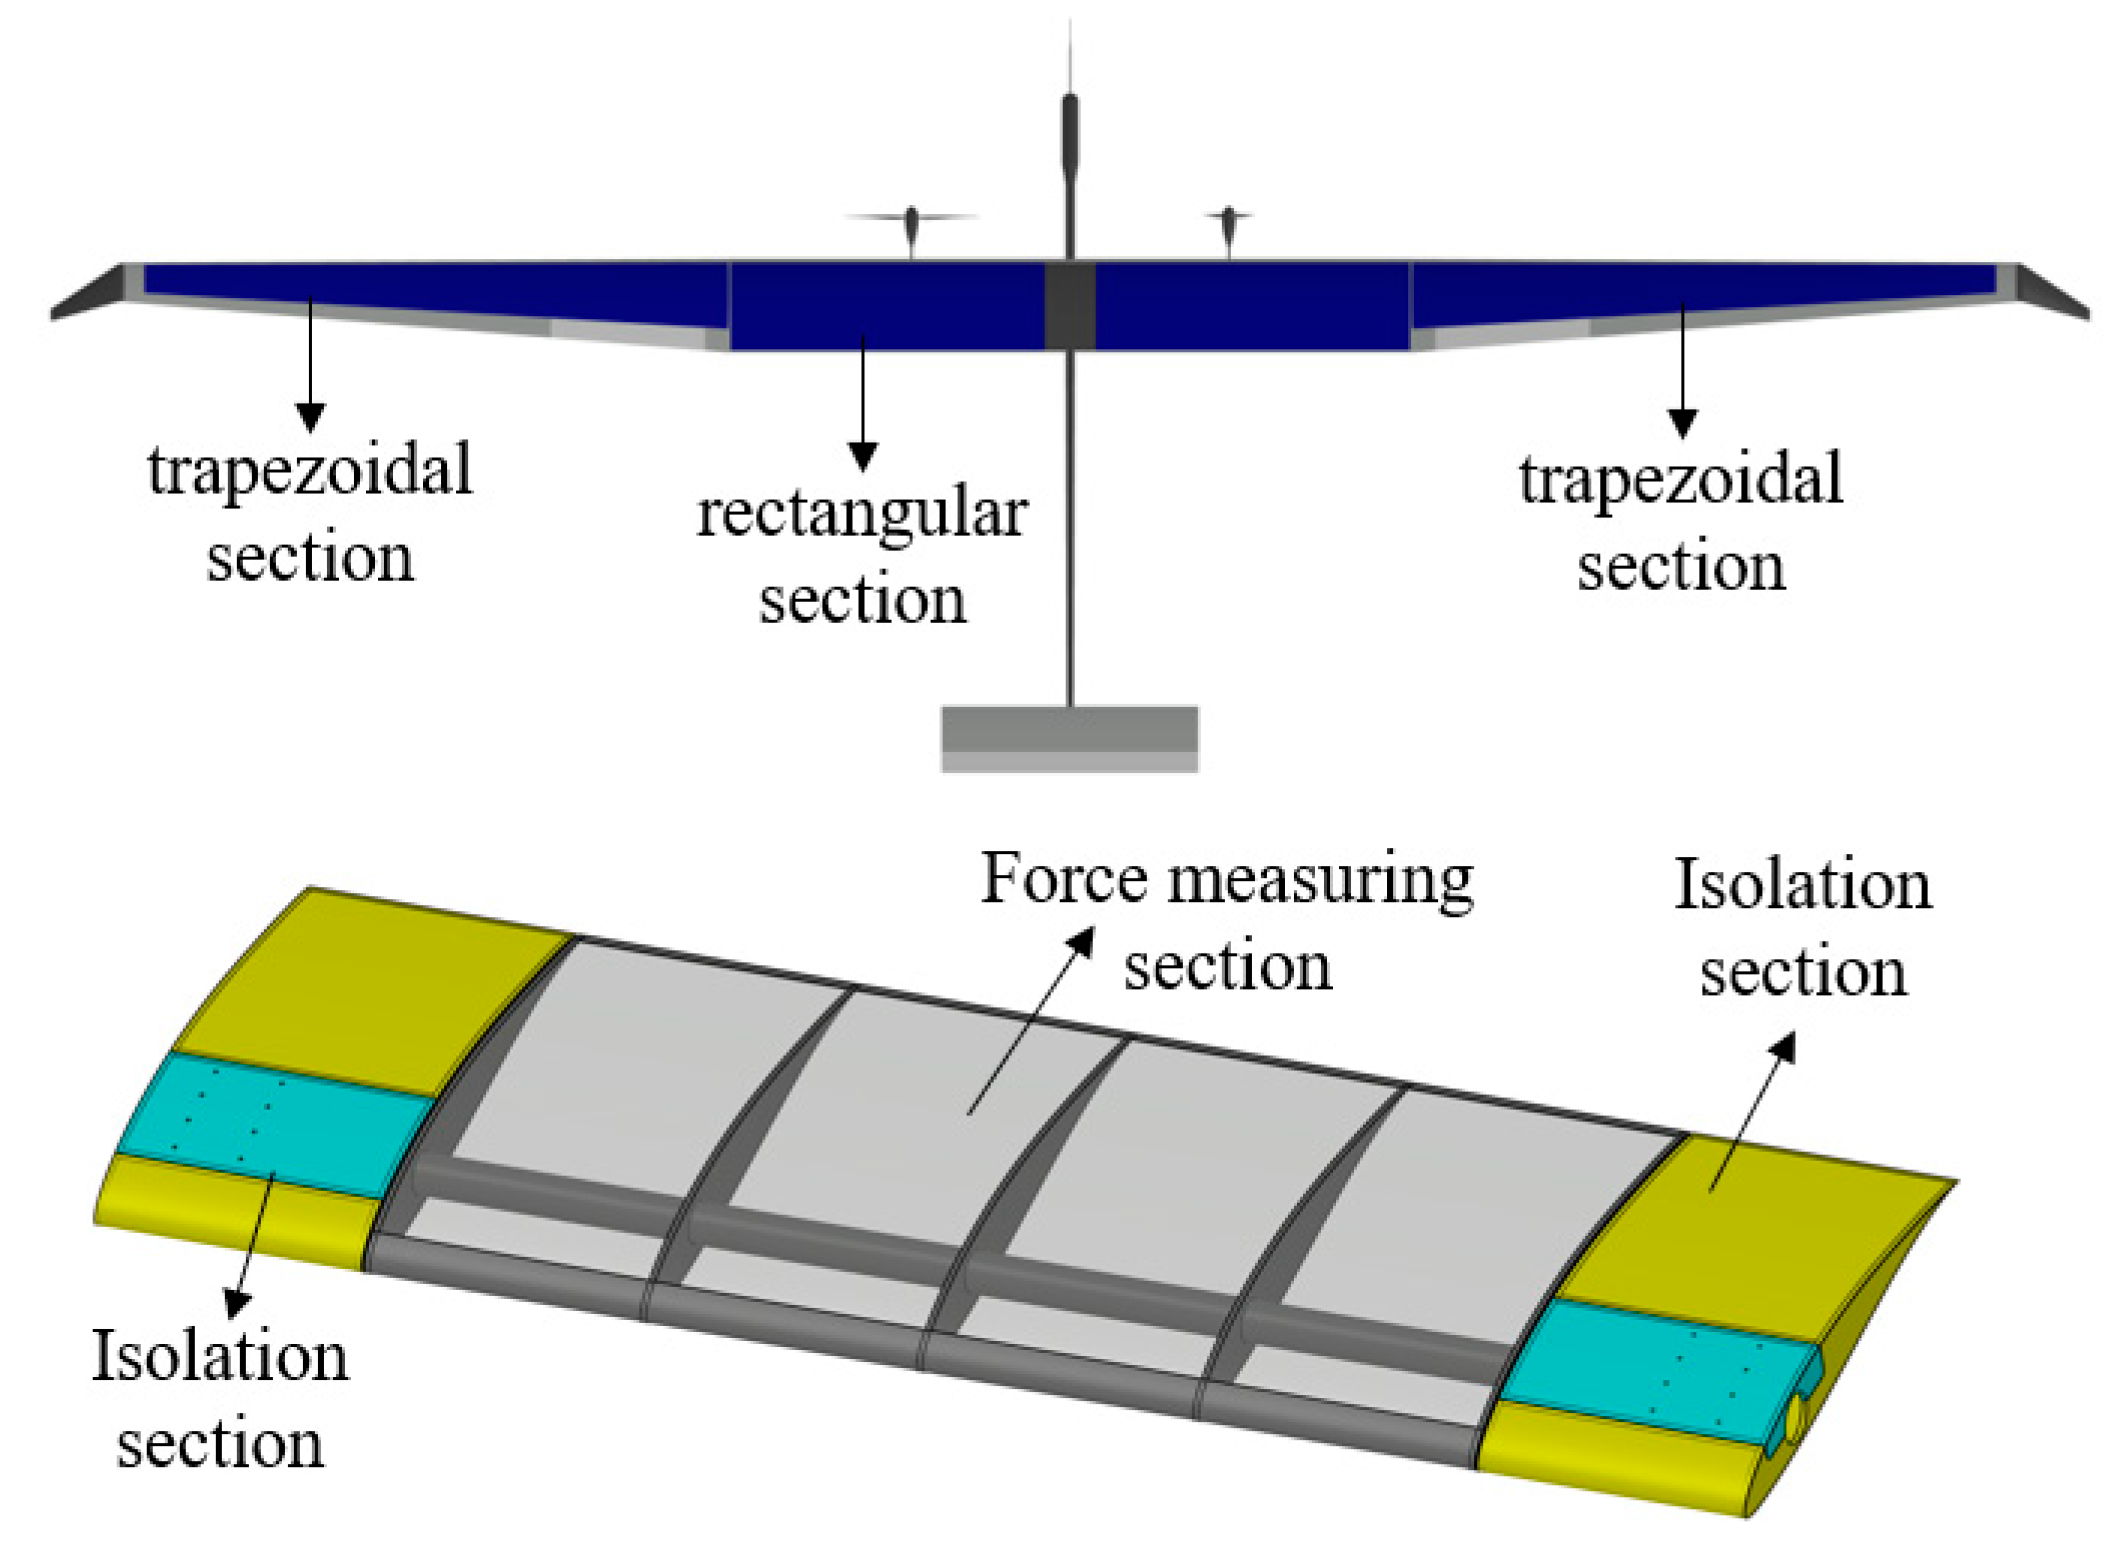
When the solar UAV displayed in Figure 1 flies at the altitude of 0 m, the membrane deformation monitored by the binocular vision camera is portrayed as in Figure 7. The aerodynamic loads on the upper and the lower surfaces are suction and pressure, respectively. Therefore, the upper membrane is convex, and the lower membrane is concave. However, the deformation nephogram demonstrates some phenomena inconsistent with conventional cognition. First, although the front of the upper surface bears a large suction, the membrane demonstrates a slight depression. Second, the pressure in the front of the lower surface is less than that in the rear, but the extreme value of deformation appears in the forward region.
In fact, the membrane deformation is the result of the joint action of two kinds of loads: prestressing force and aerodynamic force. The deformation behavior is also affected by the curvature of the wing surface, and the deformation properties vary from surface configurations. The deformation properties primarily include: (a) when chordal prestress is applied, the curvature of the surface tends to decrease; (b) for convex surfaces, convexity is more difficult than concavity, and the greater the curvature, the more difficulty of convexity; and (c) the farther the surface is from the border, the less difficult it is to deform.
With the above deformation properties, the membrane deformation mechanism can be explained. The basic shape of the upper surface is a convex surface, and the curvature of the front part is larger than that of the rear part. Under the action of chordal prestress, the front convex surface appears to trend concave. Conversely, the larger curvature and closer distance from the frame increase the difficulty of convexity. Therefore, although there is a large suction in the front, it is still insufficient to offset the depression caused by prestress. The situation of the rear region is the opposite. Due to its small curvature, the deformation caused by prestress is not obvious. Additionally, smaller curvature and longer distance from the frame make it easier to bulge under distribution load. Therefore, the convexity deformation caused by aerodynamic force occupies a dominant position. From front to back, the lower surface of the wing is convex surface, approximate plane, and concave surface, respectively. The prestress makes the front and rear surfaces concave and convex, respectively. Under the distributed aerodynamic force, the convex surface in the front is easier than the concave surface in the rear, which further increases the concave amount in the front region. Under the combined action of the above two factors, the maximum deformation area moves forward.
As demonstrated in Figure 8, the deformation of membrane skin will significantly change the section airfoil curve. Firstly, because the membranes in the upper and lower surfaces are convex and concave, respectively, the camber of the airfoil increases. Secondly, near 30% chord length of the airfoil, the upper and lower surfaces both deform inward, resulting in the reduction of the maximum relative thickness of the airfoil. Concurrently, in the rear area, the protrusion of the upper surface is greater than the depression of the lower surface, so the thickness at the rear region increases. Third, the trailing edge of the airfoil moves upward, resulting in a slight decrease in the angle of attack.
As demonstrated in Figure 9, the upper surface has slight depression in the area of 0~32% chord length, and the deformation is less than 1 mm. When the chord length exceeds 32%, the airfoil curve is convex, and a platform appears in the range of 53~82% chord length, in which the deformation is at a high level. The maximum protrusion on the upper surface is 5.06 mm, which occurs at 70.5% chord length. The lower surface is concave inward in the full chord range, and compared with the upper surface, the deformation changes more evenly with the chord length, first increasing and then decreasing. The maximum deformation is 3.13 mm, which occurs at 45.3% chord length. It is noteworthy that the deformation of the quarter span section curve exceeds 70% of the middle span section curve on both the upper and lower surfaces.

3.2. Influence of Wing Load on Deformation

In the wind tunnel experiment, the change of wind speed will bring the difference in Reynolds number, which will slightly affect the pressure distribution along the chord, and also lead to the difference of wing load, which will greatly influence the membrane deformation behavior. Therefore, the wing load is the primary index to be considered in the design of experimental wind speed. Taking solar UAV as an example, the wing load W/S is generally between 2.4 kg/m2 and 6.3 kg/m2 [4]. The wind speeds of the experiment are set as 6.4 m/s, 9.0 m/s, and 11.0 m/s, respectively, to simulate the membrane skin wing under different flight parameters. The experimental conditions are portrayed in Table 3.
When the α = 4°, the membrane deformation under different experimental conditions is shown in Figure 10 and Figure 11. It can be seen that the wing loads does not affect the overall deformation trend of the membrane, whether on the upper surface or the lower surface. Firstly, the front area of the upper surface is slightly concave, the rear area is greatly convex, and the rear edge is slightly upturned. The maximum convex amount all appears near 70% chord length. Secondly, the lower surface shows a concave trend as a whole, and there is a small bending at the trailing edge consistent with the upper surface. The maximum concave amount appears near 45% chord length. As shown in Figure 10, for the upper surface, the bulge amplitude at the rear area is approximately proportional to the wing load. When W/S = 7.8 kg/m2, the maximum deformation is 2.336 mm. The front concave area reflects the superposition effect of prestress and aerodynamic force. When the wing load is small, the aerodynamic suction is not enough to offset the concave deformation caused by prestress, so Figure 10a shows an obvious depression in the front area. As the wing load increases, the aerodynamic force gradually occupies the dominant role, and the concave appears a mitigation trend. As shown in Figure 10b,c, when the W/S = 7.8 kg/m2, most areas of the front area are convex. As shown in Figure 11, for the lower surface, although the concave amount of the membrane is positively correlated with the wing load, they are not strictly proportional. When the wing load is increased by 3 times, the maximum deformation is only doubled.

3.3. Aerodynamic Force

The measurement results of aerodynamic force are shown in Figure 12, Figure 13 and Figure 14. According to Figure 12a, Figure 13a and Figure 14a, the lift coefficient curves of the three skin wings have high coincidence. At individual angles of attack, the lift coefficient of the photovoltaic membrane skin wing has a small loss but does not affect the overall slope of the lift coefficient curve. Therefore, it can be considered that the membrane deformation will not affect the lift performance below 6° angle of attack. As shown in Figure 12b, Figure 13b and Figure 14b, the skin materials have obvious influence on the drag coefficient curve. Among them, the drag coefficient curves of polyimide skin and rigid skin wing intersect, which are shown as: when α < 0°, the drag coefficient of polyimide skin wing is smaller; when α > 0°, the rigid skin wing has a smaller drag coefficient; when α = 0°, the drag coefficients of the two airfoils are almost the same. The variation of the above drag coefficient curve is related to the change of airfoil camber and thickness. As shown in Figure 12c, Figure 13c and Figure 14c, skin deformation will also bring significant differences to the pitch moment coefficient curve. Comparing the Cm-α curves of rigid skin and polyimide skin wings, it can be seen that except for individual angles of attack, the skin deformation increases the moment coefficient, and the greater the wing load, the larger the increment. Combined with the analysis of Figure 8, the greater the wing load, the more curvature increment of the section airfoil, and the moment coefficient will increase accordingly.
In the experiment, the drag and pitch moment coefficients of photovoltaic membrane-skin wings portray great differences. Under the three wind speeds, the drag coefficient curves are all significantly higher than the other two wings. Combined with the experiment phenomenon, the reasons are explained as follows: (a) the surface of photovoltaic cells is uneven, which increases the friction resistance; (b) there are gaps in the arrangement of photovoltaic cells, resulting in periodic changes in skin modulus, bringing irregular deformation of the membrane; (c) and the photovoltaic skin has experienced the process of bonding and heat treatment in the prefabrication stage, and there are inevitable wrinkles. Therefore, it can be considered that the factors affecting the aerodynamic performance of photovoltaic membrane skin wing are complex, so the influence of skin deformation on the drag coefficient and the pitch moment coefficient cannot be directly inferred from its performance in the wind tunnel. However, the results of the experiment can directly indicate the changes of aerodynamic characteristics of the wing after laying photovoltaic cells, which has reference significance for the aerodynamic and overall design of solar UAV.

4. Numerical Method

4.1. Coupling Analysis Method

As discussed in Section 2.2, the wind tunnel test results are valid only in the range of small and medium angles of attack. Additionally, affected by sample numbers and cost, it is difficult to study more factors directly through experimental means. Furthermore, the chord–length ratio between the experiment model and the real wing is 1:1, and it is difficult to carry out PIV measurement on such a large-scale model. Therefore, the fluid structure coupling analysis process suitable for this type of wing is established to support more in-depth research, and the accuracy is verified by using the experimental data.
As indicated in Figure 15, the analysis method is based on the weak coupling solver. Each iteration process includes a CFD module and a FEM module. The S–A turbulence model is used for CFD calculation, and the time homogenized aerodynamic force obtained is output to the FEM module as the input parameter. The FEM module based on the N–R iterative method is used to simulate the membrane deformation behavior, and this module will output the coordinates of surface nodes. When the difference between the node coordinates obtained in the two adjacent iterative processes is small enough, the analysis results are output. Otherwise, the surface is reconstructed according to the node coordinates, and the next iterative analysis is started.

4.2. CFD Module Based on S–A Model

The aerodynamic force of the membrane wing is calculated by using the CFD method based on Reynolds averaged N–S equation (RANS) and Spalart–Allmaras (S–A) turbulence model. S–A model is a single equation model [25,26]. Compared with other turbulence models, this model has the advantages of fast calculation speed and better prediction results for inverse pressure gradient problems. Ignoring the influence of density fluctuation, the physical quantities in the N–S equation are time-homogenized, and the Reynolds time-averaged continuity equation is obtained as follows:
ρ t + x i ( ρ u i ) = 0 t ( ρ u i ) + x j ( ρ u i u j ) = p x i + x j ( μ u i x j ρ u ¯ i u ¯ j ) + S i t ( ρ ϕ ) + x j ( ρ u ϕ ) = x j ( Γ ϕ x j ρ u ¯ j ϕ ¯ ) + S
where ρ u ¯ i u ¯ j is the Reynolds stress. The Reynolds stress is connected with the turbulence average velocity gradient by the Reynolds average KBoussinesq model, which is expressed as:
ρ u ¯ j u ¯ = μ ( u i x j + u j x i ) 2 3 ( ρ k + μ i u i x i ) δ i j
where μt is turbulent viscosity, ui is average velocity, δij is the symbol of “Kroncckcr delta”, and k is turbulent kinetic energy.
In the above equation, the purpose of calculating turbulent flow is to solve the turbulent viscosity μt. The S–A model uses a transmission equation to model μt, which is expressed as:
t ( ρ v ˜ ) + x i ( ρ v ˜ u i ) = G v + 1 σ v ˜ { x j [ ( μ + ρ v ˜ ) v ˜ x j ] + C b 2 ρ ( v ˜ x j ) 2 } Y v + S v ˜
μ t = ρ v ˜ f v 1
where v ˜ is the turbulent viscosity in the area except the wall, Gv is the dissipative term, Yv is the generating term, and Sv is the diffusion term. fv1 = χ3/(χ3 + cv13), where χ is the intermediate variable, and cv1 is a constant, taken as 7.1.
A structured grid has higher quality and calculation accuracy compared with an unstructured grid. As displayed in Figure 16, the structured grid of the membrane wing is automatically generated in the CFD module. The chord length is c, and the distance of the front and back boundaries away from the leading edge and the trailing edge is 40c. The up and down boundaries are 20c away from the chord.
In this part, the calculation accuracy of the numerical method is verified. Because the Tran-SST model can accurately reflect the laminar flow separation, transition, and reattachment behavior at a low Reynolds number, it is widely used in aerodynamic calculation of ultrahigh altitude and high-aspect ratio UAV. Therefore, this model is also added to the comparison.
As shown in Figure 17, Figure 18 and Figure 19, the test data of rigid wing in Figure 12, Figure 13 and Figure 14 are used to verify the accuracy of S–A model and Tran-SST model. When Re = 4 × 10⁵, although the Tran-SST model indicates higher accuracy on lift prediction at the angle of attack of 2°~6°, the slope of CL-α curve obtained by the S–A model is closer to the experiment results on the whole. In terms of drag prediction, S–A model is obviously more accurate than Tran-SST model. And in most cases, the drag calculated by S–A model is smaller than that obtained by experiment. When Re = 5.6 × 10⁵ and Re = 6.9 × 10⁵, the lift coefficient curve predicted by S–A model is more consistent with the experiment results. The drag coefficient in wind tunnel experiment is between Tran-SST model and S–A model, and is closer to S–A model, which is consistent with the case when Re = 4 × 10⁵. In conclusion, the S–A model has high prediction accuracy for the membrane wing in this paper, and is suitable for fluid structure coupling analysis. At three Reynolds numbers, the errors of pitching moment coefficients obtained by different methods are all within 0.01. When the angle of attack is greater than 0°, the pitching moment coefficient obtained by the test is generally between the calculation results of S–A model and Tran-SST model.
It should be noted that the flexible skin wings used in the experiment are affected by the surface roughness of the membrane, the wrinkles at four corners, and the prestress error, which are difficult to quantify. Therefore, the validation of the numerical method of aerodynamic analysis in this chapter is based on the rigid wing. As a result, the numerical analysis process established in this chapter is for the ideal membrane wing, and the above uncertainties are not considered in the numerical analysis in Chapter 5.

4.3. FEM Module Based on N-R Iterative Method

The deformation size of the flexible skin is 1~2 orders of magnitude higher than its own thickness, and there is a strong geometric nonlinear effect. Under this condition, the finite element method generally has higher prediction accuracy than the analytical method.
Firstly, the skin is discretized into finite elements, and then the appropriate displacement function is selected to describe the displacement distribution law in the element. Proceeding to the next step, the coordinate of any point is derived from the node displacement, and the force on the node is obtained. Based on the principle of virtual work, the relationship between node force and node displacement can be constructed:
[ F ] e = [ K ] e [ ε ] e
where [F]e is the node force matrix, [ε]e is the node displacement matrix, and [K]e is the element stiffness matrix.
Through the overall force balance conditions and boundary conditions, the characteristics of each element are superimposed into a whole, and the overall finite element equation is established:
[ F ] = [ K ] [ ε ]
where [F] is the load component array, [ε] is the displacement of all nodes, and [K] is the overall stiffness matrix.
For nonlinear problems, the stiffness matrix [K] is constantly changing with the change of displacement, and the solution of the stiffness matrix requires multiple iterations of updates. The iterative methods mainly include direct iterative method, Newton iterative method and incremental method. The solution in this chapter adopts Newton-Raphson iteration method, which realizes iteration through linearization of nonlinear equations. Every iteration will regenerate the tangent stiffness matrix until the result converges.
On the basis of the above finite element equations, the boundary constraints are introduced to solve the overall finite element equations, and the node displacement components are obtained.
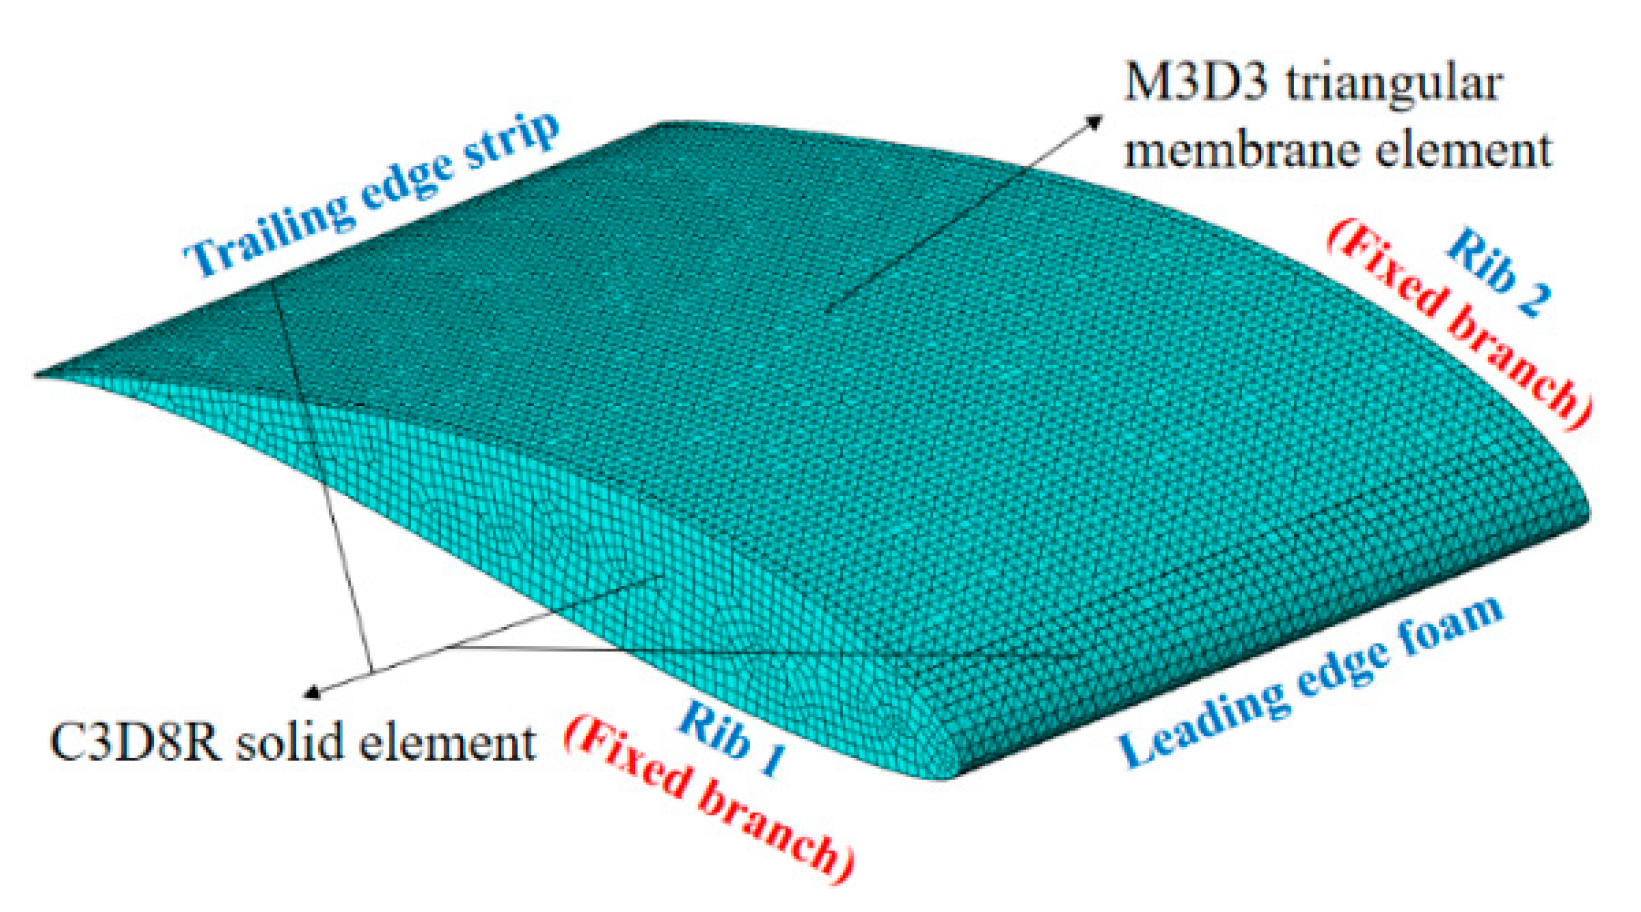
In this section, the M3D3 element is used for the relevant calculation of the membrane, taking the large deformation effect into account, and the stress vector follows the normal direction of the element during the iteration. The M3D3 element is a three-node triangular membrane, which has high accuracy for predicting membrane deformation. The membrane structure is supported by wing ribs, leading edge foam, trailing edge strips, and other structures. These solid structures adopt the C3D8R element, which is an eight-node linear brick with reduced integration and hourglass control. The ribs on both sides of the wing are fixed, as portrayed in Figure 20.
As portrayed in Figure 21, the finite element method based on the N–R iterative method is used to simulate the deformation of membrane structure when v = 6.4 m/s and a = 4°. It can be observed from the comparison with Figure 10a and Figure 11a that the numerical calculation method can predict the deformation trend of the membrane, although it cannot predict the amplitude of the upper surface deformation accurately. The predicted value of the maximum convexity of the upper surface is 0.87 mm, which is smaller than the 1.41 mm observed in the experiment. The predicted value of the maximum concave amplitude of the lower surface is 3.06 mm, which is near to the 3.12 mm obtained by the experiment.

5. Numerical Analysis

5.1. Stall Performance

Because the stall performance of the wing cannot be obtained directly by experimental means, the relevant research can bce performed with the help of the numerical simulation method established in Chapter 4. As portrayed in Figure 22, under the three incoming velocities, when α is in the range of −4°~8°, the lift coefficient curves of the two wings have a high degree of coincidence, indicating that the membrane deformation does not affect the lift characteristics at medium and small angles of attack, which is consistent with the wind tunnel experiment results. When α > 8°, the two lift curves begin to indicate slight differences, and the lift characteristics of polyimide-skin wings are better than those of rigid-skin wings. When the angle of attack continues to increase, the stall characteristics of the two wings are significantly different. The stall angle of the rigid-skin wing is about 13°, while the membrane deformation delays the stall angle of the polyimide-skin wing to 14°. When v = 6.4 m/s and α = 14°, the lift coefficient of the polyimide-skin wing is 0.089 higher than that of the rigid-skin wing.
Figure 23 can visually portray the increment of aerodynamic coefficient caused by membrane deformation under different inflow conditions. In the figure, ΔCL, ΔCD, and ΔCM, represent the changes of lift coefficient, drag coefficient and pitching moment coefficient when the skin changes from rigid to flexible, respectively. For the lift coefficient, except for the three data points of low wind speed and small angle of attack, the membrane deformation brings a small increment of lift. Below a 12° angle of attack, the effect of membrane deformation on the increment becomes more obvious with the increase of wind speed. Above a 12° angle of attack, with the increase of wind speed, the effect of lift increasing becomes weaker. However, the increment of lift coefficient is significantly larger than that at small angle of attack, which is related to the improvement of stall performance caused by membrane deformation. When α = 12°, the effect of membrane on lift is hardly affected by wind speed.
For the pitch moment coefficient, in most cases, the skin deformation will lead to the increase of the pitch moment, which is consistent with the conclusion of the wind tunnel experiment. At each angle of attack, the increment of pitch moment becomes larger with the increase of wing load. Although the wing loads are different, the curves in Figure 23b indicate a similar law, that is, the greater the angle of attack, the greater the increment. When α > 12°, the slope of the curves increases sharply, which is caused by the improvement of stall performance. When W/S = 7.8 kg/m2 and α = 16°, the increment of pitch moment exceeds 10%, while when W/S = 2.6 kg/m2 and α = −4°, the pitch moment decreases.
Figure 24 portrays the streamlines of the polyimide-skin wing at a 50% span section when α = 4° and v = 6.4 m/s. It can be observed that the membrane deformation on the upper surface makes the rear of the airfoil more flat and the turbulence separation position is delayed from 70.5% to 73.6% chord length so that the airfoil can generate more lift. The three-dimensional streamline demonstrated in Figure 25 can be used to visually explain the stall delay phenomenon. The turbulent separation points of each section along spanwise form a separation line. Under aerodynamic load, the membrane in the middle area of the upper surface is convex, so that the middle of the separation line bends toward the trailing edge of the wing, and then brings differential aerodynamic characteristics along spanwise. Generally, the membrane skin wing is endowed with adaptability through the passive deformation of the membrane.

5.2. Prestressing Force

When laying the flexible skin, it is necessary to provide an appropriate amount of prestress to maintain the wing shape. As displayed in Figure 26, the spanwise prestress Ps and chord prestress Pc can be provided by using the tensioning device. These two types of prestress will affect both the initial state and the loaded state of the membrane shape. The numerical analysis method is used to research the influence of prestress on simulation results of the S–A model.
Compared with the skin deformation when normal prestress is applied (Figure 27a and Figure 28b), when the spanwise prestress is increased to three times, the deformation of the membrane decreases (Figure 27c and Figure 28c), while the overall trend of deformation remains unchanged. This is because the spanwise prestress only affects the skin tension and does not affect the section shape, so it only reduces the deformation amplitude but does not affect the trend. When the chordal prestress is increased by three times, the deformation behavior of the membrane changes obviously (Figure 27b and Figure 28b). First, the prestress makes the convex membrane on the upper surface concave, and the pneumatic suction cannot resist the concave trend, resulting in negative deformation. The concavity in the front area of the lower surface increases because the prestress itself will provide the concavity of the convex surface, and the aerodynamic force intensifies this trend. Prestress makes the rear area convex, and the pneumatic pressure cannot resist the convex trend, resulting in negative local deformation. Generally, chord prestress has a greater impact on the shape of the wing section, which will cause the airfoil to deviate from the rigid shape.
As displayed in Figure 29a,b, there is little difference in the lift and drag coefficients caused by skin deformation before and after increasing spanwise prestress because spanwise prestress hardly changes the shape of wing section. However, because the increase of spanwise prestress weakens the skin deformation, the change of airfoil curvature is no longer obvious, so the change rate of pitch moment coefficient decreases accordingly, as observed in Figure 29c. With the increase of chordal prestress, the lift and drag coefficient of the wing are obviously lost in the range of −4°~10° angle of attack, and the pitch moment decreases obviously. This is because the larger chord prestress makes the airfoil curve irregularly deformed, the camber and thickness of the airfoil are reduced, and the wing has deviated from the initial shape. This state will cause large deviation between the real aerodynamic characteristics and the numerical simulation results of the aircraft, which should be avoided as much as possible.
The above research provides a scientific basis for the laying of membrane skin of long-endurance low-speed UAV. Firstly, the spanwise prestress can be increased as much as possible if the structure permits, so that the aerodynamic characteristics are closer to the numerical results based on the assumption of rigid body. Secondly, the chordal prestress can be properly applied on the upper surface according to the wing load, which is helpful to eliminate the deformation caused by aerodynamic force. However, if the prestress is too large, it will also lead to the concave of convex surface and the damage of the section shape. Finally, the chordal prestress should not be applied to the lower surface. Under any working condition, the chord prestress will increase the concave amount in the front of the lower surface and the aerodynamic parameters deviate from the design result.

5.3. Material

As mentioned in Chapter 2, the solar aircraft carries two types of membrane skins, which have different characteristics. However, because the laying of photovoltaic skin is difficult to reach the ideal conditions, it is difficult to study the influence of deformation on its aerodynamic performance through experiments. In this section, the deformation laws and aerodynamic characteristics of the two wings under ideal conditions are compared through a numerical method.
The comparison of upper surface deformation is shown in Figure 27a and Figure 30a. The photovoltaic skin wing shows a similar deformation trend to the polyimide skin wing, while the maximum deformation of photovoltaic skin wing is smaller. As shown in Figure 28a and Figure 30b, the two wings also show a similar deformation trend on lower surface, and the difference is that the maximum deformation of the photovoltaic skin wing is greater. Although the upper and lower surface deformations are different, they are both within 30%. This is because the elasticity modulus and thickness of polyimide skin are respectively much larger and much smaller than that of photovoltaic skin, and their effects on deformation behavior offset each other.
As portrayed in Figure 31, the lift and drag characteristics of photovoltaic-skin and polyimide-skin wings are similar because the two wings have similar deformation amplitudes and trends. The lift and drag coefficients of photovoltaic skin wings are slightly smaller, while the pitching moment coefficients of the two wings are obviously different. The pitching moment of the photovoltaic skin wing is significantly smaller than that of the polyimide-skin wing, and this is related to the different camber changes of the two wings after deformation.

6. Conclusions

In this paper, the wind tunnel experiment research and numerical study are performed for membrane-skin and rigid-skin wings. The primary conclusions include:
(1)
The measurement results indicate that under the combined action of prestress and aerodynamics, the camber of the airfoil increases and the thickness decreases. The maximum deformation of the lower surface is approximately proportional to the wing load, while on the lower surface, the relationship is only a positive correlation.
(2)
The membrane deformation has little influence on the lift characteristics of the wing but has a great influence on the drag and pitching moment characteristics. The drag coefficient curves of polyimide-skin and rigid-skin wings intersect at 0°, and the change of airfoil camber caused by membrane deformation increases the pitch moment coefficient.
(3)
Compared with the Tran-SST model, the S–A model has higher fitting accuracy for wind tunnel state. The finite element method based on the N–R iteration method has high accuracy in predicting the membrane deformation. The fluid-structure coupling analysis process based on the weak coupling method can be used for the numerical simulation of the membrane wing.
(4)
Membrane deformation will flatten the upper surface of the wing and move the air-flow separation position backward at a high angle of attack. Taking the wing studied in this paper as an example, polyimide skin deformation can delay the stall angle by 1°.
(5)
When laying flexible skin, increasing spanwise prestress can make the aerodynamic characteristics closer to the numerical results under the assumption of the rigid body. Proper chord prestress on the upper surface is helpful to eliminate the deformation, but excessive application will destroy the section shape. It is not suitable to apply chord prestress on the lower surface, because the deformation it brings will damaging the shape of the wing in any state.

Author Contributions

Conceptualization, L.Z. and Y.Y. (Yuan Yao); data curation, D.M. and M.Y.; formal analysis, L.Z. and Y.Y. (Yayun Yu); funding acquisition, D.M.; investigation, M.Y. and X.Y.; methodology, L.Z. and X.Y.; project administration, D.M. and M.Y.; resources, L.Z. and X.Y.; software, Y.Y. (Yuan Yao) and Y.Y. (Yayun Yu); supervision, M.Y. and Y.Y. (Yayun Yu); validation, L.Z. and Y.Y. (Yuan Yao); visualization, Y.Y. (Yuan Yao) and Y.Y. (Yayun Yu); writing—original draft, L.Z.; writing—review and editing, D.M. and X.Y. All authors have read and agreed to the published version of the manuscript.

Funding

This research received no external funding.

Institutional Review Board Statement

Not applicable.

Informed Consent Statement

Not applicable.

Data Availability Statement

The data presented in this study are available on request from the corresponding author.

Conflicts of Interest

The authors declare no conflict of interest.

References

  1. Zhao, X.; Zhou, Z.; Zhu, X.P.; Guo, A. Design of a hand-launched solar-powered unmanned aerial vehicle (UAV) system for plateau. Appl. Sci. 2020, 10, 1300. [Google Scholar] [CrossRef] [Green Version]
  2. Rajendran, P.; Smith, H. Future trend analysis on the design and performance of solar-powered electric unmanned aerial vehicles. Adv. Mat. Res. 2015, 1125, 635–640. [Google Scholar] [CrossRef]
  3. Ma, D.L.; Zhang, L.; Yang, M.Q.; Xia, X.L.; Wang, S.Q. Review of ultra-long-endurance solar-powered unmanned aerial vehicle. Acta. Aeronaut. Astronaut. Sin. 2020, 41, 623418. [Google Scholar]
  4. Zhang, L.; Ma, D.L.; Yang, M.Q.; Xia, X.L.; Yao, Y. Optimization and analysis of composite sandwich box beam for solar drones. Chin. J. Aeronaut. 2021, 34, 148–165. [Google Scholar] [CrossRef]
  5. Zhu, X.F.; Zheng, G.; Hou, Z.X. Solar-powered airplanes: A historical perspective and future challenges. Prog. Aerosp. Sci. 2014, 71, 36–53. [Google Scholar] [CrossRef]
  6. Romeo, G.; Cestino, E.; Corsino, G.; Frulla, G. HELIPLAT: Design, Aerodynamic, Structural Analysis of Long Endurance Solar-Powered Stratospheric Platform. J. Aircraft. 2004, 41, 1505–1520. [Google Scholar] [CrossRef]
  7. Ai, G.Y.; Ye, J. Large-eddy simulation of low Reynolds number airfoil with different separating flow regime. Acta. Aerodyn. Sin. 2017, 35, 299–304. [Google Scholar]
  8. Oden, J.T.; Sato, T. Finite strains and displacements of elastic membranes by the finite element method. Int. J. Solids. Struct. 1967, 3, 471–488. [Google Scholar] [CrossRef]
  9. Green, A.E.; Adkins, J.E.; Rivlin, R.S. Large elastic deformations. Phys. Today 1971, 24, 57. [Google Scholar] [CrossRef]
  10. Liu, J.M. Coupling Computation of the Flow Field and the Large Deformation of Membrane Structure of Stratosphere Airships. Ph.D. Thesis, Shanghai Jiao Tong University, Shanghai, China, 2007. [Google Scholar]
  11. Yang, Y.Q.; Ma, Y.P.; Wu, Z. Analysis of effect of interior pressure to deformation of inflatable wing with fluid-structure interaction analysis method. J. Beijing Univ. Aeronaut. Astronaut. 2014, 40, 188–192. [Google Scholar]
  12. Benoît, B.; Breitsamterm, C.; Adams, N. Aerodynamic investigations of a morphing membrane wing. AIAA J. 2012, 50, 2588–2599. [Google Scholar]
  13. Zhang, J.K.; Sun, G.K.; Li, H.; Lou, X.P.; Zhu, L.Q. Optical fiber shape sensing of polyimide skin for flexible morphing wing. Chin. J. Sci. Instrum. 2018, 39, 66–72. [Google Scholar]
  14. Langtry, R.B.; Menter, F.R.; Likki, S.R.; Suzen, Y.B. A correlation-based transition model using local variables part I-model formulation. J. Turbomach. 2004, 128, 413–422. [Google Scholar]
  15. Langtry, R.B.; Menter, F.R.; Likki, S.R.; Suzen, Y.B. A correlation-based transition model using local variables part II-test cases and industrial applications. J. Turbomach. 2004, 128, 423–434. [Google Scholar] [CrossRef]
  16. Liu, Z.W. The Numerical Research on Fluid-Structure Interaction of High-Aspect-Ratio Flexible Wings. Ph.D. Thesis, National University of Defense Technology, Changsha, China, 2012. [Google Scholar]
  17. Li, C.F.; Jiang, L.H. Review of near space long endurance solar-powered unmanned aerial vehicle in aerodynamic study. World Sci-Tech RD 2018, 40, 386–398. [Google Scholar]
  18. Mustafa, G.S. Unsteady aerodynamics and flow-induced vibrations of a low aspect ratio rectangular membrane wing with excess length. Exp. Therm. Fluid. Sci. 2013, 44, 749–759. [Google Scholar]
  19. Fairuz, Z.M.; Abdullah, M.Z.; Zubair, M.; Mujeebu, M.A.; Abdullah, M.K.; Yusoff, H.; Aziz, M.S.A. Effect of wing deformation on the aerodynamicn performance of flapping wings: Fluid-structure interaction approach. J. Aerospace. Eng. 2016, 29, 04016006. [Google Scholar] [CrossRef]
  20. Hu, H.; Tamai, M.; Murphy, J.T. Flexible-membrane airfoils at low Reynolds numbers. J. Aircraft. 2008, 45, 1767–1778. [Google Scholar] [CrossRef]
  21. Guo, Q.F.; He, X.; Wang, Z.; Wang, J.J. Effects of wing flexibility on aerodynamic performance of an aircraft model. Chin. J. Aeronaut. 2021, 34, 133–142. [Google Scholar] [CrossRef]
  22. Petrovi, C.I.; Šajn, V.; Kosel, T.; Marzocca, P. Aerodynamics and static aeroelastic behavior of low-Reynolds number deformable membrane wings. J. Aerosp. Eng. 2016, 29, 4015066. [Google Scholar] [CrossRef]
  23. Lang, X.Y.; Song, B.F.; Yang, W.Q.; Yang, X.J. Effect of wing membrane material on the aerodynamic performance of flexible flapping wing. Appl. Sci. 2022, 12, 4501. [Google Scholar] [CrossRef]
  24. Zhi, X.; Li, S.; Liu, Y.; Zhang, Y.M.; Zheng, S.; Li, Z.H. Test and research on blockage ratio coefficient of wind tunnel. Metrol. Meas. Technol. 2017, S1, 356–358. [Google Scholar]
  25. Spalart, P.R.; Allmaras, S.R. A One-Equation Turbulence Model for Aerodynamic Flows. In Proceedings of the 30th Aerospace Sciences Meeting and Exhibit, Reno, NV, USA, 6–9 January 1992; p. 439. [Google Scholar]
  26. Deck, S.; Duveau, P.L.; D’Espiney, P. Development and application of Spalart–Allmaras one equation turbulence model to three-dimensional supersonic complex configurations. Aerosp. Sci. Technol. 2022, 6, 171–183. [Google Scholar] [CrossRef]
Figure 1. Double membrane wing of the solar UAV.
Applsci 12 06765 g001
Figure 2. Three kinds of experimental models.
Applsci 12 06765 g002
Figure 3. Experimental model in FD-09 wind tunnel.
Applsci 12 06765 g003
Figure 4. Change of blockage ratio with angle.
Applsci 12 06765 g004
Figure 5. Balance structure and installation method: (a) Three-component force-measuring balance; (b) Installation of balance and wing.
Applsci 12 06765 g005
Figure 6. Membrane deformation measurement method: (a) Deformation-measurement mechanism; (b) Deformation measurement points on the membrane.
Applsci 12 06765 g006
Figure 7. Membrane deformation measured by binocular vision system: (a) Upper surface; (b) Lower surface.
Applsci 12 06765 g007
Figure 8. Typical airfoil curve and shape comparison before and after deformation: (a) Typical airfoil of near space UAV; (b) The airfoil shape before and after deformation.
Applsci 12 06765 g008
Figure 9. Deformation of 25% and 50% span section.
Applsci 12 06765 g009
Figure 10. Deformation of the upper surface (α = 4°): (a) v = 6.4 m/s; (b) v = 9.0 m/s; (c) v = 11.0 m/s.
Applsci 12 06765 g010
Figure 11. Deformation of the lower surface (α = 4°): (a) v = 6.4 m/s; (b) v = 9.0 m/s; (c) v = 11.0 m/s.
Applsci 12 06765 g011
Figure 12. Aerodynamic characteristics of wings with three different skins (v = 6.4 m/s): (a) CL-α; (b) CD-α; (c) CM-α.
Applsci 12 06765 g012
Figure 13. Aerodynamic characteristics of wings with three different skins v = 9.0 m/s: (a) CL-α; (b) CD-α; (c) CM-α.
Applsci 12 06765 g013
Figure 14. Aerodynamic characteristics of wings with three different skins v = 11.0 m/s: (a) CL-α; (b) CD-α; (c) CM-α.
Applsci 12 06765 g014
Figure 15. Fluid-structure coupling analysis framework.
Applsci 12 06765 g015
Figure 16. Structured mesh for CFD analysis.
Applsci 12 06765 g016
Figure 17. Comparison of lift coefficient curves obtained by different methods: (a) v = 6.4 m/s; (b) v = 9.0 m/s; (c) v = 11.0 m/s.
Applsci 12 06765 g017
Figure 18. Comparison of drag coefficient curves obtained by different methods: (a) v = 6.4 m/s; (b) v = 9.0 m/s; (c) v = 11.0 m/s.
Applsci 12 06765 g018
Figure 19. Comparison of pitching moment coefficient curves obtained by different methods: (a) v = 6.4 m/s; (b) v = 9.0 m/s; (c) v = 11.0 m/s.
Applsci 12 06765 g019
Figure 20. Finite element model of membrane wing.
Applsci 12 06765 g020
Figure 21. Membrane deformation calculated by finite element method: (a) Upper surface; (b) Lower surface.
Applsci 12 06765 g021
Figure 22. Numerical simulation of lift characteristics of rigid-/polyimide-skin wing: (a) v = 6.4 m/s; (b) v = 9.0 m/s; (c) v = 11.0 m/s.
Applsci 12 06765 g022
Figure 23. Variation rate of aerodynamic coefficient under different inflow velocity: (a) ΔCL/CL-α; (b) ΔCM/CM-α.
Applsci 12 06765 g023
Figure 24. Streamline of 50% span wing section (v = 6.4 m/s, α = 4°): (a) Rigid-skin wing; (b) Polyimide-skin wing.
Applsci 12 06765 g024
Figure 25. 3-D flow on the surface of polyimide-skin wing (v = 6.4 m/s, α = 4°).
Applsci 12 06765 g025
Figure 26. Spanwise and chordal prestress of membrane skin.
Applsci 12 06765 g026
Figure 27. Upper surface deformation under different prestress: (a) Ps = 0.017 MPa, Pc = 0.017 Mpa; (b) Ps = 0.017 MPa, Pc = 0.051 Mpa; (c) Ps = 0.051 MPa, Pc = 0.017 Mpa.
Applsci 12 06765 g027
Figure 28. Lower surface deformation under different prestress: (a) Ps = 0.017 MPa, Pc = 0.017 Mpa; (b) Ps = 0.017 MPa, Pc = 0.051 Mpa; (c) Ps = 0.051 MPa, Pc = 0.017 Mpa.
Applsci 12 06765 g028
Figure 29. Aerodynamic performance of wing under different prestress: (a) v = 6.4 m/s; (b) v = 9.0 m/s; (c) v = 11.0 m/s.
Applsci 12 06765 g029
Figure 30. Membrane deformation of the photovoltaic skin: (a) Upper surface; (b) Lower surface.
Applsci 12 06765 g030
Figure 31. Aerodynamic performance of two kinds of membrane-skin wing: (a) ΔCL/CL; (b) ΔCD/CD; (c) ΔCM/CM.
Applsci 12 06765 g031
Table 1. The primary aerodynamic parameters at different heights.
ParametersValue
Take-off mass (kg)35.0
Wing load (kg/m2)2.6
Cruise speed at 0 m (m/s)6.4
Cruise speed at 15,000 m (m/s)16.5
Flight latitude (°)40.0
Table 2. The equivalent mechanical properties of the membranes.
ParametersPolyimide MembranePhotovoltaic Membrane
Elastic modulus (MPa)6450320
Poisson’s ratio0.340.32
Thickness (mm)0.0120.15
Table 3. The equivalent mechanical properties of the membranes.
Numberv (m/s)ReW/S (kg/m2)
16.44.0 × 1052.6
29.05.6 × 1055.2
311.06.9 × 1057.8
Publisher’s Note: MDPI stays neutral with regard to jurisdictional claims in published maps and institutional affiliations.

