Article

Advanced Model of Spatiotemporal Mining-Induced Kinematic Excitation for Multiple-Support Bridges Based on the Regional Seismicity Characteristics

by
Paweł Boroń
*,
Joanna Maria Dulińska
and
Dorota Jasińska
Faculty of Civil Engineering, Cracow University of Technology, 31-155 Cracow, Poland
*
Author to whom correspondence should be addressed.
Appl. Sci. 2022, 12(14), 7036; https://doi.org/10.3390/app12147036
Submission received: 21 June 2022 / Revised: 8 July 2022 / Accepted: 11 July 2022 / Published: 12 July 2022
(This article belongs to the Special Issue Bridge Dynamics: Volume III)

Abstract

:
In the paper, an advanced model of spatiotemporal mining-induced kinematic excitation (SMIKE) for multiple-support bridges exposed to mining-induced seismicity is proposed. The uniqueness of this model results from the possibility of its application in any region of mining activity, as it is based on empirical regression functions characterizing such regions. In the model, the loss of coherency resulting from the scattering of waves in the heterogeneous ground, the wave-passage effect originating in different arrival times of waves to consecutive supports, and the site-response effect depending on the local soil conditions are taken into account. The loss of coherency of mining-induced seismic waves is obtained by applying a random field generator based on a spatial correlation function to produce time histories of accelerations on consecutive structure supports based on an originally recorded shock. The deterministic approach is used to account for temporal wave variability. The proposed SMIKE model is applied to assess the dynamic performance of a five-span bridge under a mining-induced shock recorded in the Upper Silesian Coal Basin (USCB), Poland. The first model’s parameter (space scale parameter) is identified on the basis of regression curves defined for the USCB region. The estimation of the second parameter (the mean apparent wave passage velocity) is based on discrete experimental data acquired via the vibroseis excitation registered in the in situ experiment. The impact of the model application on the dynamic performance of the bridge is assessed by comparing the dynamic response levels under SMIKE excitations, classic uniform excitations, and the “traveling wave” model—accounting only for the wave passage effect. The influence of wave velocity occurs to be crucial, modifying (either amplifying or reducing, depending on the location of the analyzed point) the dynamic response level up to a factor of two. The introduction of the space scale parameter changes the results by 20% in relation to the outcomes obtained for the “traveling” wave only.

1. Introduction

The issues of safeguarding people and infrastructure against vibrations are among the priority activities in the field of environmental protection. Of course, the greatest risk of surface vibrations occurs in seismically active areas; however, aseismic regions can struggle with tremors originating in mining-induced seismicity [1]. Usually, mining-induced seismicity leads to very weak shocks, but in the case of tectonic fault activation, the seismic phenomena can have the parameters of weak, shallow earthquakes, with magnitudes up to 5 degrees on the Richter’s scale [2,3]. Stronger mining-induced earthquakes often damage mining installations and surface infrastructure [4].
Reducing the environmental degradation caused by mining must be followed by the protection of civil engineering objects. Accounting for additional dynamic loads originating in mining-induced tremors may play a crucial role in the design and maintenance of structures [5,6,7] located in areas of mining activity.
Noting the growing interest in the subject, it can be concluded that most publications consider residential buildings in areas of induced seismicity. Considerably fewer authors deal with non-typical constructions, such as large-dimensional structures with lengths comparable to those of shock waves. In the case of the dynamic analysis of such structures, the spatial variability of earthquake ground motions (SVEGM) [8] should be taken into account, as spatially varying ground motion, in terms of both amplitude and frequency, may play a key role in their dynamic performance. In the case of multiple-support structures, the SVEGM effect causes each of the supports to be subject to a different movement at a given time instance [9]. The authors of dynamic analyzes usually assume that the movement of the structure supports is the same. However, in the case of multi-support constructions, a simplification such as the omission of the space–time complexity of the excitation may lead to inaccurate approximations and even errors, including non-conservative results that do not ensure the safety of the structure [10,11].
The vast majority of multiple-support structures studies refer to a bridge’s response to natural seismic shocks [12,13,14,15,16,17,18]. The authors listed the following four reasons for the spatial variability of earthquake ground motion that are taken into consideration during dynamic analyses: wave passage, incoherence, attenuation, and the site effect. They presume models of kinematic excitation that include all or some of the above-mentioned effects. Usually, taking into account the SVEGM effect leads to a dynamic response level decrease, as the average ground motion amplitudes affecting the structure’s supports are reduced. However, the pseudo-static effects that result from ground deformation may increase the dynamic response level of the whole structure or in some structural parts of an object [9,19,20]. Unfortunately, the above-mentioned research concerns natural seismicity and does not take into account the differences between the excitation caused by an earthquake and by a mining shock.
Mining-induced tremors have a local, lower range in comparison to shocks caused by earthquakes. For such shocks, the spatial variation of kinematic excitations can meaningfully impact the dynamic response of long bridges. Therefore, there is a need to introduce models of spatially-varying kinematic excitation and dedicated mining-induced seismicity. Since mining regions differ in geological structure, which results in differences in parameters, such as energy, frequency contents, and the lengths of shocks, the proposed models should take into account the local characteristics and geological conditions of the regions.
Two main objectives of the paper can be listed. The first goal is to propose an advanced model of Spatiotemporal Mining-Induced Kinematic Excitation (SMIKE), dedicated to multiple-support structures, especially long bridges, located in regions of mining-induced seismicity. The model can be implemented and tailored for different mining activity areas since it is based on empirical regional seismicity characteristics. The second objective is the assessment of the impact of the SMIKE model on the dynamic performance of a long structure under a mining-induced shock in comparison with the classical uniform excitation approach.
Mining regions are generally heavily industrialized with highly developed road infrastructure. Long, multi-span bridges, an integral part of this infrastructure, are particularly prone to the consequences of nonuniformity of excitation. The application of the proposed model of kinematic excitation can be extended to other multispan structures such as, for example, pipelines [21], pantograph-catenary systems [22], and the power transmission line [23].
The decision of whether nonuniform or classic uniform kinematic excitation models should be used to obtain a conservative assessment of the dynamic behavior of long bridges under mining-induced tremors must be based on methodical investigations. The problem of the different slenderness of various bridge spans can impact this choice, yet this aspect, to the best of the authors’ knowledge, has not been raised in the literature. Thus, the numerical investigations of this work are focused on the implementation of the SMIKE model in the analysis of the dynamic performance of such a bridge.
The novelty of this research lies in proposing the spatiotemporal mining-induced kinematic excitation (SMIKE) model based on regional seismicity characteristics and therefore suitable for different mining regions, followed by the application of the model to comprehensive research on the dynamic performance of a bridge with spans of different slenderness exposed to a mining-induced shock. The analyzed bridge is located in Chrzanów, Southern Poland, in a mining activity region.
The structure of the paper is as follows. Section 2 covers the description of the proposed excitation model, the description of structural design and numerical model of an analyzed bridge, and the theoretical background and experimental set-up for apparent wave velocity estimation. Section 3 shows the results of experimental and numerical evaluation of natural frequencies, and modes of vibration of the bridge, the determination of parameters of the SMIKE model and the resultant data of the spatially varying mining-induced kinematic excitation. Section 4 and Section 5 contain the discussion on the results and the final conclusions, respectively.

2. Materials and Methods

2.1. Excitation Modelling

Section 2.1 presents the description of the proposed spatiotemporal mining-induced kinematic excitation model. It contains the theoretical background for the dynamic behavior of multiple-support structures under spatially varying ground motion, the conditional random field simulation of ground motions, and the empirical regression relationship of amplitude decay with an epicentral distance used in the excitation model.

2.1.1. Theoretical Background for Dynamic Behaviour of Multiple-Support Structures under Spatially Varying Ground Motion

The equations of motion, characterizing the dynamic performance of a multi-degree-of-freedom system caused by ground vibrations, can be formulated as follows [8,24]:
M s s M s g M g s M g g · x ¨ s x ¨ g + C s s C s g C g s C g g · x ˙ s x ˙ g + K s s K s g K g s K g g · x s x g = 0 F g
where: s, g—degrees of freedom of structure and ground, respectively, M , C , K , mass, damping and stiffness matrices, x ¨ s ,   x ˙ s , x s , vectors of accelerations, velocities, and displacements for each DOF of the structure, x ¨ g , x ˙ g , x g , vectors of accelerations, velocities, and displacements for each DOF of the ground, F g , reaction vector.
The vector of total nodal displacements (x) consists of dynamic ( x d ) and quasi-static ( x q ) parts:
x = x s d 0 + x s q x g s
where:
  • x s d —sub-vector of dynamic nodal displacement of a structure,
  • x s q —sub-vector of quasi-static nodal displacement of a structure,
  • x g s —sub-vector of quasi-static nodal displacement of the ground.
It must be emphasized that the dynamic contribution of the soil is neglected in expression (2). This simplification is commonly used by authors; however, there are works concerning the non-synchronous excitation of bridges in which the dynamic effects of the soil–structure interaction are taken into account [25].
In the case of the static behavior of a structure, i.e., under the assumption that the ground displacements are applied infinitely slowly, the mass and damping matrices in Equation (1) and the dynamic component of motion in expression (2) disappear, which leads to the quasi-static displacements determination
x s q = K s s 1 · K s g · x g .
Substituting Equations (2) and (3) to Formula (1) leads to the following equation:
M s s · x ¨ s d + C s s · x ˙ s d + K s s · x s d = ( M s s · K s s 1 · K s g M s g ) · x ¨ g ( C s s · K s s 1 · K s g C s g ) · x ˙ g
Eurocode 8 [26] allows for the omission of the second component of the right-hand side of Equation (4) as being significantly smaller than the first one, resulting in the following equation of motion of a structure under kinematic excitation:
M s s · x ¨ s d + C s s · x ˙ s d + K s s · x s d = ( M s s · K s s 1 · K s g + M s g ) · x ¨ g
It is clearly visible from Equations (2) and (5) that the total displacements of the structure depend on the ground acceleration vector ( x ¨ g ), containing accelerations attributed to the structure’s supports.
In the case of dynamic analyzes of multi-support structures, ground movement at all support points must be taken into account. Since ground accelerations (or velocities) are usually registered by the seismological station at only one point, a model of kinematic excitation, which takes into account the spatial variability of ground movements during a quake, should be introduced to determine the motion of different structure’s supports. In this paper, the authors recommend a new advanced model of kinematic excitations resulting from mining tremors.

2.1.2. Conditional Random Field Simulation of Ground Motions for Multiple-Support Structures

In this paper, the method of conditional stochastic simulation of ground motions using the spatiotemporal correlation function proposed in [27,28,29] was applied to generate the unknown acceleration time histories at consecutive supports of a multi-support structure. The above-mentioned papers present an effective method of conditional simulation of the space–variation of ground motion. This approach is formulated under the assumption of linear soil and structural behavior. The frequency dependence of the spatial correlation function is simplified so that only the correlation of the predominant frequency of the quake is accounted for and that the simulation can be easily performed.
The algorithm, given in [30], allows for the generation of a signal at a point located a certain distance from the registration place, based on the actual event recording and the adopted velocity and correlation function. The spatial correlation function of the field, defined as the correlation between the values of the field at different points (i, j), takes the form:
K D i j = σ 2 e ω d · D i j 2 π v α
where:
  • Dij—separation distance between two field points (i, j),
  • ωd—predominant frequency of the shock,
  • v—wave velocity,
  • α—space scale parameter (α > 0), depending on local geological conditions,
  • σ—standard deviation of the recorded shock.
For two points the spatial correlation function can be written in a matrix form:
K = K 11 K 12 K 21 K 22
In order to create a random signal at point j ( x u ), based on the registered (original) signal at point i ( x k ), the following procedure was adopted:
x u s = a m a x + 2 a m a x · r d   ,         s = 1 , , n
where:
  • a m a x maximum ground acceleration of the original record,
  • r d   —uniform random variable from a range <0, 1>.
Under the assumption that the shock records satisfy a zero-mean Gaussian distribution, the formula for the conditional probability density of symmetrically truncated Gaussian distribution of the generated signal could be formulated as:
f x u | x k = 1 l 1 2 d e t K c 1 2 · 2 π 1 2 · e x p ( 1 2 1 l x u m c T K c 1 x u m c )  
where:
  • x u —vector of unknown values (generated signal),
  • x k —vector of known values (registered signal),
  • K c = K 11 K 12 K 22 1 · K 21 —conditional covariance matrix of the random field,
  • m c = K 12 K 22 1 x k —vector of conditional mean values.
  • l —truncation parameter, depending on the ratio a m a x σ . If this ratio reaches 4.0 for a given signal, the truncation can be disregarded ( l = 0 ) . This condition is usually met in case of mining tremors, where the intensive shock phase is relatively short.
The newly created vector ( x u ) can be accepted only if it satisfies the condition of von Neumann elimination:
R f x u | x k
where:
R = d e t K c 1 2 · 2 π 1 2 · r d
If the condition was not met, another vector of unknown values (8) was generated, and the steps described by Formulas (9)–(11) were repeated.
Applying this procedure requires the assumption of two parameters characterizing the geological and soil conditions: wave velocity and space scale parameter. Jankowski, in numerical examples [28,29,30,31], proposes values of scale parameters for earthquakes from α = 1 , to α = 100 and concludes that “in practice, the appropriate value of scale parameter should be obtained experimentally based on the geological and topographical properties of the analyzed field”.
The presented algorithm requires the specification of the direction of the seismic wave propagation, which is reasonable for multiple-support line-like structures (e.g., bridges or pipelines) but may be questionable for other large structures, such as dams, buildings, or tanks. To deal with such cases, Jankowski [31] proposed the method’s modification based on the spatiotemporal correlation function,
K D i j , t i j = σ 2 e ω d · D i j 2 π v α e β t i j
which allows for the generation of random fields of ground motion both in space and in time, based on the quake record in one location. However, this approach requires the identification of the additional field parameter—time correlation parameter (β)—describing the degree of time correlation of the field.

2.1.3. The Proposed Spatiotemporal Mining-Induced Kinematic Excitation (SMIKE) Model

The main objective of this work was to propose a new model of kinematic excitation for multiple-support structures located in areas of mining activity and exposed to mining-triggered seismicity. The proposed model of nonuniformity of ground motion takes into account three distinct reasons for spatial variability, namely:
  • The loss of coherency resulting from scattering of waves in the heterogeneous ground and their superpositioning;
  • The wave-passage effect resulting from the difference in the arrival times of waves at different supports;
  • The site-response effect that takes into account the local soil conditions.
The loss of coherency of mining-induced seismic waves was obtained by applying the random field generator based on the spatial correlation function (see Section 2.1.2) to produce the time histories of accelerations on consecutive structure supports based on the originally recorded shock.
The proposed SMIKE model has two parameters: the space scale parameter α and the apparent wave velocity in the ground v. The random field generator requires the assumption of space scale parameter α. To determine this parameter (depending on local geological conditions), it was assumed that the empirical regression functions proposed for the local mining regions (see Section 2.1.4), which describe the reduction in the maximal amplitude with the distance from the epicenter, also define the loss in wave coherency. Hence, the space scale parameter can be determined by fitting the spatial correlation curve (see Equation (6)) into the regression function defined for a given mining activity region. The regression functions for different mining areas across the world are delivered by seismologists on the basis of continuous monitoring [32,33,34].
The deterministic approach was applied to account for temporal wave variability (wave passage effect). The records obtained for the consecutive supports were shifted in time by the value needed for the wave front, moving with the experimentally determined apparent wave velocity, to travel the distance between supports. This strategy needs the experimentally obtained apparent wave velocity v and avoids the necessity of identifying the time correlation parameter necessary to define the spatiotemporal correlation function (see Equation (12)). In the literature, this parameter is assumed rather freely and ranges from 1 to 200 [29,30,31].

2.1.4. Empirical Regression Relationship of Amplitude Decay with a Distance from the Epicenter for Space Scale Parameter Estimation

The space scale parameter α is one of the main parameters of the proposed SMIKE model. Since the patterns for seismic wave propagation for mining quakes depend highly on local geological conditions, the physico-mechanical properties of the soil, and the terrain type, this parameter should be estimated for particular areas of mining activity.
In Poland, regions of mining-triggered seismicity are continuously monitored, and the parameters of tremors, such as accelerations or velocities of the ground, are recorded continuously [35,36,37,38,39]. Investigations related to the reconstruction of ground vibration acceleration fields on the basis of point recordings are the subject of seismologists’ research in mining-triggered areas. The registrations of accelerations or velocities at seismic stations are used to create regression relationships that enable the prediction of the level of ground vibrations at different locations in mining regions.
One of the most seismically active regions of Poland is the Upper Silesian Coal Basin (USCB), in which the threat of mining seismicity and the intensity of tremors have recently increased [40]. In this region, the Upper Silesian Regional Seismological Network, installed in 1974, records all seismic events with local magnitude. Based on thousands of recordings, the empirical formulas for tremor peak accelerations have been proposed for strong seismic events [41]:
  • The relation between the peak epicentral acceleration a 0 and the seismic energy within the range 2 10 5 E 10 9   J   for tremors of local magnitude 1.8 M L 4
    a 0 = 1.33 10 3 l o g E 2.66 0.089
    where: a 0 and E are expressed in [m/s2] and [J], respectively.
  • The function describing the decrease in bedrock peak acceleration a R outside the epicentral zone (which is assumed to be 1 km in radius) for tremors of local magnitude 1.8 M L 3 with increasing epicentral distance (up to 10 km)
    a R = a 0 H R
    where: H R = 1.53 R 0.155 e 0.65 R + 0.014   R = r 2 + 0.5 2 , r is the epicentral distance in [km], and 0.5 km is the mean depth of tremors in the USCB.
The effects of subsurface soil layers on the value of ground accelerations depend on the layer thickness, type, shock energy, and seismic wave frequency. The maximal surface acceleration a s R is obtained by multiplying the bedrock acceleration by the amplification factor w a
a s R = a R w a
The values of the amplification factor for the USCB range from 0.5 to 4.5. Exemplary values are collated in Table 1 [41].
As one can see, the local site conditions play a crucial role in amplifying the bedrock accelerations, and the amplifying factor should be determined based on local data.

2.1.5. The Mining-Induced Shock Registered in the Upper Silesian Coal Basin

In this work, a mining tremor recorded by a seismic station located in the USCB was used [6] as a kinematic excitation. The duration of the intense vibration phase was about 3.5 s. The energy of the shock was 1.107 J, which puts it in the high-energy event category. The maximum PGA level of the acceleration reached 0.35 and 0.28 m/s2 for the west-east (WE) and the north-south (NS) directions, respectively. Hence, the maximum value of the resultant PGAH10 horizontal acceleration was 0.46 m/s2. The maximum vertical accelerations (Z) were relatively small and did not exceed 0.12 m/s2. The spectral analysis of the shock revealed that the main frequencies fall into the range of 2.4–4.0 Hz, with the dominant frequency of 3.516 Hz. As discussed (see Section 2.1.4), the maximal surface acceleration in different areas of the USCB depends on local geological conditions. The analyzed bridge is located close to the Libiąż mining area, in which several strong shocks with energies about 109 J and epicentral amplitudes PGAH10 1.4–1.7 m/s2 have lately been registered [42]. Thus, the shock amplitudes of the analyzed shock have been scaled to PGAH10 = 1.5 m/s2. Figure 1 shows the time histories of shock accelerations in three directions.

2.2. Modelling of the Structure and Experimental Set-Up

Section 2.2 presents the structural design and numerical model of the analyzed bridge as well as the theoretical background and experimental set-up for the apparent wave velocity estimation, which is a necessary parameter of the SMIKE model.

2.2.1. Structural Design and Numerical Model of Analyzed Bridge

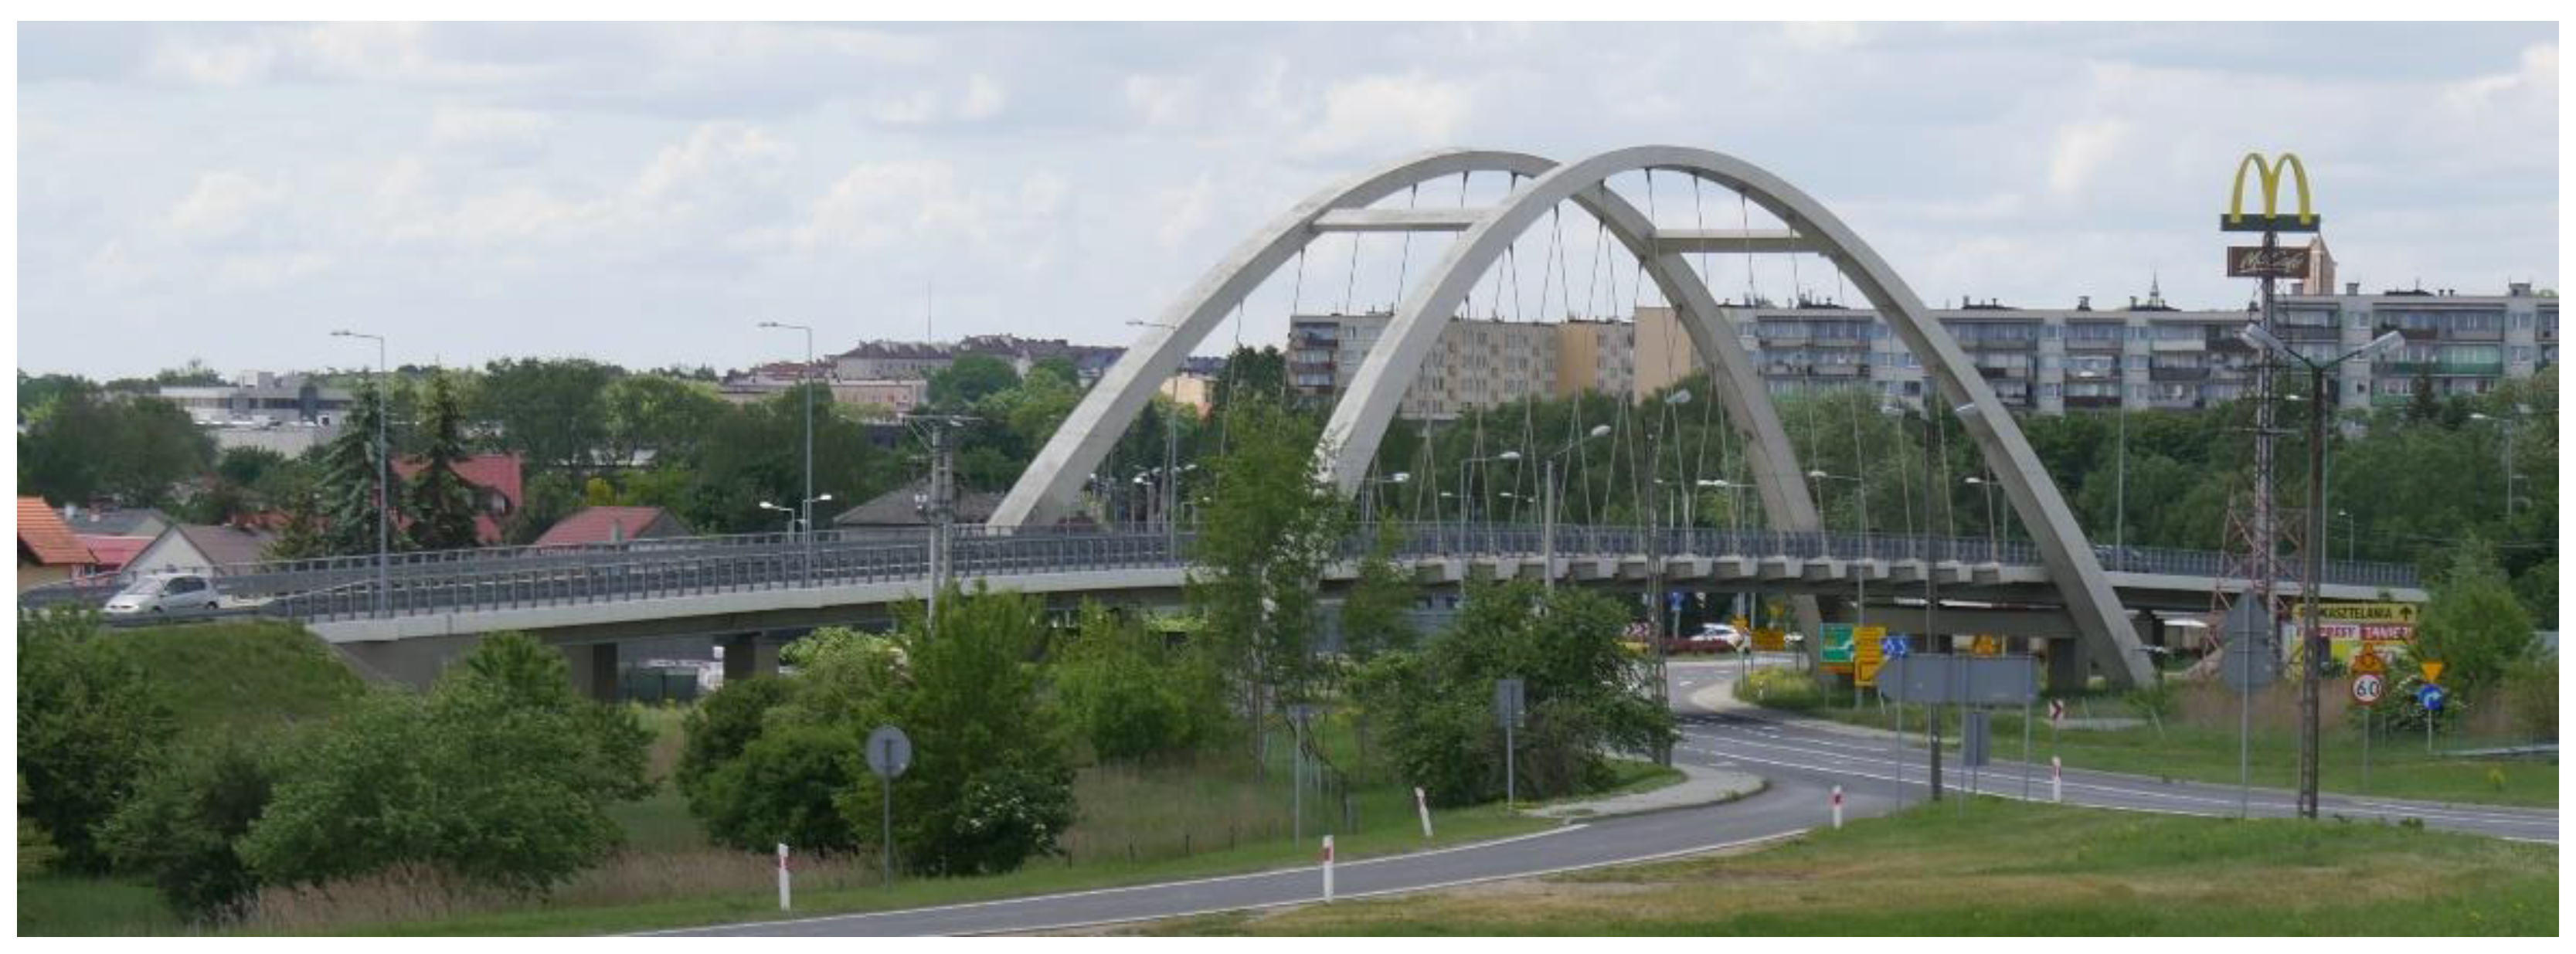
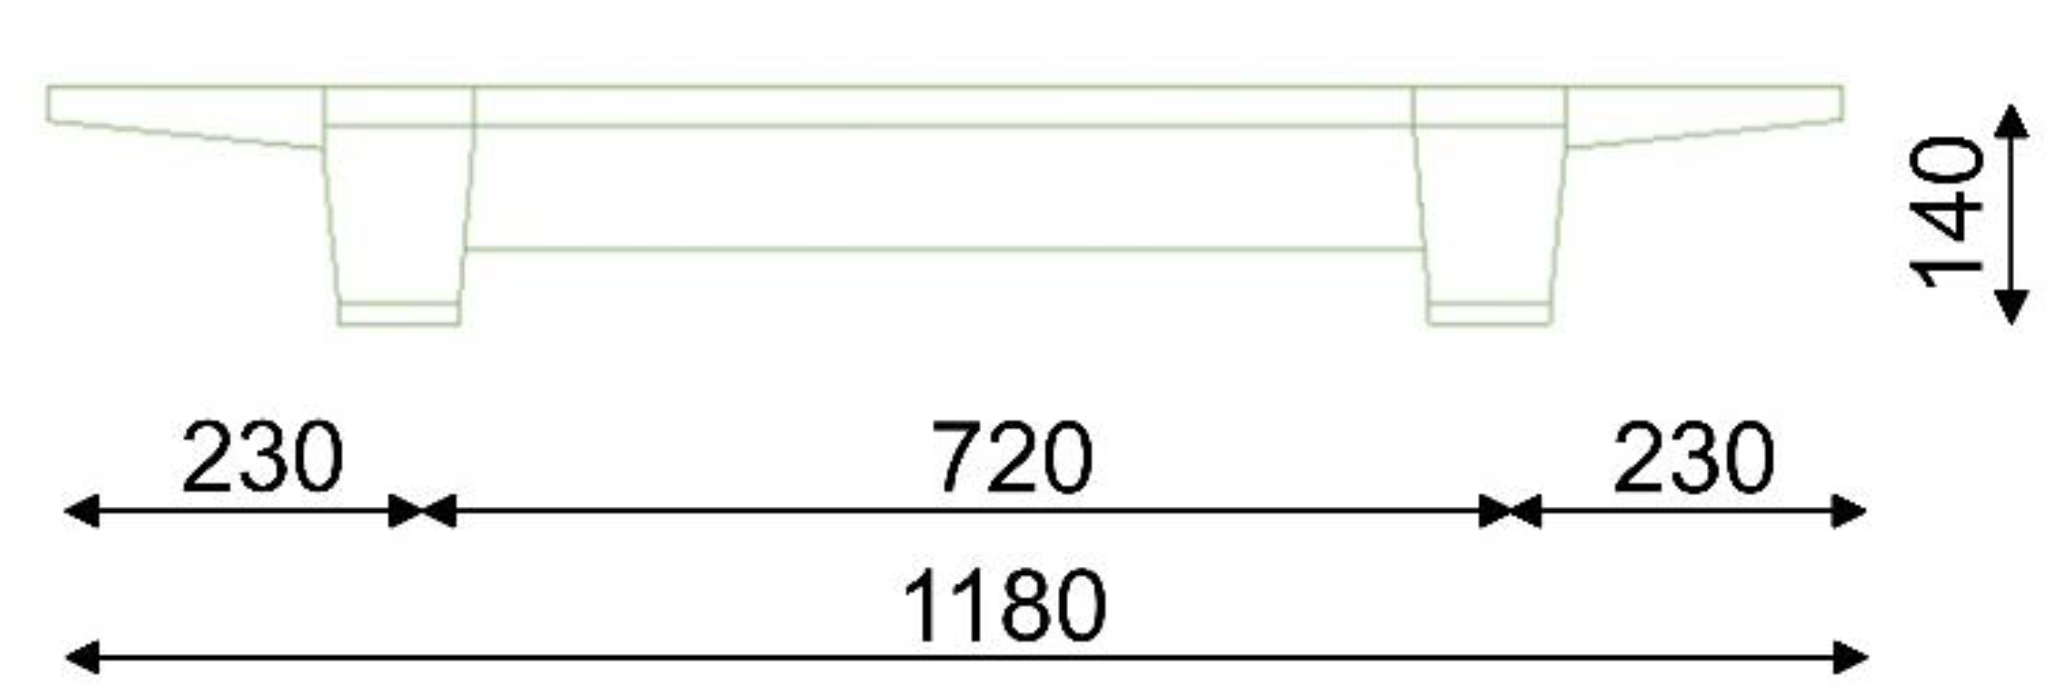
To present the application of the proposed model of mining-induced kinematic excitation, a five-span bridge (160 m long) was taken into consideration as a multiple-support structure. The analyzed bridge (Figure 2), erected in 2013, is located in Chrzanów, Southern Poland, on the border of the USCB mining activity region. The bridge under consideration has five spans. Two continuous girders integrated with the concrete slab form the bridge’s primary structural system. The girder beams are prestressed by steel tendons. Additionally, the central (longest) span is suspended on two arches. The geometry of the bridge is presented in Figure 3 and Figure 4. The girders rest on abutments and intermediate pillars, supported by a system of pot bearings. A set of fixed and transversally guided sliding bearings is used over the piers P3 (see Figure 3), whereas multidirectional and longitudinally guided sliding bearings are applied at other supports (abutments and piers).
Structural elements’ material specification is as follows: concrete classes C50/60 (arches), C40/50 (girders), C30/37 (pillars, abutments), and steel grades S460 (hangers), Y1860 (prestressing tendons).
The finite element analysis of the bridge was performed in Abaqus FEA [43]. Most of the structural components of the bridge (girders, crossbars, pillars, archers) were modeled with brick elements. Continuum shell elements were used for the slab and truss elements for the hangers. To model the bearing behavior, connector elements allowing for different sliding directions were used. To account for the girders’ precompression, their Young’s modulus was determined as the weighted average, proportionally to the steel and concrete volume fraction [44].

2.2.2. Theoretical Background and Experimental Set-Up for Apparent Wave Velocity Estimation

The apparent wave velocity v is the second parameter of the proposed SMIKE model. It reflects the speed of the wave passage under a multiple-support structure. The wave passage induces non-uniform movements of the structure’s supports, which cause additional stresses in a structure. The stiffer the structure’s subsoil, the higher the apparent wave velocity.
The apparent wave velocity can be determined based on the cross-correlation function Ψ τ of signals x(t) and y(t) registered at two different points located in the direction of wave propagation [45,46]:
Ψ τ = m a x τ T / 2 T / 2 x t y t + τ d t
The cross-correlation function (16) reaches the maximum value for so-called time delay, i.e., the time it takes for a wave to pass between two points. Knowing the distance between the two points at which the signals were registered dL, and the time delay, one can determine the apparent wave velocity:
v = d L τ
Since the time delay τ is the real-time of the wave passage, the signals x(t) and y(t + τ) most closely resemble each other in the time domain. It is worth noting that the apparent wave velocity characterizes the average velocity of the entire signal, which is a superposition of wave components of different frequencies. Determining the velocity for a wave single frequency component requires determining the time delay based on the cross-correlation of the signals filtered using a bandpass filter for a given frequency.
Another way that the estimation of the wave velocity component of a given circular frequency ω   is based on the phase characteristics of the signal [47,48]. In this method, the time delay can be determined using the phase angle ϕ ω of the Cross-Spectral Density (CSD) function:
ϕ ω = a r c t a n I m   Θ x y ω R e   Θ x y ω
where Θ x y ω = + Ψ τ · e j · ω · τ d τ = Θ · e j · ϕ ω is the CSD function expressed in polar form.
The phase angle takes values from −π to π, which results in the function discontinuity occurring in the course of the phase [49]. To eliminate this phenomenon, the signal phase unwrapping procedure is used [50].
The dependence of the time delay of the wave component with fixed frequency f 0 on the phase angle is given by the formula:
τ = ϕ f 0 2 · π · f 0
In order to account for the local soil conditions, the in situ experiment was carried out by the authors of this study. In the experiment, ground accelerations induced by a wave generator were recorded at points of the field located along the direction of wave propagation to determine the apparent wave velocity.
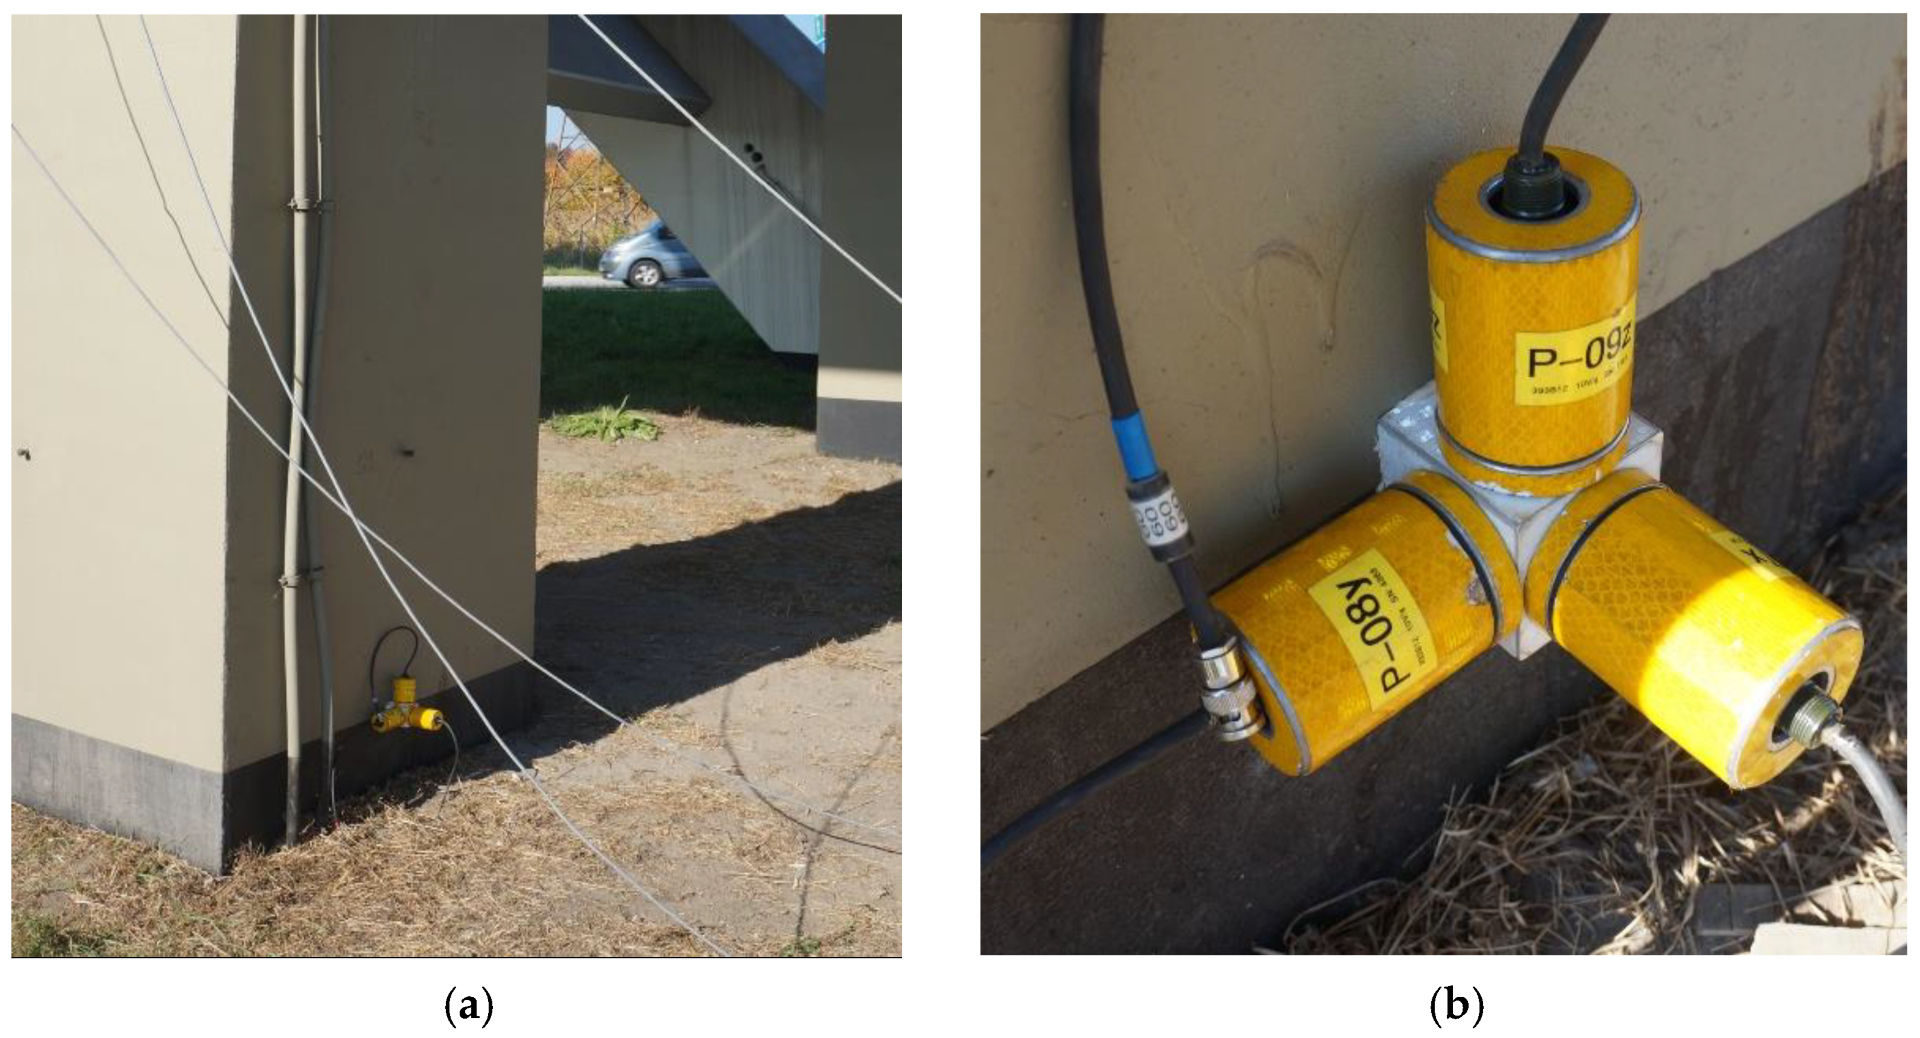
The following experimental set-up for apparent wave velocity estimation was implemented for the in situ tests. The vibroseis MARK IV was used as a vibration source. As a result of the vertical movements of a piston, the vibroseis can generate surface waves within the frequency range of 8–100 Hz. It was located under the first span of the bridge, directly at the abutment (Figure 5). Triple-axis accelerometer sets were located on the subsequent piers of the bridge (see points P1, P2, P3, and P4 in Figure 3), just above the ground level (Figure 6). The distance between the generator and the first accelerometer set was 12.5 m. The distances between consecutive measurement points were 23 m (P1–P2), 80 m (P2–P3), and 23 m (P3–P4), respectively.

3. Results

3.1. Experimental and Numerical Evaluation of Natural Frequencies and Modes of Vibration of the Bridge

The experimental and numerical evaluation of the dynamic characteristics of the bridge were presented in detail in the previous authors’ work [51]. The locations of the measurement points on the half of the bridge are presented in Figure 7. Each point was equipped with three-axial piezoelectric accelerometers of a frequency range from 0.1 to 2000 Hz.
The most important methods used in this work to solve and verify the eigenproblem are presented below.
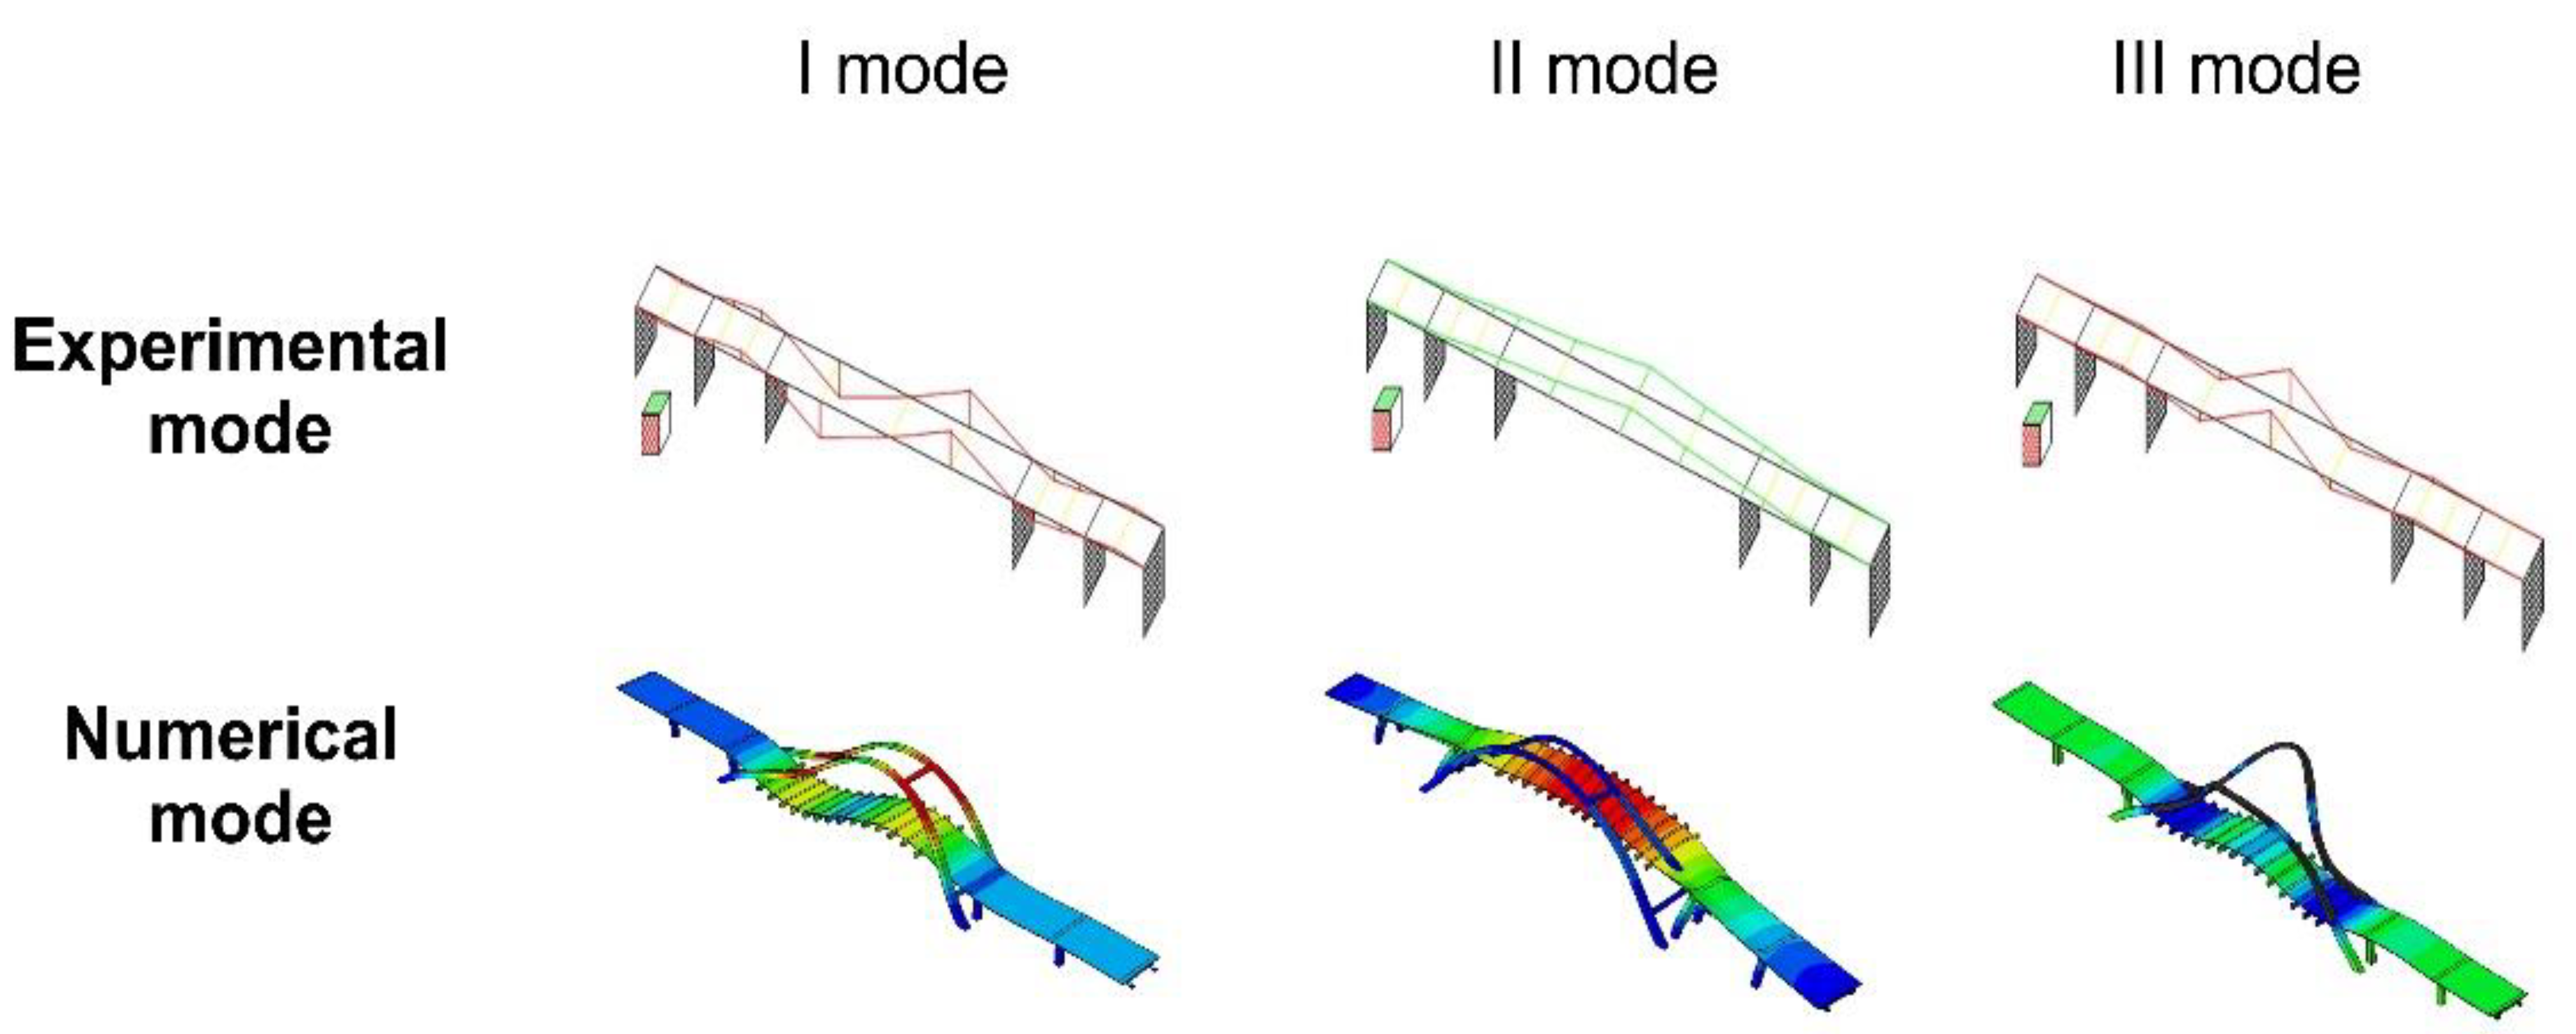
Firstly, the preliminary analysis of the FE model of the bridge was carried out, and the natural frequencies and modes of vibration were obtained numerically. The eigenvalues determination was limited to 15 Hz and covered four frequencies and modes of vibration since higher mode shapes were very complex, concurrently exhibiting both bending and torsional features. This fact resulted from the structural complexity of the bridge, with the longest span suspended by hangers to the arch (see Figure 2). Secondly, the experimental modal analysis of the bridge was conducted using the Operational Modal Analysis (OMA) techniques [52] and the Subspace Identification (SSI) algorithm [53,54,55] to estimate the natural frequencies of the bridge. The OMA and the SSI techniques served to assess the eigenfrequencies on the basis of the output data of the bridge’s response to road traffic only [56]. Then, the Time Domain Decomposition (TDD) method [56,57] was implemented to determine modes of vibration corresponding to the estimated frequencies. Finally, verification with the Modal Assurance Criterion (MAC) [58] proved the high degree of consistency between the modes obtained numerically and experimentally.
The natural frequencies determined numerically and experimentally are compared in Table 2. The basic three modes of vibration are presented in Figure 8.
For such a level of structural complexity, the similarity between numerical and experimental results may be considered reasonable since the differences are lower than 7% [59], with the exception of the second natural frequency accompanying the transverse eigenform. The reason for the discrepancy in this direction far above the limit lies in the FE model, with assumed frictionless sliding in bearings. Such a simplification is not appropriate since, due to the very low level of ambient vibration used with the OMA techniques, sliding in the pot bearings was prevented by frictional forces. However, as it was proved in the work [51], tuning the FE model is not required in case of excitation by a strong mining tremor, which is strong enough to defeat frictional forces in the bearings immediately; thus, the numerically obtained dynamic performance of the structure is not affected by the assumption of frictionless sliding at bearings.

3.2. Experimental Evaluation of Damping Properties of the Bridge

Again, the experimental evaluation of the damping properties of the bridge was presented in detail in the work [51]. The estimation was based on the discrete experimental data acquired during a jumping test. The plots, obtained for the free decay of the recorded time-acceleration functions for all measurement points, served for the logarithmic damping decrements evaluation [24]. The values of logarithmic decrements of damping, determined for the frequencies corresponding to the first and the second vertical mode shapes, were δ1 = 0.13 and δ2 = 0.17, respectively. The Rayleigh model of mass and stiffness proportional damping was used for the numerical simulations [24]. Based on the obtained damping ratios, the coefficients of the Rayleigh damping model were estimated as 0.21 for the mass and 0.00208 for the stiffness proportional damping.

3.3. Determination of Parameters of the SMIKE Model Used for the Dynamic Analyses

3.3.1. Experimental Evaluation of Wave Propagation Velocity

The estimation of the wave passage velocity was based on the discrete experimental data acquired via the vibroseis excitation in situ test (see Section 2.2.2). The cross-correlation function and phase angle characteristics of the registered signals were used to determine the wave velocity. Five series of excitations in the form of linear sweeps with a variable frequency range were conducted. The characteristics of each excitation series are summarized in Table 3. The duration of each series was 60 s. Due to the short distance between the vibroseis and the abutment, the exciting force was limited to 60 kN (30% of the maximum generator power). In the fifth series, the excitation force was increased to 100 kN.
Firstly, the cross-correlation functions of the registered signals were used to determine the apparent wave velocity. The signals registered on piers P1, P2, and P3 (see Figure 3) were pairwise compared. Due to the large distance from the source of vibrations to pier P4, the signals recorded at this measurement point turned out to be disturbed by high background noise. For this reason, the signals from P4 were no longer considered.
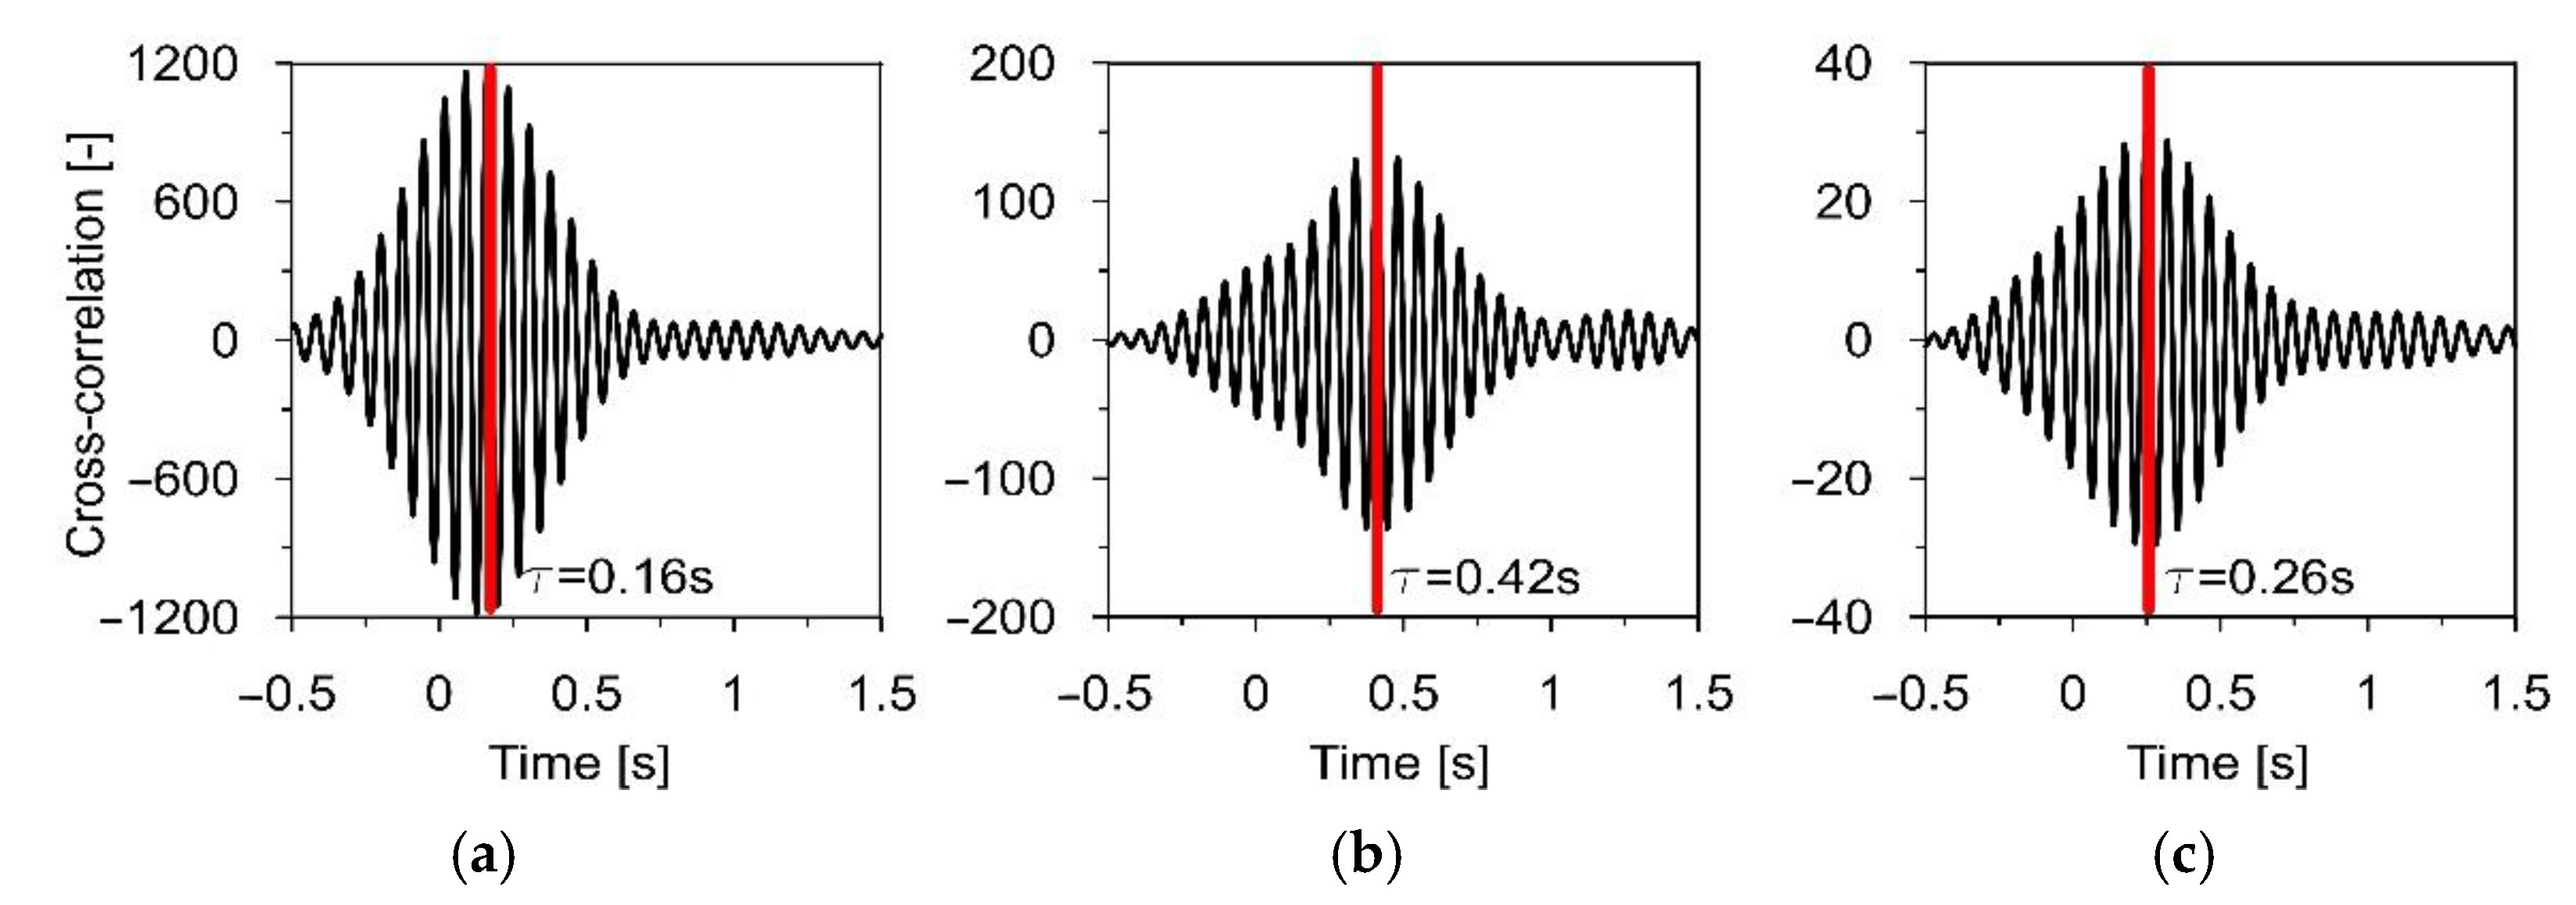
To obtain the wave velocities for different excitation frequencies, the signals recorded in measurement points were modified by narrow-pass filters with frequencies 10, 12, 14, and 16 Hz. Then, the cross-correlation functions of the signals were calculated for the following point pairs: P1–P2, P1–P3, and P2–P3. Examples of signals of frequency 14 Hz and their cross-correlation functions are presented in Figure 9 and Figure 10, respectively. On the basis of the location of each cross-correlation function maximum, the time delay was defined for the extracted frequency range.
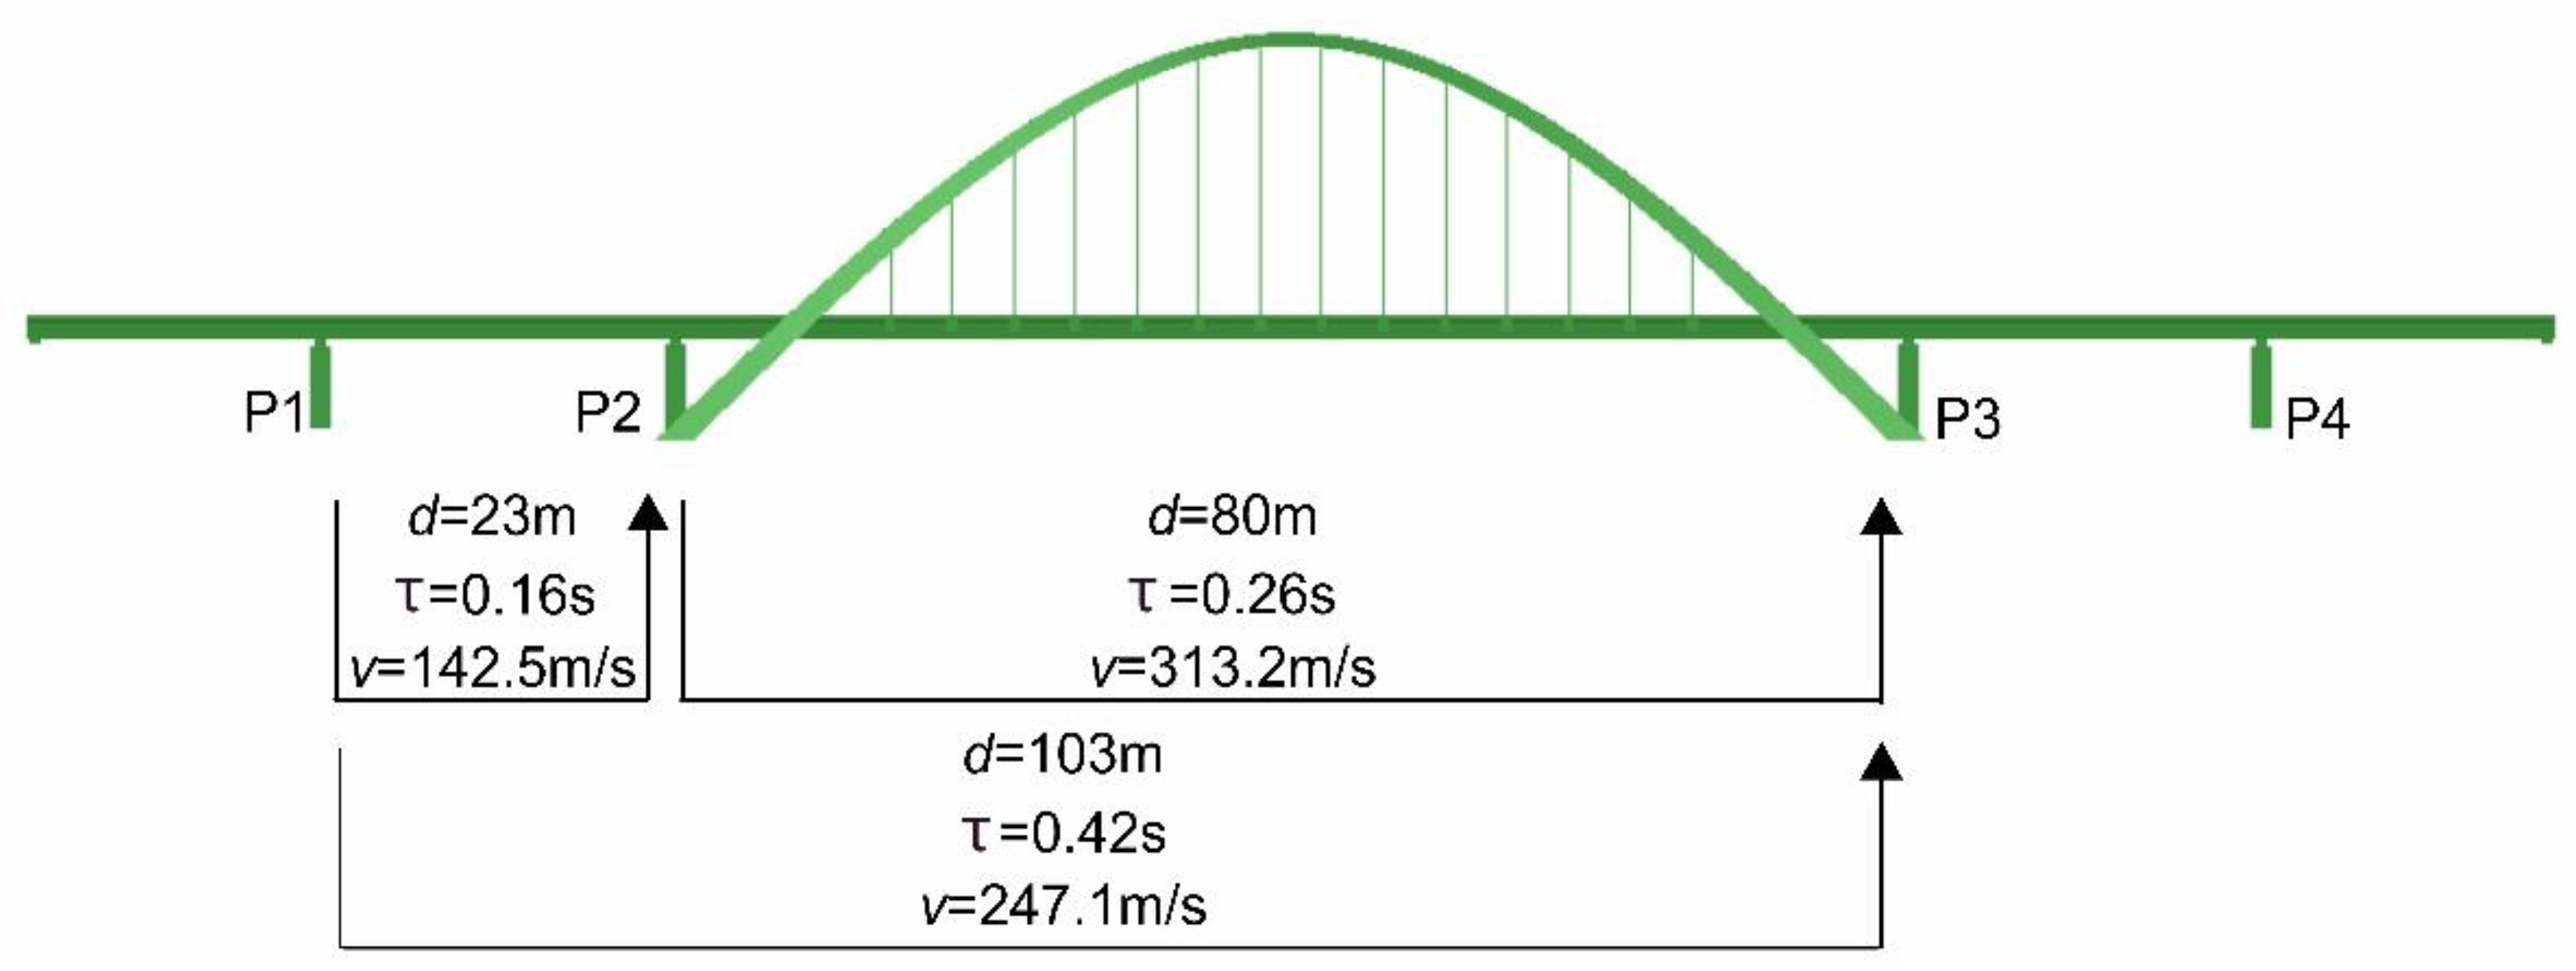
As can be seen in Figure 10, the cross-correlation functions for the signal component frequency of 14 Hz reach the maximum values at 0.16, 0.42, and 0.26 sec for the pair P1–P2, P1–P3, and P2–P3, respectively. Since the registered accelerations are shifted in time by the value needed for the wave front to cover the distance between the piers, the time shifts can be used to determine the apparent wave velocities between particular piers. For the known distances between piers, i.e., 23 m between P1 and P2, 103 m between P1 and P3, and 80 m between P2 and P3, the calculated wave velocities are 135, 254, and 344 m/s for the above-mentioned pairs, respectively.
The mean wave velocities between particular piers (averaged over five series) are summarized in Table 4 for different frequencies. Additionally, in the last row of Table 4, the mean apparent wave velocities between support pairs (averaged over different frequencies) are presented.
Analyzing Table 4, one can notice that the wave velocities between the particular piers are different. This phenomenon, portrayed in Figure 11, is caused by inhomogeneous soil conditions. The lowest wave velocity was obtained for the layers of natural soil (sand and clay) lying between the piers P1 and P2. Much higher wave velocity was determined between the piers P2 and P3, where the road with the stiff foundation layers runs. Obviously, the value obtained between supports P1 and P3 lies in between the previously mentioned velocities.
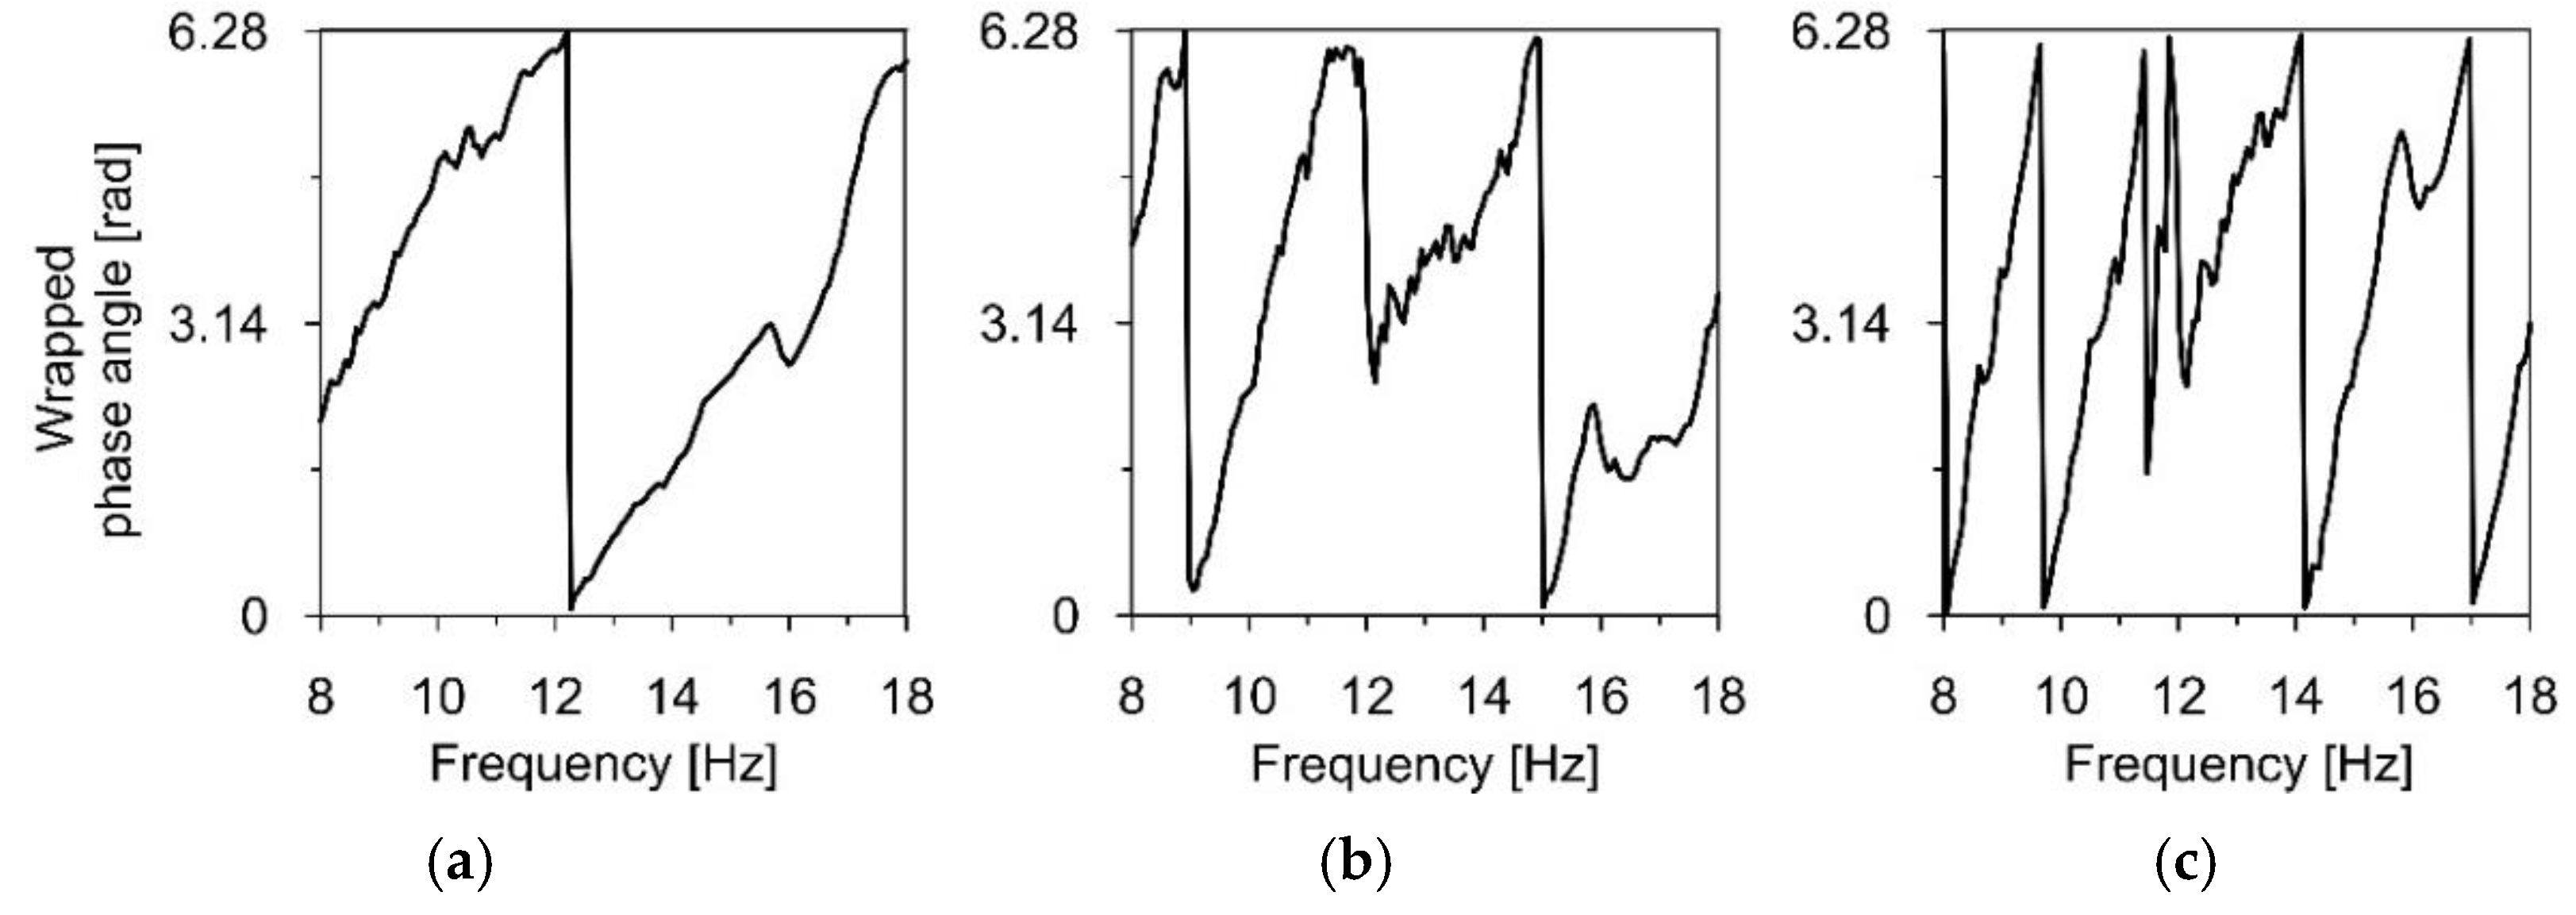
For comparative purposes, the phase angle of the CSD function of the signals registered for pairs of measurement points, such as P1–P2, P1–P3, and P2–P3, were also used to determine the wave velocity (see Section 2.2.2). The representative phase angle as a function of frequency for the signal pairs is presented in Figure 12 and Figure 13, in wrapped and unwrapped form, respectively.
Based on the phase angle function, the time delay of the wave was determined for the support pairs (see Equation (19)) and the selected frequencies. As previously mentioned, the mean wave velocities between the particular piers (averaged over five series) and the mean apparent wave velocities between support pairs (averaged over different frequencies) are presented (Table 5).
The discrepancies between the wave velocities obtained with both methods, presented in Table 6, do not exceed 6%.
Based on the analyses of experimentally determined wave velocities, it was decided to use the mean apparent wave velocity of 240 m/s (obtained for the support pair P1–P3) as a parameter of the proposed spatiotemporal model of mining-induced kinematic excitation.

3.3.2. Determination of the Space Scale Parameter for Conditional Random Field Simulation of Ground Motions Based on the USCB Regression Function

Determining the spatial correlation function (see Equation (6)) between two field points requires an assumption of the space-scale parameter, which, according to the author of the method, should be obtained experimentally for each analyzed field (see Section 2.1.2). For the purpose of this study, the space field parameter α is determined based on the empirical amplitude regression curve employed in the USCB region (see Section 2.1.4). It is assumed that the curve describing the decay of maximal amplitude with the epicentral distance also characterizes the loss of wave coherency, and the correlation function (6) decreases according to the same formula.
Since the USCB regression function, defined based on tremors registered in the coal mines, describes the bedrock (hard rock) acceleration amplitudes, the wave velocity was assumed as v = 1000   m / s , which is the typical wave velocity in hard rock.
Fitting the distance ( D i j )-dependent part of the correlation function (6) e ω d · D ij 2 π v α with an assumed velocity of v = 1000   m / s   for the shock with dominant angular frequency ω d = 3 . 516 2 π = 22.1   rad / s into the empirical decay function (14) gives the value of space-scale parameter α = 7.08 ~ 7 for the USCB region.

3.4. Resultant Data of the Spatially Varying Mining-Induced Kinematic Excitation

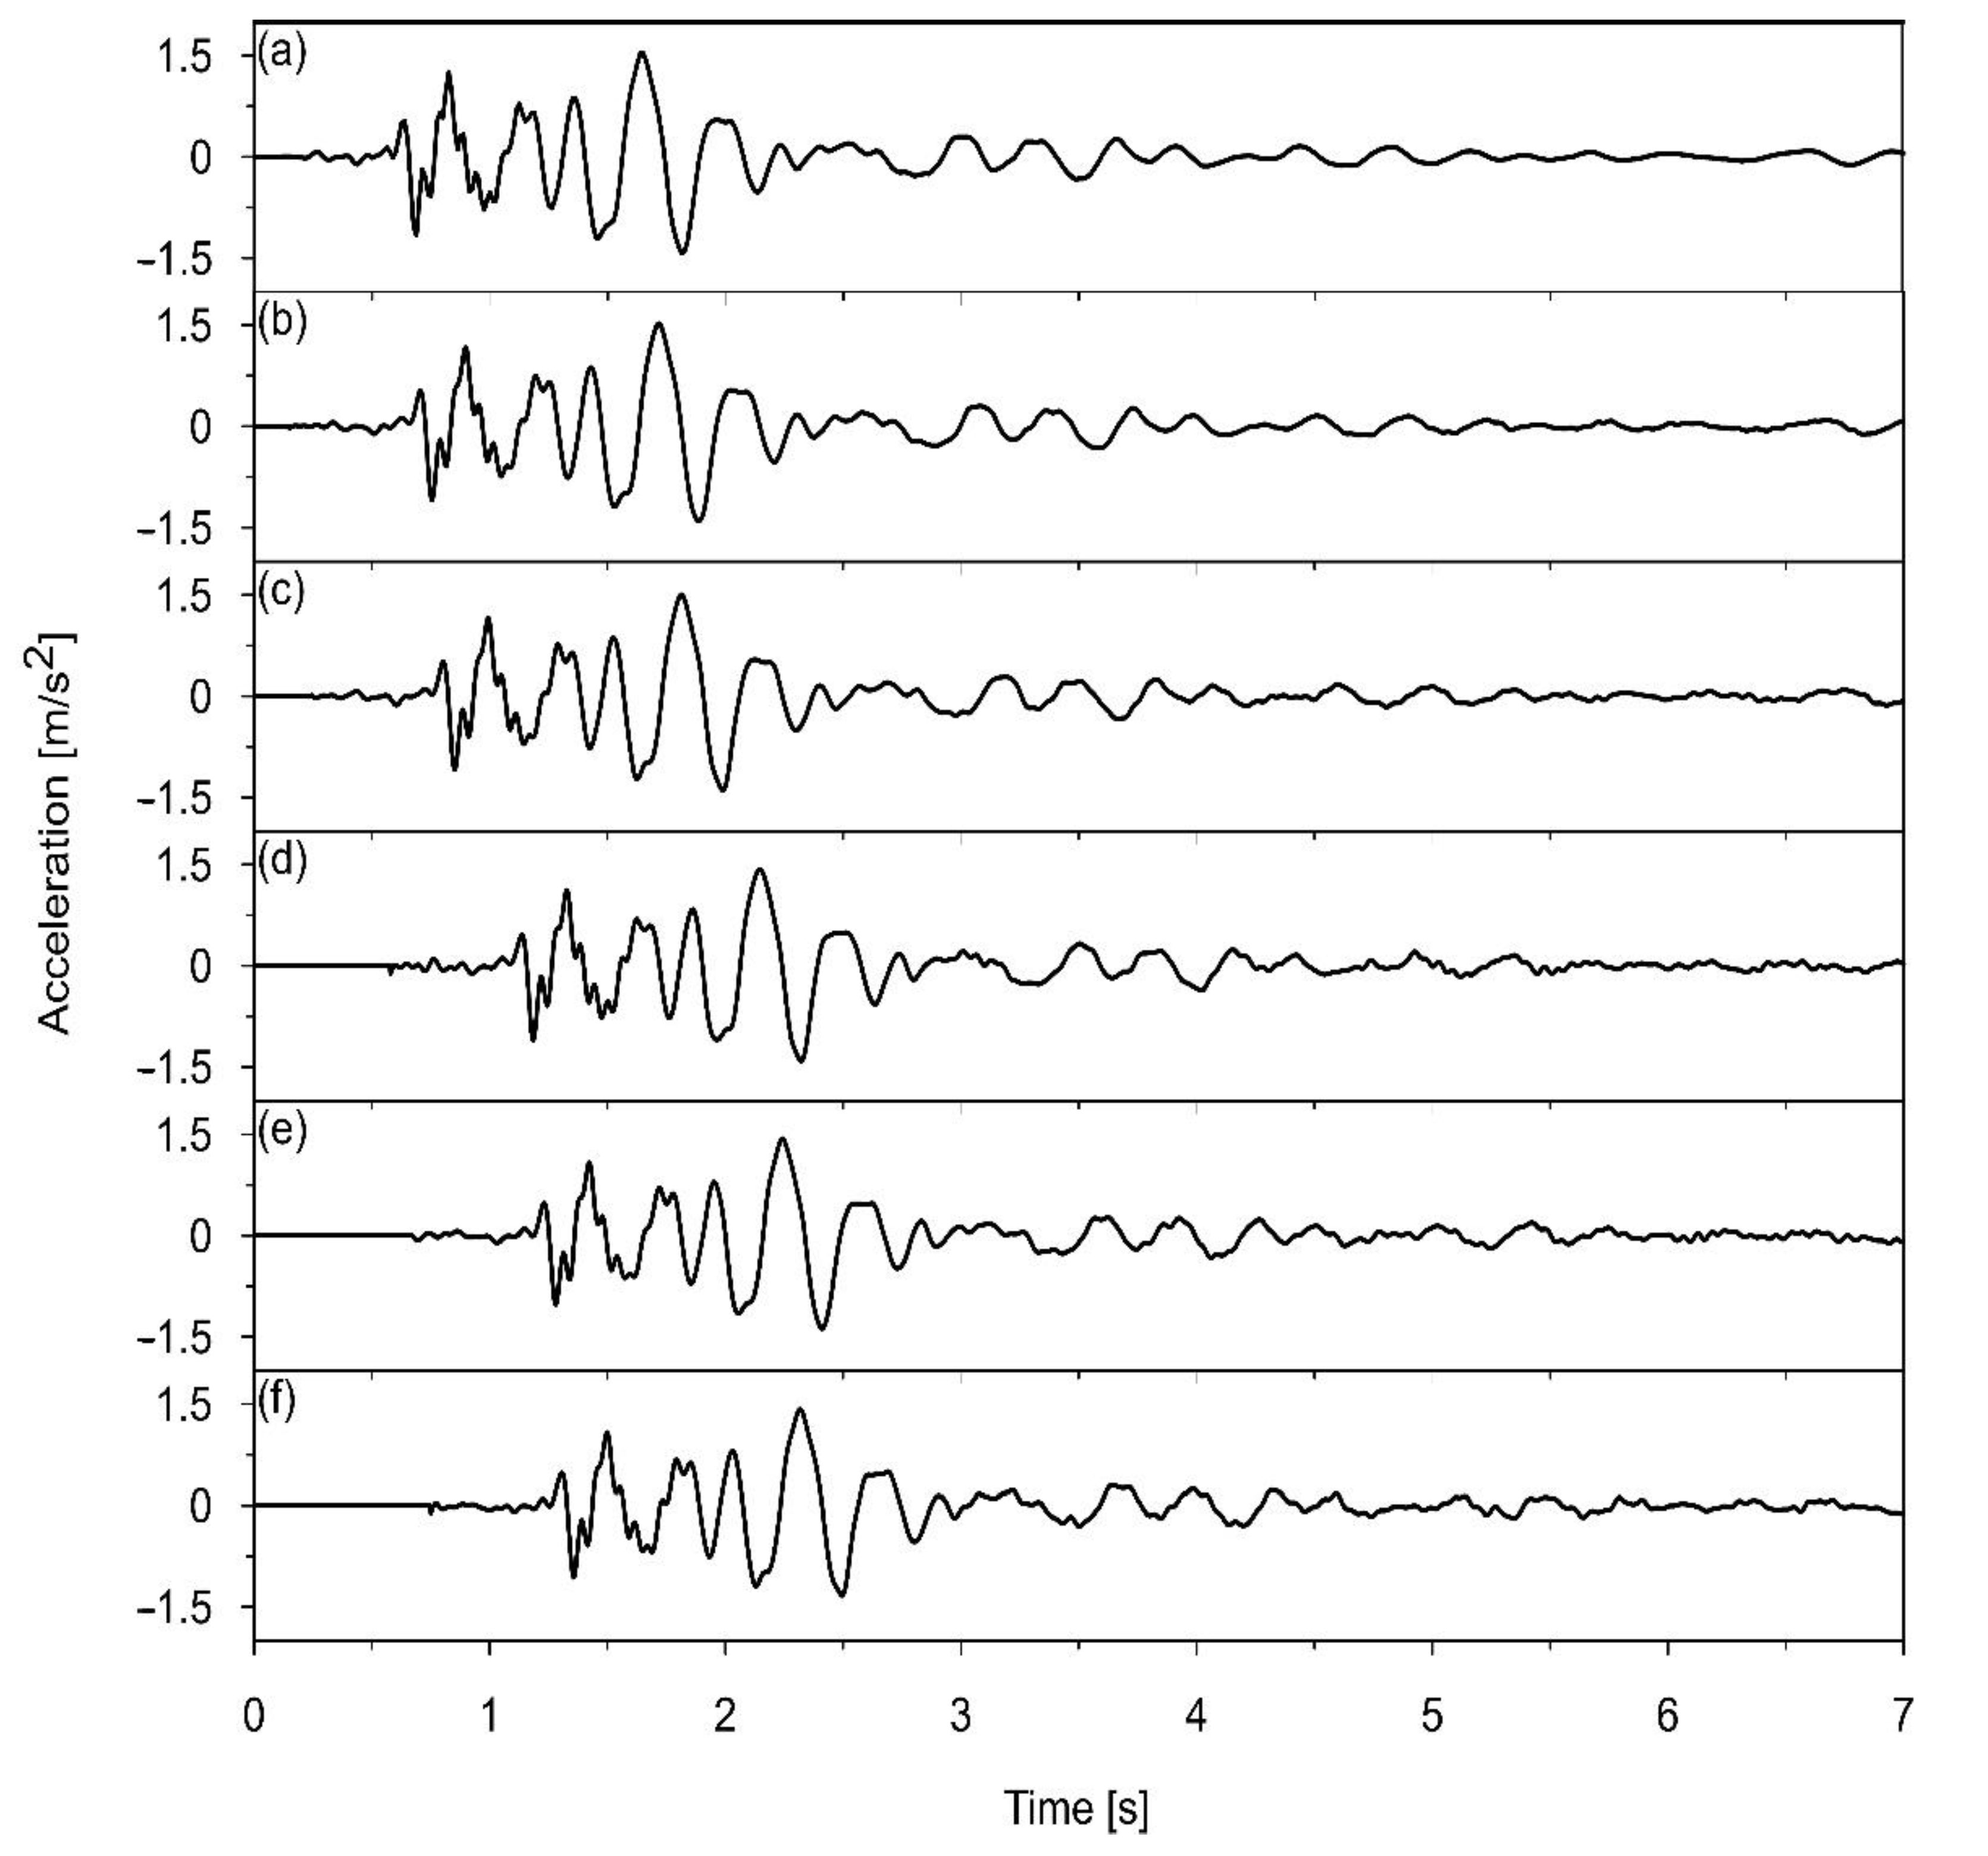
Applying the obtained parameters of the SMIKE model, i.e., the space scale factor α = 7 and the experimental apparent wave velocity v = 240   m / s , to modify the tremor recorded in the USCB region (see Figure 1, Section 2.1.5), results in the acceleration-time histories of the subsequent bridge supports in three directions. Since the analyzed signal ratios of the maximal amplitudes to the standard field deviation a m a x σ   equaled 4.6, 3.7, and 4.5 in the WE, SN, and vertical directions, respectively, so the truncation parameter was omitted in the signal generation procedure (see Section 2.1.2). The WE component of the horizontal accelerations obtained for the subsequent supports is presented in Figure 14.
As mentioned in Section 2.1.1, the soil-structure interaction is neglected in computing the foundation input motion at supports.

4. Discussion

4.1. The Main Assumptions of the Presented Dynamic Analyses

The dynamic performance of the bridge subjected to the mining-triggered shock was assessed for the tremor recorded in the USCB mining area (see Section 2.1.5). The dynamic response levels, in terms of maximal principal stresses, were evaluated and compared assuming either the classic uniform excitation model or the proposed spatiotemporal mining-induced kinematic excitation (SMIKE) model (see Section 2.1.3). The Time History Analysis (THA) was used for the dynamic analysis. The calculations were conducted with the Hilber–Hughes–Taylor time integration algorithm provided in the ABAQUS software for a direct step-by-step solution [43]. The coefficients of the Rayleigh damping model equal to 0.21 and 0.00208 for the mass and for the stiffness proportional damping, respectively, were experimentally estimated (see Section 3.2).
The dynamic performances of the bridge were calculated for selected representative points of the bridge girders. The location of the points is shown in Figure 15. It should be emphasized that the representative points were intentionally chosen on the spans, which contrast significantly in terms of slenderness. Points S1, S2, S4, and S5 are located in the middle of the first, second, fourth, and fifth span, respectively, so they are placed on the short stocky spans. Then, points L1–L5 are placed on the longest (third) span of the highest slenderness. Finally, points C1, C2, C3, and C4 are situated above the first, second, third, and fourth columns, respectively.
It should be noted that the excitation model has not been validated via measurement data. The reason lies in the fact that no continuous monitoring devices are installed on the analyzed bridge. Only such devices could serve for the model validation, recording both: the input data (time-acceleration histories of the bridge supports) and the output data (time-acceleration histories at the representative points on the bridge).

4.2. The SMIKE Model vs. the Uniform Model of Kinematic Excitation

The results of the simultaneous computations allowed for the comparative analysis of the bridge’s dynamic response level obtained by adopting the proposed SMIKE model as well as the uniform model of kinematic excitation. In the SMIKE model, the measured value of the wave propagation velocity v = 240 m/s was implemented (see Section 3.3.1). The value of space scale parameter α = 7, estimated on the basis of the regression relationships for the USBC region (see Section 3.3.2), was introduced.
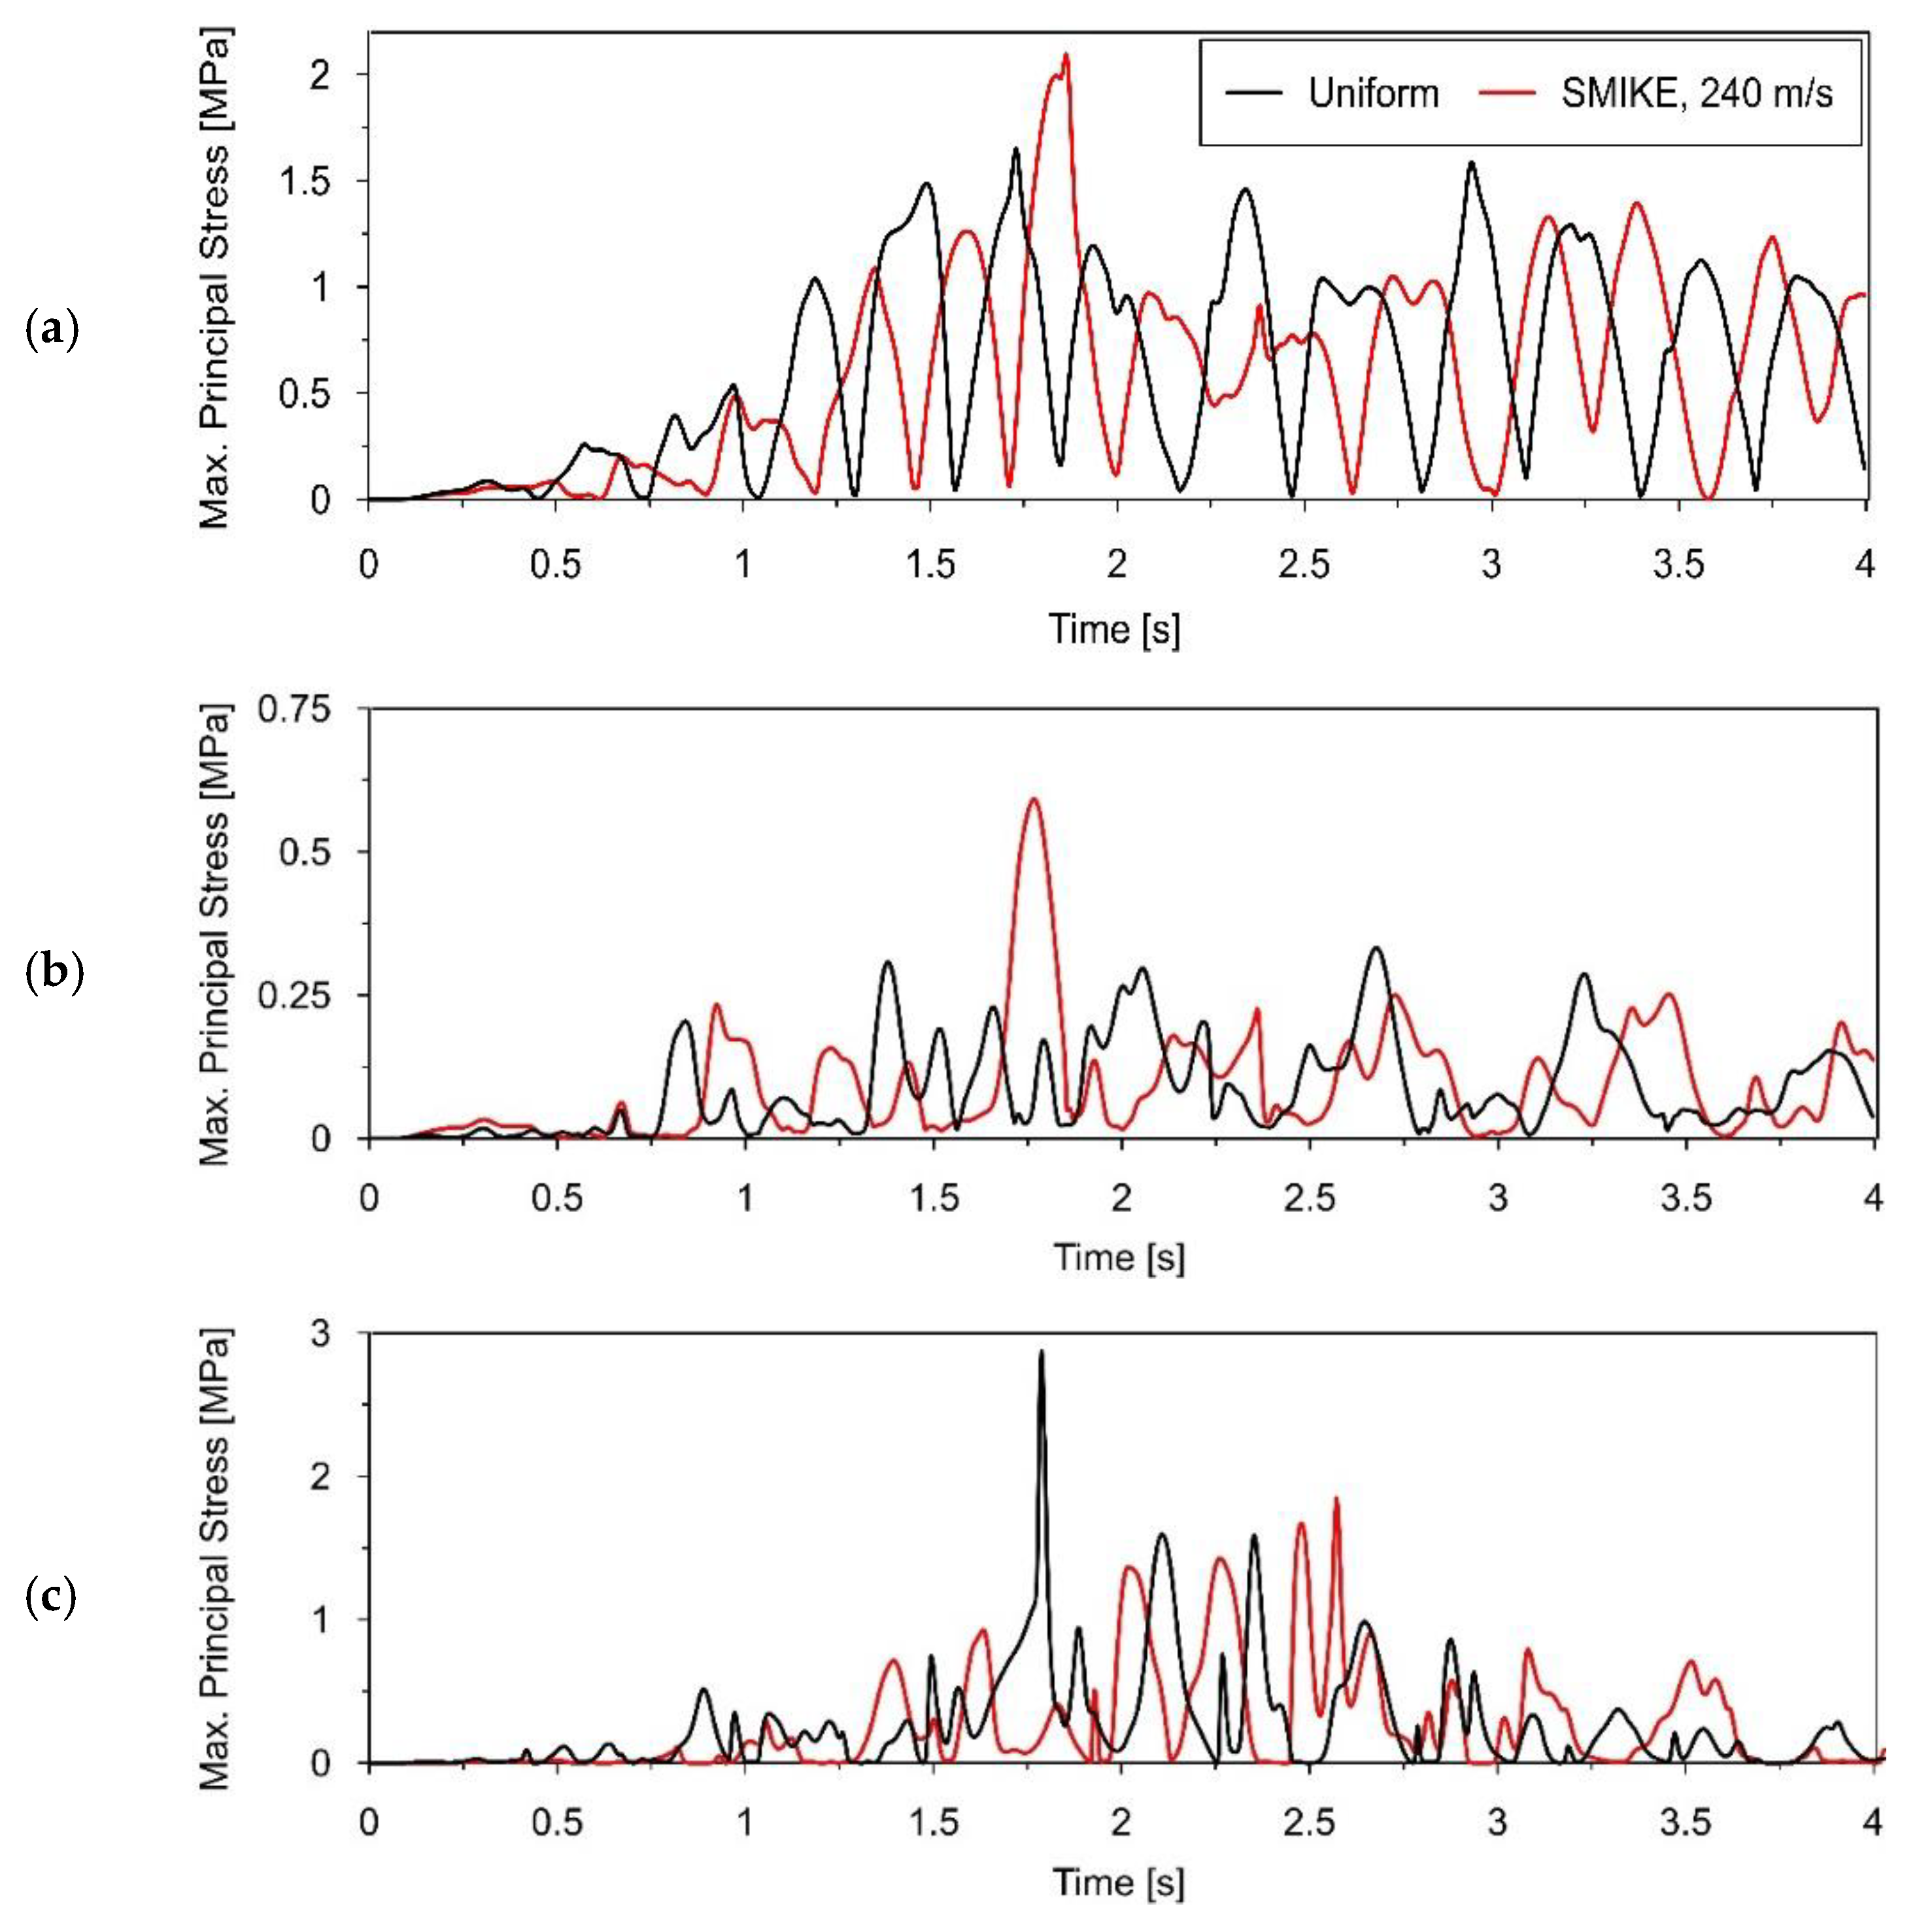
The stress-time histories obtained for both models are compared in Figure 16. Having considered the outcomes gathered for all representative points (see Figure 15), it was resolved to compare stresses at point C1 located over the first column and at points S2 and L3 placed in the middle of the second and the third span, respectively.
Based on the presented charts, an important conclusion can be drawn. In the case of points C1 and S2, located above the supports and on the stocky span, the maximum stress caused by the tremor is higher with the SMIKE model application (see Figure 16a,b), whereas the opposite relation occurs for point L3, placed on the longest slender span: the maximum stress is greater for the uniform model of excitation (see Figure 16c).
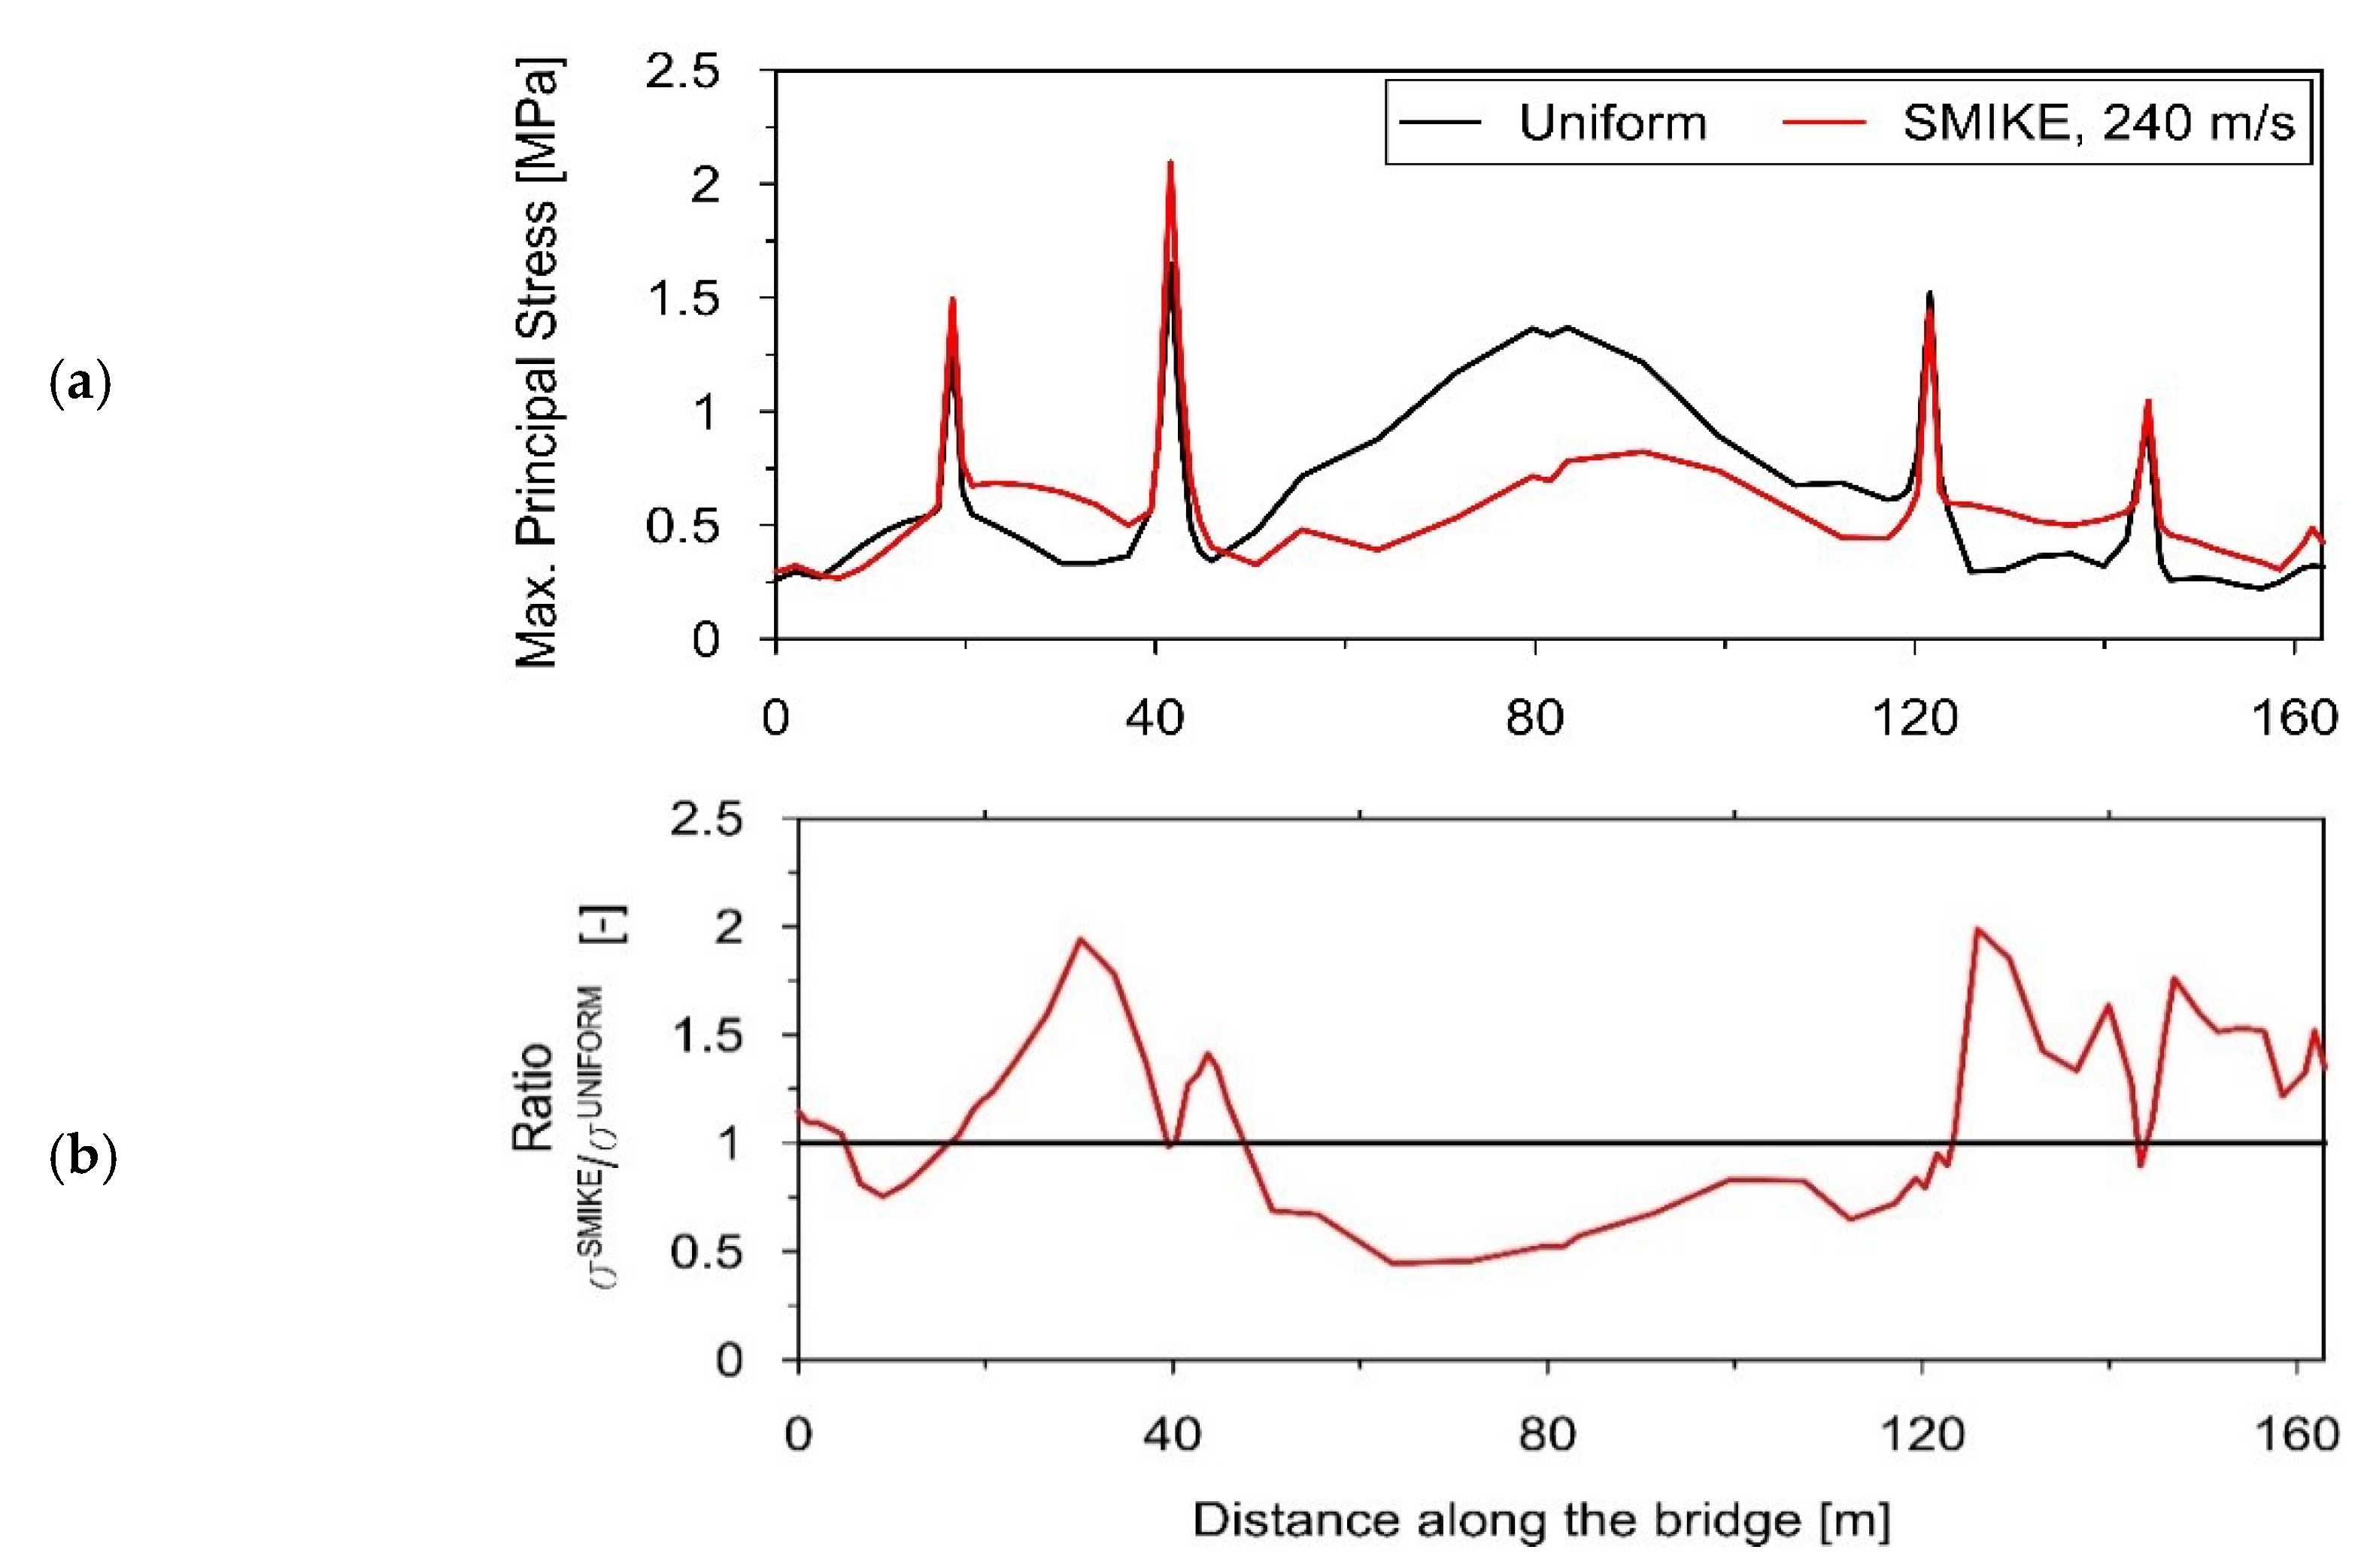
In Figure 17a, the stress envelopes, presenting the maximum time from maximal principal stresses at points along the bridge length, computed with both excitation models, are compared. Figure 17b shows the ratio of these envelopes (SMIKE stresses to uniform model stresses).
Based on Figure 17a, a clear interpretation of the differences in the bridge’s dynamic performance under two different models of excitation can be provided. However, in the context of the particular spans’ slenderness, the stresses ratio (Figure 17b) seems to be the best way to present and clarify the results. It unquestionably portrays how the SMIKE model application affects the level of the dynamic response of particular spans of the bridge. The response level is up to twice higher under the SMIKE model than under the uniform one as far as the stocky spans are concerned. The quasi-static effects appearing in these structural parts take on values high enough to outweigh the loss in the average excitation amplitudes due to the incoherence effect and lead to an increase in the global dynamic response. The opposite situation can be noticed for the longest slender span. The decrease in the average excitation amplitudes introduced by the SMIKE model causes a reduction in the global dynamic response level.

4.3. The Impact of SMIKE Model Parameters on the Dynamic Performance of the Bridge

4.3.1. The Impact of the Wave Propagation Velocity

In Section 4.2, the impact of the SMIKE model application on the dynamic response level of the bridge located in the USCB with known geological conditions was assessed. The first model’s parameter, space scale parameter α = 7, was determined on the basis of regression curves valid for the entire USCB region. The second parameter, the wave velocity v = 240 m/s, was evaluated on the basis of the in situ experiment. However, when experimental research is not possible, wave velocity may also be assumed, for known local geological conditions, based on the literature. Hence, it seems reasonable to analyze the relations between the wave velocity and the dynamic performance of a structure to find out whether, or for what wave velocities, the use of the SMIKE model leads to more conservative results for a multi-support structure than the use of the classic uniform excitation model.
Four potentially occurring in the region wave propagation velocities of 240 (measured), 600, 1000, and 2000 m/s were adopted for ground accelerations simulations at consecutive bridge supports. The dynamic responses of the bridge for the assumed velocities are compared to results obtained under the assumption of uniform kinematic excitations.
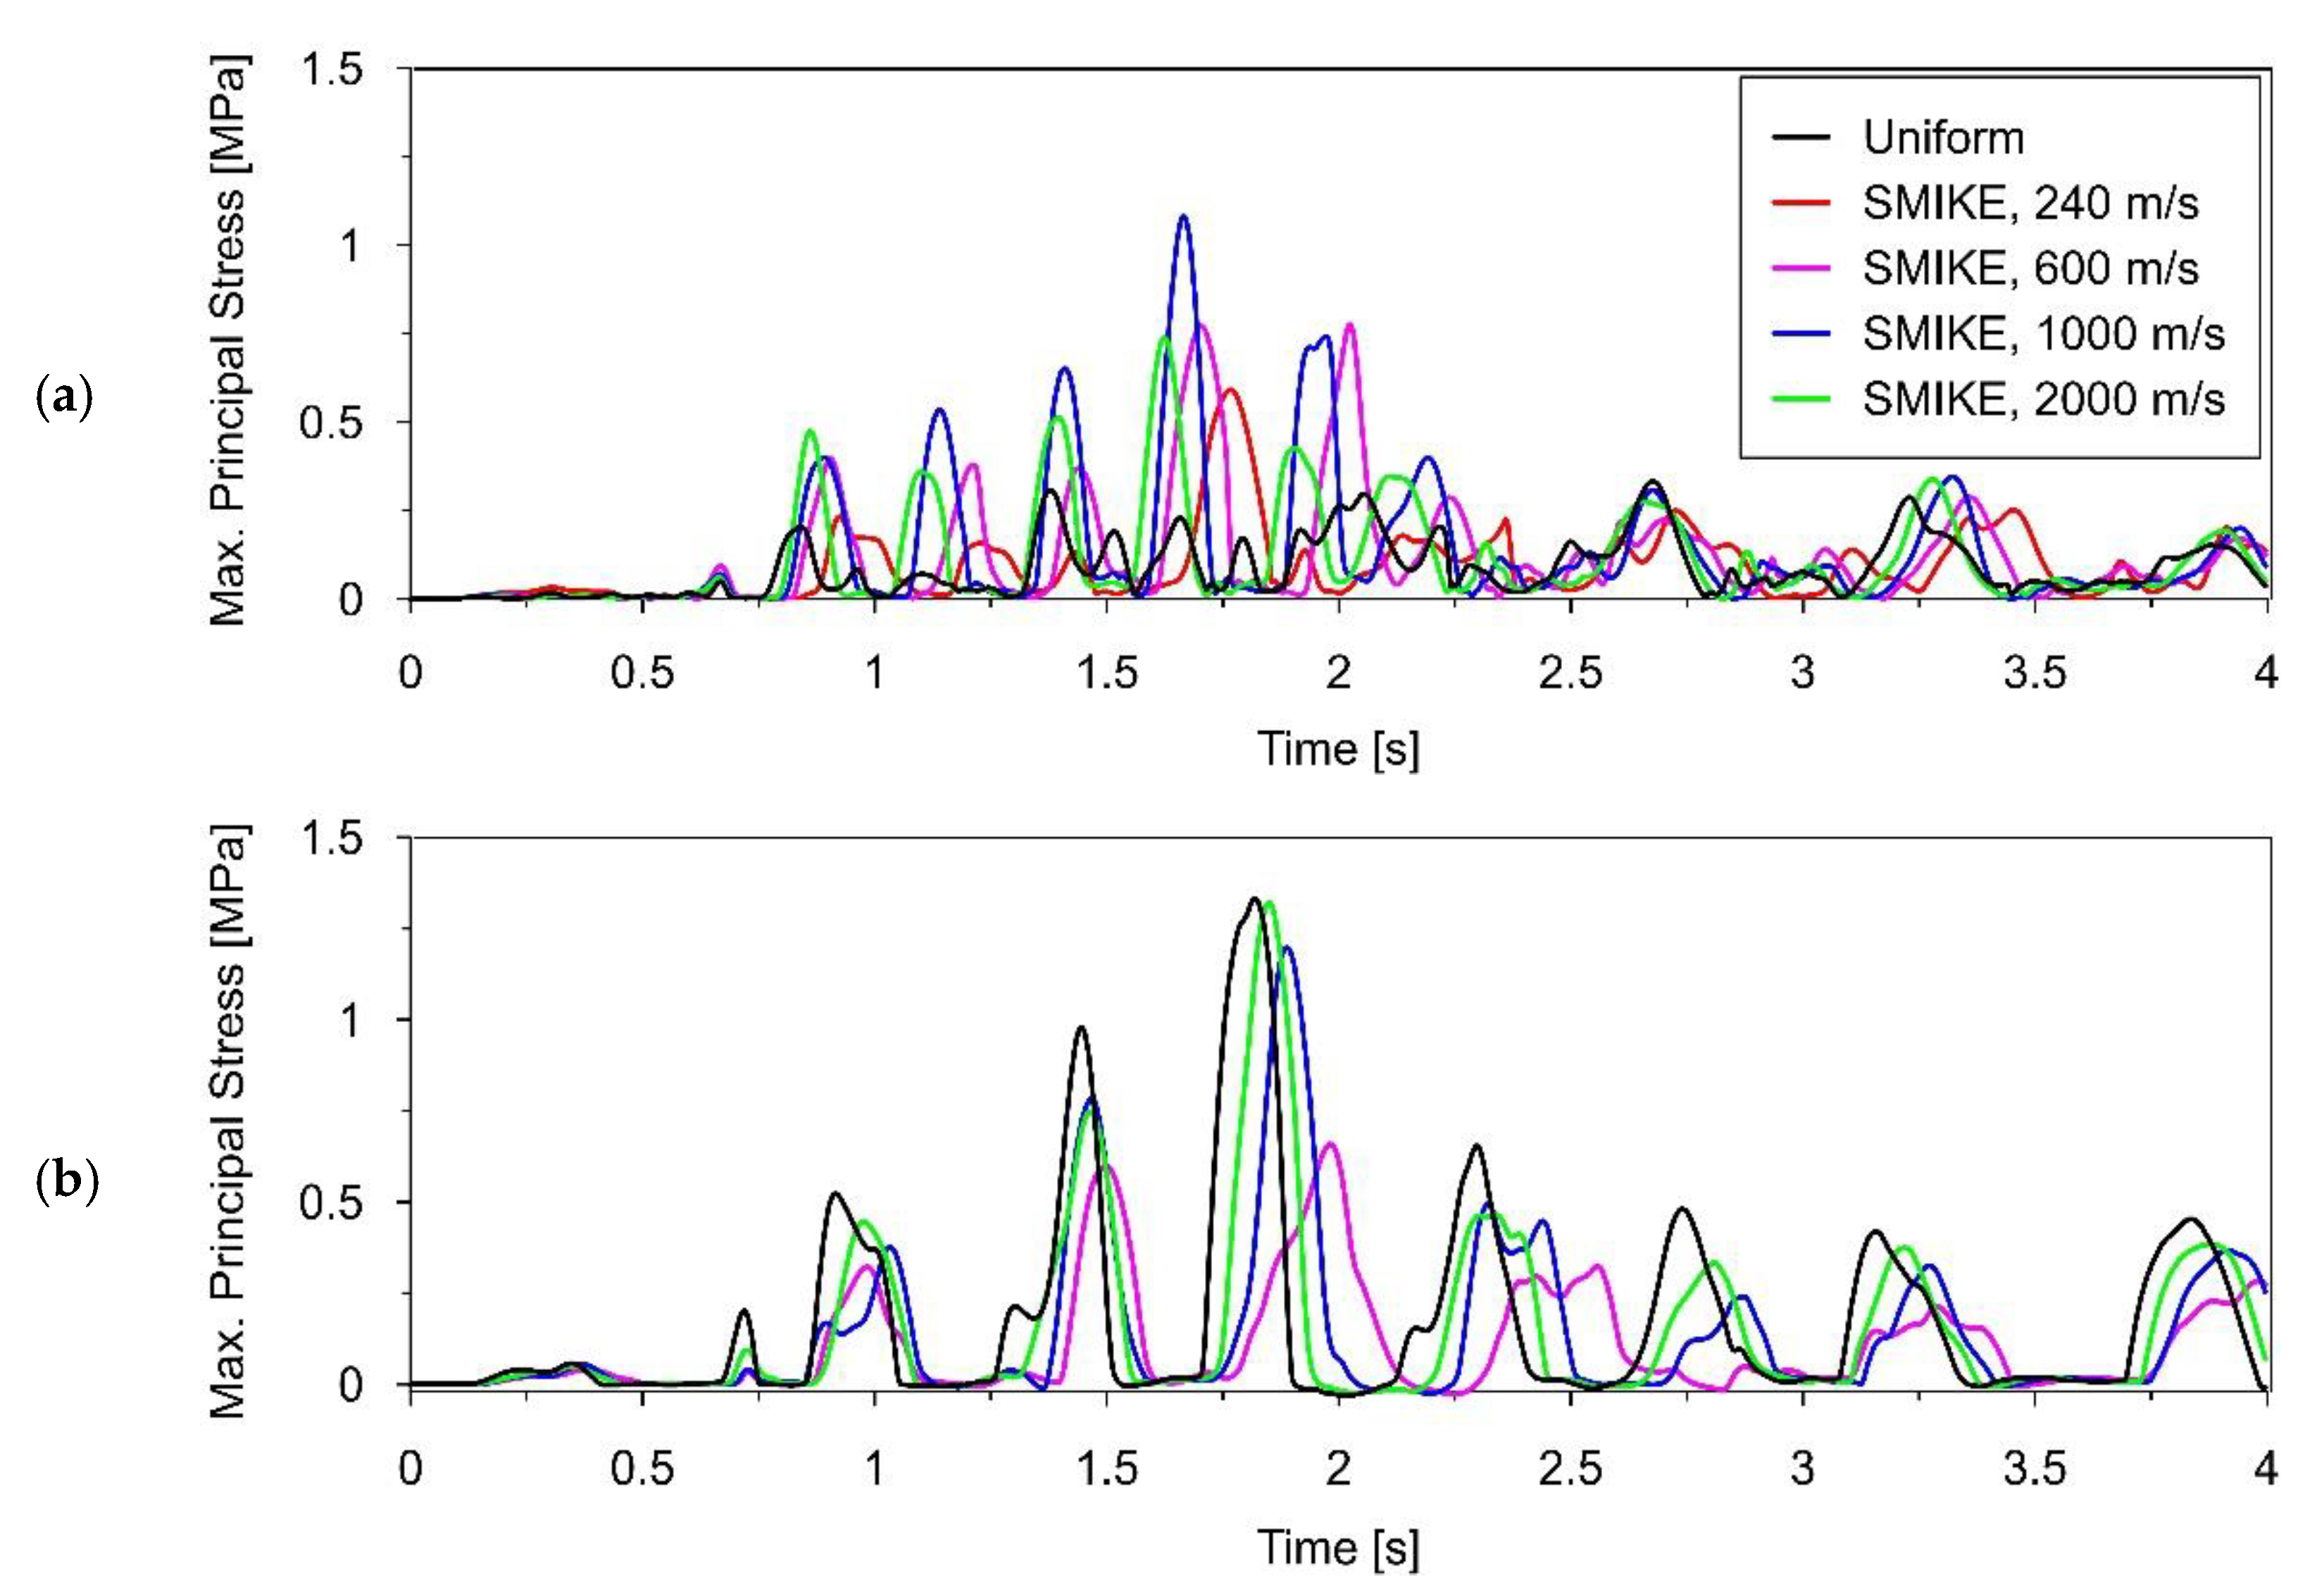
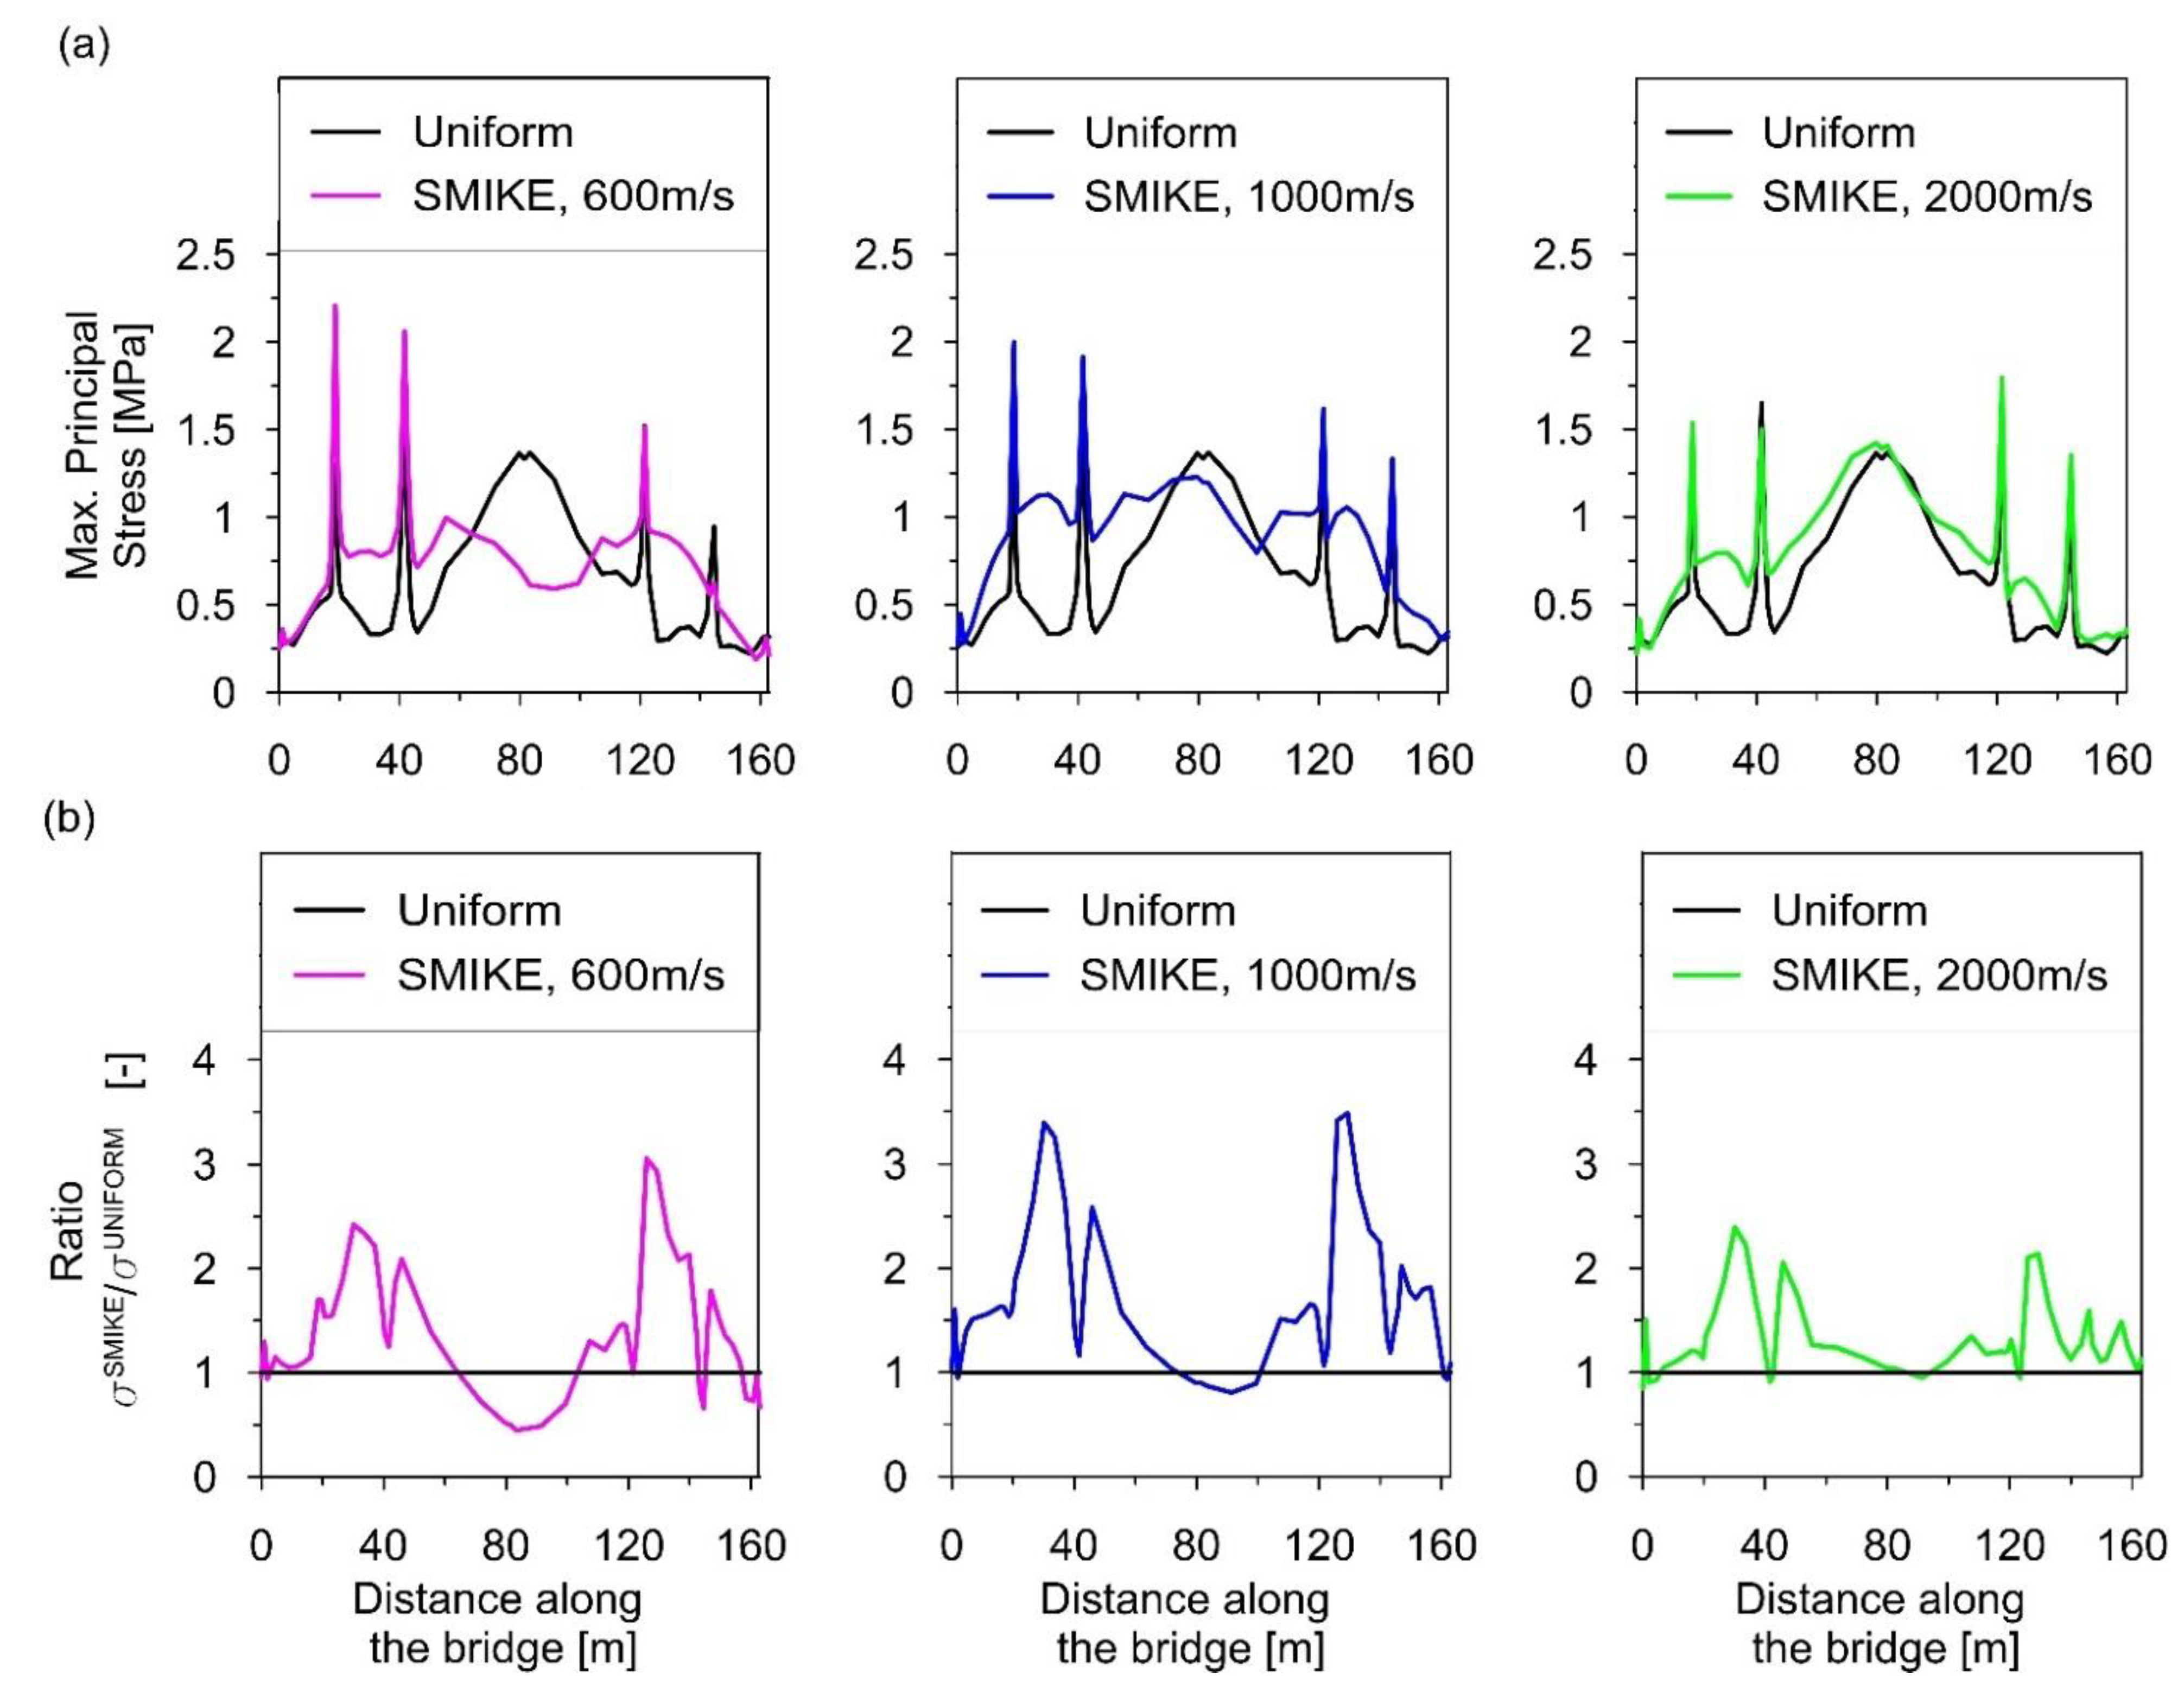
The resultant stress-time histories for points: S2 and L3 are presented in Figure 18, followed by the envelopes of maximal principal stresses along the bridge length shown in Figure 19a. The ratios of maximal principal stress envelopes (SMIKE model to uniform model) are depicted in Figure 19b.
In the case of point S2, located on the stocky span, the greatest maximum stress level is obtained with the SMIKE model for the wave velocity of 1000 m/s (see Figure 18a). Different relation occurs for point L3, placed on the longest, slender span, where the greatest stress level occurs under the uniform excitation (see Figure 18b).
Figure 17b and Figure 19b illustrate how the SMIKE model application affects the dynamic response levels of particular parts of the bridge for different assumed wave velocities.
The response level along short, stocky spans is much higher under the SMIKE model for all assumed wave velocities. The stress ratios reach:
  • about 2—for v = 240   m / s ,
  • about 3—for v = 600   m / s ,
  • about 3.5—for v = 1000   m / s ,
  • about 2.5—for v = 2000   m / s .
This means that the quasi-static effects appearing in the stocky spans take on values high enough to outweigh the reduction in the average excitation amplitudes, which leads to the growth in the global dynamic response.
The opposite trend can be noticed for the third slender span. The decrease in the average excitation amplitudes introduced by the SMIKE model causes a reduction in the global dynamic response level. The slower the wave velocity, the greater the reduction of the global response level at this span.
The dependences of maximal principal stresses on the wave propagation velocity for the points located in the different structural parts are presented in Figure 20. Each line in the presented charts is created by selecting and linking the maximum value of the time-maximal principal stress history for the following wave velocities: 240, 600, 1000, and 2000 m/s. The infinite value of wave velocity corresponds to the assumption of uniform excitation.
The dependence of the dynamic response on wave velocity for points L1-L5 located on the slender third span is demonstrated in Figure 20a, and for points located on the stocky spans (first, second, fourth, and fifth) is presented in Figure 20b.
Various trends visible in dynamic responses at various points of the bridge should be discussed in-depth in the context of the location of these points on the structure, which seems to be of crucial importance to the obtained results.
The use of the SMIKE model always results in a drop in the average excitation amplitudes on both ends of the span and thus a decrease in the inertial component of the dynamic response. On the other hand, it causes additional stresses, attributed to essential changes in the subsoil geometry due to the wave passage in the subsoil generating uneven support displacements (quasi-static effect). For the middle span, the quasi-static component does not seem to be as significant due to the long distance between the supports and the high slenderness of the span, which leads to the decline of the global dynamic response (see Figure 20a). This reduction grows with decreasing wave velocity, up to 600 m/s. For the lowest assumed velocity, 240 m/s, the quasi-static effects are more visible due to greater differences in the excitation of both span ends, which slightly increases the global response. However, it should be noted that at none of the control points of the slender span is the dynamic response obtained with the SMIKE model (at any velocity) greater than the response to the uniform excitation model. In the case of points located on short, stocky spans (see Figure 20b), the opposite tendency can be noticed. With lowering velocity down to a certain point, the spatially varying ground motion produces more significant quasi-static effects, resulting in achieving the maximum value of the dynamic response in the stocky spans at the 1000 m/s wave velocity. However, a further decrease in wave velocity causes a decrease in the dynamic response. This may be attributed to the fact that very low wave velocities significantly reduce average excitation amplitudes in comparison with the case of uniform excitation or the excitation “traveling” with higher velocities. Even though changes in bedrock geometry still introduce additional quasi-static stresses to the global response, the inertia component of the response drops dramatically, reducing the global seismic response. It can be seen, however, that at none of the control points on the stocky spans is the dynamic response obtained with the SMIKE model (at any velocity) smaller than the response to the uniform excitation model.

4.3.2. The Impact of Regional Seismicity Characteristics

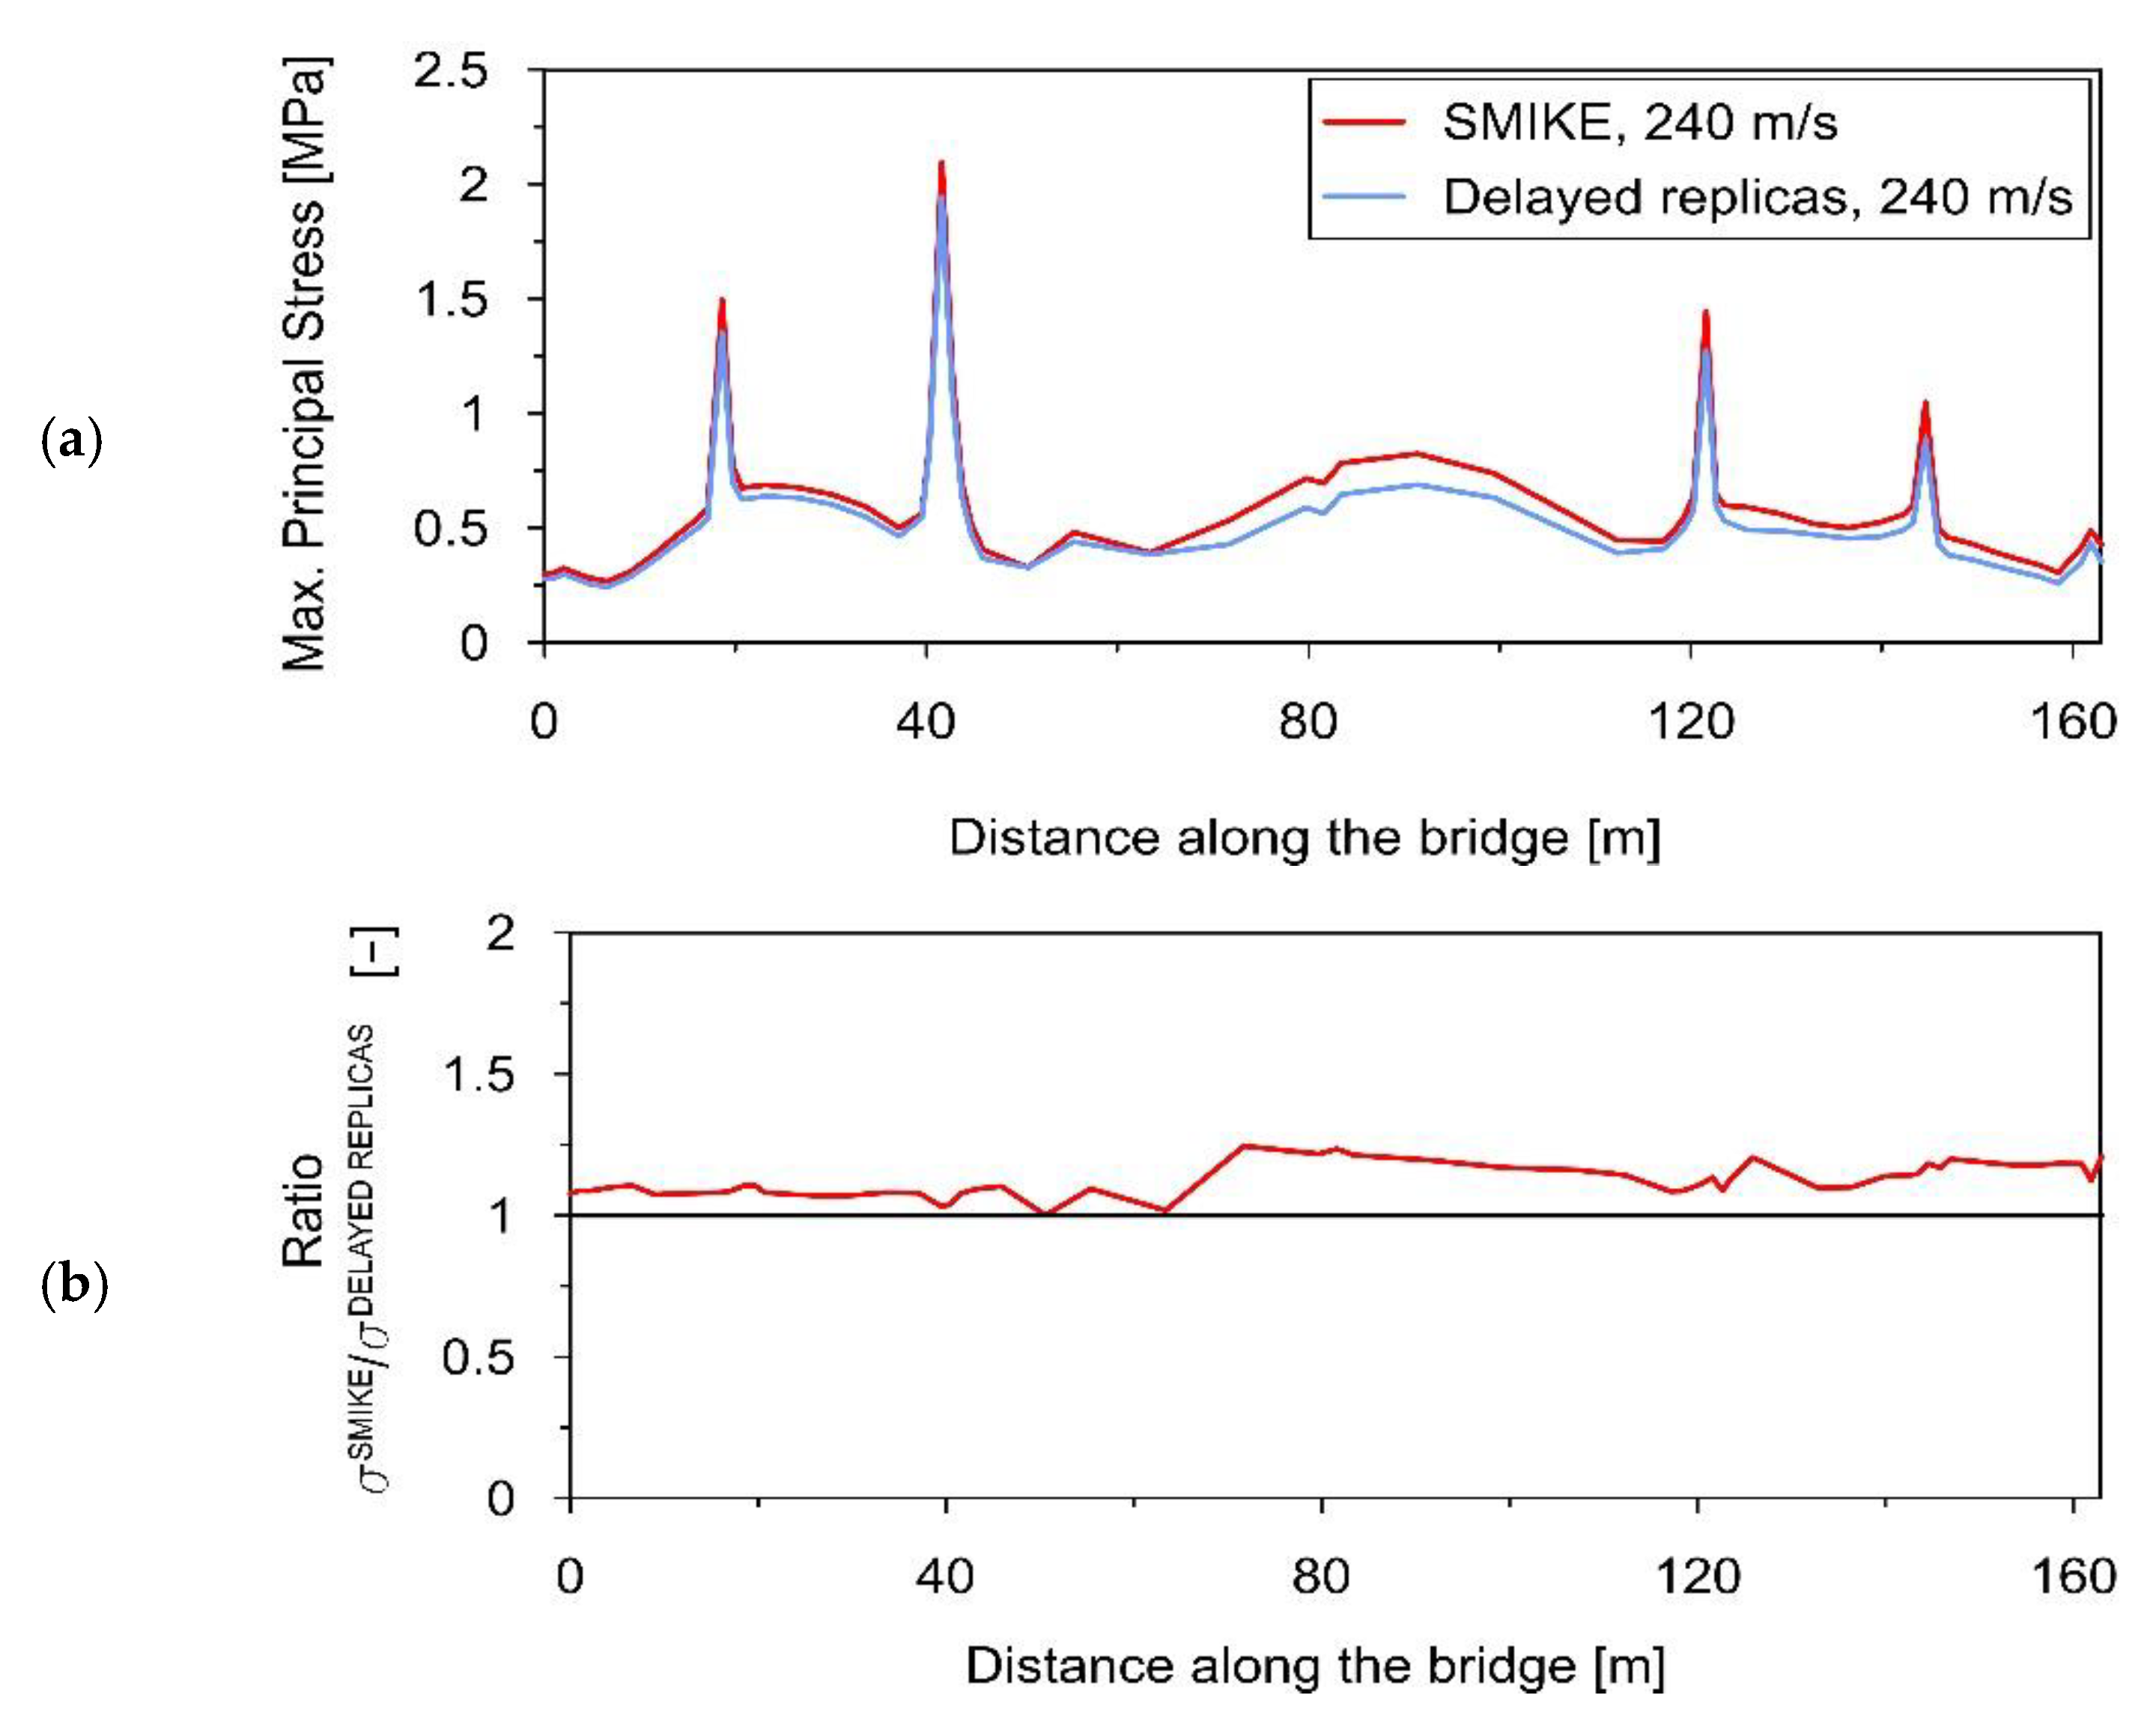
To assess the impact of the space scale parameter α, estimated on the basis of regional seismicity characteristics, the results obtained with the SMIKE model are compared to those acquired based on the excitation model, accounting only for the wave passage effect (“delayed replicas” model). The wave velocity of 240 m/s was assumed in both cases.
As in the previous subsection, the envelopes of maximal principal stresses (Figure 21a) and the envelope ratio (SMIKE to “delayed replicas”) (Figure 21b) are analyzed. It can be noticed that the inclusion of the loss of wave coherence captured by the SMIKE model leads to an increase in the overall dynamic structure response. The effect is slightly more significant in stocky spans, but the difference does not exceed 20%. It must be pointed out that similar conclusions can be drawn for other wave propagation velocities.

5. Conclusions

Based on the performed research, the following conclusions can be drawn:
  • The advanced model of spatiotemporal mining-induced kinematic excitation (SMIKE) for multiple-support structures exposed to mining-induced seismicity is proposed. The uniqueness of this model results from the possibility of its application for any region of mining activity, as it is based on empirical regression functions characterizing different such regions.
  • The proposed SMIKE model takes into account the loss of coherency resulting from the scattering of waves in the heterogeneous ground, the wave-passage effect originated in the different arrival times of waves to consecutive supports, and the site-response effect resulting from the local soil conditions. Hence, it covers the key phenomena of spatial variability of mining-induced ground motion.
  • The two parameters of the SMIKE model can be estimated relatively easily in practice. The space scale parameter α can be determined from the regression functions for different mining areas delivered by seismologists. The apparent wave velocity in the ground v can either be detected experimentally or assumed based on the literature for foundation geological conditions.
  • The proposed model was applied to assess the dynamic performance of the five-span bridge under the mining-induced shock recorded in the Upper Silesian Coal Basin (USCB), Poland. The space scale parameter α = 7 was determined on the basis of regression curves valid for the USCB region. This value lies within the range of the space scale parameters adopted in the literature. The apparent wave passage velocity v = 240 m/s, obtained from discrete experimental data acquired via the vibroseis excitation in situ experiment, is typical for the geological conditions in the field.
  • The dynamic response levels, in terms of maximal principal stresses, were evaluated and compared assuming both the classic uniform excitation model and the proposed spatiotemporal mining-induced kinematic excitation (SMIKE) model. The impact of the wave velocity appears to be crucial: the introduction of the experimentally evaluated velocity modifies (either amplifies or reduces, depending on the span slenderness) the dynamic response level even twice. The introduction of the space scale parameter, based on the regional seismicity characteristics, changed the stress levels up to 20% in comparison with results obtained for the “traveling” wave only.
  • The presented analyses show how the SMIKE model application affects the level of the dynamic performance of particular spans of the bridge in the context of the spans’ slenderness. For various wave velocities, the response level is up to 3.5 times higher with the SMIKE model than with the uniform one for stocky spans due to the quasi-static effects. The opposite situation is spotted for slender spans. The decrease in the average excitation amplitudes, introduced by the SMIKE model causes a reduction in the global dynamic response level.
The final conclusion is that the proposed spatiotemporal mining-induced kinematic excitation model, covering the key phenomena of spatial variability of mining-induced ground motion, can be considered equivalent to advanced complex models of kinematic excitation proposed for natural earthquakes. However, the very simple stochastic spatial wave variability generator, together with the deterministic temporal approach, enables the model to be applicable in engineering practice. It is also worth noting that by having empirical regression functions characterizing seismic regions, one can apply the proposed model for seismic scenarios.

Author Contributions

Conceptualization, J.M.D. and D.J.; data curation, P.B.; formal analysis, J.M.D., D.J. and P.B.; investigation, J.M.D. and P.B.; methodology, J.M.D.; supervision, J.M.D. and D.J.; visualization, P.B.; writing—original draft, J.M.D., D.J. and P.B.; writing—review and editing, D.J. All authors have read and agreed to the published version of the manuscript.

Funding

This research received no external funding.

Institutional Review Board Statement

Not applicable.

Informed Consent Statement

Not applicable.

Acknowledgments

This research was supported in part by PL-Grid Infrastructure.

Conflicts of Interest

The authors declare no conflict of interest.

References

  1. Gueha, S.K. Mining Induced Seismicity. In Induced Earthquakes; Springer: Dordrecht, The Netherlands, 2000. [Google Scholar] [CrossRef]
  2. Linzer, L.M.; Bejaichund, M.; Cichowicz, A.; Durrheim, R.J.; Goldbach, O.D.; Kataka, M.O.; Kijko, A.; Milev, A.M.; Saunders, I.; Spottiswoode, S.M.; et al. Recent research in seismology in South Africa. S. Afr. J. Sci. 2007, 103, 419–426. [Google Scholar]
  3. Marcak, H.; Mutke, G. Seismic activation of tectonic stresses by mining. J. Seismol. 2013, 17, 1139–1148. [Google Scholar] [CrossRef]
  4. Lasocki, S. Site specific prediction equations for peak acceleration of ground motion due to earthquakes induced by underground mining in Legnica-Głogów Copper District in Poland. Acta Geophys. 2013, 61, 1130–1155. [Google Scholar] [CrossRef]
  5. Hradil, P.; Kaláb, Z.; Knejzlík, J.; Kořínek, R.; Salajka, V.; Kanický, V. Response of a panel building to mining induced seismicity in Karvina area (Czech Republic). Acta Montan. Slovaca 2009, 14, 143–151. [Google Scholar]
  6. Tatara, T. An Influence of Surface Mining-Related Vibration on Low-Rise Buildings; Scientific Notebooks of Cracow University of Technology, No. 74; Cracow University of Technology: Cracow, Poland, 2002. (In Polish) [Google Scholar]
  7. Uzoegbo, H.C.; Li, K. Mine-Induced Seismic Events and Its Effect on Nearby Settlements in South Africa; National Research Foundation (NRF) and Hydraform Africa Ltd.: Pretoria, South Africa, 2002. [Google Scholar]
  8. Zerva, A. Spatial Variation of Seismic Ground Motions: Modeling and Engineering Applications; CRC Press/Balkema–Taylor & Francis Group: Boca Raton, FL, USA, 2009. [Google Scholar]
  9. Léger, P.; Idé, M.I.; Paultre, P. Multiple-support seismic analysis of large structures. Comput. Struct. 1990, 36, 1153–1158. [Google Scholar] [CrossRef]
  10. Boroń, P.; Dulińska, J.M.; Jasińska, D. Impact of High Energy Mining-Induced Seismic Shocks from Different Mining Activity Regions on a Multiple-Support Road Viaduct. Energies 2020, 13, 4045. [Google Scholar] [CrossRef]
  11. Fayun, L.; Yajie, J.; Limin, S.; Wen, X.; Haibing, C. Seismic response of pile groups supporting long-span cable-stayed bridge subjected to multi-support excitations. Soil Dyn. Earthq. Eng. 2017, 101, 182–203. [Google Scholar] [CrossRef]
  12. Sextos, A.G.; Kappos, A.J. Evaluation of seismic response of bridges under asynchronous excitation and comparisons with Eurocode 8-2 provisions. Bull. Earthq. Eng. 2009, 7, 519–545. [Google Scholar] [CrossRef]
  13. Hoseini, S.S.; Ghanbari, A.; Davoodi, M. A New Approach in Equivalent Spring-Dashpot Method for Seismic Soil-Structure Interaction Analysis of Long Bridges Including Non-uniform Excitations. Transp. Infrastruct. Geotechnol. 2019, 6, 165–188. [Google Scholar] [CrossRef]
  14. Novak, M.S.; Lazarevic, D.; Atalic, J.; Uros, M. Influence of Multiple-Support Excitation on Seismic Response of Reinforced Concrete Arch Bridges. Appl. Sci. 2020, 10, 17. [Google Scholar] [CrossRef] [Green Version]
  15. Shen, J.; Li, R.; Shi, J.; Zhou, G. Modified Multi-Support Response Spectrum Analysis of Structures with Multiple Supports under Incoherent Ground Excitation. Appl. Sci. 2019, 9, 1744. [Google Scholar] [CrossRef] [Green Version]
  16. Qin, H.; Li, L. Error Caused by Damping Formulating in Multiple Support Excitation Problems. Appl. Sci. 2020, 10, 8180. [Google Scholar] [CrossRef]
  17. Boron, P.; Dulinska, J. Dynamic Response of a Road Viaduct to a Mining Tremor Using Multiple Support Response Spectrum Method. IOP Conf. Ser. Mater. Sci. Eng. 2019, 471, 052065. [Google Scholar] [CrossRef]
  18. Drygala, I.J.; Dulinska, J.M.; Polak, M.A. Seismic Assessment of Footbridges under Spatial Variation of Earthquake Ground Motion (SVEGM): Experimental Testing and Finite Element Analyses. Sensors 2020, 20, 1227. [Google Scholar] [CrossRef] [Green Version]
  19. Bahbouh, L.; Yamada, H.; Katsuchi, H.; Sasaki, E.; Theeraphong, C. The behaviour of Akashi Kaikyo Bridge under multi support seismic excitation for low frequency motions. Earthq. Resist. Eng. Struct. 2009, 104, 345–355. [Google Scholar] [CrossRef] [Green Version]
  20. Dulińska, J. Dynamic Response of Multiple-Support Structures to Non-Uniform Mining Related Paraseismic Excitation; The Cracow University of Technology Press: Krakow, Poland, 2006. (In Polish) [Google Scholar]
  21. Dulinska, J.M.; Jasinska, D. Influence of seismic wave velocity on the dynamic response of a steel pipeline with a progressive damage and failure material model. In Recent Advances in Civil Engineering: Structural Mechanics; Stypula, K., Ed.; The Cracow University of Technology Press: Cracow, Poland, 2015; pp. 45–61. [Google Scholar]
  22. Song, Y.; Wang, Z.; Liu, Z.; Wang, R. A spatial coupling model to study dynamic performance of pantograph-catenary with vehicle-track excitation. Mech. Syst. Signal Process. 2021, 151, 107336. [Google Scholar] [CrossRef]
  23. Fan, W.; Zhang, S.H.; Zhu, W.D.; Zhu, H. Vibration analysis and band-gap characteristics of periodic multi-span power transmission line systems. Eng. Struct. 2021, 238, 111669. [Google Scholar] [CrossRef]
  24. Clough, R.W.; Penzien, J. Dynamics of Structures; McGraw Hill Kogakusha Ltd.: Tokyo, Japan, 1975. [Google Scholar]
  25. Capatti, M.C.; Tropeano, G.; Morici, M.; Carbonari, S.; Dezi, F.; Leoni, G.; Silvestri, F. Implications of non-synchronous excitation induced by nonlinear site amplification and of soil-structure interaction on the seismic response of multi-span bridges founded on piles. Bull. Earthq. Eng. 2017, 15, 4963–4995. [Google Scholar] [CrossRef]
  26. EN 1998-2; Eurocode 8: Design of Structures for Earthquake Resistance—Part 2: Bridges. CEN: Brussels, Belgium, 2005.
  27. Jankowski, R.; Walukiewicz, H. Modeling of two-dimensional random fields. Probab. Eng. Mech. 1997, 12, 115–121. [Google Scholar] [CrossRef]
  28. Jankowski, R.; Wilde, K. A simple method of conditional random field simulation of ground motions for long structures. Eng. Struct. 2000, 22, 552–561. [Google Scholar] [CrossRef]
  29. Jankowski, R. Numerical Simulations of Space-Time Conditional Random Fields of Ground Motions. Lect. Notes Comput. Sci. 2006, 3993, 56–59. [Google Scholar] [CrossRef]
  30. Jankowski, R. Non-linear FEM analysis of pounding-involved response of buildings under non-uniform earthquake excitation. Eng. Struct. 2012, 37, 99–105. [Google Scholar] [CrossRef]
  31. Burkacki, D.; Jankowski, R. Response of cylindrical steel tank under stochastically generated non-uniform earthquake excitation. AIP Conf. Proc. 2020, 2239, 020004. [Google Scholar] [CrossRef]
  32. Johnson, S.W.; Chambers, D.; Boltz, M.S.; Koper, K.D. Application of a convolutional neural network for seismic phase picking of mining-induced seismicity. Geophys. J. Int. 2021, 224, 230–240. [Google Scholar] [CrossRef]
  33. Boettcher, M.S.; Kane, D.L.; McGarr, A.; Johnston, M.J.S.; Reches, Z. Moment Tensors and Other Source Parameters of Mining-Induced Earthquakes in TauTona Mine, South Africa. Bull. Seism. Soc. Am. 2015, 105, 1576–1593. [Google Scholar] [CrossRef]
  34. Barthwal, H.; van der Baan, M. Passive seismic tomography using recorded microseismicity: Application to mining-induced seismicity. Geophysics 2018, 84, B41–B57. [Google Scholar] [CrossRef]
  35. Fuławka, K.; Pytel, W.; Pałac-Walko, B. Near-Field Measurement of Six Degrees of Freedom Mining-Induced Tremors in Lower Silesian Copper Basin. Sensors 2020, 20, 6801. [Google Scholar] [CrossRef]
  36. Rudziński, Ł.; Lasocki, S.; Orlecka-Sikora, B.; Wiszniowski, J.; Olszewska, D.; Kokowski, J.; Mirek, J. Integrating Data under the European Plate Observing System from the Regional and Selected Local Seismic Networks in Poland. Seismol. Res. Lett. 2021, 92, 1717–1725. [Google Scholar] [CrossRef]
  37. Hejmanowski, R.; Witkowski, W.T.; Guzy, A.; Malinowska, A. Identification of the ground movements caused by mining-induced seismicity with the satellite interferometry. Proc. Int. Assoc. Hydrol. Sci. 2020, 382, 297–301. [Google Scholar] [CrossRef]
  38. Sobiesiak, M.; Poiata, N.; Bernard, P.; Rudzinski, L.; Lasocki, S. Automated detection and location of mining induced seismicity from Rudna Copper Mine, SW Poland. In Proceedings of the American Geophysical Union, Fall Meeting 2019, San Francisco, CA, USA, 9–13 December 2019. [Google Scholar]
  39. Krawczyk, A.; Grzybek, R. An evaluation of processing InSAR Sentinel-1A/B data for correlation of mining subsidence with mining induced tremors in the Upper Silesian Coal Basin (Poland). E3S Web Conf. 2018, 26, 00003. [Google Scholar] [CrossRef] [Green Version]
  40. Dubiński, J.; Stec, K.; Bukowska, M. Geomechanical and tectonophysical conditions of mining-induced seismicity in the Upper Silesian Coal Basin in Poland: A case study. Arch. Min. Sci. 2019, 64, 163–180. [Google Scholar] [CrossRef]
  41. Tatara, T. Dynamic Resistance of Building under Mining Tremors; Cracow University of Technology Press: Krakow, Poland, 2012. (In Polish) [Google Scholar]
  42. Pachla, F.; Tatara, T. Resistance of residential and rural buildings due to mining exploitation in the coal mining area. Zesz. Nauk. Inst. Gospod. Surowcami Miner. Energ. PAN 2017, 101, 45–60. (In Polish) [Google Scholar]
  43. Abaqus/Standard User’s Manual; Dassault Systèmes Simulia Corp: Johnston, RI, USA, 2020.
  44. Bednarski, Ł.; Sieńko, R.; Howiacki, T. Estimation of the value and variability of elastic modulus of concrete in the existing structures on the basis of continuous in situ measurements. Cem. Wapno Beton 2014, 6, 396–404. [Google Scholar]
  45. Azaria, M.; Hertz, D. Time delay estimation by generalized cross correlation methods. IEEE Trans. Acoust. Speech Signal Process. 1984, 32, 280–285. [Google Scholar] [CrossRef]
  46. Yahia, A.H.; El-Dahshan, E.-S.; Guirges, A.K. Time delay estimation, using correlation approaches applied to seismic time picking. J. Appl. Geophys. 2011, 10, 1–10. [Google Scholar] [CrossRef]
  47. Piersol, A. Time delay estimation using phase data. IEEE Trans. Acoust. Speech Signal Process. 1981, 29, 471–477. [Google Scholar] [CrossRef]
  48. Hanus, R. Time delay estimation using phase of cross-spectral density function. Meas. Autom. Robot. 2007, 53, 206–208. [Google Scholar]
  49. Hanus, R. Statistical errors of time delay estimation using phase of cross-spectral density function. Meas. Autom. Robot. 2006, 12, 10–13. [Google Scholar]
  50. Friedlander, B.; Francos, J.M. Model based phase unwrapping of 2-D signals. IEEE Trans. Signal Process. 1996, 44, 2999–3007. [Google Scholar] [CrossRef]
  51. Boroń, P.; Dulińska, J.; Jasińska, D. Two-Step Finite Element Model Tuning Strategy of a Bridge Subjected to Mining-Triggered Tremors of Various Intensities Based on Experimental Modal Identification. Energies 2021, 14, 2062. [Google Scholar] [CrossRef]
  52. Zahid, F.B.; Ong, Z.C.; Khoo, S.Y. A review of operational modal analysis techniques for in-service modal identification. J. Braz. Soc. Mech. Sci. Eng. 2020, 42, 398. [Google Scholar] [CrossRef]
  53. van Overschee, P.; de Moor, B. Subspace Identification for Linear Systems: Theory-Implementation-Applications; Kluwer Academic Publishers: Dordrecht, The Netherlands, 1996. [Google Scholar]
  54. Peeters, B.; de Roeck, G. Stochastic System Identification for Operational Modal Analysis: A Review. J. Dyn. Syst. Meas. Control 2001, 123, 659–666. [Google Scholar] [CrossRef]
  55. Allemang, R.J.; Brown, D.L. A Complete review of the Complex Mode Indicator Function (CMIF) with applications. In Proceedings of the ISMA2006: International Conference on Noise and Vibration Engineering, Leuven, Belgium, 18–20 September, 2006; pp. 3209–3246. [Google Scholar]
  56. Kim, B.H.; Stubbs, N.; Park, T. A new method to extract modal parameters using output-only responses. J. Sound Vib. 2005, 282, 215–230. [Google Scholar] [CrossRef]
  57. Cao, S.; Nian, H.; Yan, J.; Lu, Z.; Xu, C. Modal analysis and damage localization in plate-type structures via TDD and PE methods based on the data of an integrated highspeed camera system. Mech. Syst. Signal Process. 2022, 178, 109309. [Google Scholar] [CrossRef]
  58. Ewins, D.J. Modal Testing: Theory, Practice, and Application, 2nd ed.; Research Studies Press Ltd.: Philadelphia, PA, USA, 2000. [Google Scholar]
  59. Sung, Y.-C.; Lin, T.-K.; Chiu, Y.-T.; Chang, K.-C.; Chen, K.-L.; Chang, C.-C. A bridge safety monitoring system for prestressed composite box-girder bridges with corrugated steel webs based on in-situ loading experiments and a long-term monitoring database. Eng. Struct. 2016, 126, 571–585. [Google Scholar] [CrossRef]
Figure 1. The time history of the ground acceleration registered in the USCB region: (a) horizontal direction WE; (b) horizontal direction NS; (c) vertical direction Z.
Applsci 12 07036 g001
Figure 2. The analyzed bridge located in Chrzanów, Southern Poland.
Applsci 12 07036 g002
Figure 3. The side view of the bridge with main dimensions [m].
Applsci 12 07036 g003
Figure 4. The geometry and main dimensions of the deck cross-section of the bridge [cm].
Applsci 12 07036 g004
Figure 5. Vibroseis location during in situ tests.
Applsci 12 07036 g005
Figure 6. (a) The location on the second pier; (b) the details of accelerometers mounting.
Applsci 12 07036 g006
Figure 7. Layout of measurement points for evaluation of modal properties of the bridge.
Applsci 12 07036 g007
Figure 8. Comparison of the basic modes of vibration of the bridge obtained in the experimental and the numerical way.
Applsci 12 07036 g008
Figure 9. Acceleration component of the frequency 14 Hz registered at point: (a) P1, (b) P2, (c) P3.
Applsci 12 07036 g009
Figure 10. The cross-correlation functions for signal pair: (a) P1–P2, (b) P1–P3, (c) P2–P3.
Applsci 12 07036 g010
Figure 11. The wave velocities obtained for different soil conditions between particular piers: d-distance, τ-time delay, v-wave velocity.
Applsci 12 07036 g011
Figure 12. The function of phase angle in wrapped form for pairs: (a) P1–P2, (b) P1–P3, (c) P2–P3.
Applsci 12 07036 g012
Figure 13. The function of phase angle in unwrapped form for pairs: (a) P1–P2, (b) P1–P3, (c) P2–P3.
Applsci 12 07036 g013
Figure 14. The horizontal (WE) acceleration-time histories of subsequent bridge supports generated on the basis of the SMIKE model: (af) subsequent supports.
Applsci 12 07036 g014
Figure 15. Representative points chosen for the dynamic analyses.
Applsci 12 07036 g015
Figure 16. Time-stress histories obtained for the SMIKE model with the empirical parameters v = 240 m/s and α = 7 (red line) and for the classic Uniform Model of Excitation (black line) at representative points: (a) C1 (over the first column), (b) S2 (in the middle of the second span), (c) L3 (in the middle of the third span).
Applsci 12 07036 g016
Figure 17. The SMIKE Model (red line) vs. the Uniform Model of Excitation (black line): (a) the comparison of the maximal principal stress envelopes, (b) the stress envelope ratio: SMIKE to uniform model.
Applsci 12 07036 g017
Figure 18. Time-stress histories obtained for the SMIKE model with the wave velocities: 240 m/s (red line), 600 m/s (violet line), 1000 m/s (blue line), 2000 m/s (green line), and for the uniform excitation (black line) at representative points: (a) S2 (in the middle of the second span), (b) L3 (in the middle of the third span).
Applsci 12 07036 g018
Figure 19. The SMIKE Model vs. the Uniform Model of Excitation: (a) comparison of the maximal principal stress envelopes, (b) the stress envelope ratio: SMIKE model to uniform model.
Applsci 12 07036 g019
Figure 20. The dependence of maximal principal stresses on the wave propagation velocity for points: (a) L1-L5 (on the slender span), (b) S1, S2, S4, S5 (in the middle of the stocky spans).
Applsci 12 07036 g020
Figure 21. The SMIKE vs. “delayed replicas” models: (a) the stress envelopes obtained with the SMIKE model (red line), the delayed replicas model (blue line), (b) the stress envelope ratios: SMIKE to delayed replicas model.
Applsci 12 07036 g021
Table 1. Amplification factor depending on the tremor’s energy and subsurface soil type and thickness.
Subsurface TypeAmplification Factor for Tremor Energy:
105 [J]106 [J]107 [J]
Rock1.01.01.0
Quaternary 22 m0.71.42.2
Quaternary 15 m2.14.4-
Quaternary and tertiary 70 m0.61.41.4
Table 2. Comparison of experimental and numerical values of natural frequencies.
ModeNatural Frequency [Hz]Differences [%]
FE Analysis Model No. 1OMA
11.571.504.6
21.872.4824.6
33.483.363.6
414.3014.260.3
Table 3. Characteristics of excitation series executed during the in situ test.
Series No.12345
Frequency range [Hz]8–508–258–158–288–50
Table 4. The wave velocities between piers determined from the cross-correlation functions.
Wave Component Frequency [Hz]Wave Velocity Determined for Support Pairs [m/s]
P1–P2P2–P3P1–P3
10135344254
12142298239
14148304245
16148307250
Mean apparent velocity142.5313.2247.1
Table 5. The mean value of the wave velocity between supports determined by the unwrapped phase angle function.
Wave Component Frequency [Hz]Wave Velocity Determined for Support Pairs [m/s]
P1–P2P2–P3P1–P3
10130335247
12140280229
14144297240
16151297245
Mean apparent velocity141.0302.0239.9
Table 6. The differences in the wave velocities obtained from the cross-correlation and the phase angle method for particular support pairs.
Wave Component Frequency [Hz]Differences [%] in the Wave Velocities Obtained with
Different Methods for Support Pairs
P1–P2P2–P3P1–P3
103.72.62.8
121.46.04.2
142.72.32.0
162.13.32.0
Mean apparent velocity1.13.62.9
Publisher’s Note: MDPI stays neutral with regard to jurisdictional claims in published maps and institutional affiliations.