Article

Skin Temperature: The Impact of Perfusion, Epidermis Thickness, and Skin Wetness

1
Department of Physics, Toronto Metropolitan University, Toronto, ON M5B 2K3, Canada
2
Swift Medical Inc., Toronto, ON M5H 3W4, Canada
Appl. Sci. 2022, 12(14), 7106; https://doi.org/10.3390/app12147106
Submission received: 9 June 2022 / Revised: 7 July 2022 / Accepted: 11 July 2022 / Published: 14 July 2022

Abstract

:

Featured Application

It was found that skin perfusion and epidermis thickness are the primary drivers of skin temperature variations. These findings can be used in thermographic assessments of microcirculation in extremities and debridement guidance in wound care.

Abstract

This work aimed to elucidate the primary factors which affect skin temperature. A simple thermophysical model of the skin, which accounts for radiative, convective, and evaporative heat losses, has been developed to address it. The model is based on the skin’s morphology and consists of passive (nonviable tissue) and active (viable tissue) layers. The bioheat equation was solved for these layers using realistic assumptions. It was found that other than the ambient temperature, blood perfusion and epidermis thickness are the primary factors responsible for the skin temperature variations. The main temperature drop in the skin is attributed to the cooling of the blood in the venous plexus. The temperature drop in the epidermis is on the scale of 0.1 °C for the normal epidermis but can be 1.5–2 °C or higher in calluses. Thus, local skin temperature variations can indicate the epidermis thickness variations, particularly in callus-prone areas. The effects of relative air humidity and skin wetness on skin temperature were also quantified. The presence of free moisture on the skin (e.g., wet wound) significantly increases the heat transfer, resulting in a skin temperature drop, which can be on the scale of several degrees Celsius. The relative air humidity significantly contributes (by slowing heat dissipation) only in the case of evaporative heat loss from wet skin. Therefore, wet skin is undesirable and should be avoided during a thermographic assessment.

1. Introduction

Thermography is a well-established technology with multiple applications ranging from astronomy to military to construction and building maintenance. It gradually penetrates the healthcare space, including public health and clinical applications. Temperature screening for fever is by far the most well-known healthcare-related application of thermography. However, the utility of medical thermography goes far beyond this application.
Core body temperature and skin temperature are two important concepts in medical thermography. Core body temperature refers to the temperature of the body’s internal organs, such as the heart, liver, brain, and blood. The average normal core body temperature is generally accepted as being 37 °C. The core body temperature is tightly regulated by peripheral and central receptors integrated within the hypothalamus [1].
In contrast to the core temperature, the skin temperature changes with the temperature of the surroundings. The skin is the body’s largest organ, covering approximately 2 sq·m, which plays a vital role in thermoregulation. Together with adipose tissues, it provides thermal insulation to the body. In addition, it functions as a “heat radiator” system, which is responsible for approximately 90% of body heat loss.
Even though public health thermographic screening is based on measuring the core body temperature (or its proxy), most clinical applications of thermography exploit the skin temperature to make conclusions about local tissue physiology or pathology.
The clinical applications of thermography in surgery, wound care, and sport medicine were recently reviewed in [2]. The literature review identified two primary use scenarios for thermographic imaging: inflammation-based and perfusion-based.
The blood flow to the skin is the most effective mechanism for heat transfer from the body core to the environment. Therefore, the skin temperature is subject to changes and is usually lower than the core [3].
The balance of the thermal exchange between internal and external environments is sometimes described by a so-called Delta, which is the difference between the core temperature and skin temperature. In normal conditions, the Delta is around 3.6 °C (normal core temp is 36.6 °C, normal skin temperature is 33 °C). The deviations from this norm can be indicative of inflammation (elevated local temperature) or reduced perfusion (decreased local temperature).
While the medical applications of thermography have been known at least since the 1930s [4], its widespread adoption in routine medical practice beyond clinical research and thermographic screening for fever has not started yet. Two primary factors explain it: (a) the technology is expensive for routine clinical use, and (b) there are no simple clinical algorithms.
The cost barrier is about to change with an influx of inexpensive uncooled long-wave infrared (LWIR) bolometers. While multiple evidence-based criteria have been proposed on the clinical algorithm side, there are no analytical explanations for these empirical rules of thumb [5]. Thus, building thermophysical models is important in driving clinical technology adoption.
This article aimed to elucidate and quantify the primary factors which impact skin temperature. Some of them (e.g., blood perfusion and ambient temperature) are well known [6]. Thus, the primary aim of this article was to identify and quantify other relevant factors.
While multiple skin heat transfer models have been proposed, they mostly use either numerical methods [7,8,9,10] or Monte Carlo [11] simulations. Even though these approaches are the only way to solve the transient bioheat equations for complex geometries, some situations (namely thermal acclimation) can be approximated well be stationary solutions. Fortunately, thermal acclimation is a standard for passive thermographic measurements at healthcare facilities.
Based on the skin morphology and physiology, we have developed a simple thermophysical model, which has analytical solutions and allows simple interpretation and verification.
The role of epidermis thickness and blood perfusion on heat transfer in the skin was investigated in other settings (e.g., contact burn injury onset [12], surface contact heating and spatially distributed heating [13], or the thermal management of an epidermal electronic devices/skin system [14]). However, to the best of our knowledge, this is the first analytical attempt to connect these factors for diagnostics purposes in podiatry and wound care. In addition, while the effect of relative air humidity and skin wetness on skin temperature is well known in clinical practice, they have not received proper attention from an analytical perspective. The developed model allows assessing the impact of relative air humidity and skin wetness on skin temperature.

2. Materials and Methods

2.1. Tissue Model

Human skin and mucosal tissues have a complex, layered structure. We can group the covering tissues into bloodless epithelium, the blood-containing papillary layer of the dermis (skin), lamina propria (mucosa), and underlying tissues. In turn, the epithelium consists of the stratum corneum and living epidermis, which receives oxygen and nutrients through diffusion from capillaries in the papillary layer. Thus, the thickness of living cells’ epithelial layers is limited by the diffusion length of the oxygen and typically does not exceed 100 μm. However, the stratum corneum, which includes “non-supplied” cells, can be thicker in some organs. For example, in hairy skin, the epidermis is less than 0.1 mm thick, and the dermis is 1–2 mm deep. On the other hand, the dermis and epidermis can be 3 mm and 1.5 mm in the glabrous skin, respectively [15].
The important aspect of the dermis for our analysis is the relative uniformity of its thickness across body parts (intrapatient) and individuals (interpatient).

2.2. Heat Transfer Model

Human skin can be modeled using the bioheat equation by Pennes [16],
ρ C T t = k 2 T + ρ b C b ω b ( T b T ) + Q
where ρ, C, T, k, and Q denote the tissue density (kg/m3), the specific heat of the tissue (J/kg∙K), local tissue temperature (K), the thermal conductivity of the tissue (W/m∙K), and metabolic heat generation per unit volume (W/m3), respectively. ρb, Cb, Tb, and ωb represent the blood density (kg/m3), specific heat of the blood (J/kg∙K), arterial blood temperature (K), and blood perfusion rate (m3/s/m3), respectively.

2.3. Heat Sources and Heat Losses Mechanisms

The heat in the body can be produced by cell metabolism (the last term in Equation (1)). The heat also can be transferred by blood flow (the second term on the right side of Equation (1)).
The tissue can also dissipate heat (negative heat source) using radiation, evaporation, and convection. In normal conditions, radiation is the most significant source accounting for approximately 60% of heat loss [17]. At rest, evaporation accounts for 22% of heat loss. However, sweating (evaporation) is the primary means of cooling the body during exercise. Different heat loss mechanisms interplay with each other. For example, evaporation and conduction of the air are accelerated by convection. The energy transfer (and skin temperature) is also determined by the surrounding environment’s temperature and moisture.
The radiative heat loss of the human skin in the ambient air [W/m2] can be described as
q r = ε σ ( T s k i n 4 T 4 )
where Tskin and T are the skin and ambient air temperatures [K], σ is the Stefan–Boltzmann constant, and ε is the emissivity of the skin. The emissivity of human skin is close to the perfect blackbody. It is at least 0.91 in the MWIR range and even higher (0.97–0.98) in the LWIR range [2]. Because the human body acts almost like a blackbody, it is very well suited for thermographic assessment. In particular, the reflected energy flow, which may impact measurements, is typically relatively minimal.
The convective heat loss can be described as
q c = h c ( T s k i n T )
where hc is a heat transfer coefficient due to convection [W/m2/K]. The heat transfer coefficient can be estimated in two important cases: free convective flow and forced convection [18]
h c = { 2.44 ( T s k i n T ) 0.25 , f r e e   c o n v e c t i v e   f l o w 12.4 v 0.5 ,   f o r c e d   c o n v e c t i o n
Here v is the air velocity [m/s].
Evaporation can be insensible and liquid. In most cases of thermographic assessments, liquid evaporation can be ignored. However, evaporation can have a significant contribution to nonintact skin. In particular, one known problem with thermography is the distortion in the image caused by evaporative water loss in the wound bed. Thus, we will consider both mechanisms.
The insensible evaporative heat loss assumes no visible sweating on the skin. It can be estimated as being 6% of the maximum rate of evaporative heat loss qev(max) [19]. where
q e v ( max ) = 0.0166 h c ( P s k i n P )
Here, Pskin and P are the skin and atmospheric water vapor pressures, respectively [Pa]. It should be noted that the skin surface is assumed to be at saturated vapor pressure, and the atmosphere has a fractional relative humidity, RH.
The saturated vapor pressure Psat [Pa] at temperature T [K] can be approximated as
P s a t ( T ) = 3.99 × 10 5 × 10 0.0265 T
The liquid heat loss is dependent on the latent heat loss of evaporation (for water c = 2461 kJ/kg), the difference in the vapor pressures at the skin surface and the atmosphere, and the relative area of the skin covered with the sweat W:
q e v , l i q = 5.45 × 10 3 h c W ( P s k i n P )
While in some sources (see, e.g., [11]), W is called the skin humidity, this term can be ambiguous. Thus, to avoid confusion, we will use the term “skin wetness” instead to signify the presence of visible free moisture. In general, if we refer to large skin areas partially covered by moisture (e.g., sweat), then 0 ≤ W ≤ 1. However, for local patches of skin, this parameter can be perceived as binary, where W = 0 and 1 respectively correspond to dry and entirely wet skin.
Thus, the total heat loss can be described as
q = q r + q c + q e v = ε σ ( T s k i n 4 T 4 ) + h c ( T s k i n T ) + ( 9.66 × 10 4 + 5.45 × 10 3 h c W ) ( P s a t ( T s k i n ) R H   P s a t ( T ) )
The first and second operands in the third term are responsible for insensible and liquid evaporation, respectively.
Based on the briefly described skin model, we can consider the following simplistic two-layer model from a heat source perspective. Nonviable tissue, where there is no internal metabolic heat generation, covers the viable tissue, which produces heat through metabolic processes. In addition, the viable tissue is in contact with the heat reservoir (deep vascular plexus), which is supplied with blood heated to the core body temperature Tc. The blood transfers its heat to surrounding tissues in the deep vascular plexus, and its temperature drops to Tp.
The nonviable tissue can be associated with the epidermis and viable with the dermis. It should be noted that a part of the epidermis produces bulk heat through metabolic processes (living epidermis). However, as we mentioned already, the thickness of this layer is limited by the oxygen diffusion length and cannot significantly exceed 100 μm. Thus, potentially we can combine this transitioning layer with the viable tissue. However, as we will see later, its effect will be negligible. So, for simplicity, we will refer to the epidermis and dermis as nonviable and viable tissues, respectively.
The dermal and epidermal layers are isolated from other body parts by the adipose layer. The thickness of the adipose layer varies significantly between various body parts and individuals. However, it is characterized by a low thermal conductivity. So, if we (a) ignore areas over large blood vessels and (b) limit ourselves to thermographic measurements at healthcare facilities (thus, resting conditions in a controlled environment), we can consider the skin layer and its deep vascular plexus as being isolated from other body parts.
This model can be translated into a simple heat transfer model. The viable (active) tissue of the thickness D, held at the constant temperature Tp from one side is covered with a homogeneous layer of the nonviable (passive) tissue with the thickness E. The passive layer is in contact with the air at temperature T.
This model can be effectively reduced to a 1D model (along the z-axis). For simplicity, we can select the border between the reticular dermis and the subcutaneous fat (where the deep vascular plexus is located) as the origin.

2.4. Epidermis

Taking into account that we are looking for stationary solutions, Equation (1) for the nonviable (passive) tissue can be reduced to
d 2 T d z 2 = 0 ,   for   z = [ D ,   D + E ]
with two boundary conditions. On the lower boundary (with dermis), we can write
T | z = D = T d
Here Td is a temperature at the dermal/epidermal interface. On the upper boundary (with air), using Equation (8),we can write
k e d T d z   | z = D + E = q
Here Tskin is the temperature at the epidermis/air interface.

2.5. Dermis

In this study, we are looking for stationary solutions. Equation (1) for the viable tissue with bulk heat generation Q can be reduced to
k d d 2 T d z 2 + Q = 0 ,   for   z = [ 0 ,   D ]
with four boundary conditions: two on the lower boundary (with deep vascular plexus)
T | z = 0 = T p k d d T d z   | z = 0 = ρ b C b L ω b ( T c T p )
Here, L is the thickness of the deep vascular plexus. Additionally, on the upper boundary (with epidermis)
T | z = D = T d k d d T d z   | z = D = q
Here we observed that there is no heat loss or production in the epidermis layer.

2.6. Model Parameters

The normal body temperature is generally accepted as 37 °C [8]. Other blood properties can be found as follows: the specific heat of blood Cb = 3770 J kg−1 K−1; density of blood ρb = 1060 kg m−3 [20]. The thickness of the deep vascular plexus, L, is 0.08–0.12 mm [21], so it can be selected as 0.1 mm. Other model parameters are presented in Table 1.

3. Results

We can find a solution for each layer separately and then stitch them together at the dermis/epidermis interface. However, we started by analyzing the effect of moisture on heat losses.

3.1. Heat Losses

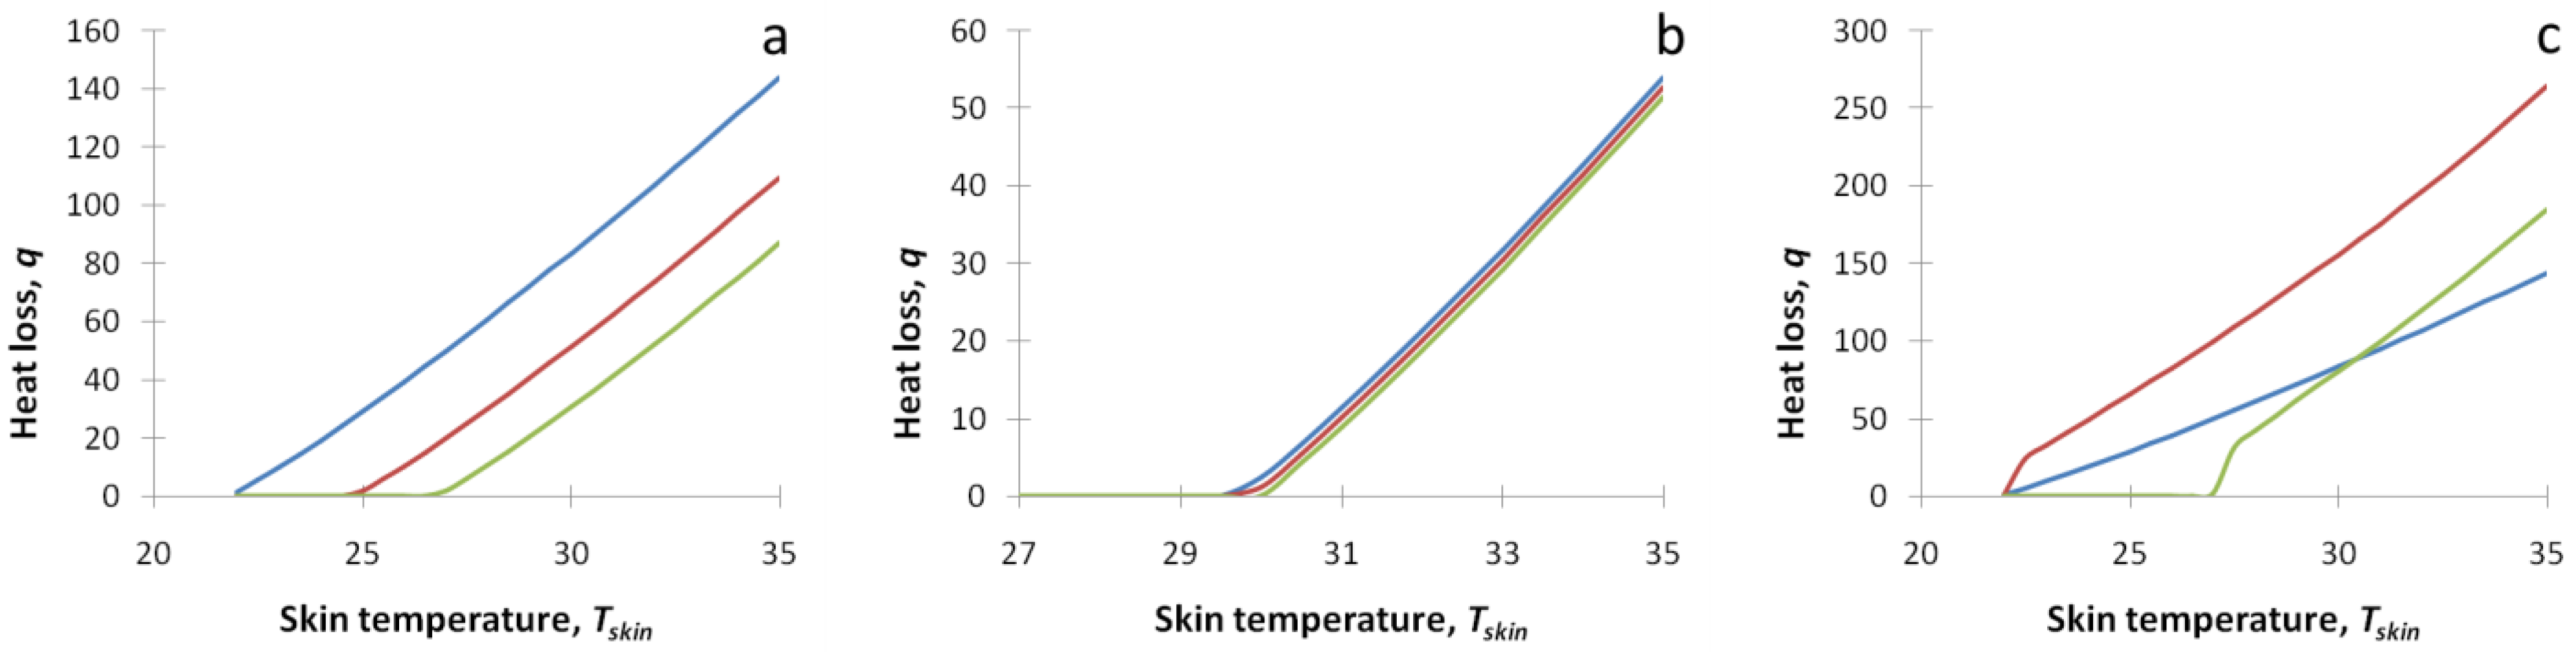
We have plotted the heat loss function Equation (8) as a function of the skin temperature Tskin in several realistic conditions. The results are presented in Figure 1. On panel a: q(Tskin) is plotted for various values of the ambient temperature T (22 °C—blue line, 25 °C—red line, 27 °C—green line). On panel b: q(Tskin) is plotted for various values of the relative humidity, RH (40%—blue line, 70%—red line, 100%—green line), T = 30 °C. On panel c: q(Tskin) is plotted for various values of the skin wetness, W. (T = 22 °C, W = 0—blue line, T = 22 °C, W = 1—red line, T = 27 °C, W = 1—green line). Skin emissivity ε was set to 0.98.
The obtained expression for the heat loss Equation (8) contains non-linear terms, which complicates the analytical analysis. Fortunately, looking into Figure 1, one can see that the combined heat loss is very close to a linear function of the temperature gradient TskinT. Thus, for realistic conditions of the thermographic assessment in a controlled environment, we can linearize the heat loss function in a narrow range of parameters.
As a result, we can get a linear approximation for heat loss that accounts for radiative, convection, and evaporative mechanisms
q = q 0 + h ( T s k i n T )
where h is an effective heat transfer coefficient. This expression can be substituted into boundary conditions Equations (11) and (14). q0 can be obtained explicitly from Equation (8) (Tskin = T), and h can be obtained from the linearization of Equation (8) at room temperature.
h = 4 ε σ T 3 + 5 h c 4 0.061 ( 9.66 × 10 4 + 5.45 × 10 3 h c W ) P s a t ( T ) e 0.061 ( T T ) + 5.45 × 10 3 h c P s a t ( T ) W 4 ( T T ) ( e 0.061 ( T T ) R H )
q 0 = ( 9.66 × 10 4 + 5.45 × 10 3 h c W )   P s a t ( T ) ( 1 R H )
which needs to be evaluated at T.
The last term of Equation (16) is specific for free convection flow. It diverges for RH < 1 and W > 0, which is manifested as the increased slope near T = T on Figure 1c. For practical purposes, Equation (16) can be evaluated at some small distance from T (e.g., 0.5 °C off, where the temperature dependence becomes linear). Alternatively, it can be evaluated numerically.
The effective heat transfer coefficient, h, at room temperature can be estimated as 12 W/m2/K for dry skin (W = 0) and 21 W/m2/K for wet skin (W = 1).Therefore, we will use h = 12 W/m2/K for dry skin as a baseline in the further calculations. Additionally, it should be noted that the impact of the relative air humidity (third and fourth terms in Equation (16)) on the effective heat transfer coefficient, h, is relatively minimal (0.5 W/m2/K or less for T = 22 °C) even for wet skin (W = 1) and can be ignored for practical purposes.
As Psat changes from 2645 Pa at 22 °C to 5847 Pa at 35 °C, q0 in the case of free convection flow can be ignored for the most practical applications if the skin is dry (W = 0). If W > 0, then the effect of the relative air humidity on q0 can be significant. In Figure 2a,b, one can see the dependence of the heat loss function on the skin temperature in the case of wet skin (W = 1).
It should be noted that for free convection flow, hc(T) = 0. Thus, for practical purposes, to find q0, Equation (17) can be evaluated at some small distance from T (e.g., 0.1 °C off).
Focusing on the controlled environment during a thermographic assessment, we will ignore the q0 term for epidermis thickness and blood perfusion influence analysis. Instead, its impact will be analyzed in Section 3.4 separately.

3.2. Dependence on Epidermis Thickness

The solution of Equation (9) with boundary conditions Equations (10) and (11) is a linear function. Thus, we have a linear temperature drop in the passive layer from Td (interface with the dermis) to Tskin (interface with the air). However, as the temperature profile within the passive layer is not measurable and has few practical applications, we can use the overall temperature drop across the passive layer (ΔTe) instead. Thus, we can write
T d = T s k i n + Δ T e
where
Δ T e = h ( T s k i n T ) E / k e
Thus, if we measure the skin temperature Tskin and know the passive layer thickness, E, we can calculate the temperature drop ΔTe and the dermis temperature, Td.
Alternatively, we can derive the expression for Tskin
T s k i n = T d + T h E / k e 1 + h E / k e
Then, assuming the constant dermal temperature Td, by measuring Tskin, we can estimate the epidermal thickness, E. In particular, the dependence of the Tskin on the epidermal thickness E can be assessed as
Δ T s k i n = T s k i n E Δ E = ( T d T ) h / k e ( 1 + h E / k e ) 2 Δ E
We can estimate the expected dependence using realistic numbers for all parameters and variables in Equation (21). For realistic epidermal thicknesses (the 0.1–2 mm range), the primary factor will be Δ T s k i n / Δ E ~ ( T d T ) h / k e which corresponds to the case of a thin epidermis. It limits the Δ T s k i n / Δ E from above can be as high as 0.765 °C/mm for a 15 °C difference between the dermal and ambient temperature for a thin (e.g., 0.1 mm) epidermis. For a thicker (e.g., 2 mm) epidermis, Equation (21) can be 20% smaller: around 0.6 °C/mm. Thus, a 1.2–1.5 °C temperature drop over a 2 mm callus accumulation can be expected.
Equation (19) for ΔTe can be rewritten in terms of Td:
Δ T e = ( T d T ) h E / k e 1 + h E / k e
In Figure 3, one can see the dependence of the epidermal temperature drop, ΔTe, as a function of the passive layer thickness E for several dermal temperatures/ambient temperature gradients: (TdT) 15 °C (solid red) and 10 °C (dashed blue).

3.3. Dependence on Perfusion

The solution of Equation (12) with boundary conditions Equations (13) and (14) is a quadratic function. Thus, in the active (dermal) layer
T = Q z 2 2 k d + C 1 z + C 2
From the boundary conditions on the lower boundary Equation (13), we can find that C 1 = ρ b C b ω b ( T c T p ) / k d and C 2 = T p .
Then, substituting Equation (23) into the boundary condition on the upper boundary Equation (14), we can write
T | z = D = T d = T p ρ b C b ω b ( T c T p ) L k d D Q 2 k d D 2
k d d T d z   | z = D = h ( T s k i n T ) = Q D + ρ b C b ω b ( T c T p ) L
The skin temperature Tskin can be linked to the dermal temperature Td using Equation (20). In particular, Equation (25) can be transformed into
T d = T + Q D + ρ b C b ω b ( T c T p ) L h ( 1 + h E / k e )
We can solve Equations (24) and (26) for Tp
T p = T c T c T Q D   h ( 1 + h E k e ) Q 2 k d D 2 1 + ω b / ω ˜
Here ω ˜ 1 = ρ b C b L h ( 1 + h D k d + h E k e ) .
However, Tp is not observable, so it does not have a high practical value. By substituting Tp into Equation (25), we can obtain an explicit expression for the observable Tskin.
T s k i n = T + Q D + ρ b C b L ω b T c T Q D   h ( 1 + h E k e ) Q 2 k d D 2 1 + ω b / ω ˜ h
This expression can be estimated in two important limits:
  • In the case of very low perfusion (ωb→0), we have T s k i n = T + Q D h
  • In the case of very high perfusion (ωb→∞), we have T s k i n = T c ( T c T ) ( h D k d + h E k e )
We can estimate factors in Equations (27) and (28). Using realistic assumptions, we can get Q D   h = 0.033   ° C , Q D 2 2 k d = 7.5 × 10 4   ° C , h D k d = 0.045 , h E k e = 0.0057, 0.086, and 0.11 for the dry hairy skin, dry glabrous epidermis, and 2 mm callus, respectively.
Based on Equation (20), we can write an explicit expression for the temperature drop across the skin (Delta):
D e l t a = ( T c T ) 1 + ω b /   Ω ˜ 1 + ω b / ω ˜
Here Ω ˜ 1 = ρ b C b L ( D k d + E k e ) . The dependence of temperature drop across the skin (Delta) on perfusion for several ambient temperatures is depicted in Figure 4. To maintain this temperature drop constant, the body needs to adjust the perfusion rate in the broad range. The calculated perfusion rate to keep Delta at 3.5 °C as a function of the ambient temperature, T is shown on insert in Figure 4.
Knowing Delta, the perfusion rate can be explicitly expressed
ω b = ( T c T D e l t a 1 )   / ( 1 ω ˜ T c T D e l t a 1   Ω ˜ )

3.4. Impact of Skin Wetness

As we saw before, moist skin has a higher (almost by two times) heat transfer coefficient h. It also contains the noticeable offset q0. Thus, we need to include both factors in the analysis to analyze the impact of skin wetness on skin temperature. In this case, Equation (25) can be rewritten as
k d d T d z | z = D = q 0 + h ( T s k i n T ) = Q D + ρ b C b ω b ( T c T p ) L
As we found, Q D h and Q 2 k d D 2 are small. Thus, by ignoring them after some simple calculations similar to Equations (26)–(28), we can get the expression for skin temperature, which accounts for skin wetness and relative air humidity
T s k i n = T c + T h h ˜ q 0 / h ˜ 1 + h / h ˜
Here h 1 ˜ = 1 ρ b C b L ω b + D k d + E k e .
Based on Equation (32), we can estimate the difference in the skin temperature between dry and wet skin if other things are equal. If we characterize the dry skin by h1 = 12 W/m2/K and q0 = 0 and wet skin by h2 = 21 W/m2/K and q0 = 22 W/m2 (RH = 40% at T = 22 °C), then for ωb = 0.1 1/s, we will get T 1 T 2 0.114 ( T c T ) + 0.36 , which will translate into a 2.07 °C temperature drop over the moist area for T = 22 °C and free convection flow. The high relative humidity (RH = 100%) will decrease q0 effectively to zero while having a minor impact on the effective heat transfer coefficient, h. In this case, the temperature drop over the wet area will reduce to 1.7 °C.

4. Discussion

Our primary finding is that the temperature drop across the skin depends on the temperature gradient between the core body temperature and ambient air. Thus, the ambient temperature is a crucial factor in any thermographic measurement. For example, according to Equation (29), the change in ambient temperature from 22 to 27 °C will result in a one-third decrease in Delta. So, any thermographic measurement needs to be considered in the context of the ambient temperature. To normalize results on the ambient temperature, Delta/(TcT) ratio can be used instead.
The difference between the core body temperature and the skin temperature, Delta, can be decomposed into the sum of three factors:
D e l t a = T c T p + Δ T d + Δ T e
Here ΔTd and ΔTe are the temperature drop in the dermis and epidermis, respectively.
The temperature drop in the epidermis, ΔTe, is relatively small (0.1 °C) for most body parts (non-glabrous skin). However, it can be on a scale of 0.5–1 °C for glabrous skin and 1.5–2 °C or even higher for calluses. These results are in line with clinical observations [22], see Figure 5. In this particular case of a routine foot examination in a wound care clinic, the callus-related skin temperature drop is on the scale of 4 °C.
These findings can have practical applications in podiatry and wound care. While in many cases, calluses are harmless, if not removed timely, they may lead to skin ulceration or infection, which is of particular importance for patients with diabetes. Thus, the removal of calluses is an essential part of surgical debridement. However, in many cases, healthcare professionals experience problems with their identification. While corns are typically clearly visible, calluses are often not clearly visible. Consequently, some areas of dead skin can be missed during debridement. Thermal imaging can help identify these areas.
The bulk heat generation in the dermis leads to minimal effects on the scale of 0.03 °C. Due to high thermal conductivity and low metabolic heat production in the dermis, the temperature drop in the dermis, ΔTd, is relatively small and can be ignored in most practical applications. This observation also supports our assumption that the fine structure of the dermis can be omitted from a thermophysical perspective. The superficial vascular plexus and blood moving through capillaries do not change the thermal distribution significantly. The primary player is the deep vascular (reticular) plexus, the largest skin blood reservoir.
The main temperature drop occurs at the deep vascular plexus, and its temperature is regulated primarily through perfusion. Thus, the heat exchange in the venous plexus is the primary driver of the difference between the core body and skin temperatures.
We also investigated the impact of skin wetness on skin temperature. The skin wetness significantly increases the skin’s heat transfer, resulting in a lower temperature of the wet skin area. In the case of free convection flow, the magnitude of the temperature decrease can be on the scale of 2 °C. However, it can be higher in areas with moving air. Therefore, evaporative heat dissipation impact measurements of the wound bed temperature significantly. The problem can be solved by allowing the wound to dry completely (which may delay the timing of the assessment) or by applying a non-permeable covering to the wound bed, which eliminates the evaporation problem [23]. However, the non-permeable covering may also affect the skin’s temperature [14].
The relative humidity of air does affect heat dissipation as well. However, its effect is noticeable only for evaporative heat loss from the moist skin. Figure 1b displays the heat loss functions for various relative humidity (40, 70, and 100%) at T = 30 °C for dry skin. One can see that the curves look almost identical. However, the heat loss function in the case of moist skin (see Figure 2) depends on the relative humidity quite significantly. The high relative humidity effectively inhibits the evaporation heat loss mechanism in free convection flow. The effect is two-fold: it reduces the coefficient q0 (primary outcome) and effective heat transfer coefficient h (minor effect). Less effective heat dissipation results in a higher skin temperature.
Our model consists of four tissue-related parameters (perfusion ωb, dermis thickness D, epidermis thickness E, and skin wetness, W), one systemic parameter (core body temperature, Tc), and two environmental parameters (ambient temperature, T, and relative air humidity, RH).
The tissue-related parameters are responsible for local skin temperature variations. However, visible free moisture (either perspiration or wet wound) is an undesirable condition that must be avoided during thermographic measurements. In addition, dermis thickness is relatively consistent across body parts and individuals. Thus, we can conclude that only two parameters (perfusion ωb and epidermis thickness E) are model variables contributing to local skin temperature variations in the controlled environment of the thermographic assessment.
The core body temperature, Tc, and environmental parameters (ambient temperature, T, and relative air humidity, RH) are responsible for the absolute value of the skin temperature. However, the relative air humidity is a significant contributor just in the case of moist skin, which, as already mentioned, is undesirable and should be avoided during the thermographic assessment. Thus, in practice, the absolute skin temperature depends on two factors: the core body temperature, Tc, and ambient temperature, T. However, in the absence of fever, the core body temperature, Tc, can be considered a constant.
Based on these observations, three types of local thermal abnormalities are possible: (a) increased perfusion (e.g., inflammation), (b) reduced perfusion (e.g., ischemia), and (c) epidermis thickness abnormality (callus). For example, local variations (decrease) of the skin temperature can be indicative of the epidermis thickness variations, particularly in callus-prone areas.
The perfusion rate ωb can be reconstructed from the observed Delta using Equation (30) and compared with physiological estimates. Assuming that the resting skin blood flow in thermoneutral environments is approximately 250 mL/min [24], 2 s·q·m of the total skin surface, and taking into account that all skin blood goes through the deep vascular plexus, we can estimate that the perfusion rate of the deep vascular plexus is on the scale of 0.02 m3/s/m3, which is close to our estimate for 25 °C ambient temperature (thermoneutral zone)—see the insert in Figure 3. Thus, we can expect that 0.02 m3/s/m3 is a typical value for a thermoneutral environment. However, the perfusion rate may significantly exceed this basal level for exposed skin parts due to cutaneous vasodilation. For example, skin blood flow can reach 6 to 8 L/min during hypothermia [25].
Note that in our calculations and discussion, we refer to the perfusion rate at the deep vascular plexus. The average perfusion rate for the whole dermis sometimes reported in the literature will be more than 20 times lower.
Our results also support the notion that the absolute temperature is less relevant than the relative temperature (or temperature gradient). The absolute temperature for the large skin patches is regulated on the systemic level. Conversely, the temperature difference between two nearby points (e.g., wound vs. periwound), or a contralateral point, can indicate local abnormalities (wet wound, inflammation, reduced perfusion, or callus).
All results were derived under the assumption of complete acclimation and controlled conditions: room temperature, controlled humidity, and no extensive sweating (e.g., due to exercise). These assumptions are valid for most thermographic measurements in the healthcare environment. However, any departure from these assumptions may significantly impact the heat loss balance.
Other factors also affect skin temperature. The primary factors are gender and body fat. In a recent study, Neves et al. [26] found that women had lower skin temperature than men in the trunk and upper and lower limbs. They also found that body fat percentage affects trunk skin temperature most. In men, hand skin temperatures are positively correlated with body fat percentage. Facial skin temperature could be related to gender but not to body composition. These gender-related findings are probably valid for adults only, as Garcia-Souto et al. [27] found that out of 14 skin locations, the statistically significant gender-related difference in skin temperature was present in only one location (back of the hand) of infants and toddlers. They also found that the temperature of children’s forehead and limbs increases with age, and their core and skin temperatures seem to become more dependent on BMI with age maturation. Savastano et al. [28] found that in obese individuals, the fingernail–bed temperature was significantly higher (33.9 ± 0.7 °C compared with 28.6 ± 0.9 °C; p < 0.001), while the abdominal temperature was considerably lower (31.8 ± 0.2 °C compared with 32.8 ± 0.3 °C; p = 0.02) than in normal-weight individuals.
The model applies to any convection heat transfer mechanism (free convection flow and forced air). However, it is illustrated for free convection flow only as being practically relevant. To accommodate the forced air mechanism, minor adjustments to Equation (16) are required.
Additionally, results were derived under the assumption of a flat surface. Given that the surface curvature of body parts, κ, is much smaller than the reciprocal thickness of our model ( κ 1 / ( D + E ) ); it is hard to expect any meaningful effect of the curvature on the results’ validity. However, the heat dissipation can be different near curved parts. Thus, the heat loss Equation (8) and boundary conditions Equations (11) and (14) may need to be revisited for highly curved surfaces like fingers and toes.
In future work, we plan to validate our findings in phantom experiments (for epidermis thickness) and controlled experiments on healthy volunteers. We also plan to investigate the effect of body fat on skin temperature.

5. Conclusions

In addition to ambient temperature, skin blood perfusion and epidermis thickness are the primary factors impacting skin temperature. Our results support the notion that the absolute temperature is less relevant than the relative temperature (or thermal gradient). While the absolute temperature for the large skin patches is regulated on the systemic level, the thermal gradient can be indicative of the local abnormalities (e.g., inflammation, reduced perfusion, or callus). Wet skin (either perspiration or wet wound) is undesirable and should be avoided during the thermographic assessment.

Funding

This research received no external funding.

Institutional Review Board Statement

Not applicable.

Informed Consent Statement

Not applicable.

Data Availability Statement

Not applicable.

Conflicts of Interest

The author declares no conflict of interest.

References

  1. Sessler, D.I. Thermoregulatory defense mechanisms. Crit. Care Med. 2009, 37, S203–S210. [Google Scholar] [CrossRef] [PubMed]
  2. Ramirez-GarciaLuna, J.L.; Bartlett, R.; Arriaga-Caballero, J.E.; Fraser, R.D.J.; Saiko, G. Infrared thermography in wound care, surgery, and sports medicine: A review. Front. Physiol. 2022, 13, 838528. [Google Scholar] [CrossRef] [PubMed]
  3. Martinez-Jimenez, M.A.; Loza-Gonzalez, V.M.; Kolosovas-Machuca, E.S.; Yanes-Lane, M.E.; Ramirez-GarciaLuna, A.S.; Ramirez-GarciaLuna, J.L. Diagnostic accuracy of infrared thermal imaging for detecting COVID-19 infection in minimally symptomatic patients. Eur. J. Clin. Investig. 2021, 51, e13474. [Google Scholar] [CrossRef] [PubMed]
  4. Massopust, L. Infrared photographic study of the changing pattern of the superficial veins in a case of human pregnancy. Surg. Gynae. Obs. 1936, 63, 87–89. [Google Scholar]
  5. Frykberg, R.G.; Gordon, I.L.; Reyzelman, A.M.; Cazzell, S.M.; Fitzgerald, R.H.; Rothenberg, G.M.; Bloom, J.D.; Petersen, B.J.; Linders, D.R.; Nouvong, A.; et al. Feasibility and efficacy of a smart mat technology to predict development of diabetic plantar ulcers. Diabetes Care 2017, 40, 973–980. [Google Scholar] [CrossRef] [Green Version]
  6. Bowman, H.F. Estimation of tissue blood flow. In Heat Transfer in Medicine and Biology; Shitzer, A., Eberhart, R.C., Eds.; Plenum Press: New York, NY, USA, 1985; Volume 1, Chapter 9; pp. 193–230. [Google Scholar]
  7. Young, L.A.; Boehm, R.F. Finite difference heat transfer analysis of a percutaneous transluminal microwave angioplasty system. ASME J. Biomech. Eng. 1993, 115, 441–446. [Google Scholar] [CrossRef]
  8. Torvi, D.A.; Dale, J.D. Finite element model of skin subjected to a flash fire. ASME J. Biomech. Eng. 1994, 116, 250–255. [Google Scholar] [CrossRef]
  9. Chan, C.L. Boundary element method analysis for the bioheat transfer equation. ASME J. Biomech. Eng. 1992, 114, 358–365. [Google Scholar] [CrossRef]
  10. Çetingül, M.P.; Herman, C. A heat transfer model of skin tissue for the detection of lesions: Sensitivity analysis. Phys. Med. Biol 2010, 55, 5933–5951. [Google Scholar] [CrossRef]
  11. Deng, Z.S.; Liu, J. Mathematical modeling of temperature mapping over skin surface and its implementation in thermal disease diagnostics. Comp. Biol. Med. 2004, 34, 495–521. [Google Scholar] [CrossRef]
  12. Jiang, S.C.; Ma, N.; Li, H.J.; Zhang, X.X. Effects of thermal properties and geometrical dimensions on skin burn injuries. Burns 2002, 28, 713–717. [Google Scholar] [CrossRef]
  13. Gowrishankar, T.R.; Stewart, D.A.; Martin, G.T.; Weaver, J.C. Transport lattice models of heat transport in skin with spatially heterogeneous, temperature-dependent perfusion. BioMedical Eng. OnLine 2004, 3, 42. [Google Scholar] [CrossRef] [PubMed] [Green Version]
  14. Nie, S.; Zhang, C.; Song, J. Thermal management of epidermal electronic devices/skin system considering insensible sweating. Sci. Rep. 2018, 8, 14121. [Google Scholar] [CrossRef] [PubMed]
  15. Gould, J. Superpowerd skin. Nature 2018, 563, 584–585. [Google Scholar] [CrossRef] [PubMed]
  16. Pennes, H.H. Analysis of tissue and arterial blood temperatures in the resting human forearm. J. Appl. Physiol. 1948, 1, 93–122. [Google Scholar] [CrossRef] [PubMed]
  17. Koop, L.K.; Tadi, P. Physiology, Heat Loss; StatPearls Publishing: Treasure Island, FL, USA, 2021. Available online: http://www.ncbi.nlm.nih.gov/books/NBK541107/ (accessed on 3 June 2022).
  18. Fanger, P.O. Thermal Comfort: Analysis and Applications in Environmental Engineering; McGraw Hill Book Company: New York, NY, USA, 1970. [Google Scholar]
  19. Wilson, S.B.; Spence, V.A. A tissue heat transfer model for relating dynamic skin temperature changes to physiological parameters. Phys. Med. Biol. 1988, 33, 895–912. [Google Scholar] [CrossRef]
  20. Duck, F.A. Physical Properties of Tissue: A Comprehensive Reference Book; Academic Press: London, UK, 1990. [Google Scholar]
  21. Meglinski, I.V.; Matcher, S.J. Quantitative assessment of skin layers absorption and skin reflectance spectra simulation in the visible and near-infrared spectral regions. Physiol. Meas. 2002, 23, 741–753. [Google Scholar] [CrossRef]
  22. Ramirez-GarciaLuna, J.L.; (McGill University, Montreal, QC, Canada). Personal communication, 2022.
  23. Cole, R.P.; Shakespeare, P.G.; Chissell, H.G.; Jones, S.G. Thermographic assessment of burns using a nonpermeable membrane as wound covering. Burns 1991, 17, 117–122. [Google Scholar] [CrossRef]
  24. Charkoudian, N. Mechanisms and modifiers of reflex induced cutaneous vasodilation and vasoconstriction in humans. J. Appl. Physiol. 2010, 109, 1221–1228. [Google Scholar] [CrossRef]
  25. Johnson, J.M.; Proppe, D.W. Cardiovascular adjustments to heat stress. In Handbook of Physiology Environmental Physiology; American Physiological Society: Bethesda, MD, USA, 1996; Volume 2, Chapter 11; pp. 215–244. [Google Scholar]
  26. Neves, E.B.; Salamunes, A.C.C.; Oliveira, R.M.; Stadnik, A.M.W. Effect of body fat and gender on body temperature distribution. J. Therm. Biol. 2017, 70, 1–8. [Google Scholar] [CrossRef]
  27. Garcia-Souto, M.D.P.; Dabnichki, P. Core and local skin temperature: 3–24 months old toddlers and comparison to adults. Build. Environ. 2016, 104, 286–295. [Google Scholar] [CrossRef] [Green Version]
  28. Savastano, D.M.; Gorbach, A.M.; Eden, H.S.; Brady, S.M.; Reynolds, J.C.; Yanovski, J.A. Adiposity and human regional body temperature. Am. J. Clin. Nutr. 2009, 90, 1124–1131. [Google Scholar] [CrossRef] [PubMed]
Figure 1. The dependence of the heat loss function, q [W/m2], on the skin temperature Tskin [°C]. (panel a): q(Tskin) for various values of the ambient temperature T (22 °C—blue line, 25 °C—red line, 27 °C—green line), (panel b): q(Tskin) for various values of the relative humidity, RH (40%—blue line, 70%—red line, 100%—green line), T = 30 °C. (panel c): q(Tskin) for various values of the skin wetness, W. (T = 22 °C, W = 0—blue line, T = 22 °C, W = 1—red line, T = 27 °C, W = 1—green line). Skin emissivity ε was set to 0.98.
Applsci 12 07106 g001
Figure 2. The dependence of the heat loss function, q [W/m2], on the skin temperature Tskin [°C] in the case of moist skin (W = 1). q(Tskin) for was plotted for T = 22 °C (panel a) and 30 °C (panel b). Relative air humidity was set to 40% (blue line), 70% (red line), and 100% (green line). Skin emissivity ε was set to 0.98.
Applsci 12 07106 g002
Figure 3. The dependence of the epidermal temperature drop ΔTe as a function of the passive layer thickness E for two dermal temperatures/ambient temperature gradients: (TdT) 15 °C (solid red) and 10 °C (dashed blue).
Applsci 12 07106 g003
Figure 4. The dependence of the temperature drop across the skin (Delta) on the perfusion rate for several ambient temperatures: 25 °C (green dot-dash line), 20 °C (solid red line), and 10 °C (blue dashed line). The black dotted line outlines the broadly reported value for Delta (3.5 °C). Insert: calculated perfusion rate (solid blue line) to keep Delta at 3.5 °C as a function of the ambient temperature, T.
Applsci 12 07106 g004
Figure 5. White light and thermographic images of the foot: (panel a) Anatomical (white light) image; (panel b) Absolute temperature color map, (panel c) Thermal gradient—relative temperature color map. A thermal gradient was generated with respect to the reference point displayed on the absolute temperature map. Images, courtesy of Dr. Jose L. Ramirez-GarciaLuna, were acquired using the Ray 1 (Swift Medical, Toronto, ON, Canada).
Applsci 12 07106 g005
Table 1. The values of model parameters with their sources.
ParameterEpidermisDermis
Layer thickness, E or D0.1 mm non-glabrous
1.5 mm glabrous
1.5 mm non-glabrous
3 mm glabrous
Thermal conductivity, ke or kd0.21 W/m/K [19]0.53 W/m/K [19]
Metabolic bulk heat generation, QN/A200 W/m3 [19]
Publisher’s Note: MDPI stays neutral with regard to jurisdictional claims in published maps and institutional affiliations.

