Article

Predicting Tensile Strength for Prestressed Reinforced Concrete-Driven Piles

1
Institute of Geotechnical Engineering, Vietnam Institute for Building Science and Technology, 81 Tran Cung, Hanoi 100000, Vietnam
2
Department of Civil Engineering, University of Texas Rio Grande Valley, Edinburg, TX 78539, USA
3
Newcastle Australia Institute of Higher Education, Singapore 188064, Singapore
4
Department of Civil Environmental Engineering, Saitama University, Sakura-ku, Saitama 338-8570, Japan
*
Author to whom correspondence should be addressed.
Appl. Sci. 2022, 12(14), 7112; https://doi.org/10.3390/app12147112
Submission received: 26 May 2022 / Revised: 28 June 2022 / Accepted: 29 June 2022 / Published: 14 July 2022
(This article belongs to the Section Civil Engineering)

Abstract

:
Reinforced concrete piles installed by impact hammers have been used as a common solution for deep foundations because they are cost effective and require less time for construction. Driven piles are often used in large volumes for infrastructure and industrial projects in rural areas. Unlike other installation methods, installing piles using impact hammers can generate tensile stress during construction, which can result in pile failures. Induced tensile stress occurs when piles are being driven through a hard soil layer to a softer soil layer, and transverse cracks happen when induced tensile stress exceeds the pile tensile strength. This issue is not explicitly stated in most standards; the rare code that mentions this issue is AASHTO 2014. AASHTO 2014 uses correlations between the concrete tensile and compressive strengths to obtain the pile tensile strength. However, data collected from more than 1300 tests on the correlations between the concrete tensile and compressive strengths show that the concrete pile tensile strengths obtained using AASHTO 2014 are significantly conservative. This paper provides an adjustment in the correlation for the tensile strength based on previous data, and it proposes an approach to estimate the tensile strength for concrete-driven piles. A case study of the effects of pile failures on the tensile strength is also presented to verify the approach. The obtained tensile strength from the proposed approach agrees well with the measured field data. For the case study, the pile tensile strength obtained using the proposed approach is 38% and 59% higher than the tensile strength obtained using AASHTO 2014. These quantities are significant but may vary, depending on the compression strength of the concrete used and the pile configurations. The proposed approach better predicts the tensile strength of concrete piles and can lead to cost savings.

1. Introduction

Precast-concrete-driven piles are an effective foundation solution with low costs and less time-consuming construction [1]. However, pile driving can affect the integrity of the pile segments, with common problems including axial cracks, pile top cracks, and transverse cracks [2,3,4]. Transverse cracks caused by induced stress during pile driving can cause pile damage and affect the pile integrity. Induced tensile stress occurs when piles are being driven through a hard soil layer to a softer soil layer, and transverse cracks happen when the induced tensile stress exceeds the pile tensile strength. Induced stress in a pile while being driven can be measured using high-strain dynamic tests with a pile driving analyzer (PDA), but this is not often carried out in practice or thoroughly investigated [5]. To resist the induced tensile stress during the construction stage of pile driving, the pile mobilizes tensile strength from both of its material components: steel reinforcement (with or without prestressing) and concrete. When determining the tensile strength of prestressed concrete piles, some standards and guidelines take into account the tensile strength of the concrete component, such as AASHTO [5] and FHWA [6]. However, other standards do not [7,8,9,10,11,12,13,14,15,16,17,18,19,20,21]; in most cases, in practice, the concrete tensile strength is not taken into account. Neglecting concrete’s tensile strength when determining the pile’s tensile strength is safer, but not economical. Likins and Rausche [1] suggest that it is necessary to include at least part of the concrete tensile strength in the calculation of the tensile strength of the pile.
Different standards have different approaches for determining the concrete tensile strength, based on different testing methods, including direct tension, modulus of rupture, and split cylinder testing [6,7,8,9,10,11,12,13,14,15,16,17,18,19,20]. Of these three standardized testing methods, modulus of rupture and split cylinder are more common, whereas the direct tensile test is only used in a few standards. ACI 543R-12 [21] states that the less commonly used direct tensile test is due to the difficulty of pure tensile loading on a plain concrete specimen. In practice, tensile-strength tests are not carried out as often as compressive-strength tests. Standards often allow for the conversion of the compressive strength to the tensile strength. The correlations between the modulus of rupture and the compressive strength of pile concrete in the standards are summarized in Table 1, where ft, fr, fc, and fc′ are the tensile strength, flexural tensile strength, cube compressive strength, and cylinder compressive strength, respectively, of concrete at 28 days. As in Table 1, significant variation exists in the estimation of the tensile strength through the correlations, which not only affects the prediction of the tensile strength for prestressed driven piles, but also the overall cost of the piling work. This paper provides an adjustment in the correlation for the tensile strength based on previous data, and it proposes an approach to estimate the tensile strength for driven piles that agrees well with the measured data and can lead to cost savings. A case study of the effects of reinforced-concrete-pile failures on the tensile strength is also presented to verify the approach. Relative comparisons between different approaches are also provided.

2. Tensile Strength of Reinforced-Concrete-Driven Piles

The AASHTO [5] Standard and FHWA [6] guidelines prescribed the tensile strength of concrete as:
  σ d r = φ d a ( 0.25 f c + f p e )
where σdr is the driving tensile-stress limit or tensile strength (MPa); φda is the resistance factor during driving (1.0 for concrete piles); fc is the concrete compression strength at 28 days, unless otherwise specified (MPa); fpe is the effective prestressing stress in concrete (MPa).
Figure 1 presents the modulus of rupture data from the 1330 tests from research over the past 80 years [22,23,24,25]. These data can be used to evaluate Equation (1). The observations from the data are: (1) when the compressive strength of concrete is greater than 50 MPa, the correlation of the compressive and tensile strengths of concrete, according to ACI 363R-10 [24], which is
f r = 0.623 f c
corresponds to the lower boundary of the data points, and (2) when the compressive strength of concrete is less than 50 MPa, the data lower bound is the f r   curve, which is
f r = 0.415 f c
As in Equation (1), AASHTO [5] recommends using the tensile strength of concrete at 0.25 f c . Compared with the observations from Figure 1, it can be seen that the AASHTO [5] approach is significantly conservative, and especially when the compressive strength is greater than 50 MPa. It is proposed that the equation for the tensile strength should be adjusted to:
σ d r = φ d a ( k × f c + f p e )
where k = 0.415 for fc < 50 MPa and k = 0.623 for fc ≥ 50 MPa. Equation (4) predicts the tensile strength of the piles more accurately. It should be noted that the compressive strength itself is a parameter that already includes a factor of safety; therefore, the tensile strength, when determined through the compressive strength, does not require an additional factor of safety. Therefore, Equation (4) also provides the maximum allowed induced tensile stress during pile driving.

3. A Case Study: Verification of the Proposed Approach

This case study is from a thermal-power-plant project in Soc Trang, Vietnam, in 2016. Figure 2 shows Borehole BH6, with a soil profile of the study area; this profile is relatively typical and similar to other boreholes within the footage of the plan. Soil Layer 1 is a loose–medium-dense sand, which is followed by Layers 2 and 3, which are soft–firm-clay weaker soils with much lower SPT numbers.
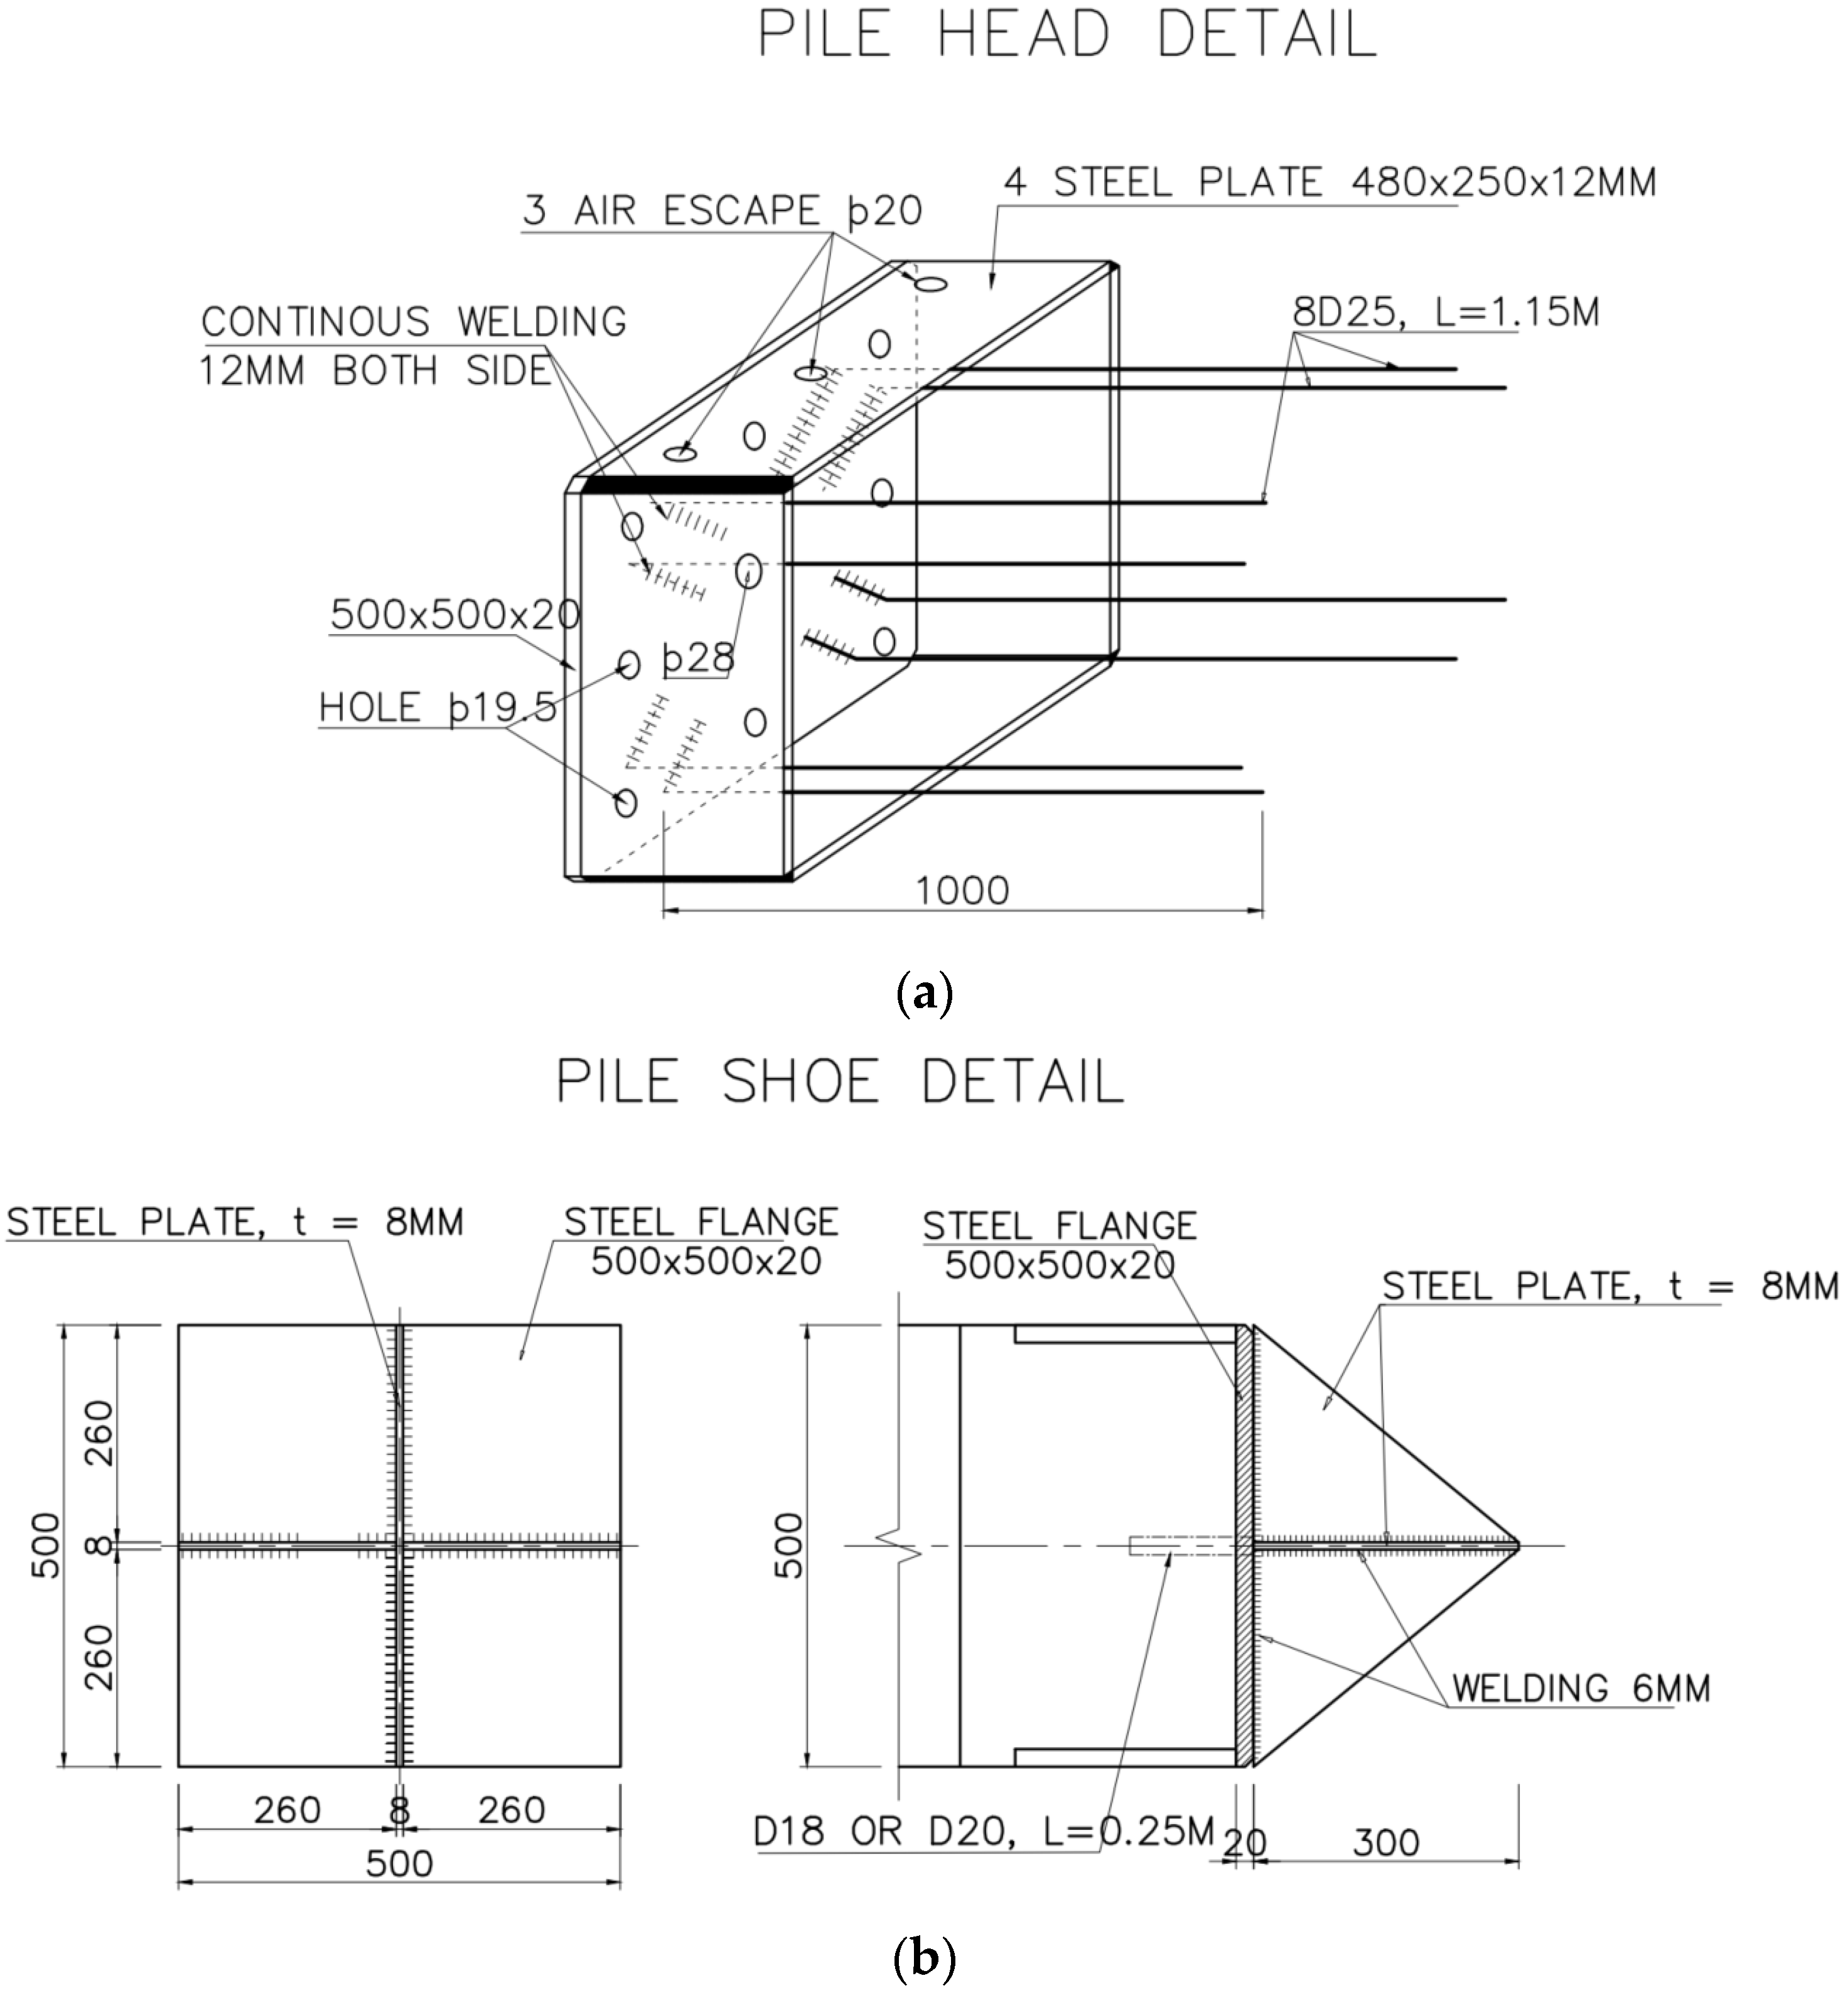
The foundations consist of prestressed-reinforcement-concrete square piles with a compressive strength fc of 50 MPa (cylindrical samples). The pile cross-section of 0.5 m × 0.5 m, with the details on the pile head and tip, are presented in Figure 3. The pile lengths are 52 m (consisting of three segments: 18 m, 18 m, and 16 m) and 53 m (18 m, 18 m, and 17 m). The hammer used to drive the piles weighs 7.2 tons, with a drop height of 1.8 m; other specifications on the hammer are presented in Table 2.
For the initial approved design, the reinforcement used for each pile was 15.24 mm-diameter prestressed cables with a tensile strength (fpu) of 1860 MPa, the value of the prestressing force was fpi = 0.7fpu = 1302 MPa, and there were four cables for each pile.
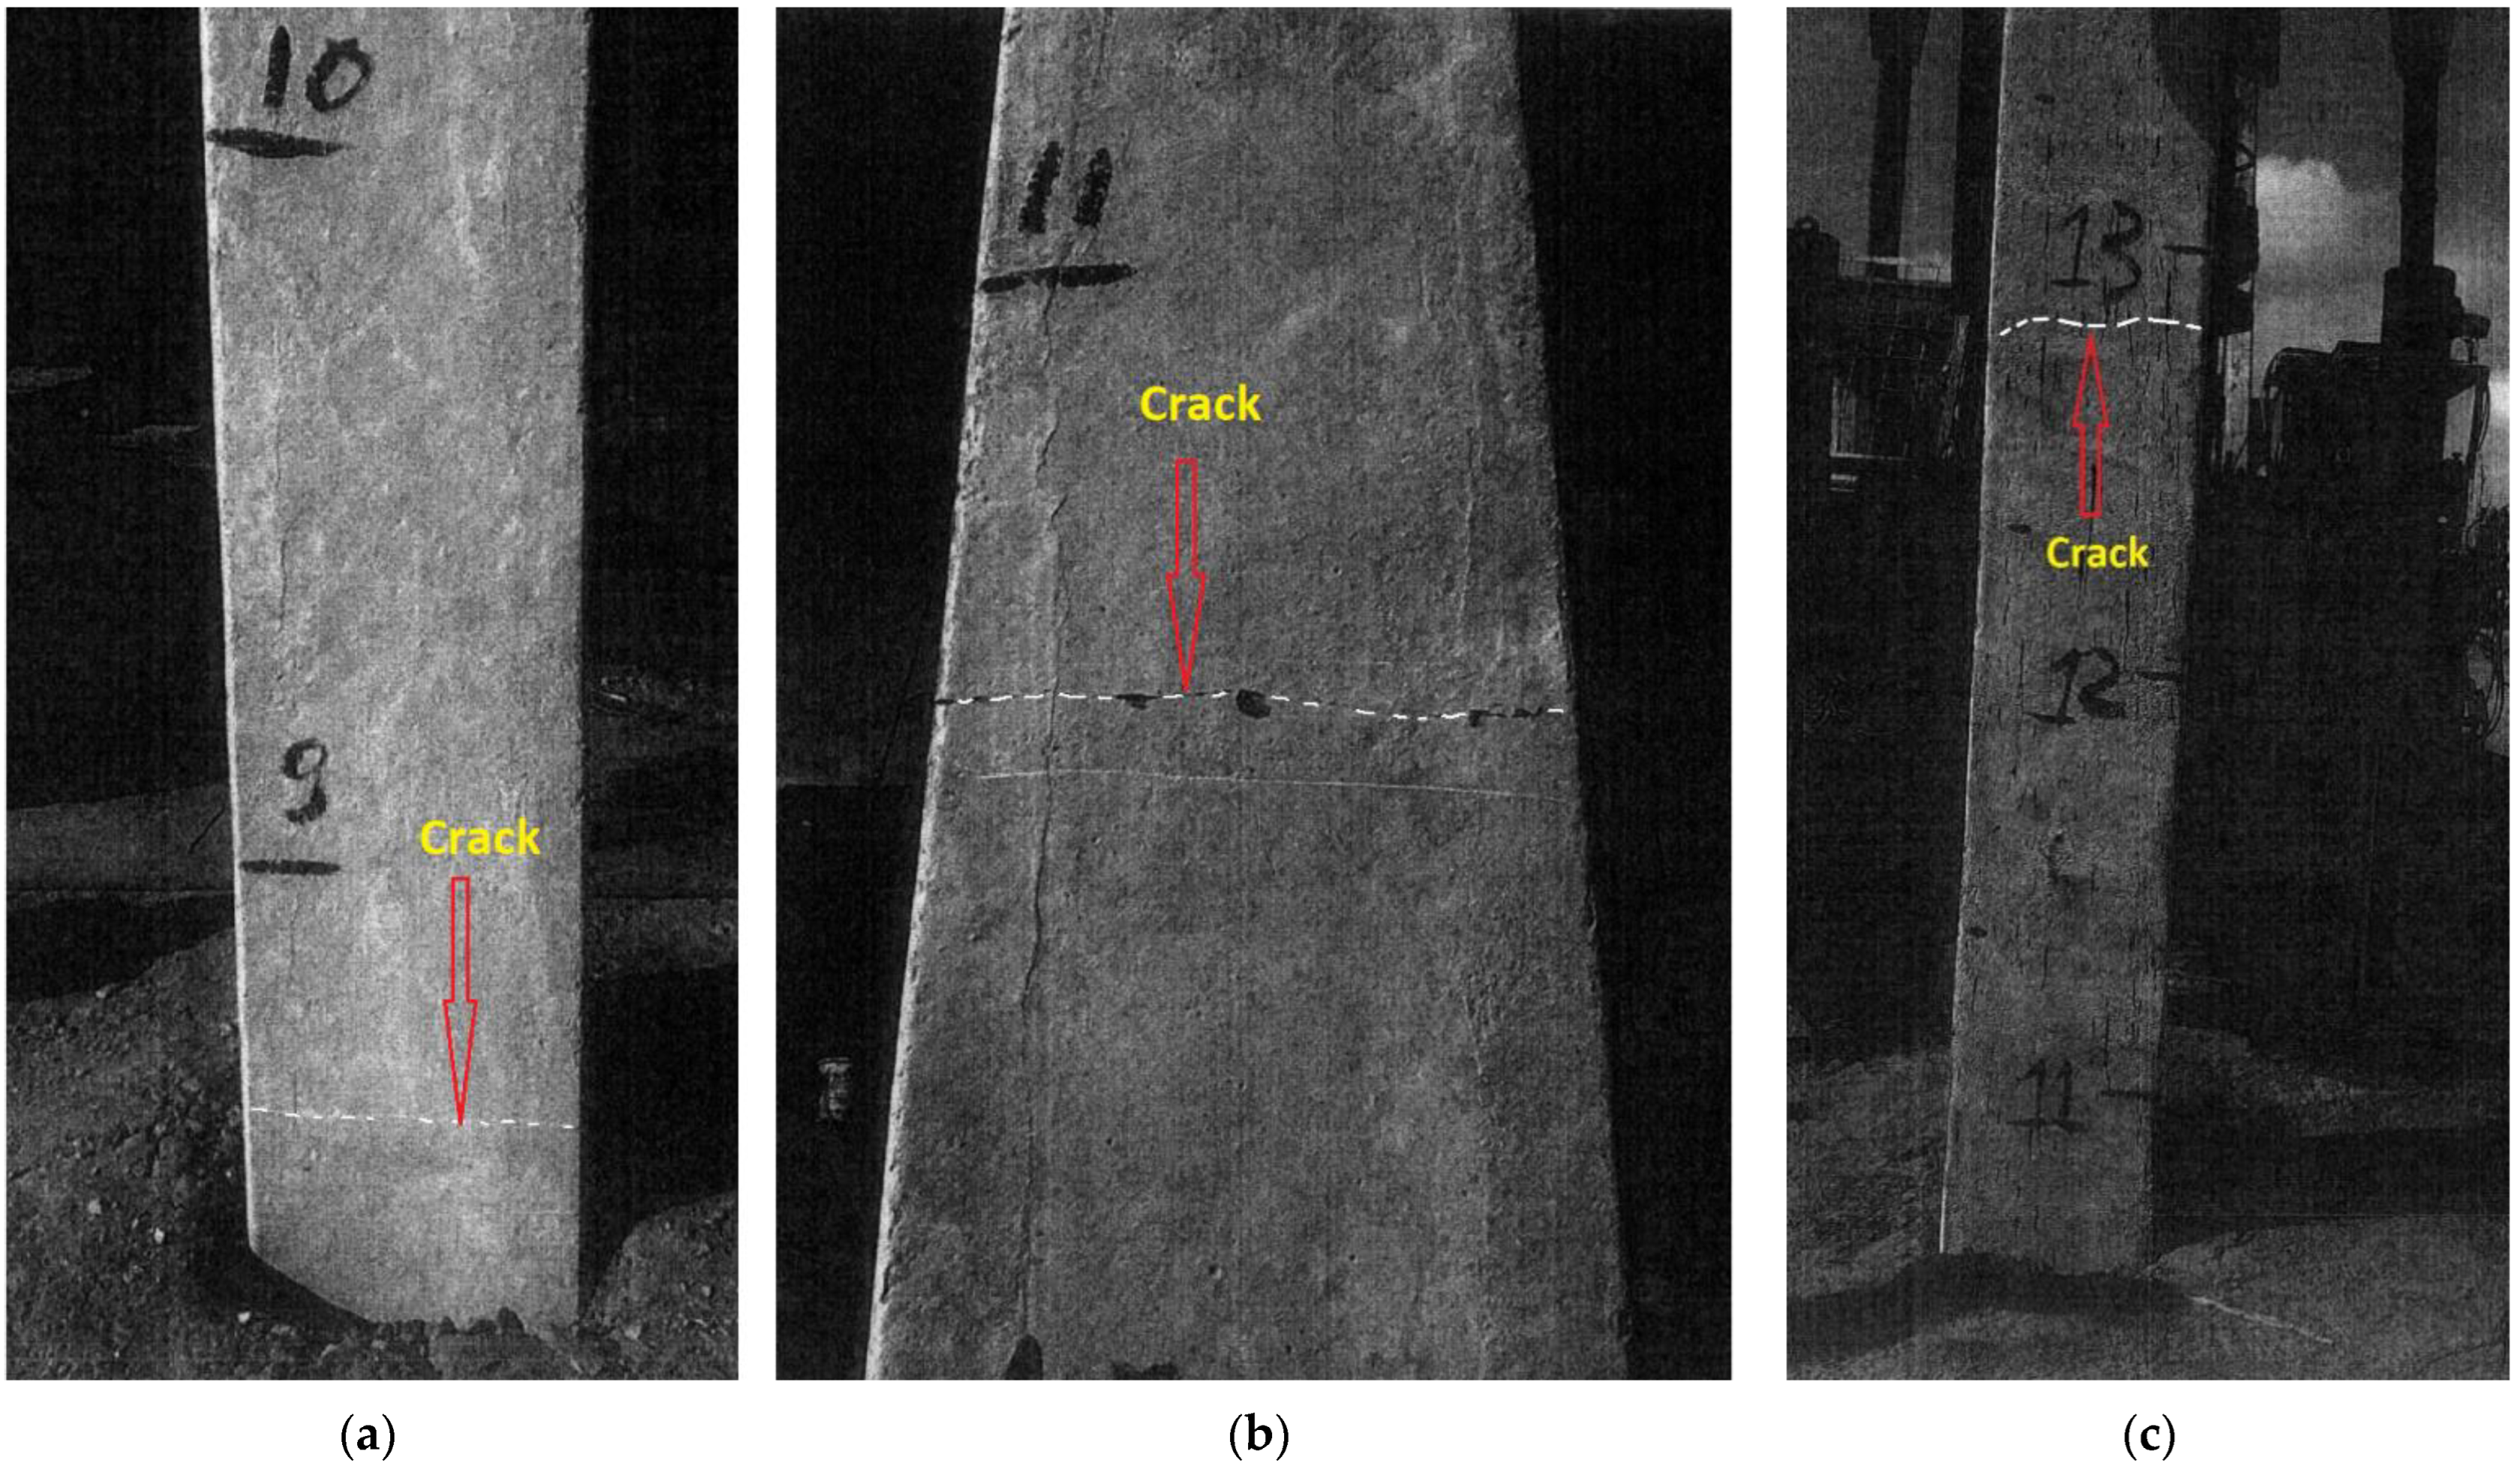
During pile driving, horizontal cracks were observed on a number of piles. Figure 4 shows the cracks on Pile 12HA415 and Pile 12HA174. The pile design, fabrication, and installation processes were revisited and analyzed. It was confirmed that the cause of the damages was not from the quality of the concrete, pile transportation, pile lifting by crane, or buckling. Moreover, the impact caused by a clamp used to reduce the effects of pile slenderness during installation was eliminated as a reason for the cracks. The cracks were mainly transverse, which shows that the damages must have come from tensile stress and not from compressive stress [3].
Based on the analysis, the pile design was changed by increasing the number of reinforced cables from four to eight for each pile. The type of cable was unchanged, with a diameter of 15.24 mm, and a prestressing force of 19,200 kg (188.3 kN). The pile tensile strength was calculated using three approaches: (1) not accounting for the concrete tensile strength (k = 0) as in most standards; (2) accounting for the concrete tensile strength following AASHTO [5] (k = 0.250; (3) accounting for the concrete tensile strength following the proposed Equation (4) (k = 0.622). The compressive strength of the concrete used is 50 MPa. The results in Table 3 show that the pile tensile strength is significantly increased when accounting for the tensile strength of the concrete, and the proposed equation gives a tensile strength at least 38% higher than that of AASHTO [5].

4. Pile Tensile-Stress Measurement

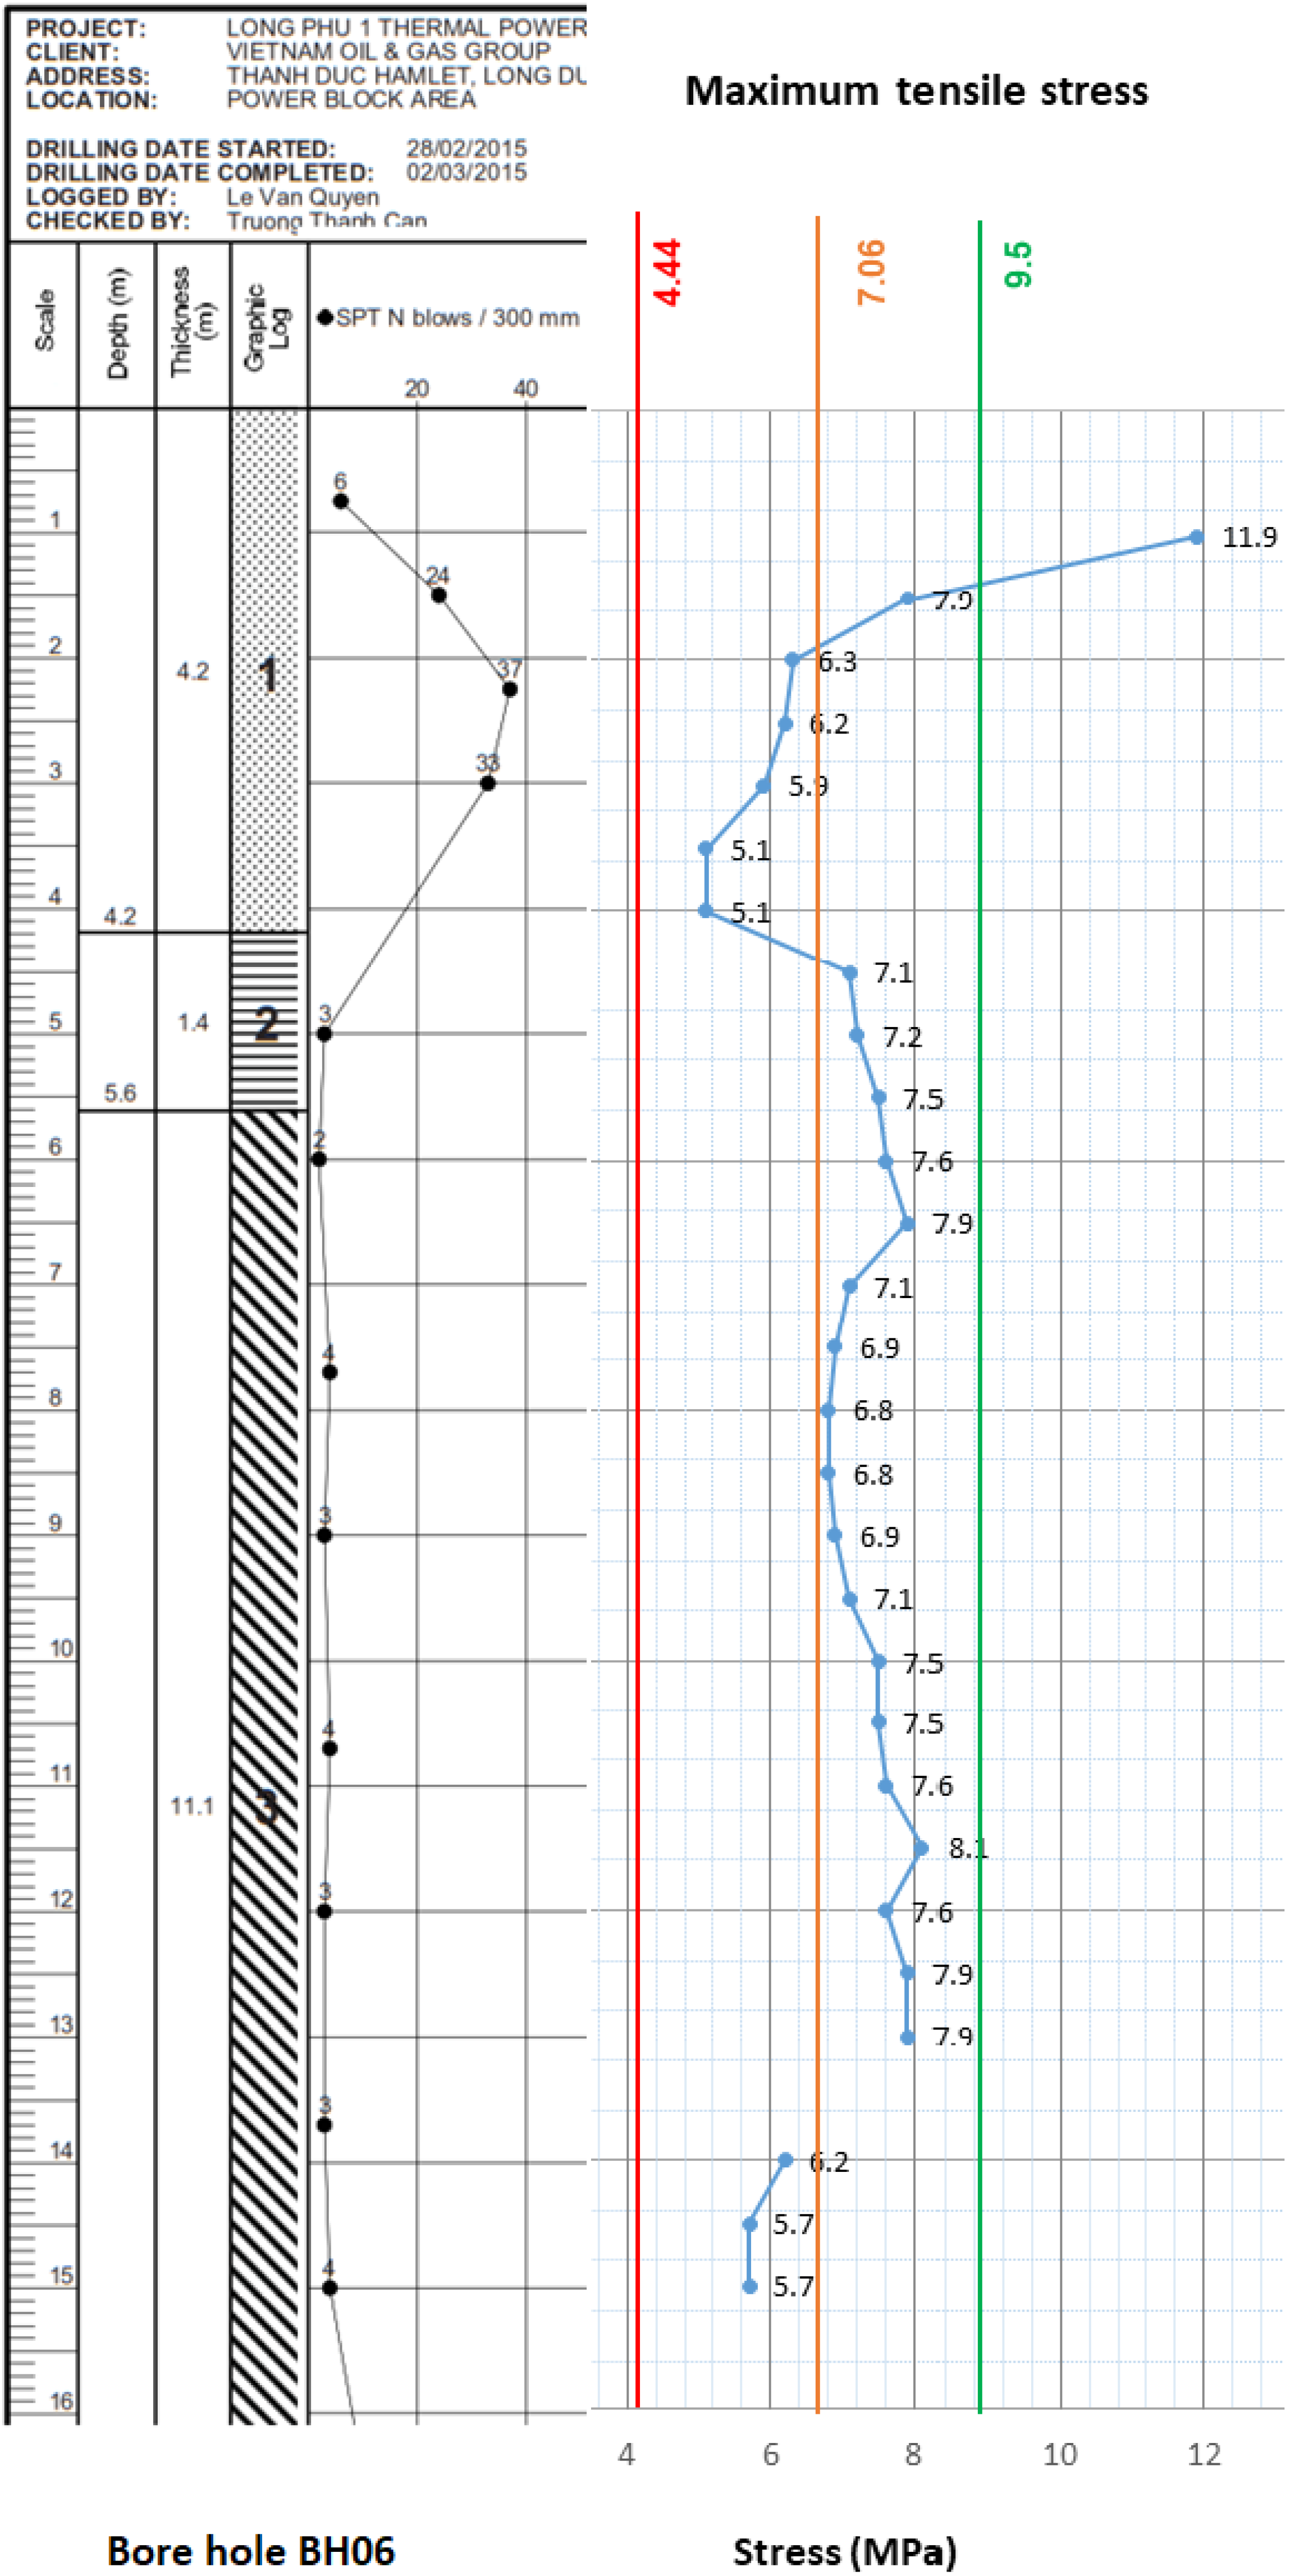
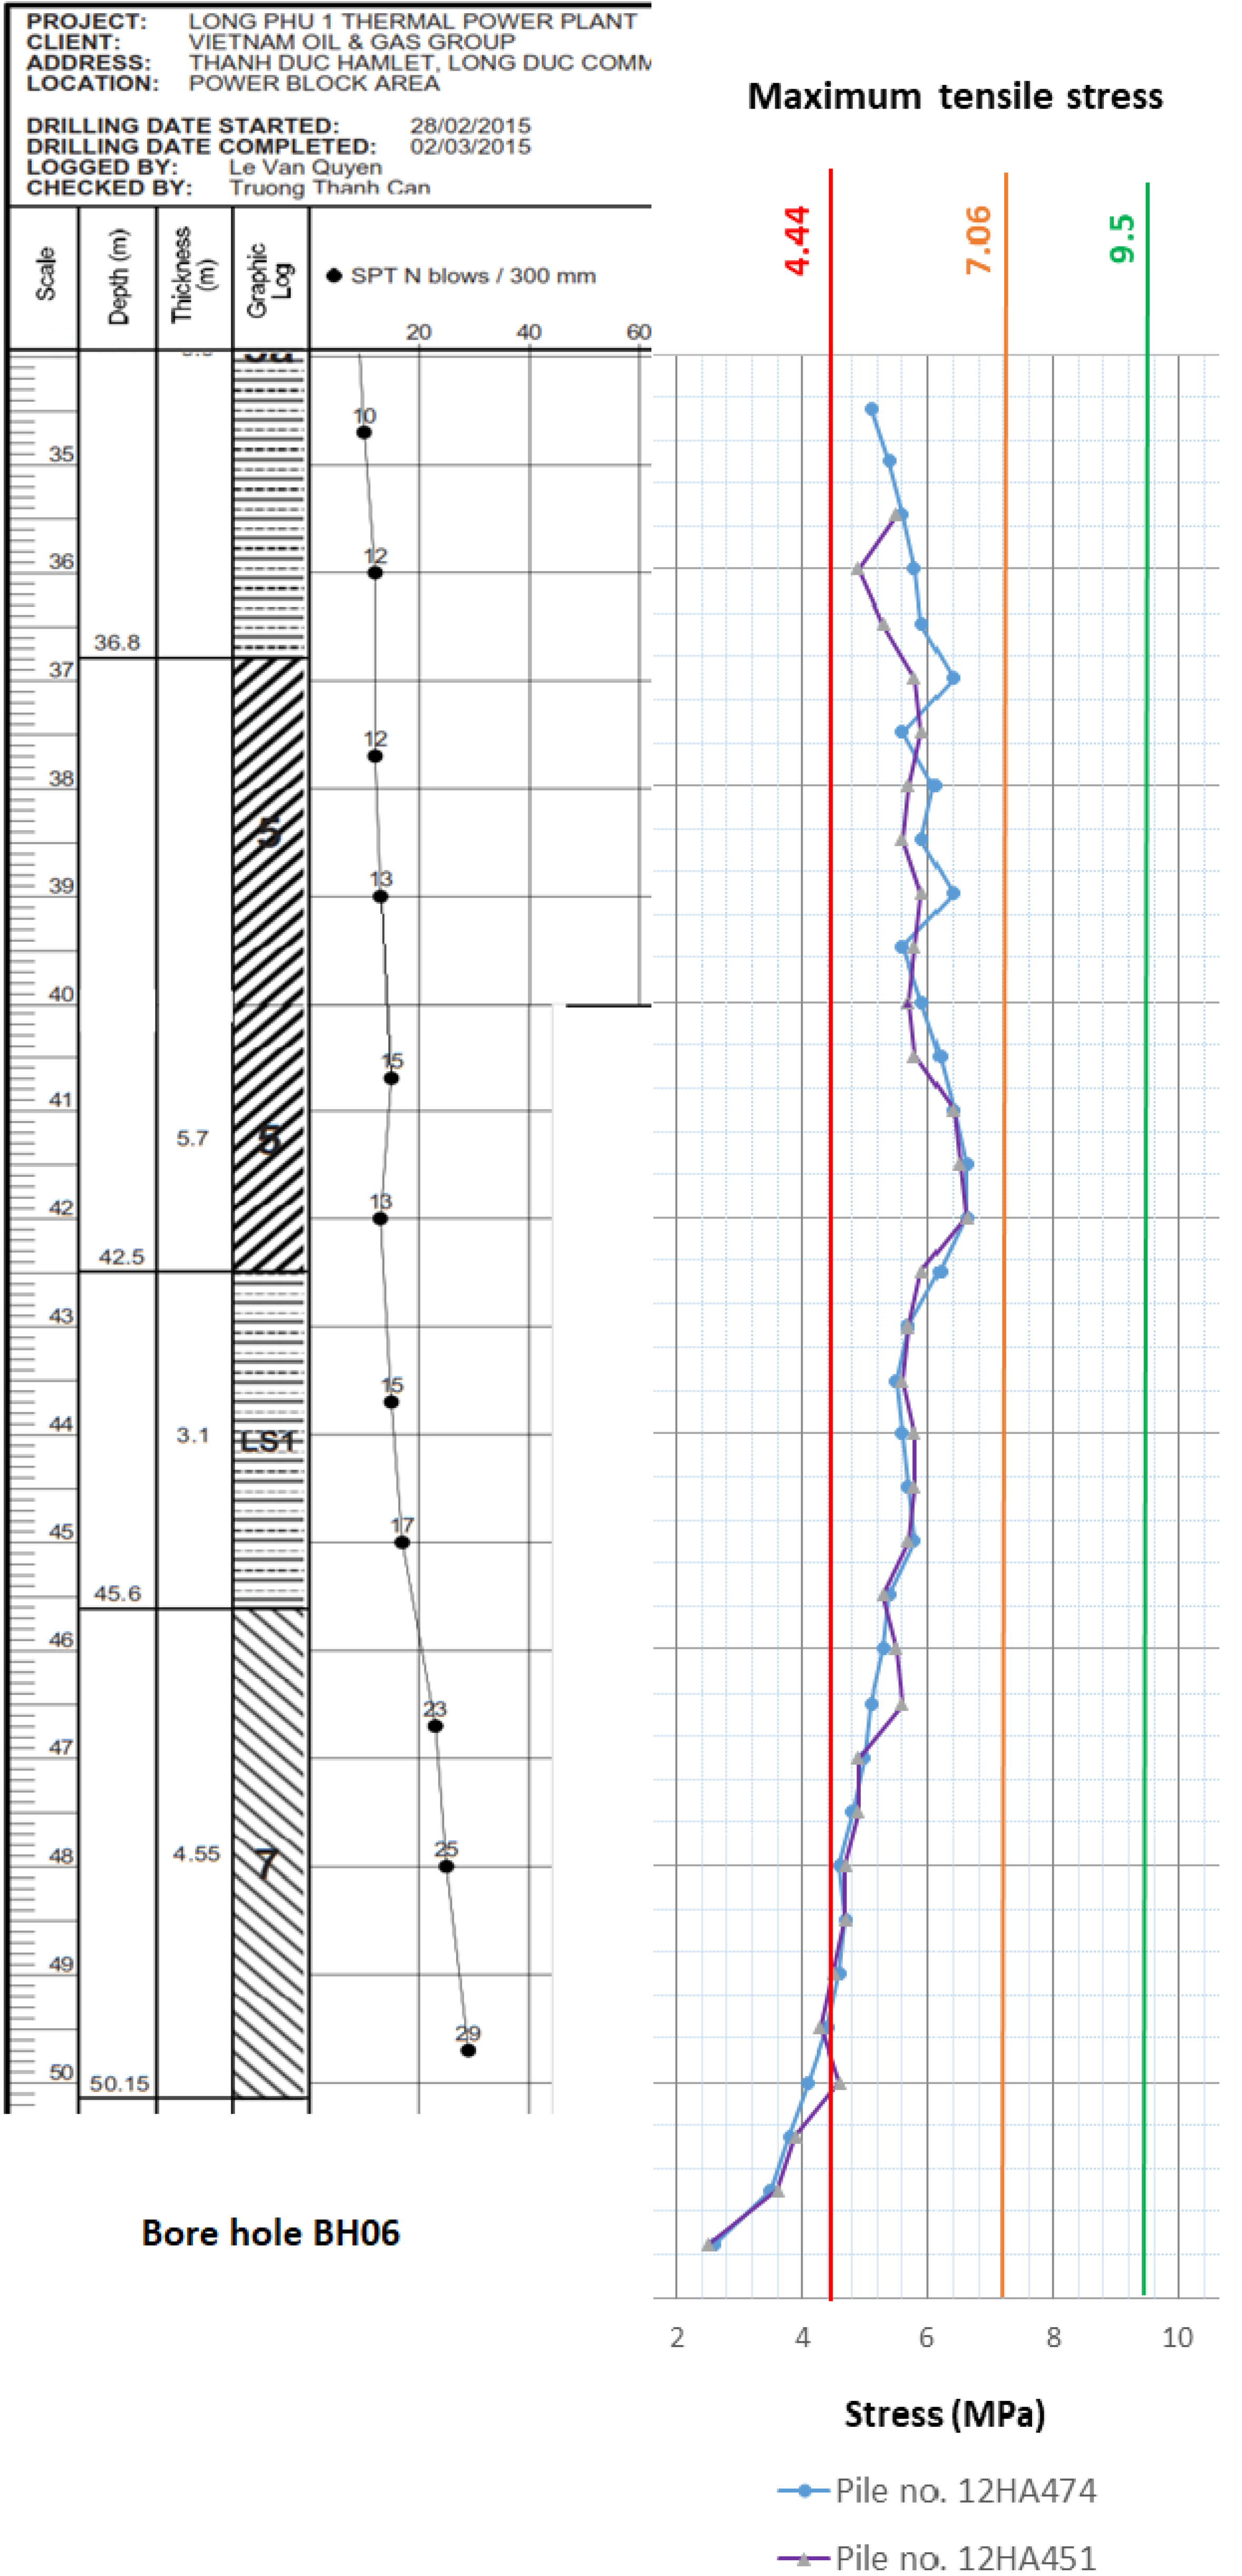
With the new pile design, PDA tests were conducted, and the tensile stresses in the piles while driving were recorded. The results on Pile 12HA 474 and Pile 12HA 451 were analyzed using CAPWAP software, which is an effective tool for stress calculation in PDA experiments [26]. Research by Zhou et al. [27] on the PDA results of wave measurements in piles shows that the largest tensile stress waves are usually near the pile heads, where the PDA gauges are typically mounted. Thus, the tensile stress measured in the PDA test is expected to be the maximum tensile stress of the pile. Figure 5 and Figure 6 show the results of the measured tensile stress generated in the piles during pile driving. The Borehole-BH6 geology column is imposed in the figures for visualization.
As in Figure 5 and Figure 6, the changes in the measured tensile-stress profile, in general, are relatively consistent with the changes in the SPT-value profile and the types of soils. However, the induced tensile stress in the piles increased when the pile tip penetrated through the boundary of hard soil (Layer 1) to softer soil layers (Layers 2 and 3) (Figure 5). Note that a few data points were missing for Pile 12HA 474, but this does not affect the analysis. Moreover, amongst the measured data, there is an outlier at the first blow on Pile 12HA 474 (Figure 5) at a depth of 1m; the measured stress is 11.9 MPa, which is two times more than the expected value. This outlier was eliminated from the dataset used for analysis as in Figure 5 and Figure 6, the changes in the measured tensile-stress profile, in general, are relatively consistent with the changes in the SPT-value profile and the types of soils. However, the induced tensile stress in the piles increased when the pile tip penetrated through the boundary of hard soil (Layer 1) to softer soil layers (Layers 2 and 3) (Figure 5). Note that a few data points were missing for Pile 12HA 474, but this does not affect the analysis. Moreover, amongst the measured data, there is an outlier at the first blow on Pile 12HA 474 (Figure 5) at a depth of 1m; the measured stress is 11.9 MPa, which is two times more than the expected value. This outlier was eliminated from the dataset used for analysisAs in Figure 5 and Figure 6, the changes in the measured tensile-stress profile, in general, are relatively consistent with the changes in the SPT-value profile and the types of soils. However, the induced tensile stress in the piles increased when the pile tip penetrated through the boundary of hard soil (Layer 1) to softer soil layers (Layers 2 and 3) (Figure 5). Note that a few data points were missing for Pile 12HA 474, but this does not affect the analysis. Moreover, amongst the measured data, there is an outlier at the first blow on Pile 12HA 474 (Figure 5) at a depth of 1m; the measured stress is 11.9 MPa, which is two times more than the expected value. This outlier was eliminated from the dataset used for analysis.

5. Analysis of Pile-Induced Tensile Stress and Strength

For the original pile design with four cables that showed cracks during construction, the tensile strengths were calculated using the AASHTO equation (Equation (1)) and the proposed equation (Equation (4)) for comparison. The results are imposed in Figure 5 and Figure 6, where the red lines represent the tensile strength obtained using the AASHTO equation (Equation (1)), which produced the value of 4.44 MPa; the orange lines represent the tensile strength using the proposed equation, which produced the value of 7.06 MPa. This value of 7.06 MPa is within the higher range of the measured tensile stress (6.3 MPa to 8.1 MPa) and, as a result, a large number of the piles of this initial design were damaged. Compared with the measured data and the observed cracks, the AASHTO equation underestimated the tensile strength of the piles because the equation predicted a tensile strength of 4.44 Mpa, which is smaller than the measured tensile stress along the length of the pile segments, which means that the cracks would have been along most of the length of the pile segments. The proposed approach predicts a tensile strength of 7.06 MPa, which is actually more accurate because the cracks appeared at locations where the measured induced stresses were larger than the predicted strength.
For the revised design of the piles with eight cables, the tensile strength obtained by using the AASHTO equation is 6.89 MPa, which is smaller than the maximum induced tensile stress of 8.1 Mpa, and cracks would have occurred. However, with this revised design of eight cables, there were no cracks observed on the piles. The proposed approach’s calculated tensile strength for the eight-cable piles is 9.5 MPa, shown by the green lines in Figure 5 and Figure 6. This value is larger than the induced tensile stress in the piles, predicting no cracks. The calculated factor of safety is 1.17, and these piles were successfully constructed without tensile cracks. For eight-cable piles, if a design did not account for the tensile strength of the concrete component as recommended by most standards, then the pile tensile strength would be 5.12 MPa, which is smaller than the induced tensile stress during driving, and cracks would have occurred.
For this case study, the proposed approach predicts the pile tensile strength (and, therefore, the cracks) more accurately, with the calculated tensile strength about 38% to 59% higher than the values from AASHTO [5] for designs of four and eight cables, respectively (Table 3). These quantities are significant but may vary, depending on the used compression strength of the concrete and the pile configurations; however, based on the analysis using measured data and field observations, the proposed approach is reliable to use for estimating the tensile strength of prestressed concrete piles. This approach can provide a better design for the prestressed concrete pile at the construction stage, resulting in cost savings.

6. Conclusions

For concrete-driven-pile design, checks must be performed to ensure that the pile tensile strength is greater than the possible induced tensile stress during pile driving to avoid pile damage in the construction stage. Generally, empirical correlations are used to estimate the tensile strength of concrete, which show significant variations among the different standards. This paper examines the relationship between the modulus of rupture and the compressive strength of concrete (based on previous data). The current AASHTO 2014 underpredicted the tensile strength in the prestressed driven piles, which led to overdesign. A modified approach (Equation (4)) is proposed for predicting the tensile strength in the prestressed driven pile. A case study is presented in which PDA tests were conducted to measure the pile-induced stress during pile driving. The data show that the tensile stress in the piles increases when the pile tip penetrates from a firmer soil layer to a softer soil layer, which can cause pile cracks. The recorded tensile stresses during pile driving are compared with the pile tensile strengths obtained from the AASHTO approach (Equation (1)) and the proposed approach. For the case study, the predicted tensile strength of prestressed driven piles using the proposed approach agrees well with the PDA results and is about 38% to 59% higher than the value obtained from AASHTO. These quantities are significant but may vary, depending on the compression strength of the concrete used and the pile configurations. However, adjustments using the proposed approach can lead to more economical designs.

Author Contributions

Conceptualization, T.N.N. and T.Q.P.; methodology, T.N.N. and T.Q.P.; supervision, T.T.V.; writing—original draft, T.N.N. and T.Q.P.; writing—review & editing, T.T.V., A.A.M. and D.N.D. All authors have read and agreed to the published version of the manuscript.

Funding

This research received no external funding.

Institutional Review Board Statement

Not applicable.

Informed Consent Statement

Not applicable.

Conflicts of Interest

The authors declare no conflict of interest.

References

  1. Likins, G.; Rausche, F. Pile Damage Prevention and Assessment Using Dynamic Monitoring and the Beta Method. In Soil Behavior Fundamentals to Innovations in Geotechnical Engineering, Proceeding of the Geo-Congress; American Society of Civil Engineers: Reston, VA, USA, 2014. [Google Scholar]
  2. Lowery, L.L.; Hirsch, T.J.; Edwards, T.C.; Coyle, H.M.; Samson, C.H., Jr. Chapter VIII—Prediction of driving stress. In Pile-Driving Analysis by One-Dimensional Wave Theory: State of the Art; Texas Transportation Institute: College Station, TX, USA, 1970; pp. 25–32. [Google Scholar]
  3. Hirsch, T.J.; Samson, C.H., Jr. Driving practices for pre-stressed concrete piles. In Research Report Number 33-3-Piling Behavior; Texas Transportation Institute: College Station, TX, USA, 1966. [Google Scholar]
  4. Davisson, M.T.; Manuel, F.S.; Amstrong, R.M. Chapter 5: Piles containing concrete. In Allowable Stresses in Piles; Federal Highway Administration Bulletin: Georgetown, VA, USA, 1983; pp. 41–55. [Google Scholar]
  5. American Association of State Highway and Transportation Officials. Section 10: Foundation. In AASHTO LRFD Bridge Design Specifications, 7th ed.; American Association of State Highway and Transportation Officials: Washington, DC, USA, 2014; pp. 1208–1251. [Google Scholar]
  6. Hannigan, P.J.; Rausche, F.; Likins, G.E.; Robinson, B.R.; Becker, M.L. Section 8.6 Concrete piles. In Geotechnical Engineering Circular No. 12: Design and Construction of Driven Pile Foundations; U.S. Department of Transportation: Washington, DC, USA, 2016; Volume I, pp. 459–464. [Google Scholar]
  7. ACI Committee 318. Chapter 22—Sectional strength. In Building Code Requirements for Reinforced Concrete (ACI 318-2002); American Concrete Institute: Farmington Hills, MI, USA, 2008; pp. 397–434. [Google Scholar]
  8. BS 8007; Design of Concrete Structures for Retaining Aqueous Liquids. British Standards Institution, BSI: London, UK, 2003.
  9. EN 1992-1-1; Eurocode 2: Design of Concrete Structures—General Rules and Rules for Buildings. European Committee for Standardization: Brussels, Belgium, 2004; pp. 27–36.
  10. JCI. Chapter 4—Verification of Cracking due to Heat or Hydration of Cement. In Guidelines for Control of Cracking of Mass Concrete 2016; Japan Concrete Institute: Tokyo, Japan, 2017; pp. 36–71. [Google Scholar]
  11. Japan Society of Civil Engineers. Section 4—Material Properties. In JSCE Guidelines for Concrete No.15 “Standard Specifications for Concrete Structures–Design”; JSCE: Tokyo, Japan, 2010; pp. 404–409. [Google Scholar]
  12. AIJ. Recommendations for Practice of Thermal Cracking Control of Massive Concrete in Building; Architectural Institute of Japan: Tokyo, Japan, 2008; p. 69. [Google Scholar]
  13. Canadian Standards Association. Design of Concrete Structures CAN/CSA-A23.3-04; Standards Council of Canada: Ottawa, ON, Canada, 2007; p. 214. [Google Scholar]
  14. Standards New Zealand. The Design of Concrete Structures and Commentary—NZS 3101 Parts 1 and 2*; Standards New Zealand: Wellington, New Zealand, 2006; p. 753.
  15. IS 456:2000; Plain and Reinforced Concrete Code of Practice—4th Revision. Bureau of Indian Standards—BIS: Manak Bhavan, New Delhi, India, 2007; p. 114.
  16. FIB Special Activity Group 5. Chapter 5—Materials. In Model Code 2010; The International Federation for Structural Concrete (FIB): Lausanne, Switzerland, 2010; Volume 1, pp. 107–232. [Google Scholar]
  17. Научнo-исследoвательским, прoектнo-кoнструктoрским и технoлoгическим институтoм бетoна и железoбетoна “НИИЖБ”. Section 7—Прoведение испытаний. In ГОСТ 10180—Бетoны. Метoды Определения Прoчнoсти пo Кoнтрoльным Образцам; Kodeks JSC: Saint-Petersburg, Russia, 2018; pp. 15–19. [Google Scholar]
  18. TCVN 3119; Hardened Concrete–Test Method for Flexural Tensile Strength. Directorate for Standards, Metrology and Quality, Vietnamese Mynistry of Construction: Hanoi, Vietnam, 1993; pp. 1–3.
  19. TCVN 3120; Heavyweight Concrete—Method for Determination of Direct Tensile Strength. Directorate for Standards, Metrology and Quality, Vietnamese Mynistry of Construction: Hanoi, Vietnam, 1993; pp. 1–5.
  20. Vietnamese Mynistry of Construction. Section 5: Materials for plain concrete and reinforcement concrete. In TCVN 5574—Concrete and Reinforced Concrete Structure—Design Standard; Directorate for Standards, Metrology and Quality: Hanoi, Vietnam, 2012; pp. 1–3. [Google Scholar]
  21. ACI 543R-12; Guide to Design, Manufacture, and Installation of Concrete Piles. American Concrete Institute: Farmington Hills, MI, USA, 2012.
  22. Rozalija, K.; David, D. Chapter 3 Results. In Effects of Aggregate Type, Size, and Content on Concrete Strength and Fracture Energy; University of Kansas Center for Research, Inc.: Lawrence, KS, USA, 1997; p. 73. [Google Scholar]
  23. Robin, G. Tuchscherer; Oguzhan Bayrak. Allowable Tensile Stress Limit at Prestressed Transfer. ACI Struct. J. 2009, 106, 279–287. [Google Scholar]
  24. Raphael, J.M. Tensile Strength of Concrete. In ACI Journal, Proceedings; American Concrete Institute: Farmington Hills, MI, USA, 1984; Volume 81, pp. 158–165. [Google Scholar]
  25. Shah, S.P.; Ahmad, S.H. Structural Properties of High-Strength Concrete and Its Implications for Precast Pre-Stressed Concrete. J. Pre-Stressed Concr. Inst. 1985, 30, 92–119. [Google Scholar]
  26. Goble, G.G.; Fricke, K.; Likins, G.E. Driving stresses in concrete piles. PCI J. 1976, 21, 70–88. [Google Scholar] [CrossRef]
  27. Zhou, L.; Chen, J.; Lao, W. Construction Control and Pile Body Tensile Stresses Distribution Pattern during Driving. J. Geotech. Geoenviron. Eng. 2007, 133, 9. [Google Scholar] [CrossRef]
Figure 1. Relationship between Modulus of Rupture and Compressive Strength of Concrete (Data from 1330 tests).
Applsci 12 07112 g001
Figure 2. Boring Log BH6 (typical for the study area).
Applsci 12 07112 g002
Figure 3. Pile Details: (a) Pile Head with Eight Pre-Stressed Cables and (b) Pile Tip.
Applsci 12 07112 g003
Figure 4. Cracks on Piles: (a) Pile 12HA 415, (b) Pile 12HA 415, and (c) Pile 12HA 174.
Applsci 12 07112 g004
Figure 5. Stress Measurements—First Segment of Pile 12HA 474.
Applsci 12 07112 g005
Figure 6. Stress Measurements, Last Segments of Piles No. 12HA 474 and 12HA 451.
Applsci 12 07112 g006
Table 1. Tensile Strength and Compressive Strength Empirical Correlations in Standards.
Standards
(or Codes)
Correlations in MPaTensile Strength
Testing Methods
Type of Compressive Samples
ACI 318-2002 [7] f r = 0.62 f c i Modulus of RuptureCylinder
BS 8007 [8] f t = 0.12 f c 0.7 Split CylinderCube
CEN (2002) [9] f r = 0.342 f c 2 3 Modulus of RuptureCylinder
JCI 2016 [10] f t = 0.13 f c 0.85 Split CylinderCylinder
JSCE 2002 [11] f t = 0.44 f c 0.5 Split CylinderCylinder
AIJ 2008 [12] f t = 0.18 f c 0.75 Split CylinderCylinder
CAN/CSA A23.3-04 (2007) [13] f r = 0.6 f c 0.5 Modulus of RuptureCylinder
NZS-3101 [14] f r = 0.6 f c 0.5 Modulus of RuptureCylinder
IS 456-2000 [15] f r = 0.626 f c 0.5 Modulus of RuptureCylinder
CEB-FIB 2010 [16] f r = 0.3 f c 0.5
(For concrete gradesC50)
Axial tensionCylinder
Table 2. Specifications of the Hammer (Model HD 72).
DescriptionsUnitsValues
Power strokeNm244 − 122
Number of stroke1/min35 − 50
Max. blow of impactmm4518
Impact weightTon7.2
Dimensions (L × W × H)mm5990 × 1130 × 980
Table 3. Pile Tensile Strength.
DesignNo. of CablesPile Tensile Strength (MPa)
Not Accounting for Concrete Tensile Strength (Most Standards)Accounting for Concrete Tensile Strength AASHTO [5]Accounting for Concrete Tensile Strength (Equation (4))Difference between Equation (4) and AASHTO [5]
Initial42.684.447.06+59%
Revised85.126.899.5+38%
Publisher’s Note: MDPI stays neutral with regard to jurisdictional claims in published maps and institutional affiliations.