Article

Effect of Nitrogen Atoms in the CNT Structure on the Gas Sensing Properties of PANI/CNT Composite

by
Ivan A. Lobov
1,
Nadim A. Davletkildeev
1,
Sergey N. Nesov
1,
Denis V. Sokolov
1 and
Petr M. Korusenko
2,*
1
Laboratory of Physics of Nanomaterials and Heterostructures, Omsk Scientific Center of SB RAS, 15 Karl Marx Prosp., 644024 Omsk, Russia
2
Department of Physics, Omsk State Technical University, 11 Mira Prosp., 644050 Omsk, Russia
*
Author to whom correspondence should be addressed.
Appl. Sci. 2022, 12(14), 7169; https://doi.org/10.3390/app12147169
Submission received: 19 June 2022 / Revised: 11 July 2022 / Accepted: 14 July 2022 / Published: 16 July 2022
(This article belongs to the Special Issue Practical Application of Functionalized Carbon-Based Nanomaterials)

Abstract

:
Herein we report the gas-sensitive properties to ammonia (at 2–10 ppm) of individual nanostructures of a polyaniline/nitrogen-doped carbon nanotube composite with a nitrogen content of 0 at.% (uCNTs), 2 at.% (N-CNTs) and 4 at.% (N+-CNTs). Doping of nanotubes with nitrogen was carried out in order to both reduce the electron work function, to form a potential barrier at the “PANI-CNTs” interface, and reduce the contribution of nanotubes to the composite conductivity. An increase in the nitrogen content in CNTs leads to an increase in conductivity, a decrease in the work function, and the formation of defects in the outer walls of CNTs. It was found that the structural and chemical state of the polymer layer of all composites is the same. However, polymer morphology on nanotubes changes dramatically with increasing nitrogen content in CNTs: a thin smooth layer on uCNTs, a globular layer on N-CNTs, and a thick layer with a sheet-like structure on N+-CNTs. All composites showed the same response time (~20 s) and recovery time (~120 s). Ammonia sensitivity was 10.5 ± 0.2, 15.3 ± 0.5 and 2.2 ± 0.1 ppm−1 for PANI/uCNTs, PANI/N-CNTs and PANI/N+-CNTs, respectively. Based on the results obtained here, we came to the conclusion that the morphological features of the polymer layer on CNTs with different nitrogen content have a dominant effect on the gas reaction than the change in the electronic properties of the polymer at the interface “PANI-CNT”.

1. Introduction

Polyaniline (PANI)-carbon nanotube (CNT) composites are a promising material for various applications (gas sensors, supercapacitors, protective coatings, etc.). A similar chemical structure provides a strong interaction of the components due to π-π stacking between the quinoid rings of PANI and the π-bonded surface of CNTs [1]. There is also a synergistic effect, which manifests itself in the improvement of the electronic properties of the polymer in the PANI-CNT core-shell system [2,3]. During in-situ polymerization, nanotubes can act as a template for polymer orientation, defining its morphology. It is known that PANI is synthesized on the CNT surface along the nanotube plane, forming a highly ordered interfacial layer [4]. Therefore, the state of the nanotube surface has a great influence on the morphological properties of the composite.
The ability to modify CNTs in order to change their electronic properties or morphological features makes it possible to control the characteristics of PANI-containing composites. One of the methods is the injection of heteroatoms into the CNT structure [5,6,7]. It can be carried out both at the stage of nanotube synthesis and during subsequent processing. Nitrogen atoms are the most common type of electron donors for CNTs. This is due to similar electronic structures and the size of carbon and nitrogen atoms, which allows the latter to be embedded in the structure of the graphene plane in the form of electrically active defects: nitrogen in pyrrole, pyridine, and quaternary configurations [8,9]. Thus, the presence of pyridine and quaternary nitrogen in the CNT walls increases the concentration of charge carriers and consequently electrical conductivity. At the same time, nitrogen doping of carbon nanotubes enhances the degree of structural defects and distortion of nanotube walls, which is due to the size of impurity atoms being different from the size of carbon atoms. Thus, by changing the characteristics of nanotubes by doping, it is possible to achieve the required morphological and electronic parameters of PANI/CNT composites for various applications.
PANI and PANI-doped composites have excellent reversible response to ammonia [10,11,12,13]. PANI-CNT structures have a large surface-to-volume ratio, which makes them an extremely interesting material for use as the active layer of gas sensors. In this case, the main contribution to the gas response is made by the polymer, while nanotubes act as the reinforcing element and conduction channels. CNTs are known to have poor sensitivity to ammonia. [14]. Moreover, nanotubes in composites are in indirect contact with ammonia gas, but they can shunt the useful signal due to high conductivity. This effect can be eliminated by reducing the contribution of CNTs to the conductivity of composites.
One of the possible approaches to reducing the contribution of nanotubes to the conductivity of PANI/CNT composites can be the formation of a potential barrier, opposing the diffusion of charge carriers at the PANI-CNT interface, which is determined by the difference in the work functions of the contacting materials. The work function values for PANI and undoped CNTs are close and amount to 4.4–4.9 and ~4.6 eV, respectively [15,16,17,18,19]. Doping of CNTs with nitrogen atoms decreases the work function value and, consequently, creates a potential barrier at the PANI-CNT interface [20,21]. Thus, by changing the degree of nitrogen doping of nanotubes, one can change the value of this barrier.
In this work, the above-described approach is used to improve the sensing characteristics of PANI/CNT composites by varying the nitrogen concentration in nanotubes. For this purpose, nanotubes with 0, 2 and 4 at. % nitrogen were synthesized, which were used as templates for the PANI formation during in-situ oxidative polymerization of aniline. We carried out a comparative analysis of the morphology, structural-chemical state, and electronic properties of nanotubes with different nitrogen content and PANI-nanotube composites. For this, we used transmission electron microscopy (TEM), scanning electron microscopy (SEM), X-ray photoelectron spectroscopy (XPS), near-edge X-ray absorption fine structure (NEXAFS) spectroscopy, 4-probe method, and Kelvin probe force microscopy. Then the sensor response to ammonia (at 2–10 ppm), when individual PANI/CNT nanostructures were deposited on the multi-electrode array, was measured. The use of individual nanostructures made it possible to eliminate the influence of the free polymer, which is not directly bonded to nanotubes, on the gas response. As a result, we found that morphological features of the polymer layer on nanotubes with different nitrogen content have a greater effect on the response to gas than changes in the electronic properties of the polymer at the PANI-CNT interface.

2. Materials and Methods

2.1. CNTs Synthesis

Carbon nanotubes were synthesized by the catalytic chemical vapor deposition (CCVD) method in a gas-phase reactor under argon atmosphere [22]. Ferrocene Fe(C5H5)2 was used as a catalyst for the growth of carbon nanotubes (the ferrocene-precursor ratio 1:100). A comparative analysis was conducted for the following CNTs synthesized: undoped carbon nanotubes (uCNTs) synthesized from toluene and nitrogen-doped carbon nanotubes with a low (N-CNTs) and high (N+-CNTs) content of nitrogen synthesized from acetonitrile and the acetonitrile + triphenylphosphine mixture (99.9:0.1), respectively. The synthesis temperature for all variants of CNTs was 800 °C. During the preparation, the argon flow rate was maintained at 150 mL/min and the precursor flow rate was 10 mL/h. The total synthesis time was 30 min. Purification of CNTs from the catalyst was carried out by washing in 10% HCl for 48 h. Then the nanotubes were annealed in air at a temperature of 390 °C to remove amorphous carbon inclusions.

2.2. Synthesis of Composites

Polyaniline–carbon nanotube composites were synthesized by in-situ chemical oxidative polymerization of aniline (Omskreaktiv, Omsk, Russia). Nanotubes were preliminarily dispersed in isopropyl alcohol by sonication for 1 h. After adding aniline (the CNT/aniline mass ratio 1:100) and 3 M HCl, the nanotubes were sonicated again for 30 min. Ammonium persulfate (the aniline/oxidant molar ratio 1:1) was used as the oxidizing agent, which was dissolved in 3 M HCl. Both mixtures were cooled in the ice bath to 0 °C. The oxidizing agent was added dropwise to the first solution with constant stirring. The reaction time was 1 h. The reaction product was washed with water, acetone, and isopropyl alcohol, after which it was dried in air at room temperature.

2.3. Characterization of Samples
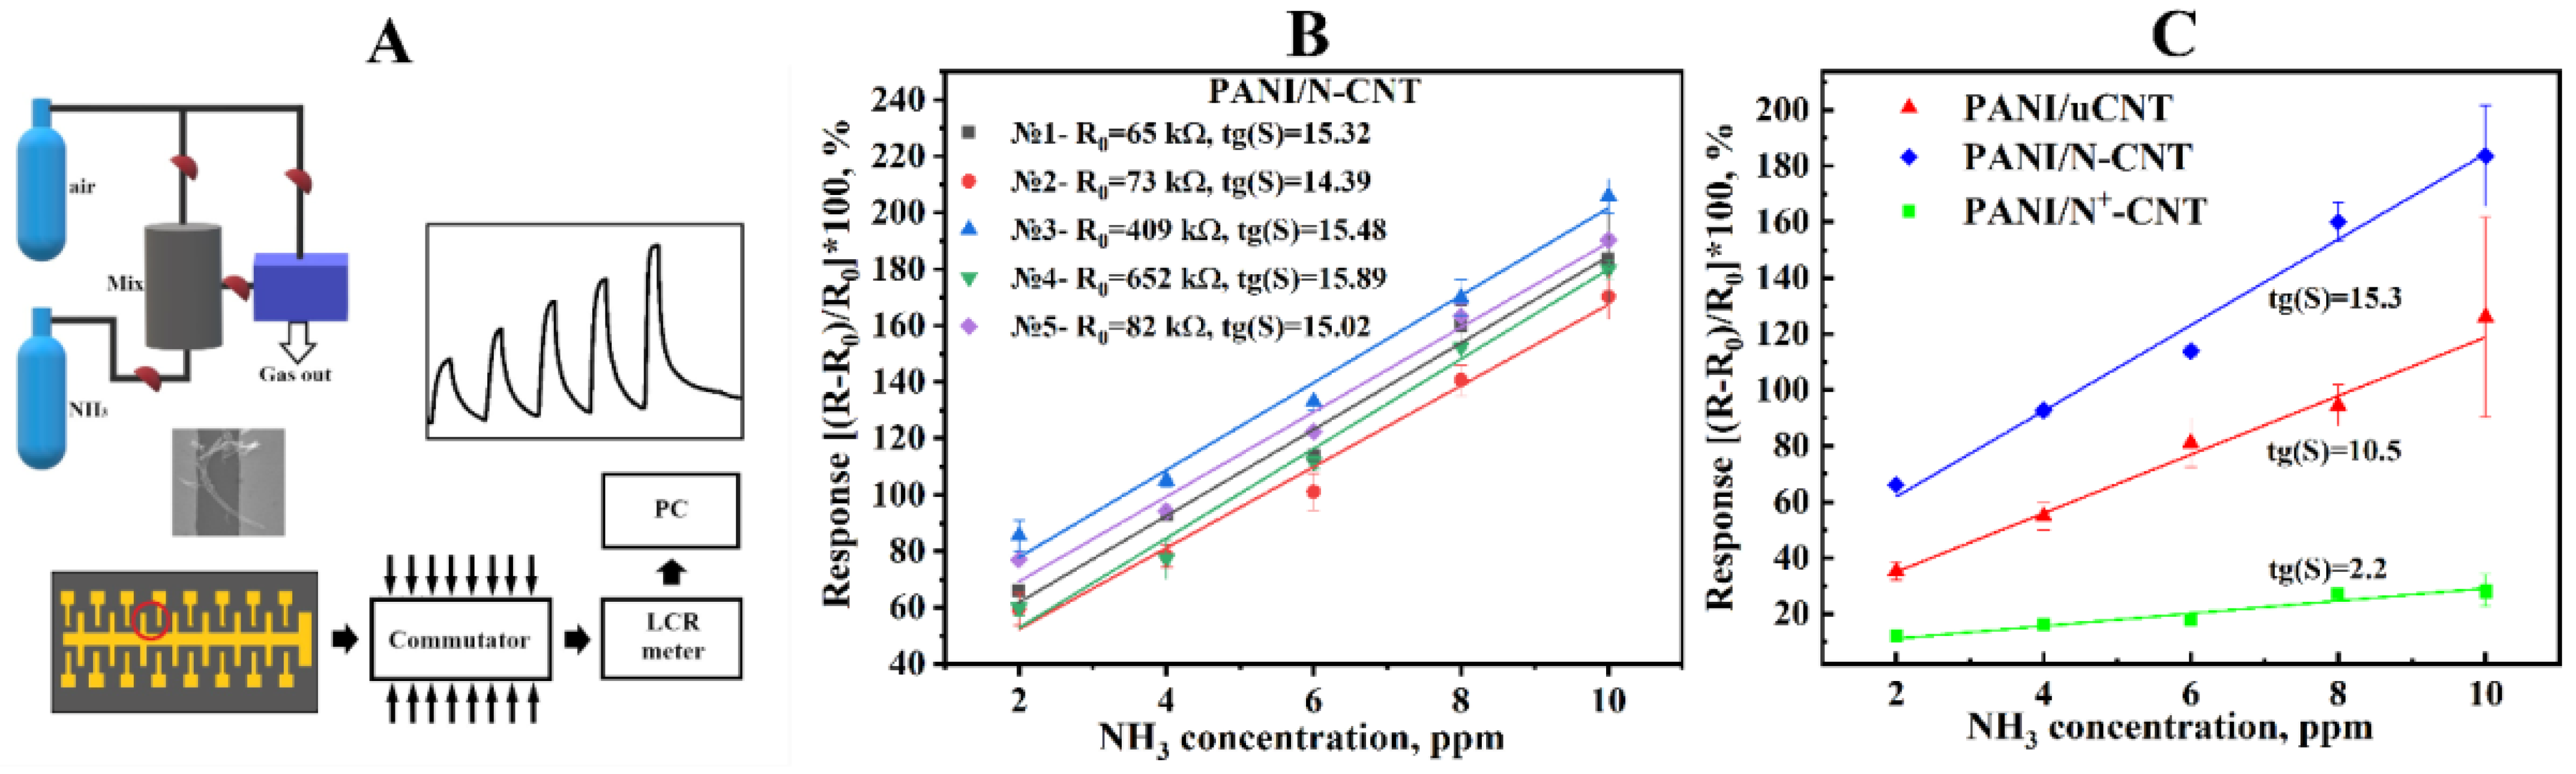
The morphology and structure of CNTs and PANI/CNT composites were studied using SEM (JSM-6610LV, JEOL, Tokyo, Japan) at the accelerating voltage 20 kV and TEM (JEM-2100, JEOL, Tokyo, Japan) in the bright-field mode at the accelerating voltage 200 kV.
The electronic structure and chemical state of carbon and nitrogen atoms of CNTs and PANI/CNT composites were analyzed using XPS at the Surface Science Center (Riber, Bezons, France). Photoemission (PE) spectra were excited using a nonmonochromatic X-ray source with the AlKα anticathode. The source power during recording PE spectra was 240 W. The depth of analysis by this method was ~3 nm. Quantitative elemental analysis was performed using spectra by the method of elemental sensitivity coefficients. Approximation of N 1s and C 1s PE core lines by a set of components was carried out using the CASA XPS 2.3.16 software package [23].
The NEXAFS analysis of the structural and chemical state of PANI/CNT composites was conducted using monochromatic synchrotron radiation and facilities of the Russian–German beamline at the BESSY II electron storage ring (Helmholtz Center Berlin, Berlin, Germany) [24]. Spectra were measured with the use of the Russian German Photoemission Station (RGL-PES). Spectra were recorded in the leakage current measurement mode. The NEXAFS spectra were normalized to the primary photon current from the gold-covered grid, which was simultaneously recorded. The energy resolution of the monochromator in the range of the C-K absorption edge of carbon was ~70 meV. The depth of analysis in these spectrum measurement modes reached ~15 nm.
Conductivity of materials was measured by the standard 4-probe method. The measurement was carried out on a TsIUS13 MP-0.5-001 digital impedance meter (Russia) using the measuring head with four linearly arranged gold-coated tungsten probes. To do this, samples were pressed into tablets 1 cm in diameter and about 1 mm in thickness.
The work function was determined using Kelvin probe force microscopy (KPFM) implemented on an AFM MFP-3D (Asylum Research, Santa Barbara, CA, USA). HA_FM/Au probes with conductive coatings (NT-MDT, Moscow, Russia) were used. The work function of the probe material was calibrated against a freshly cleaved layer of ZYA-grade highly oriented pyrolytic graphite (HOPG, TipsNano, Tallinn, Estonia) with the known work function 4.6 eV.

2.4. Gas Sensing

When synthesizing PANI/CNT composites, not only core-shell structures but also free PANI is formed. The study of gas sensitivity on bulk composites does not allow separating the contribution of free polymer from the contribution of PANI/CNT core-shell structures. Therefore, the measurements were carried out on PANI/CNT nanostructures containing 1–5 nanotubes. The content of free PANI in such structures is low. Nanostructures were isolated from the polymer volume by ultrasound in isopropyl alcohol. The processing time varied from 10 to 30 min for different samples, which is due to different degrees of polymer interaction in composites, and was chosen empirically. The suspension was spin-coated onto the multi-electrode array containing 16 independent gold contacts (2 µm gap).
Gas sensitivity was studied in a 2 mL chamber with the flow-through gas supply system. The resistance of nanostructures was measured on an E4980A LCR-meter (Agilent Technologies, Santa Clara, CA, USA) at room temperature. Ammonia gas of a certain concentration (2, 4, 6, 8 and 10 ppm) was passed through the measuring chamber. Degassing was carried out by pumping air through the cell. Three measurements were carried out per each of the five nanostructures of each composite. Response (S) is defined as the relative resistance change:
S = [(R − R0)/R0] ∗ 100%,
were R and R0 are the resistance of nanostructures in the presence of ammonia and in air, respectively. Sensitivity was defined as the slope of S with respect to the ammonia concentration for each nanostructure. The response time and recovery time were calculated as the time required for a sensor to reach 90% of the total response of the signal.

3. Results

TEM images for the nanotubes under study are shown in Figure 1A,D,G. According to the fast Fourier transform data, the interlayer spacing for all nanotubes is approximately equal to 0.35 nm, which is typical for this synthesis method [25]. It is clearly seen that the integrity of the outer walls of nanotubes deteriorates when nitrogen is introduced into the structure of nanotubes synthesized from acetonitrile taken as the carbon source (Figure 1D,G).
From the SEM images of the PANI/CNT composites (Figure 1B,E,H) it can be seen that the polymer layer completely covers the nanotubes. At the same time, there are significant differences in the polymer morphology on different types of nanotubes. The most uniform and thin polymer layer is formed on uCNT (Figure 1B,C). A thicker PANI layer is formed on the N-CNT (Figure 1E,F) and N+-CNT (Figure 1H,I) surfaces, locally reaching 200 nm. Polymer in the PANI/N-CNT composite is mostly globular, and the TEM images show that the composite is rich in pores (Figure 1F). The morphology of the PANI/N+-CNT composite is generally similar to that of PANI/N-CNT, and however sheet-like structures are observed on the surface. An increase in the thickness of the polymer layer in the PANI/N-CNT and PANI/N+-CNT composites can be associated with a larger number of defects in nanotubes, which contributes to the growth of the polymer outside the nanotube plane.
The results of the quantitative elemental XPS show that the nitrogen content in N-CNT and N+-CNT is ~2 and ~4 at.%, respectively (Table 1). A further increase in the concentration of nitrogen atoms in CNTs makes no sense since this leads to a critical decrease in the length of nanotubes with a slight change in the electronic characteristics [26]. The presence of oxygen in the XPS spectra of all synthesized nanotubes is due to its adsorption from the atmosphere, as well as the presence of chemically bonded functional groups of various types, which are always present on the surface [27].
For a detailed analysis of the chemical state of carbon, C1s PE spectra were decomposed into 5 components [25] (Figure 2). The C1 component (~284.5–284.6 eV) corresponds to the state of sp2-hybridized carbon atoms that form the framework of carbon nanotubes. The C2 component (~285.1 eV) is associated with structural defects in graphene layers, as well as with the state of carbon atoms located in the graphene network near carbon atoms chemically bonded to C*–C(O) and C*–C(N) heteroatoms. The C3 component (~287 eV) conforms to carbon atoms chemically bonded to oxygen or nitrogen atoms by a single covalent bond (C–O, C–N). The C4 component (~288 eV) is associated with carbon atoms chemically bonded to oxygen or nitrogen atoms by a double covalent bond (C=O, C=N). The high-energy C5 component of the spectrum corresponds to the state of carbon atoms in the composition of –COOH groups [25]. It can be seen from the C1s spectra presented in Figure 2 that the full width at half maximum (FWHM) line in the spectra of doped CNTs is higher as compared to that in the spectrum of undoped CNTs, increasing with a higher degree of doping. This is evidence for the growth in defectiveness of graphene layers due to the presence of nitrogen heteroatoms [28].
Figure 3 shows nitrogen spectra for nanotubes with various degrees of doping. Nitrogen in each nanotube type is in 5 different states, which correspond with pyridinic (N1), pyrrolic (N2) and graphitic (quaternary, N3) configurations as well as to oxidized (N4) and molecular nitrogen (N5) [25,29]. The spectral fitting results indicate that the intensity ratio of the components corresponding to different states of nitrogen is hardly affected by the degree of doping.
Figure 4 shows C1s NEXAFS spectra of the studied PANI/CNT composites. The absorption spectra for carbon reflect the transition from the C 1s core level to the unoccupied C 2s and 2p states of the conduction band, which have π* and σ* symmetry. It is known that C1s NEXAFS spectra of carbon nanotubes have two local maxima located at the photon energies ~285.3–285.4 and ~291.8 eV corresponding to the π* and σ* resonance, respectively (the main absorption structures of nanotubes are shown in Figure 4, vertical lines with resonance designations) [25,29]. The most intense peak at the photon energy ~285.3 eV corresponds to the π* states of carbon atoms in the composition of carbon–carbon bonds. The low-energy (~283.7 eV) maximum corresponds to the π* states of carbon atoms bonded to imine nitrogen (=N–) [30]. The maximum at the photon energy ~286.8 eV is associated with the π* states of carbon atoms bonded to amine nitrogen (–NH–) [30]. In doing so, the maxima at the photon energies ~288.6 and 290.0 eV conform to the π*(C=O) and σ*(C–O) states of carbon atoms in the carbon-oxygen groups [31]. In the far region of the spectrum, the maxima at the photon energies ~294.6 and 302 eV reflect carbon states with the σ* symmetry. It is important to note that the position of the σ*(C=C) resonance in the NEXAFS spectrum of MWCNTs is ~291.8 eV [25]. This fact allows us to conclude that the main signal in the C1s NEXAFS spectra of the composites is introduced by carbon, which is part of PANI. Thus, the spectra of the composites have the same set of local maxima and almost coincident relative intensities, which suggests close structural-chemical states of their surface layers. This conclusion is also supported by the Fourier-transform infrared spectroscopy data (see Figure S1).
The conductivity of nanotubes (as expected) increases at a higher content of nitrogen heteroatoms (Figure 5A), which increases the concentration of charge carriers in CNTs [32]. The conductivity of the PANI/N-CNT and PANI/N+-CNT composites is higher than that of the undoped nanotube composite. However, the high conductivity of N+-CNT does not provide an increase in the conductivity of the PANI/N+-CNT composite relative to PANI/N-CNT. This effect can be associated with a decrease in the contribution of nanotubes to the conductivity of composites due to a higher energy barrier between the polymer and nanotube. The barrier value can be estimated from the difference between the work functions (Φ, eV) of the polymer and the nanotube. It was determined by the scanning Kelvin probe microscopy (SKPM) technique described elsewhere [21,33]. The work function (Figure 5B) for uCNT, N-CNT, and N+-CNT are 4.80 ± 0.07, 4.65 ± 0.08, and 4.56 ± 0.12 eV, respectively. The work functions for all PANI composites are Φ = 4.95 ± 0.15 eV. Thus, the PANI/N+-CNT composite has the highest energy barrier. Another important factor in reducing the conductivity of PANI/N+-CNT from that of PANI/N-CNT may be the disruption of the highly ordered PANI layer due to serious damage to the N+-CNT graphene plane [34]. Despite the fact that this layer is located only near nanotubes, it can be one of the main types of conduction channels in the composite (along with CNTs).
It should be noted that the conductivity measured on individual nanotubes is three orders of magnitude higher than the conductivity measured on pressed CNT pellets [35]. Such a decrease in conductivity can be explained by the contact resistance between individual nanotubes in a pellet. Polyaniline is a plastic electrically conductive material, and when pressed, good contact is formed between the individual components of the composite. Therefore, the close absolute values of the specific conductivity of nanotubes and composites should not be misleading.
Summarizing, we can say that, during the CCVD synthesis of nanotubes with different nitrogen content, the defectiveness of the outer walls of CNTs increases. At the same time, the work function decreases from 4.8 eV for PANI/uCNT to 4.65 and 4.56 eV for N-CNT and N+-CNT, respectively. Since the conditions of PANI/CNT synthesis are identical, the work function is the same in all composites and amounts to 4.95 eV. Thus, the problem of an increased potential barrier at the PANI-CNT boundary has been successfully solved. However, the morphology of polymer grown on uCNT, N-CNT, and N+-CNT is fundamentally different, which can make changes in the measurement of gas-sensing properties of composites.
A schematic diagram of measurement of gas sensitivity of composites and an example of the studied nanostructure are shown in Figure 6A. The change in resistance is recorded at the time step 1 s. Figure 6B shows the distribution of resistive response and resistance (R0) in air for five different PANI/N-CNT nanostructures. For all samples under study, the resistance lies in the range from several tens to several hundreds of kΩ. The response value is different for each nanostructure at the same ammonia concentration. However, the slope of S relative to the ammonia concentration (tg(S)) is close within one composite.
Figure 6C gives an example of the gas test results for typical PANI/CNT, PANI/N-CNT and PANI/N+-CNT nanostructures (three measurements per each NH3 concentration). Response S, calculated as a relative change in resistance, is positive for all composites and increases with increasing ammonia dose. The slope of S relative to the ammonia concentration (sensitivity tg(S)) equals 10.5 ± 0.2, 15.2 ± 0.5, and 2.2 ± 0.1 for PANI/CNT, PANI/N-CNT, and PANI/N+-CNT, respectively. This points to the possibility of using PANI/CNT nanostructures as an active layer of gas sensors for the quantitative determination of ammonia concentration. In addition, all composites show fast response time (15–25 s) and recovery time (100–150 s) regardless of the ammonia concentration (Figure S2). It should be noted that the sensory characteristics of PANI/CNTs of composites strongly depend on the structures on which the tests are carried out. For example, the response time can vary from units of seconds on nanofibers and sparse grids [36] up to hundreds of seconds on as-prepared films [37]. Sensitivity can also vary from fractions of units per ppm to several tens per ppm [38]. Thus, the sensor characteristics obtained by us show good values comparable to those obtained on nanofibers and sparse grids.
It is well known that PANI in the doped form has a great and reversible response to NH3 gas. Ammonia reacts with the H+ dopant proton, absorbing available carriers [39,40]. Gas sensing processes occur mainly on the surface of sensor materials [41], and therefore its morphology plays an important role. The higher the area-to-volume ratio, the larger the number of gas adsorption centers and the higher the sensor characteristics. Nanotubes used in our work determine the morphology of polymer, leaving its chemical structure unchanged. Therefore, it can be argued that differences in S and tg(S) are associated with the morphological features of composites. The sensitivity of composites is primarily determined by the sensitivity of the PANI layer. On the surface of the PANI layer, there is always a space charge region (SCR) depleted of charge carriers (Figure 7). In this case, the effect of gaseous ammonia leads to an increase in the SCR thickness and a decrease in the electrical conductivity of the PANI layer.
An increase in tg(SPANI/N-CNT) relative to tg(SPANI/uCNT) can be explained by an increase in the specific surface area of the sensitive layer due to the globular morphology of the PANI layer. A significant decrease in tg(SPANI/N+-CNT) relative to other composites is most likely due to the presence of sheet-like structures on the surface. These structures are one of the supramolecular forms of PANI, which are also mentioned in other works [42,43,44]. They present the same gas adsorption centers as the rest PANI in the composite. However, they do not affect the conductivity of polymer, since SCRs can be completely filled due to their small thickness. Thus, the effective surface area is reduced.

4. Conclusions

The CCVD method was used to prepare CNTs with different content of nitrogen heteroatoms (0, 2, and 4 at.%). This made it possible to obtain nanotubes with the work functions 4.80 ± 0.07, 4.65 ± 0.08, and 4.56 ± 0.12 eV for uCNT, N-CNT, and N+-CNT, respectively. With an increase in the nitrogen concentration in nanotubes, an increase is observed in their conductivity (uCNT—0.62 ± 0.02 S/cm, N-CNT—1.76 ± 0.16 S/cm, and N+-CNT—2.17 ± 0.06 S/cm). The structural and chemical analysis of the obtained nanotubes showed that the chemical state of nitrogen in both doped CNTs is practically the same. The analysis of the chemical state of carbon showed that an increase in the concentration of nitrogen atoms in nanotubes causes a decrease in the content of sp2-hybridized carbon atoms (uCNT—88.2%, N-CNT—82.6%, and N+-CNT—73.6%). This indicates a higher degree of defectiveness of the outer CNT layers during doping, which is also confirmed by morphological studies of CNTs using TEM.
It was found that PANI in all PANI/CNT composites has identical structural and chemical states, which is confirmed by NEXAFS and FTIR methods. The work function value is also the same for all composites (4.95 ± 0.15 eV). Thus, the value of the potential barrier at the PANI–CNT interface was increased from 0.15 eV for PANI/uCNT to 0.3 and 0.39 eV for PANI/N-CNT and PANI/N+-CNT, respectively. At the same time, the dependence of the conductivity of both composites and nanotubes on the nitrogen concentration in nanotubes is different. Thus, σ(PANI/N-CNT) > σ(PANI/N+-CNT), while the conductivity of nanotubes increases at a higher concentration of nitrogen in them. This is indicative of a decrease in the contribution of N+-CNTs to the conductivity of the respective composite.
The polymer morphology critically depends on the degree of imperfection of the nanotube surface. A uniform and thin polymer layer is formed on uCNT. On both nitrogen-doped CNTs, a polymer layer is of much greater thickness and has a relief morphology: globular on N-CNT and globular with sheet-like structures on N+-CNT.
The analysis of the response of composites to ammonia was carried out on PANI/CNTs nanostructures. All samples showed similar response (~20 s) and recovery (~120 s) times. It was shown that the response value S of different nanostructures (they may contain different amounts of CNTs) of the same composite can vary in a wide range. However, the dependence of the response on the ammonia concentration (2–10 ppm) is linear, and the slope of this dependence (sensitivity, tg(S)) is the same for all composites. This indicates the possibility of using PANI/CNT nanostructures as an active layer of gas sensors for the quantitative determination of ammonia concentration. Thus, the sensitivity is 10.5 ± 0.2, 15.3 ± 0.5 and 2.2 ± 0.1 ppm−1 for PANI/uCNT, PANI/N-CNT and PANI/N+-CNT composites, respectively. An increase in the sensitivity of PANI/N-CNT as compared to PANI/uCNT is associated with a growth in the specific surface area of the sensitive layer. A significant decrease in the sensitivity to ammonia was found in PANI/N+-CNT, which is associated with a reduction in the effective surface area of polymer due to the presence of sheet-like structures on the surface, which are not involved in the conduction due to the full occupancy of the SCR.
Thus, the morphological features of the composites had a dramatic effect on the gas sensing properties, which must be taken into account when developing new materials for sensitive elements of sensors. The length of this work does not allow us to separate the contribution of the morphology from the contribution of the potential barrier at the PANI–CNT interface to the sensing properties of nanostructures. In the future, it is planned to use other methods for changing the work function of nanotubes without significant changes in morphology.

Supplementary Materials

The following supporting information can be downloaded at: https://www.mdpi.com/article/10.3390/app12147169/s1, Figure S1: FTIR transmission spectra of PANI/uCNT, PANI/N-CNT and PANI/N+-CNT; Figure S2: Scheme for determining the timing characteristics of gas tests (a); response (b) and recovery (c) time of PANI/uCNT, PANI/N-CNT and PANI/N+-CNT nanostructures.

Author Contributions

I.A.L.: conceptualization, methodology, supervision, investigation, writing—original draft. N.A.D.: conceptualization, methodology, formal analysis. S.N.N.: investigation, methodology, writing—original draft. D.V.S.: investigation. P.M.K.: investigation, methodology, writing—review and editing. All authors have read and agreed to the published version of the manuscript.

Funding

This research was funded by the Governmental Order for Omsk Scientific Center SB RAS, Project Registration Number 121021600004-7 and partly supported by St. Petersburg State University (ID: 74883303) in terms of obtaining and studying the composite based on undoped nanotubes.

Institutional Review Board Statement

Not applicable.

Informed Consent Statement

Not applicable.

Data Availability Statement

Not applicable.

Acknowledgments

The authors are grateful to the Helmholtz Zentrum Berlin für Materialien und Energie for support during NEXAFS measurements within the bilateral Russian–German Laboratory program (project No. 192-08770 ST). The authors are thankful to Yu. A. Sten’kin for the synthesis of the initial CNTs. The present research made use of the equipment of the Omsk Regional Shared Equipment Center SB RAS.

Conflicts of Interest

The authors declare no conflict of interest.

References

  1. Zhang, J.; Zhu, A. Study on the synthesis of PANI/CNT nanocomposite and its anticorrosion mechanism in waterborne coatings. Prog. Org. Coat. 2021, 159, 106447. [Google Scholar] [CrossRef]
  2. Liao, Y.Z.; Zhang, C.; Wang, X.; Li, X.G.; Ippolito, S.J.; Kalantar-Zadeh, K.; Kaner, R.B. Carrier Mobility of Single-Walled Carbon Nanotube-Reinforced Polyaniline Nanofibers. J. Phys. Chem. C 2011, 115, 16187–16192. [Google Scholar] [CrossRef]
  3. Yao, Q.; Wang, Q.; Wang, L.; Chen, L. Abnormally enhanced thermoelectric transport properties of SWNT/PANI hybrid films by the strengthened PANI molecular ordering. Energy Environ. Sci. 2014, 7, 3801–3807. [Google Scholar] [CrossRef]
  4. Wang, X.; Wang, H.; Liu, B. Carbon Nanotube-Based Organic Thermoelectric Materials for Energy Harvesting. Polymers 2018, 10, 1196. [Google Scholar] [CrossRef] [Green Version]
  5. Lee, W.J.; Maiti, U.N.; Lee, J.M.; Lim, J.; Han, T.H.; Kim, S.O. Nitrogen-doped carbon nanotubes and graphene composite structures for energy and catalytic applications. Chem. Commun. 2014, 50, 6818. [Google Scholar] [CrossRef]
  6. Oluigbo, C.J.; Xu, Y.; Louis, H.; Yusuf, A.B.; Yaseen, W.; Ullah, N.; Xie, J. Controllable fabrication of abundant nickel-nitrogen doped CNT electrocatalyst for robust hydrogen evolution reaction. Appl. Surf. Sci. 2021, 562, 150161. [Google Scholar] [CrossRef]
  7. Byeon, H.; Gu, B.; Kim, H.-J.; Lee, J.H.; Seo, I.; Kim, J.; Kim, J.-K. Redox chemistry of nitrogen-doped CNT-encapsulated nitroxide radical polymers for high energy density and rate-capability organic batteries. Chem. Eng. J. 2021, 413, 127402. [Google Scholar] [CrossRef]
  8. Muangrat, W.; Wongwiriyapan, W.; Yordsri, V.; Chobsilp, T.; Inpaeng, S.; Issro, C.; Domanov, O.; Ayala, P.; Pichler, T.; Shi, L. Unravel the Active Site in Nitrogen-Doped Double-Walled Carbon Nanotubes for Nitrogen Dioxide Gas Sensor. Phys. Status Solidi A 2018, 215, 1800004. [Google Scholar] [CrossRef]
  9. Li, B.; Sun, X.; Su, D. Calibration of the basic strength of the nitrogen groups on the nanostructured carbon materials. Phys. Chem. Chem. Phys. 2015, 17, 6691–6694. [Google Scholar] [CrossRef]
  10. Pang, Z.; Yildirim, E.; Pasquinelli, M.A.; Wei, Q. Ammonia Sensing Performance of Polyaniline-Coated Polyamide 6 Nanofibers. ACS Omega 2021, 6, 8950–8957. [Google Scholar] [CrossRef]
  11. Fratoddi, I.; Venditti, I.; Cametti, C.; Russo, M.V. Chemiresistive polyaniline-based gas sensors: A mini review. Sens. Actuators B Chem. 2015, 220, 534–548. [Google Scholar] [CrossRef]
  12. Li, S.; Lin, P.; Zhao, L.; Wang, C.; Liu, D.; Liu, F.; Lu, G. The room temperature gas sensor based on Polyaniline@flower-like WO 3 nanocomposites and flexible PET substrate for NH3 detection. Sens. Actuators B Chem. 2018, 259, 505–513. [Google Scholar] [CrossRef]
  13. Abdulla, S.; Mathew, T.L.; Pullithadathil, B. Highly sensitive, room temperature gas sensor based on polyaniline-multiwalled carbon nanotubes (PANI/MWCNTs) nanocomposite for trace-level ammonia detection. Sens. Actuators B Chem. 2015, 221, 1523–1534. [Google Scholar] [CrossRef]
  14. Le, X.V.; Luu, T.L.A.; Nguyen, H.L.; Nguyen, C.T. Synergistic enhancement of ammonia gas-sensing properties at low temperature by compositing carbon nanotubes with tungsten oxide nanobricks. Vacuum 2019, 168, 108861. [Google Scholar] [CrossRef]
  15. Toušek, J.; Rutsch, R.; Toušková, J. Explanation of the high conductivity of HCl protonated polyaniline films. Mater. Chem. Phys. 2021, 260, 124153. [Google Scholar] [CrossRef]
  16. Abdulrazzaq, O.; Bourdo, S.E.; Saini, V.; Watanabe, F.; Barnes, B.; Ghosh, A.; Biris, A.S. Tuning the work function of polyaniline via camphorsulfonic acid: An X-ray photoelectron spectroscopy investigation. RSC Adv. 2015, 5, 33–40. [Google Scholar] [CrossRef]
  17. Gong, B.; Ikematsu, A.; Waki, K. Impacts of structure defects and carboxyl and carbonyl functional groups on the work function of multiwalled carbon nanotubes. Carbon 2017, 114, 526–532. [Google Scholar] [CrossRef]
  18. Popov, E.O.; Kolosko, A.G.; Filippov, S.V. Electrical field admissible values for the classical field emitter regime in the study of large area emitters. AIP Adv. 2019, 9, 015129. [Google Scholar] [CrossRef] [Green Version]
  19. Benko, A.; Duch, J.; Gajewska, M.; Marzec, M.; Bernasik, A.; Nocuń, M.; Piskorz, W.; Kotarba, A. Covalently bonded surface functional groups on carbon nano-tubes: From molecular modeling to practical applications. Nanoscale 2021, 13, 10152–10166. [Google Scholar] [CrossRef]
  20. Park, J.S.; Lee, J.M.; Hwang, S.K.; Lee, S.H.; Lee, H.-J.; Lee, B.R.; Park, H.I.; Kim, J.-S.; Yoo, S.; Song, M.H.; et al. A ZnO/N-doped carbon nanotube nanocomposite charge transport layer for high performance optoelectronics. J. Mater. Chem. 2012, 22, 12695–12700. [Google Scholar] [CrossRef]
  21. Davletkildeev, N.A.; Stetsko, D.V.; Bolotov, V.V.; Stenkin, Y.A.; Korusenko, P.M.; Nesov, S.N. Determination of work function in the individual carbon nanotubes using electrostatic force microscopy. Mater. Lett. 2015, 161, 534–537. [Google Scholar] [CrossRef]
  22. Bolotov, V.V.; Kan, V.E.; Biryukov, M.Y.; Knyazev, E.V.; Shelyagin, R.V.; Korusenko, P.M.; Nesov, S.N.; Sten’kin, Y.A. Origin of the LowFrequency Band in Raman Spectra of MultiWalled Carbon Nanotubes Synthesized by the CVD Method. Phys. Solid State 2013, 55, 1459–1462. [Google Scholar] [CrossRef]
  23. Fairley, N.; Fernandez, V.; Richard-Plouet, M.; Guillot-Deudon, C.; Walton, J.; Smith, E.; Flahaut, D.; Greiner, M.; Biesinger, M.; Tougaard, S.; et al. Systematic and collaborative approach to problem solving using X-ray photoelectron spectroscopy. Appl. Surf. Sci. Adv. 2021, 5, 100112. [Google Scholar] [CrossRef]
  24. Fedoseenko, S.I.; Iossifov, I.E.; Gorovikov, S.A.; Schmidt, J.-S.; Follath, R.; Molodtsov, S.L.; Adamchuk, V.K.; Kaindl, G. Development and present status of the Russian–German soft X-ray beamline at BESSY II. Nucl. Instrum. Methods Phys. Res. Sect. A 2001, 470, 84–88. [Google Scholar]
  25. Korusenko, P.M.; Nesov, S.N.; Iurchenkova, A.A.; Fedorovskaya, E.O.; Bolotov, V.V.; Povoroznyuk, S.N.; Smirnov, D.A.; Vinogradov, A.S. Comparative Study of the Structural Features and Electrochemical Properties of Nitrogen-Containing Multi-Walled Carbon Nanotubes after Ion-Beam Irradiation and Hydrochloric Acid Treatment. Nanomaterials 2021, 11, 2163. [Google Scholar] [CrossRef]
  26. Wiggins-Camacho, J.D.; Stevenson, K.J. Effect of Nitrogen Concentration on Capacitance, Density of States, Electronic Conductivity, and Morphology of N-Doped Carbon Nanotube Electrodes. J. Phys. Chem. C 2009, 113, 19082–19090. [Google Scholar] [CrossRef]
  27. Tomczyk, M.M.; Boncel, S.; Herman, A.; Krawczyk, T.; Jakóbik-Kolon, A.; Pawlyta, M.; Kuźnik, N. Oxygen Functional Groups on MWCNT Surface as Critical Factor Boosting T2 Relaxation Rate of Water Protons: Towards Improved CNT-Based Contrast Agents. Int. J. Nanomed. 2020, 15, 7433–7450. [Google Scholar] [CrossRef]
  28. Nxumalo, E.N.; Coville, N.J. Nitrogen Doped Carbon Nanotubes from Organometallic Compounds: A Review. Materials 2010, 3, 2141–2171. [Google Scholar] [CrossRef] [Green Version]
  29. Bobenko, N.G.; Bolotov, V.V.; Egorushkin, V.E.; Korusenko, P.M.; Melnikova, N.V.; Nesov, S.N.; Povoroznyuk, S.N. Experimental and theoretical study of electronic structure of disordered MWCNTs. Carbon 2019, 153, 40–51. [Google Scholar] [CrossRef]
  30. Bulusheva, L.G.; Fedorovskaya, E.O.; Okotrub, A.V.; Maximovskiy, E.A.; Vyalikh, D.V.; Chen, X.; Song, H. Electronic state of polyaniline deposited on carbon nanotube or ordered mesoporous carbon templates. Phys. Status Solidi B Basic Res. 2011, 248, 2484–2487. [Google Scholar] [CrossRef]
  31. Nesov, S.N.; Korusenko, P.M.; Sachkov, V.A.; Bolotov, V.V.; Povoroznyuk, S.N. Effects of preliminary ion beam treatment of carbon nanotubes on structures of interfaces in MOx/multi-walled carbon nanotube (M =Ti,Sn) composites: Experimental and theoretical study. J. Phys. Chem. Solids 2022, 169, 110831. [Google Scholar] [CrossRef]
  32. Eklund, K.; Karttunen, A.J. Effect of the Dopant Configuration on the Electronic Transport Properties of Nitrogen-Doped Carbon Nanotubes. Nanomaterials 2022, 12, 199. [Google Scholar] [CrossRef] [PubMed]
  33. Lobov, I.A.; Davletkildeev, N.A.; Sokolov, D.V. Work function tuning of the individual polyaniline/carbon nanotube nanostructures. IOP Conf. Ser. Mater. Sci. Eng. 2018, 443, 012021. [Google Scholar] [CrossRef]
  34. Zhang, Y.; Zhang, Q.; Chen, G. Carbon and carbon composites for thermoelectric applications. Carbon Energy 2020, 2, 408–436. [Google Scholar] [CrossRef]
  35. Davletkildeev, N.A.; Sokolov, D.V.; Mosur, E.Y.; Bolotov, V.V.; Lobov, I.A. Determination of the Conductivity of Individual Carbon Nanotubes Based on Image Profile Analysis of Electrostatic Force Microscopy. Instrum. Exp. Tech. 2019, 62, 578–581. [Google Scholar] [CrossRef]
  36. Chen, D.-J.; Lei, S.; Wang, R.-H.; Pan, M.; Chen, Y.-Q. Dielectrophoresis Carbon Nanotube and Conductive Poly-aniline Nanofiber NH3 Gas Sensor. Chin. J. Anal. Chem. 2012, 40, 145–149. [Google Scholar] [CrossRef]
  37. Eising, M.; O’Callaghan, C.; Eduardo Cava, C.; Schmidt, A.; Gorgatti Zarbin, A.J.; Ferreira, M.S.; Roman, L.S. The role of carbon nanotubes on the sensitivity of composites with polyaniline for ammonium sensors. Carbon Trends 2021, 3, 100026. [Google Scholar] [CrossRef]
  38. Tanguy, N.R.; Thompson, M.; Yan, N. A review on advances in application of polyaniline for ammonium detection. Sens. Actuators B Chem. 2018, 257, 1044–1064. [Google Scholar] [CrossRef]
  39. Adhikari, B.; Majumdar, S. Polymers in sensor applications. Prog. Polym. Sci. 2004, 29, 699–766. [Google Scholar] [CrossRef]
  40. Silveira, F.; Duarte, G.; Tachinski, C.; Piletti, R.; Fiori, J.; Peterson, M.; Riella, H.; Fiori, M. Polyaniline synthesis using hydrofluoric acid as doping agent:comparative evaluation with polyaniline doped with sulfuric acid. J. Appl.Polym. Sci. 2013, 128, 430–435. [Google Scholar] [CrossRef]
  41. Yang, Z.; Dou, X. Emerging and Future Possible Strategies for Enhancing 1D Inorganic Nanomaterials-Based Electrical Sensors towards Explosives Vapors Detection. Adv. Funct. Mater. 2016, 26, 2406–2425. [Google Scholar] [CrossRef]
  42. Dong, Y.; Han, W.; Choi, H. Polyaniline Coated Core-Shell Typed Stimuli-Responsive Microspheres and Their Electrorheology. Polymers 2018, 10, 299. [Google Scholar] [CrossRef] [PubMed] [Green Version]
  43. Rana, U.; Malik, S. Graphene oxide/polyaniline nanostructures: Transformation of 2D sheet to 1D nanotube and in situ reduction. Chem. Commun. 2012, 48, 10862. [Google Scholar] [CrossRef] [PubMed]
  44. Xie, F.; Zhou, M.; Wang, G.; Wang, Q.; Yan, M.; Bi, H. Morphology-dependent electrochemical performance of nitrogen-doped carbon dots@polyaniline hybrids for supercapacitors. Int. J. Energy Res. 2019, 43, 7529–7540. [Google Scholar] [CrossRef]
Figure 1. TEM images of uCNT (A), N-CNT (D), and N+-CNT (G); SEM and TEM images of PANI/uCNT (B,C), PANI/N-CNT (E,F) and PANI/N+-CNT (H,I) composites.
Applsci 12 07169 g001
Figure 2. C1s PE spectra of uCNT (a), N-CNT (b) and N+-CNT (c).
Applsci 12 07169 g002
Figure 3. N1s PE spectra of N-CNT (a) and N+-CNT (b).
Applsci 12 07169 g003
Figure 4. C1s NEXAFS spectra of PANI/uCNT, PANI/N-CNT and PANI/N+-CNT.
Applsci 12 07169 g004
Figure 5. Conductivity (A) and work functions (B) of uCNT, N-CNT, N+-CNT and PANI/uCNT, PANI/N-CNT, PANI/N+-CNT composites.
Applsci 12 07169 g005
Figure 6. Schematic of the experimental platform (A); response of various PANI/N-CNT nanostructures (B); response of typical PANI/uCNT, PANI/N-CNT and PANI/N+-CNT nanostructures (C).
Applsci 12 07169 g006
Figure 7. Schematic of changes if the SCR of PANI/uCNT, PANI/N-CNT and PANI/N+-CNT composites during ammonia adsorption.
Applsci 12 07169 g007
Table 1. Chemical analysis of the samples by XPS.
CNTs TypeConcentration, at. %
[C][N][O]
uCNT 96.0-4.0
N-CNT93.42.14.5
N+-CNT92.64.03.4
Publisher’s Note: MDPI stays neutral with regard to jurisdictional claims in published maps and institutional affiliations.

