Article

Connectivity Alterations in Vascular Parkinsonism: A Structural Covariance Study

by
Fabiana Novellino
1,2,*,†,
Maria Salsone
3,4,†,
Roberta Riccelli
1,
Carmelina Chiriaco
5,
Giuseppe Argirò
1,
Andrea Quattrone
5,6,
José L. M. Madrigal
2,
Luigi Ferini Strambi
4 and
Aldo Quattrone
1,7
1
Institute of Molecular Bioimaging and Physiology, National Research Council, 88100 Catanzaro, Italy
2
Department of Pharmacology and Toxicology, School of Medicine, Universidad Complutense de Madrid (UCM), Instituto de Investigación Sanitaria Hospital 12 de Octubre (Imas12), Instituto de Investigación Neuroquímica (IUINQ-UCM), Centro de Investigación Biomédica en Red de Salud Mental (CIBERSAM), Av. Complutense s/n, 28040 Madrid, Spain
3
Institute of Molecular Bioimaging and Physiology, National Research Council, 20054 Milano, Italy
4
Sleep Disorders Center, Division of Neuroscience, San Raffaele Scientific Institute, 20127 Milano, Italy
5
Institute of Neurology, University “Magna Graecia”, 88100 Catanzaro, Italy
6
Department of Clinical and Movement Neurosciences, UCL Queen Square Institute of Neurology, University College London, London WC1E 6BT, UK
7
Neuroscience Center, Magna Graecia University, 88100 Catanzaro, Italy
*
Author to whom correspondence should be addressed.
These authors contributed equally to this work.
Appl. Sci. 2022, 12(14), 7240; https://doi.org/10.3390/app12147240
Submission received: 11 May 2022 / Revised: 30 June 2022 / Accepted: 15 July 2022 / Published: 18 July 2022
(This article belongs to the Special Issue Neuroimaging in Parkinson's Disease)

Abstract

:
This study aimed to investigate the structural covariance between the striatum and large-scale brain regions in patients with vascular parkinsonism (VP) compared to Parkinson’s disease (PD) and control subjects, and then explore the relationship between brain connectivity and the clinical features of our patients. Forty subjects (13 VP, 15 PD, and 12 age-and-sex-matched healthy controls) were enrolled in this study. They each underwent a careful clinical and neuropsychological evaluation, DAT-SPECT scintigraphy and 3T MRI scan. While there were no differences between PD and VP in the disease duration and severity, nor in terms of the DAT-SPECT evaluations, VP patients had a reduction in structural covariance between the bilateral corpus striatum (both putamen and caudate) and several brain regions, including the insula, thalamus, hippocampus, anterior cingulate cortex and orbito-frontal cortex compared to PD and controls. VP patients also showed lower scores on several neuropsychological tests. Interestingly, in the VP group, structural connectivity alterations were significantly related to cognitive evaluations exploring executive functions, memory, anxiety and depression. This compelling evidence suggests that structural disconnection in the basal ganglia circuits spreading in critical cortical regions may be involved in the pathophysiology of cognitive impairment in VP.

1. Introduction

Vascular parkinsonism (VP) is a heterogeneous condition presenting the clinical picture of a multifaceted parkinsonian syndrome, characterized by a neuroimaging spectrum of lesions visually appreciable on conventional magnetic resonance imaging (MRI) scans. Brain lesions may include extensive white matter lesions (WML), multiple cerebral infarctions in basal ganglia, or both [1]. In particular, WM damage is crucial in VP for both the development of specific clinical features and the severity of the disease [1,2]. Moreover, it has also been reported that normal-appearing white matter (NAWM) damage may occur in these patients but not in patients with Parkinson’s disease (PD). Finally, NAWM alterations may be related to the clinical picture and it has been suggested that non-clearly visible WM alterations may contribute to the pathophysiology of this vascular disease [3]. Not only structural but also functional alterations have been described in VP patients. Nuclear medicine techniques such as dopamine transporter single-photon emission computed tomography (DAT-SPECT) have been tested to investigate the integrity of presynaptic dopaminergic neurons. DAT-SPECT may be abnormal or normal in VP patients, thus identifying different clinical subtypes [4].
In recent years, emerging neuroimaging techniques have been developed. It is the case of structural covariance, a recent MRI analysis approach that allows investigating the anatomic organization of the brain in terms of co-variation of gray matter morphology between brain regions [5]. This approach is based on the presumption that regions with related atrophy are part of the same functional network, and consequently, it provides information on structural brain connectivity. Investigations of structural covariance patterns have primarily focused on neurodegenerative diseases, demonstrating abnormal structural connections of brain areas potentially liable to the clinical manifestations of these diseases [5]. In PD patients, structural covariance studies have demonstrated extensive alterations in cortical connectivity in many brain regions in the mid-stage of the disease [6], and structural changes occurring in the corticolimbic network represent an early predictive biomarker of cognitive impairment [7]. Moreover, the structural covariance analyses were applied to the basal ganglia circuitry, identifying abnormalities in the caudate-associated network and demonstrating the interactions between basal ganglia atrophy and progressive structural network alterations [8].
To date, no study has investigated structural covariance in patients with VP. We hypothesized that the structural covariance analysis might highlight peculiar characteristics of the cerebral topographical organization in VP, different from idiopathic PD. In particular, VP patients with the status cribrosus of basal ganglia and the dopaminergic striatal deficit could have altered structural connections between the striatum and the brain. Thus, in the current study, using a neuroimaging approach, we performed a structural covariance analysis to investigate brain connectivity between corpus striatum and overall brain regions in patients with VP compared to those with PD and controls. Furthermore, we tested the hypothesis that altered brain connectivity may be related to the clinical features of our patients.

2. Materials and Methods

2.1. Participants

Forty subjects (13 patients with VP, 15 patients with PD and 12 age-and-sex-matched controls) were included in this study.
VP patients fulfilled previously published clinical criteria for VP [9] and all PD patients for Parkinson’s disease [10]. In detail, we defined VP in the presence of the following criteria: (i) clinical parkinsonism; (ii) evidence of relevant cerebrovascular disease on MRI scan; (iii) evidence of a relationship between the above two disorders [9]. Parkinsonism is characterized by slowness of initiation of voluntary movement with progressive reduction in speed and amplitude of repetitive actions in either upper limb or lower limb with at least one of the following symptoms: rest tremor; muscular rigidity [9]. Moreover, we defined PD as probable PD when having at least 3 of 4 core clinical symptoms (resting tremor, bradykinesia, rigidity, and asymmetric onset) [10].
All patients underwent a complete neurological examination. Neurological examinations were performed using the Unified Parkinson’s Disease Rating Scale motor score (UPDRS-ME) [11] and Hoehn and Yahr (H&Y) rating scale. Response to acute levodopa administration was evaluated in all patients, and these were classified as responsive if the motor improvement was equal or higher than 30%. Cognitive functions and performance were evaluated in all patients: (i) global cognitive status (Mini-Mental State Examination (MMSE) [12]; (ii) executive functions (Frontal Assessment Battery (FAB) [13], Modified Card Sorting Test (MCST) [14], Weigl’s Sorting Test (WEIGL) [15]); (iii) attention and working memory (Digit Span Backward and Forward) [16]; (iv) verbal short and long term memory, episodic memory (Rey Auditory Verbal Learning Test — Immediate Recall (RAVLT-IR) and Delayed Recall (RAVLT-DR) [17]); (v) visuo-spatial functions (Judgments of Line Orientation test form V (JLO-V) [18]); (vi) phonemic verbal fluency (Controlled Oral Word Association Test (COWAT) [19]); (vii) language comprehension (Token test (TOKEN) [20]); (viii) anxiety and depression (the Hamilton Anxiety Rating Scale (HAMA) [21] and the Beck Depression Inventory (BDI) [22]).
Controls were defined as no history of neurological or severe general medical diseases, no vascular lesions on MRI scan and a UPDRS-ME = 0. According to the Helsinki Declaration, all participants gave written informed consent to study participation. The Ethical Committee of the University “Magna Graecia” of Catanzaro approved the study.

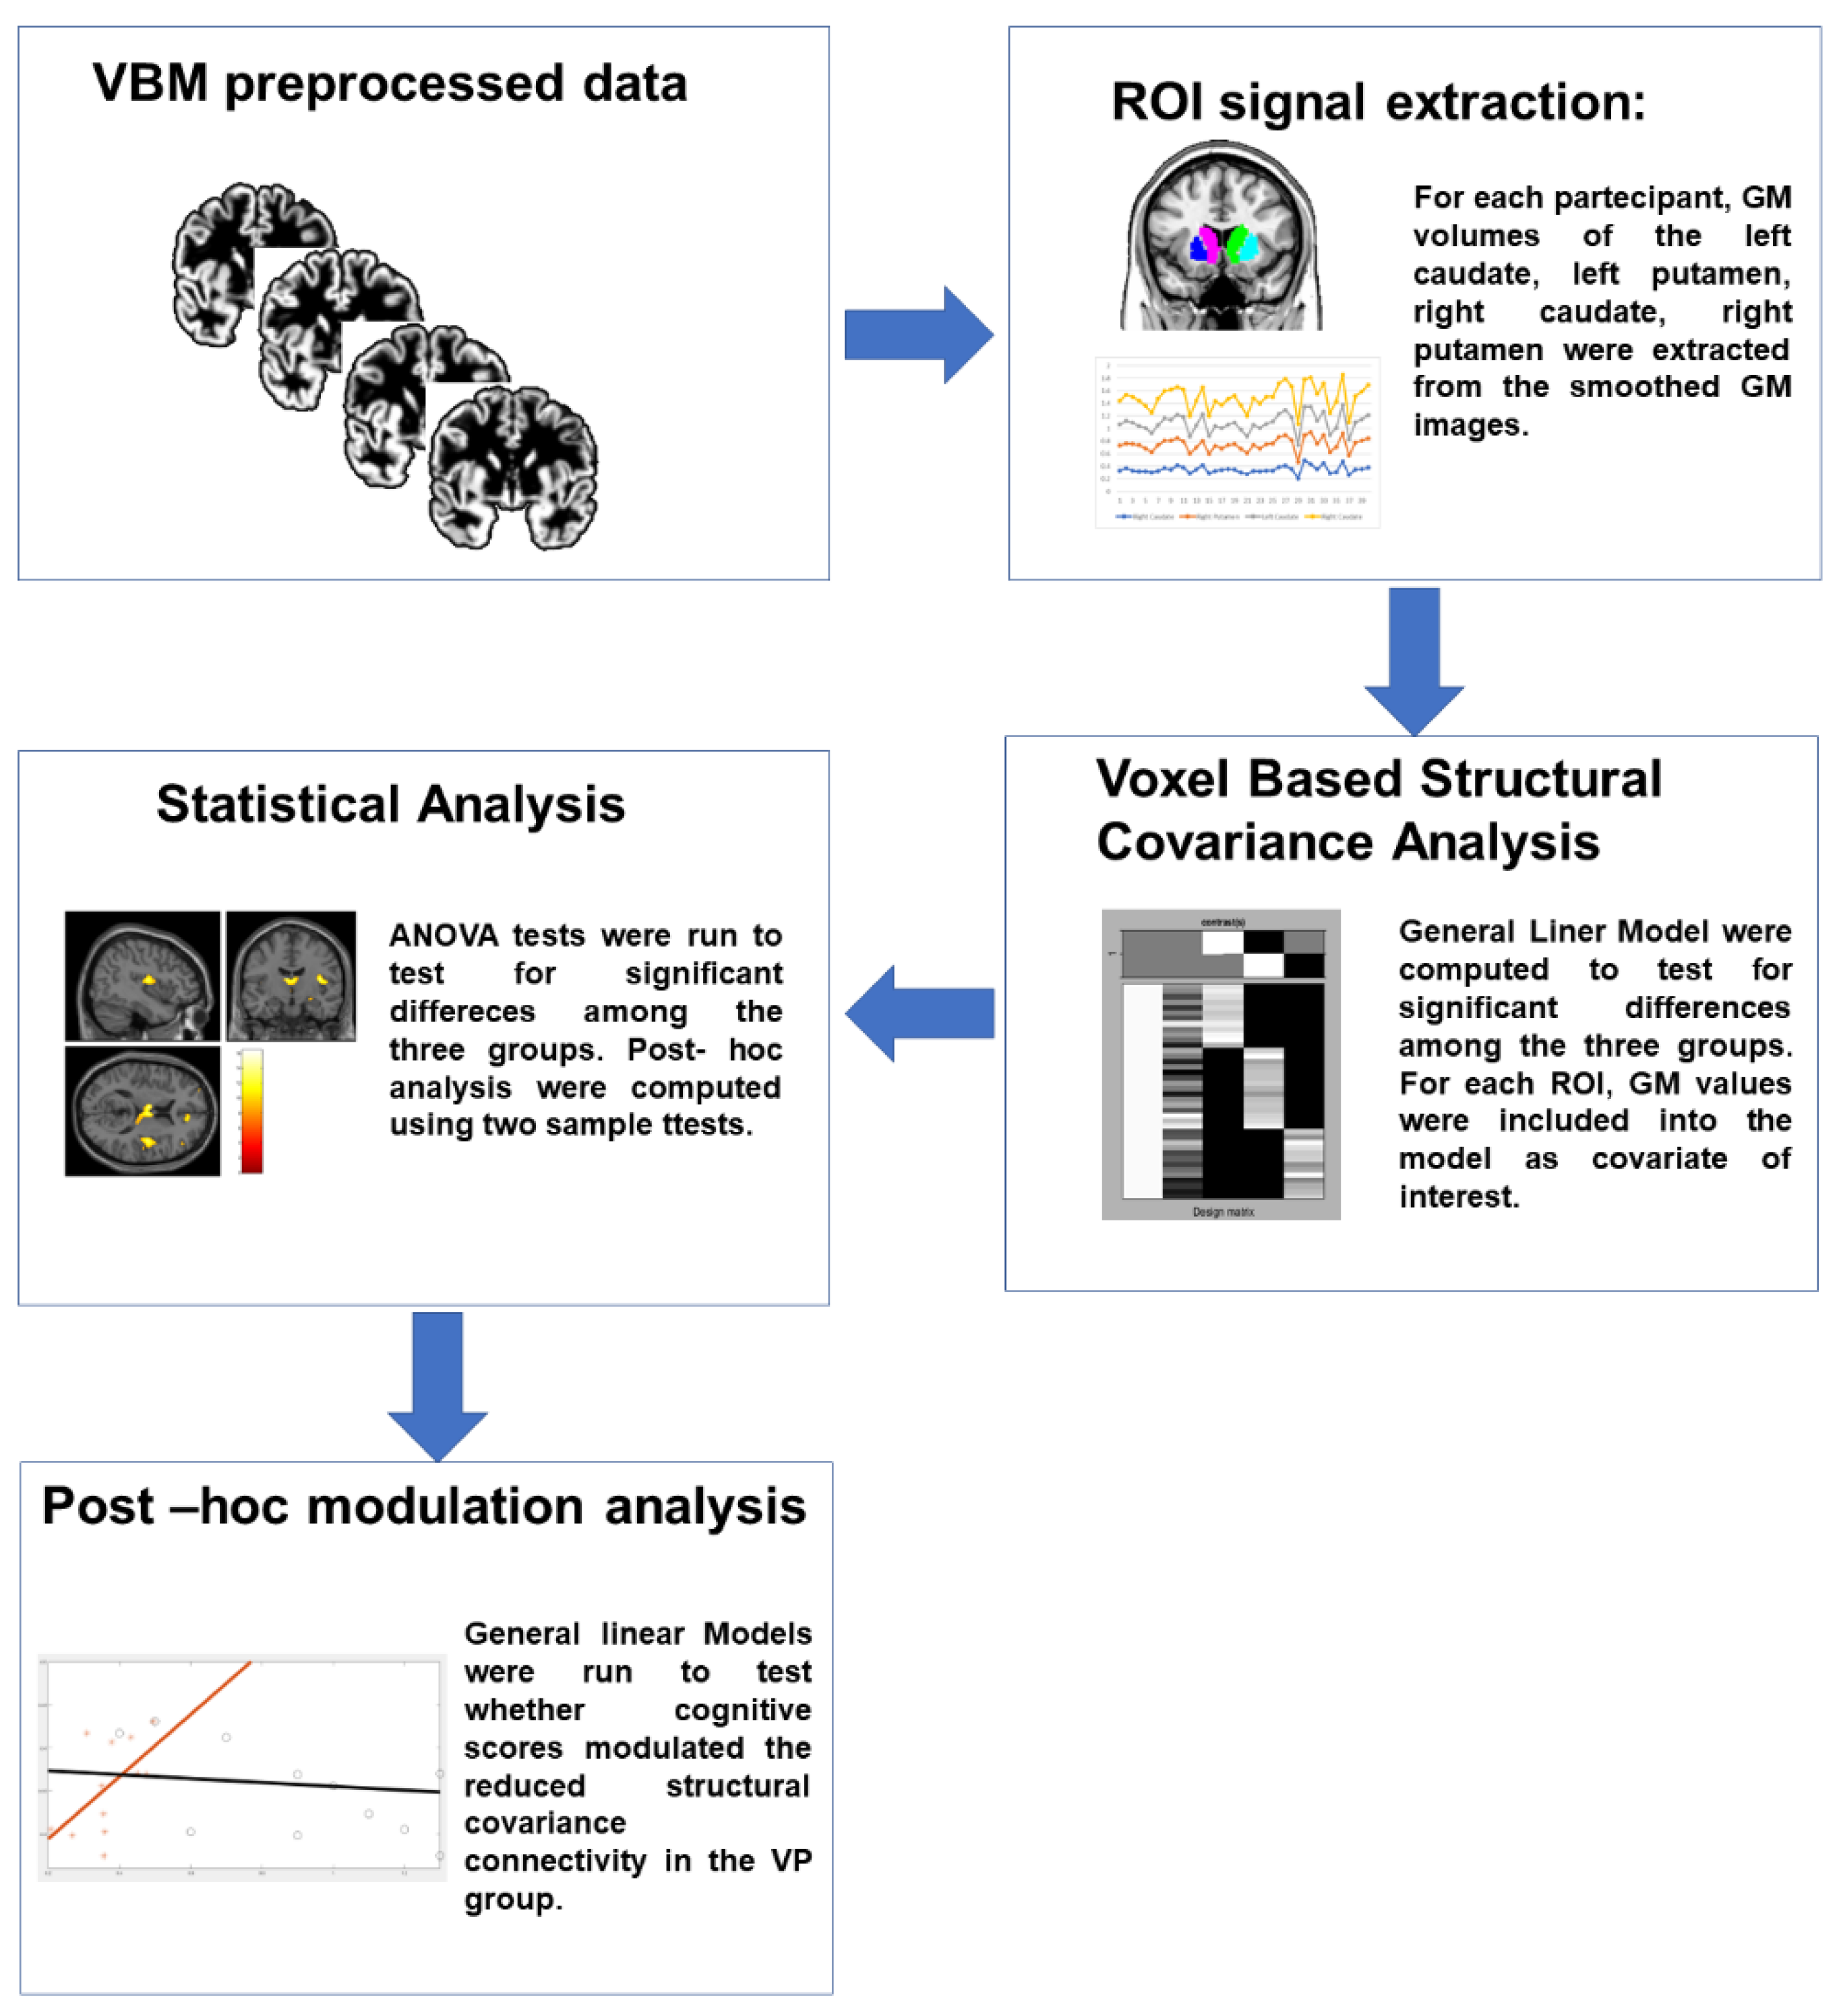
2.2. MRI Protocol, Data Processing and Analysis

Structural T1-weighted images were analyzed using the Computational Anatomy Toolbox (CAT12) [23] implemented in SPM12 (www.fil.ion.ucl.ac.uk, accessed on November 2021) in the MATLAB environment (www.mathworks.com, accessed on November 2021). The images acquired for each participant were normalized by employing an affine followed by non-linear registration and then corrected for bias field in homogeneities. Subsequently, images were segmented into GM, WM and CSF elements. The DARTEL algorithm (Diffeomorphic Anatomic Registration Through Exponentiated Lie algebra algorithm) was used to normalize the segmented scans into a standard Montreal Neurological Institute space. The modulation process was carried out, which corrects individual differences in the brain size, consisting of a non-linear deformation realized on the normalized segmented images. A smoothing process was applied to all segmented, modulated and normalized GM images using 8 mm full-width-half-maximum Gaussian smoothing.
The GM volume of each region of interest (ROI) was then calculated and extracted from the smoothed GM images using specific masks for the Left and Right Caudate and Left and Right Putamen extracted from the AAL template. Voxel-based multiple regression models were performed on the smoothed GM images to investigate the structural covariance between each seed region and the rest of brain voxels in each group. More specifically, four separate general linear models (GLMs) were computed by entering the extracted GM volumes from each ROI as a covariate of interest. Each statistical model was corrected for brain size using values of TIV. In all of these analyses, subject groups (HCs, PD and VP) were modelled separately. Statistical F-contrasts were set to identify, for each ROI, voxels that expressed differences in the structural associations among the three groups. Furthermore, specific T-contrasts were computed to run post hoc comparisons between each pair of groups (HC versus PD, HC versus VP, and PD versus VP). Resulting correlation maps were explored using two correction thresholds: first, a more stringent threshold of p ≤ 0.05, whole-brain family-wise error rate (FWE) correction; second, a cluster-level inference using a cluster forming threshold of p < 0.001 and cluster reported as significant at p < 0.05 using FWE correction in SPM.

2.3. Modulation Analysis of Structural Covariance

Modulation analysis of structural covariance connectivity was used to detect the influence of clinical variables onto the structural covariance connectivity [24,25,26]. In our case, to test whether the reduced structural covariance connectivity found in the VP group was explained by the lower scores in cognitive domains, a post hoc modulation analysis was run. This analysis was performed using the JASP software (https://jasp-stats.org/, accessed on November 2021) and was based on GLM using the formula as follows:
Y = β1X + β2ScoreOfCognitiveTest + β3X ∗ ScoreOfCognitiveTest.
Here, * indicates an interaction between terms, Y is the volume of target ROI, and X is the volume of seed ROI. The volume of the target ROI was the regional gray matter volume extracted from a 4 mm-radius sphere centered on the peak voxels of the significant clusters in the ANOVA comparisons. A significance of β3 less than 0.05 could represent the power of modulation effect of the scores in cognitive tests on the structural covariance connectivity between seed and target regions.
The workflow of the analysis process is reported in Figure 1.

2.4. DAT-SPECT Imaging

The acquisition technique of DAT-SPECT scintigraphy was described elsewhere previously by our group [27]. Images were evaluated by an investigator who was blind to the patient’s diagnosis. Briefly, for DAT-SPECT qualitative and semi-quantitative analyses were performed by selecting three consecutive slices with the highest striatal uptakes. ROI with fixed sizes were bilaterally drawn over the striatum (caudate nucleus and putamen) and the occipital cortex was used as a reference region. Qualitative analysis was performed by an experienced physician of nuclear medicine who was blind to the patients’ clinical data. The definition of “abnormal” was made on the basis of the visual inspection according to previously published studies: (a) asymmetrical uptake with reduced putamen activity in one hemisphere (abnormal type 1); (b) clear symmetrical reduction in putamen uptake in both hemispheres (abnormal type 2); (c) virtual absence of uptake in both putamen and caudate nuclei on each brain side (abnormal type 3).

2.5. Statistical Analysis

Fifteen patients with PD, 13 patients with vascular parkinsonism and 12 healthy controls were included in the analyses. Mean values and standard deviation of demographic and clinical variables were calculated. To test whether the sample was well matched, the following statistical tests were performed: (i) the ANOVA test was used to evaluate differences in gender distribution and age among the three groups; (ii) the two-sample t-test was used to evaluate differences in disease duration, UPDRS (total score), UPDRS-ME, MMSE and DAT scores between PD and VP; (iii) chi-square test was used to assess differences in levodopa response between PD an VP groups. The three groups were matched for gender distribution and age.

3. Results

Demographic and clinical characteristics of participants are summarized in Table 1. Patients groups were not statistically different regarding onset, disease duration, and disease severity (Table 1). All PD patients (1/15, 100%) and six VP patients (5/13, 46%) had a good response to levodopa administration (p < 0.04). VP patients had a clinical subtype more frequently characterized by a combination of clinical symptoms, such as lower body progressive parkinsonism, poor levodopa responsiveness, postural instability and gait difficulties, rigidity and cognitive impairment. Significant differences were found in neuropsychological variables. More details are reported in Table 1. Status cribrosus of basal ganglia was present in VP but not in PD and controls on conventional MRI (Figure 2). Although DAT-SPECT uptake was markedly reduced in PD patients as compared to those with VP, no significant statistical differences emerged between these two groups (Table 1).

3.1. Structural Covariance Analysis

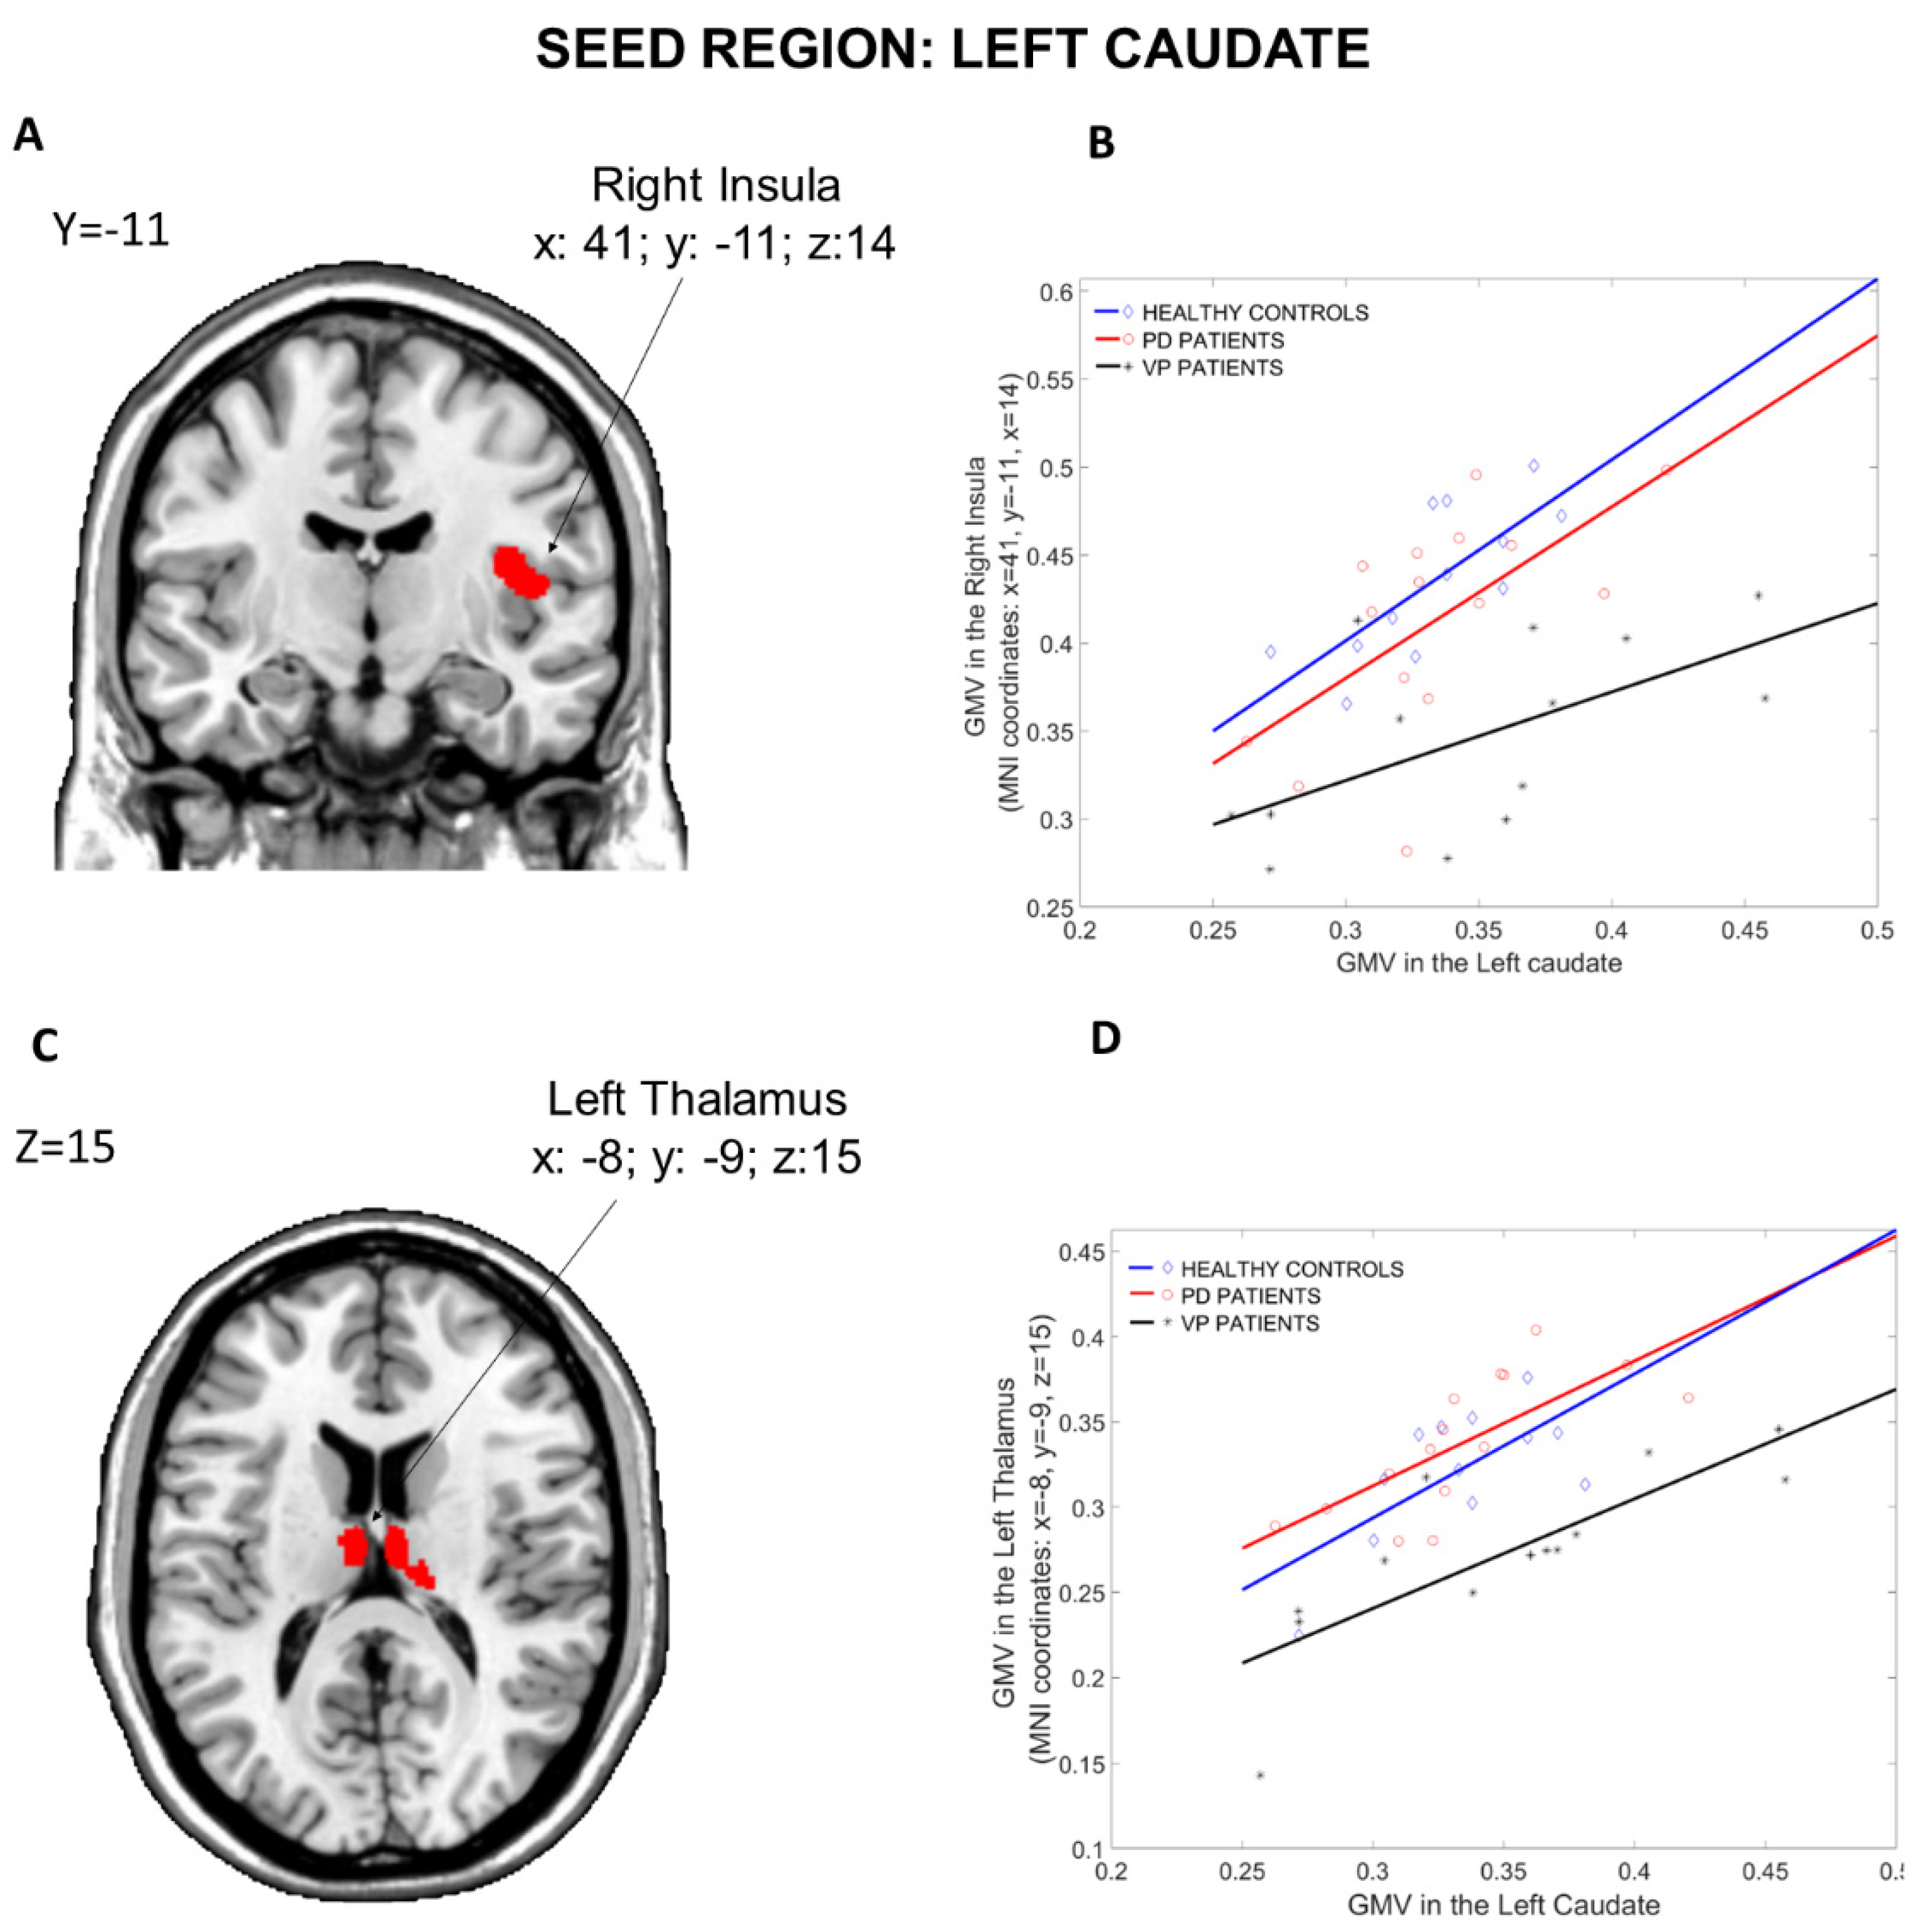
3.1.1. Seed Region: Left Caudate

The results of the structural covariance analysis from the Left Caudate (seed region) are reported in Table 2. Comparing the three groups (Figure 3), differences in structural associations between the Left Caudate and the rest of the brain were found in the Left Thalamus (x: −8, y = −9, z: 15, p = 0.001 fwe cluster-level corrected) and in the Right Insula (x: 41, y = −11, z: 14, p = 0.027 fwe cluster-level corrected). Post hoc comparisons revealed that the difference in the Left Thalamus was driven by reduced connectivity in the VP group compared to the PD group (x: −8, y = −9, z: 15, p = 0.034 fwe cluster-level corrected). Moreover, VP patients showed reduced connectivity between the Left Caudate and the Left Hippocampus (x: −15, y = −36, z: 3, p = 0.02 fwe cluster-level corrected) compared to PD patients. Furthermore, when compared to HCs, VP patients displayed a reduced structural association between the Left Caudate and the Right Insula (x: 41, y = −11, z: 14, p < 0.001 fwe cluster-level corrected), the Right Thalamus (x: 23, y = −30, z: −3, p = 0.026 fwe cluster-level corrected) and the right Anterior Cingulate Cortex (x: 9, y = 45, z: 8, p = 0.004 fwe cluster-level corrected). Nothing was found in the other post hoc comparisons (HCs more than PD, HCs less than PD, VP more than HCs, and VP more than PD).

3.1.2. Seed Region: Left Putamen

The results of the structural covariance analysis from the Left Putamen (seed region) are reported in Table 3. Comparing the three groups (Figure 4), differences in structural associations between the Left Putamen and the rest of the brain were found in the Right Hippocampus (x: 21, y = −26, z: −9, p = 0.001 fwe cluster-level corrected) and in the Left Hippocampus (x: −12, y = −36, z: 3, p = 0.049 fwe cluster-level corrected). Compared to PD patients, VP patients showed fewer structural associations between the Left Putamen and the Left and Right Hippocampus (x: −12, y = −36, z: 3, p = 0.028 fwe cluster-level corrected, and x: 21, y = −26, z: −9, p = 0.05 fwe whole-brain corrected, respectively). Furthermore, when compared to HCs, VP patients displayed a reduced structural association between the Left Putamen and the Right Hippocampus (x: 27, y = −11, z: −11, p = 0.02 fwe whole-brain corrected), the Right Insula (x: 41, y = −11, z: 14, p < 0.001 fwe cluster-level corrected), the Left Rectus (x: −9, y = 23, z: −14, p = 0.016 fwe cluster-level corrected) and the Right Cerebellum Crus 2 (x: 17, y = −78, z: −36, p = 0.019 fwe cluster-level corrected). Nothing was found in the other post hoc comparisons (HCs more than PD, HCs less than PD, VP more than HCs and VP more than PD).

3.1.3. Seed Region: Right Caudate

The results of the structural covariance analysis from the Right Caudate (seed region) are reported in Table 4. ANOVA contrast (Figure 5), including the three groups, revealed differences in structural associations between the Right Caudate and the Left Thalamus (x: −6, y = −11, z: 15, p = 0.004 fwe cluster-level corrected) and the Right Insula (x: 41, y = −12, z: 14, p = 0.032 fwe cluster-level corrected). Compared to PD patients, VP patients showed less structural associations between the Right Caudate and the Left Thalamus (x: −6, y = −11, z: 15, p = 0.038 fwe whole-brain corrected), the left Para Hippocampal region (x: −18, y = −33, z: −11, p = 0.032 fwe cluster-level corrected) and the Right Cerebellum Crus 2 (x: 14, y = −81, z: −36, p = 0.037 fwe cluster-level corrected). Moreover, relative to HCs, VP patients displayed a reduced structural association between the Right Caudate and the Right Insula (x: 41, y = −12, z: 14, p < 0.001 fwe cluster-level corrected), the Left Medial-orbital prefrontal cortex (x: −5, y = 47, z: −8, p = 0.004 fwe cluster-level corrected) and the Right Cerebellum Crus 2 (x: 12, y = −78, z: −36, p = 0.02 fwe cluster-level corrected). Nothing was found in the other post hoc comparisons (HCs more than PD, HCs less than PD, VP more than HCs and VP more than PD).

3.1.4. Seed Region: Right Putamen

The results of the structural covariance analysis from the Right Caudate (seed region) are reported in Table 5. ANOVA contrast (see Figure 6), including the three groups, revealed differences in structural associations between the Right Putamen and the Right and Left Thalamus (x: 23, y = −30, z: −3, p = 0.001 fwe cluster-level corrected and x: −14, y = −35, z: 5, p = 0.004 fwe cluster-level corrected, respectively). VP patients showed fewer structural associations than PD patients between the Right Putamen and a huge cluster including the Right Hippocampus (x: 23, y: −27, z: −9) and the Left Thalamus (x: −14, y: −35, z: 5). Moreover, compared to HCs, VP patients displayed a reduced structural association between the Right Putamen and the Right Hippocampus (x: 29, y: −12, z = −11 p = 0.04 fwe whole-brain corrected), the Right Para-Hippocampal Region (x: 23, y: −29, z: −17, p = 0.004 fwe cluster-level corrected), the Left Medial-orbital prefrontal cortex (x: −9, y = 35, z: −12, p = 0.009 fwe cluster-level corrected) and the Right Insula (x: 41, y = −11, z: 14, p = 0.001 fwe cluster-level corrected). Nothing was found in the other post hoc comparisons (HCs more than PD, HCs less than PD, VP more than HCs and VP more than PD).

3.2. Modulation Analysis of Structural Covariance

The results of the modulation analysis between the structural covariance connectivity and the scores of cognitive tests in the VP group are reported in Table 6. Modulation effects of COWAT, RAVLT-RD, MCST, BDI and HAMA scores were found in the structural connectivity between Right Caudate and Right Insula (Table 6A). A significant interaction between BDI scores and the Right Caudate–Left Thalamus connectivity as well as between MCST scores and Right Putamen–Left Thalamus connectivity was found (Table 6B,C). No other significant modulation effects were found (p > 0.06).

4. Discussion

To the best of our knowledge, this is the first study investigating structural covariance in VP patients compared to PD and controls. We found that VP patients had a significant reduction in structural connectivity between the corpus striatum (bilateral caudate and putamen nuclei) and a variety of brain regions, including cortical (insula, hippocampi, anterior cingulate cortex, gyrus rectus, fronto-orbital cortex) and subcortical (thalami) structures, compared to both PD patients and controls. Furthermore, the structural connectivity reduction between Right Caudate–Right Insula, Right Caudate—Left Thalamus and Right Putamen–Left Thalamus was significantly modulated by cognitive performances, in particular, executive functions, memory, anxiety and depression. Our findings demonstrate that altered connectivity in the basal ganglia circuits may contribute to the pathophysiology of cognitive impairment in VP.
The results of the present study add significant insight to supporting the hypothesis that the structural vulnerability of basal ganglia is reflected in the breakdown of the structural association with large-scale circuits. Indeed, in our study cohort, VP patients showed a decrease in structural association between the bilateral striatum and several regions, including the thalamus, insula, parahippocampus, hippocampus, orbitofrontal and anterior cingulate cortices. The reduction in structural covariance was a finding consistently repeated among all the different seeds we explored, independently of the region (caudate and putamen) and the hemisphere (right and left). Furthermore, in all comparisons, the reduced covariance in the VP group has clearly emerged in comparison with both PD and control subjects. More in detail, it is interesting to note that VP patients showed a decreased structural covariance between the caudate and the thalamus, insula, orbitofrontal and anterior cingulate cortices. A similar situation was also evident when we evaluated the Right Putamen as a seed. VP showed reduced structural covariance with almost the same regions (thalamus, insula, and orbitofrontal cortex).
Interestingly, considered as a whole, many of the structures involved in our results are fundamental nodes that are part of the salience network.
The salience network is a key pathway in the human brain [28,29] and is considered the core brain system involved in identifying biologically and cognitively relevant events to guide flexible behavior and emotional information processing. Moreover, it acts as an internal switch supporting the brain to decrease default mode network activity (associated with heed to internal stimuli) and increase central executive network activity (associated with external processing stimuli) [30].
In addition, our VP patients displayed reduced structural covariance between striatum, mainly the Left Putamen and hippocampus. In the mesolimbic pathway, neurons in the ventral striatum obtain converging excitatory afferents from the hippocampus and thalamus. The combined elaboration of these afferent signals is crucial for the correct configuration of goal-directed behaviors. Recent data reveal that the ventral striatum modulates the hippocampal activity, and this interaction may enable the prefrontal cortex to influence basal ganglia loops during decision-making instances [31].
Interestingly, recent evidence highlighted a strong relationship between limbic dopamine function and salience network functional connectivity in humans. Anatomical and functional overlap between these systems exist and dysfunctions in any one of the network nodes likely produce impairment across both systems [32]. Both the salience and the mesolimbic systems are involved in neurodegenerative and psychiatric disorders [33,34,35,36,37].
Even though structural covariance results are not a direct measure of connectivity, a correspondence between connectivity and structural covariance has been described [38]. Therefore, we can reasonably interpret our result as the evidence of structural connectivity disruption in VP within the salience and mesolimbic networks, both playing a crucial role in the cognitive frontal and executive control and emotional processing. However, why structural disconnections occur in the brain of our VP patients remains unknown. One possibility is that vascular lesions in the VP brain may produce critical changes within the cortico–striato–pallidal, thalamo–frontal and other loops [39], thus resulting in a progressive disconnection syndrome.
The abnormalities within these networks raise some critical questions.
First, VP and cognitive impairment. This is an interesting point since unlike PD, cognitive decline in VP patients often occurs early at the presentation of the disease [40]. Thus, in our study, we questioned whether VP patients might have neurocognitive dysfunctions in the core clinical picture. Interestingly, we found that VP patients had worse cognitive abilities than PD and controls. In particular, although these patients had equal/slightly lower MMSE scores, they reported significant impairment in overall neurocognitive performance than those with PD and controls.
Of note, compared to PD and controls, significantly lower performances have been observed on FAB, COWAT and MCST tests. In detail, FAB is a neuropsychological battery consisting of six tasks to investigate the frontal lobe functions (abstract reasoning, mental flexibility, motor programming, inhibitory control, sensitivity to interference and environmental autonomy). It is a useful tool widely used in clinical practice for detecting executive dysfunctions with high sensitivity in patients with PD and parkinsonism [41,42]. COWAT test assesses phonemic verbal fluency, thus evaluating language and executive function domains [43]. Decreased COWAT values are considered a predictor of phenoconversion from normal cognition to preclinical AD [44,45]. Finally, MCST can assess “set-shifting” ability and detect the early change in cognitive function in patients with movement disorders [46]. Thus, the convergently decreased scores on FAB, COWAT and MCST found in our VP patients could be suggestive of cognitive impairment manifesting as frontal lobe syndrome. However, frontal lobe syndrome is not an expected result in VP since the dementia picture in these patients is characterized by dysexecutive syndrome with impairment of attention, planning, abstract thinking, and verbal fluency, in association with late-onset behavioral disorders [47,48,49].
In addition to frontal lobe syndrome, we also found reduced scores on RAVLT R-IR (Immediate Recall) and RAVLT-DR (Delayed Recall) in our VP patients as compared to the controls. This is not surprising since these patients showed a reduced structural covariance alteration between the striatum and hippocampus. RAVLT is a neuropsychological tool widely used for neurocognitive assessment in patients with dementia [43]. It is sensitive to assessing verbal memory deficits [50,51] and is considered an effective marker for discriminating normal aging subjects from patients with dementia [52]. Moreover, RAVLT Immediate and Delayed are frequently used in the clinical setting, highlighting different aspects of episodic memory (learning and delayed memory, respectively) [43]. On this basis, we can speculate that reduced RAVLT performances observed in our VP patients could reflect verbal episodic memory deficit. We align with previous evidence demonstrating that isolated short-term memory impairment may occur in this vascular disease, especially in the early stages [9]. Moreover, in the an Italian cross-sectional longitudinal observational PRIAMO study [48], attention and memory impairment were found in about 70% of VP with short disease duration. Finally, the disconnection between the striatum and mesolimbic system may be the structural substrate of reduced BDI scores reported in our VP patients.
Taken together, our evidence, although preliminary, suggests that our VP patients with reduced structural connectivity between the striatum and several brain regions/structures may have an initial cognitive impairment.
Second, imaging and clinical correlations in VP patients are important to mention. Indeed, another important question in this study was to test whether the disruption of structural covariance connectivity in the VP group was in relation to the lower scores in cognitive performances we found in this group. Interestingly, the connectivity between the Right Caudate and Right Insula was modulated by the scores of COWAT, RAVLT-RD, MCST, BDI and HAMA tests. While novel in this particular scenario, our results agree with the vision of the insula as a key player in several cognitive and emotional processes. Indeed, the insula manages the inter-relationship between the salience of the selective attention focused on reaching a task (dorsal attention system) and the salience of arousal established to maintain direction on the significant environmental elements (ventral attention system) [53]. This modulation of the salience might be particularly relevant during tasks requiring attention to identify an effective strategy, such as MCST and COWAT tests, or require the ability to focus on the information recall, such as RAVLT-RD [54].
With regard to laterality, the Right Insula, together with other areas of the region of the right ventrolateral prefrontal cortex and right striatum, has been associated with the self-awareness of memory and other high order cognitive performances, as well as with conscious detection of errors [55]. This pivotal role of monitoring feedback on task execution and self-evaluative processes appears to rely preferentially on the right hemisphere regions [56]. Moreover, regarding the correlation between Right Caudate–Right Insula covariance and BDI and HAMA scores, the central role that the insula plays in the control of emotivity and in the pathophysiology of anxious-depressive disorders is well known [57]. BDI scores also significantly modulated the poor connectivity between the Right Caudate and Left Thalamus, thus confirming the key role of limbic–striatal–thalamic connections in mood disorders [58]. Finally, MCST scores had a significant interaction with Right Putamen–Left Thalamus connectivity, which can be explained by considering the importance that the basal ganglia circuits have in executive functions [59].
Taken together, these findings further strengthened the results of this study, demonstrating that the structural covariance alterations we found in the VP patients are effectively related to their cognitive performances.
There were some limitations to the study. Firstly, the sample size of our cohort is small. Thus, the results from the correlation analysis could have only a descriptive nature. However, VP remains a rare and heterogeneous entity that is difficult to diagnose clinically. A large cohort of VP patients is needed to confirm our results. Secondly, in the absence of histopathological data, it is not possible to determine whether there was a vascular or degenerative origin of their parkinsonism in VP patients. This could be crucial to distinguish whether brain vascular lesions may cause brain connectivity changes. Thirdly, the lack of a group of subjects with similar vascular conditions but without parkinsonism prevents us from exploring the pure effect that the lesions themselves have on structural covariance.

5. Conclusions

In conclusion, our study demonstrates for the first time that structural covariance between the striatum and several regions in the brain may be altered in VP patients, whereas it seemed to be preserved in those with PD and controls. Moreover, structural connectivity alterations correlated with deficits in several neuropsychological tests. This intriguing imaging–clinical association suggests that progressive structural disconnection may be involved in the development of vascular cognitive impairment. Longitudinal studies investigating whether and how the brain vascular lesions may concur to this structural disconnection are needed to monitor the disease progression in VP.

Author Contributions

Conceptualization, F.N. and M.S.; methodology, F.N., M.S. and R.R.; formal analysis, R.R.; investigation, F.N., M.S., A.Q. (Andrea Quattrone), C.C. and G.A., methodology, F.N. and M.S.; writing—original draft preparation, F.N. and M.S.; writing—review and editing, J.L.M.M., L.F.S. and A.Q. (Aldo Quattrone); supervision, A.Q. (Aldo Quattrone); project administration, A.Q. (Aldo Quattrone). All authors have read and agreed to the published version of the manuscript.

Funding

This research received no external funding.

Institutional Review Board Statement

The study was conducted in accordance with the Declaration of Helsinki and approved by the Institutional Review Board of Magna Graecia University of Catanzaro, Italy.

Informed Consent Statement

Informed consent was obtained from all subjects involved in the study.

Data Availability Statement

The data generated and/or analyzed during the current study are not publicly available for legal/ethical reasons but are available from the corresponding author on reasonable request.

Conflicts of Interest

The authors declare no conflict of interest.

References

  1. Wang, H.C.; Hsu, J.L.; Leemans, A. Diffusion tensor imaging of vascular parkinsonism: Structural changes in cerebral white matter and the association with clinical severity. Arch. Neurol. 2012, 69, 1340–1348. [Google Scholar] [CrossRef] [PubMed] [Green Version]
  2. Winikates, J.; Jankovic, J. Clinical correlates of vascular parkinsonism. Arch. Neurol. 1999, 56, 98–102. [Google Scholar] [CrossRef] [PubMed]
  3. Salsone, M.; Caligiuri, M.E.; Vescio, V.; Arabia, G.; Cherubini, A.; Nicoletti, G.; Morelli, M.; Quattrone, A.; Vescio, B.; Nisticò, R.; et al. Microstructural changes of normal-appearing white matter in Vascular Parkinsonism. Parkinsonism Relat. Disord. 2019, 63, 60–65. [Google Scholar] [CrossRef]
  4. Antonini, A.; Vitale, C.; Barone, P.; Cilia, R.; Righini, A.; Bonuccelli, U.; Abbruzzese, G.; Ramat, S.; Petrone, A.; Quatrale, R.; et al. The relationship between cerebral vascular disease and parkinsonism: The VADO study. Parkinsonism Relat. Disord. 2012, 18, 775–780. [Google Scholar] [CrossRef]
  5. Alexander-Bloch, A.; Giedd, J.N.; Bullmore, E. Imaging structural covariance between human brain regions. Nat. Rev. Neurosci. 2013, 14, 322–336. [Google Scholar] [CrossRef] [PubMed] [Green Version]
  6. Deng, X.; Liu, Z.; Kang, Q.; Lu, L.; Zhu, Y.; Xu, R. Cortical Structural Connectivity Alterations and Potential Pathogenesis in Mid-Stage Sporadic Parkinson’s Disease. Front. Aging Neurosci. 2021, 13, 650371. [Google Scholar] [CrossRef]
  7. Chen, Y.S.; Chen, H.L.; Lu, C.H.; Lee, C.Y.; Chou, K.H.; Chen, M.H.; Yu, C.C.; Lai, Y.R.; Chiang, P.L.; Lin, W.C. The corticolimbic structural covariance network as an early predictive biosignature for cognitive impairment in Parkinson’s disease. Sci. Rep. 2021, 11, 862. [Google Scholar] [CrossRef]
  8. Li, R.; Zou, T.; Wang, X.; Wang, H.; Hu, X.; Xie, F.; Meng, L.; Chen, H. Basal ganglia atrophy-associated causal structural network degeneration in Parkinson’s disease. Hum. Brain Mapp. 2022, 43, 1145–1156. [Google Scholar] [CrossRef]
  9. Zijlmans, J.C.; Daniel, S.E.; Hughes, A.J.; Révész, T.; Lees, A.J. Clinicopathological investigation of vascular parkinsonism, including clinical criteria for diagnosis. Mov. Disord. 2004, 19, 630–640. [Google Scholar] [CrossRef]
  10. Gelb, D.J.; Oliver, E.; Gilman, S. Diagnostic criteria for Parkinson Disease. Arch. Neurol. 1999, 56, 33–39. [Google Scholar] [CrossRef]
  11. Fahn, S.; Elton, R.L. Unified Parkinson’s disease rating scale. In Recent Developments in Parkinson’s Disease II; MacMillan: New York, NY, USA, 1987; pp. 153–163. [Google Scholar]
  12. Folstein, M.F.; Folstein, S.E.; McHugh, P.R. Mini Mental State. A practical method for grading the cognitive state of patients for the clinician. J. Psychiatr. Res. 1975, 12, 189–198. [Google Scholar] [CrossRef]
  13. Appollonio, I.; Leone, M.; Isella, V.; Piamarta, F.; Consoli, T.; Villa, M.L.; Forapani, E.; Russo, A.; Nichelli, P. The Frontal Assessment Battery (FAB): Normative values in an Italian population sample. Neurol. Sci. 2005, 26, 108–116. [Google Scholar] [CrossRef]
  14. Caffarra, P.; Vezzadini, G.; Dieci, F.; Zonato, F. Modified Card Sorting Test: Normative data. J. Clin. Exp. Neuropsychol. 2004, 26, 246–250. [Google Scholar] [CrossRef] [PubMed]
  15. Laiacona, M.; lnzaghi, M.G.; De Tanti, A.; Capitani, E. Wisconsin card sorting test: A new global score, with ltalian norms, and its relationoship with the Weigl sorting test. Neurol. Sci. 2000, 21, 279–291. [Google Scholar] [CrossRef] [PubMed]
  16. Wechsler, D. Manual for the Wechsler Adult Intelligence Scale Revised; Psychological Corporation: New York, NY, USA, 1981. [Google Scholar]
  17. Carlesimo, G.A.; Caltagirone, C.; Gainotti, G.; Fadda, L.; Gallassi, R.; Lorusso, S.; Marfia, G.; Marra, C.; Nocentini, U.; Parnetti, L. The mental deterioration battery: Normative data, diagnostic reliability and qualitative analyses of cognitive impairment. Eur. Neurol. 1996, 36, 378–384. [Google Scholar] [CrossRef] [PubMed]
  18. Benton, A.L.; Varney, N.R.; Hamsher, K.D. Visuospatial judgment. A clinical test. Arch. Neurol. 1978, 35, 364–367. [Google Scholar] [CrossRef]
  19. Benton, A.L.; Hamsher, K.D.; Rey, G.J. Multilingual Aphasia Examination; AJA Associates: Iowa City, IA, USA, 1994. [Google Scholar]
  20. The Italian Group on the Neuropsychological Study of Aging. Token test in Italian standardization and classification of Neuropsychological tests. Ital. J. Neurol. Sci. 1987, 8, 120–123. [Google Scholar]
  21. Hamilton, M. Hamilton anxiety rating scale (HAM-A). J. Med. (Cincinnati) 1959, 61, 81–82. [Google Scholar]
  22. Beck, A.T.; Ward, C.; Mendelson, M. Beck Depression Inventory (BDI). Arch. Gen. Psychiatry 1961, 4, 561–571. [Google Scholar] [CrossRef] [Green Version]
  23. Gaser, C.; Dahnke, R.; Kurth, F.; Luders, E. CAT—A Computational Anatomy Toolbox for the Analysis of Structural MRI Data. bioRxiv, 2022; preprint. [Google Scholar]
  24. Xu, Q.; Zhang, Q.; Liu, G.; Dai, X.; Xie, X.; Hao, J.; Yu, Q.; Liu, R.; Zhang, Z.; Ye, Y.; et al. BCCT: A GUI toolkit for brain structural covariance connectivity analysis on MATLAB. Front. Hum. Neurosci. 2021, 15, 641961. [Google Scholar] [CrossRef]
  25. Bernhardt, B.C.; Rozen, D.A.; Worsley, K.J.; Evans, A.C.; Bernasconi, N.; Bernasconi, A. Thalamo-cortical network pathology in idiopathic generalized epilepsy: Insights from MRI-based morphometric correlation analysis. Neuroimage 2009, 46, 373–381. [Google Scholar] [CrossRef] [PubMed]
  26. Sharda, M.; Khundrakpam, B.S.; Evans, A.C.; Singh, N.C. Disruption of structural covariance networks for language in autism is modulated by verbal ability. Brain Struct. Funct. 2016, 221, 1017–1032. [Google Scholar] [CrossRef] [PubMed]
  27. Salsone, M.; Bagnato, A.; Novellino, F.; Cascini, G.L.; Paglionico, S.; Cipullo, S.; Morelli, M.; Pugliese, P.; Nicoletti, G.; Messina, D.; et al. Cardiac MIBG scintigraphy in Primary Progressive Freezing Gait. Parkinsonism Relat. Disord. 2009, 15, 365–369. [Google Scholar] [CrossRef] [PubMed]
  28. Uddin, L.Q.; Yeo, B.T.T.; Spreng, R.N. Towards a Universal Taxonomy of Macro-Scale Functional Human Brain Networks. Brain Topogr. 2019, 32, 926–942. [Google Scholar] [CrossRef] [PubMed]
  29. Peters, S.K.; Dunlop, K.; Downar, J. Cortico-Striatal-Thalamic Loop Circuits of the Salience Network: A Central Pathway in Psychiatric Disease and Treatment. Front. Syst. Neurosci. 2016, 10, 104. [Google Scholar] [CrossRef] [PubMed] [Green Version]
  30. Downar, J.; Crawley, A.P.; Mikulis, D.J.; Davis, K.D. A multimodal cortical network for the detection of changes in the sensory environment. Nat. Neurosci. 2000, 3, 277–283. [Google Scholar] [CrossRef]
  31. Calhoon, G.G.; O’Donnell, P. Closing the gate in the limbic striatum: Prefrontal suppression of hippocampal and thalamic inputs. Neuron 2013, 78, 181–190. [Google Scholar] [CrossRef] [Green Version]
  32. McCutcheon, R.A.; Nour, M.M.; Dahoun, T.; Jauhar, S.; Pepper, F.; Expert, P.; Veronese, M.; Adams, R.A.; Turkheimer, F.; Mehta, M.A.; et al. Mesolimbic Dopamine Function Is Related to Salience Network Connectivity: An Integrative Positron Emission Tomography and Magnetic Resonance Study. Biol. Psychiatry 2019, 85, 368–378. [Google Scholar] [CrossRef] [Green Version]
  33. Uddin, L.Q. Salience processing and insular cortical function and dysfunction. Nat. Rev. Neurosci. 2015, 16, 55–61. [Google Scholar] [CrossRef]
  34. Volkow, N.D.; Wise, R.A.; Baler, R. The dopamine motive system: Implications for drug and food addiction. Nat. Rev. Neurosci. 2017, 18, 741–752. [Google Scholar] [CrossRef]
  35. Salamone, J.D.; Correa, M. The mysterious motivational functions of mesolimbic dopamine. Neuron 2012, 76, 470–485. [Google Scholar] [CrossRef] [PubMed] [Green Version]
  36. Nestler, E.J.; Carlezon, W.A., Jr. The mesolimbic dopamine reward circuit in depression. Biol. Psychiatry 2006, 59, 1151–1159. [Google Scholar] [CrossRef] [PubMed]
  37. Jauhar, S.; Nour, M.M.; Veronese, M.; Rogdaki, M.; Bonoldi, I.; Azis, M.; Turkheimer, F.; McGuire, P.; Young, A.H.; Howes, O.D. A Test of the Transdiagnostic Dopamine Hypothesis of Psychosis Using Positron Emission Tomographic Imaging in Bipolar Affective Disorder and Schizophrenia. JAMA Psychiatry 2017, 74, 1206–1213. [Google Scholar] [CrossRef] [PubMed] [Green Version]
  38. Seeley, W.W.; Crawford, R.K.; Zhou, J.; Miller, B.L.; Greicius, M.D. Neurodegenerative diseases target large-scale human brain networks. Neuron 2009, 62, 42–52. [Google Scholar] [CrossRef] [Green Version]
  39. Jellinger, K.A.   Vascular Parkinsonism. Therapy 2008, 5, 237–255. [Google Scholar] [CrossRef]
  40. Vale, T.C.; Barbosa, M.T.; Caramelli, P.; Cardoso, F. Vascular Parkinsonism and cognitive impairment: Literature review, Brazilian studies and case vignettes. Dement. Neuropsychol. 2012, 6, 137–144. [Google Scholar] [CrossRef] [Green Version]
  41. Alster, P.; Migda, B.; Madetko, N.; Duszyńska-Wąs, K.; Drzewińska, A.; Charzyńska, I.; Starczyński, M.; Szepelska, A.; Królicki, L.; Friedman, A. The Role of Frontal Assessment Battery and Frontal Lobe Single-Photon Emission Computed Tomography in the Differential Diagnosis of Progressive Supranuclear Palsy Variants and Corticobasal Syndrome—A Pilot Study. Front. Neurol. 2021, 12, 630153. [Google Scholar] [CrossRef]
  42. Lima, C.F.; Meireles, L.P.; Fonseca, R.; Castro, S.L.; Garrett, C. The Frontal Assessment Battery (FAB) in Parkinson’s disease and correlations with formal measures of executive functioning. J. Neurol. 2008, 255, 1756–1761. [Google Scholar] [CrossRef]
  43. Salsone, M.; Arabia, G.; Manfredini, L.; Quattrone, A.; Chiriaco, C.; Vescio, B.; Sturniolo, M.; Morelli, M.; Nistico, R.; Novellino, F.; et al. REM-Sleep Behavior Disorder in Patients with Essential Tremor: What Is Its Clinical Significance? Front. Neurol. 2019, 10, 315. [Google Scholar] [CrossRef] [Green Version]
  44. Blacker, D.; Lee, H.; Muzikansky, A.; Martin, E.C.; Tanzi, R.; McArdle, J.J.; Moss, M.; Albert, M. Neuropsychological measures in normal individuals that predict subsequent cognitive decline. Arch. Neurol. 2007, 64, 862–871. [Google Scholar] [CrossRef] [Green Version]
  45. Zhang, J.R.; Chen, J.; Yang, Z.J.; Zhang, H.; Fu, Y.; Shen, Y.; He, P.; Mao, C.; Liu, C. Rapid Eye Movement Sleep Behavior Disorder Symptoms Correlate with Domains of Cognitive Impairment in Parkinson’s Disease. Chin. Med. J. (Engl.) 2016, 129, 379–385. [Google Scholar] [CrossRef] [PubMed]
  46. Yoshii, F.; Onaka, H.; Kohara, S.; Ryo, M.; Takahashi, W.; Nogawa, S. Early detection of cognitive impairment in Parkinson’s disease with the use of the Wisconsin Card Sorting Test: Correlations with Montreal Cognitive Assessment and smell identification test. J. Neural Transm. 2019, 126, 1447–1454. [Google Scholar] [CrossRef] [PubMed]
  47. Gupta, D.; Kuruvilla, A. Vascular parkinsonism: What makes it different? Postgrad. Med. J. 2011, 87, 829–836. [Google Scholar] [CrossRef] [PubMed]
  48. Colosimo, C.; Morgante, L.; Antonini, A.; Barone, P.; Avarello, T.P.; Bottacchi, E.; Cannas, A.; Ceravolo, M.G.; Ceravolo, R.; Priamo Study Group; et al. Non-motor symptoms in atypical and secondary parkinsonism: The PRIAMO study. J. Neurol. 2010, 257, 5–14. [Google Scholar] [CrossRef] [PubMed]
  49. Stenc Bradvica, I.; Janculjak, D.; Butkovic-Soldo, S.; Vladetic, M. Cognitive dysfunction in idiopathic and vascular parkinsonism. Med. Glas. 2011, 8, 209–215. [Google Scholar]
  50. Schoenberg, M.R.; Dawson, K.A.; Duff, K.; Patton, D.; Scott, J.G.; Adams, R.L. Test performance and classification statistics for the Rey auditory verbal learning test in selected clinical samples. Arch. Clin. Neuropsychol. 2006, 21, 693–703. [Google Scholar] [CrossRef] [PubMed] [Green Version]
  51. Estévez-González, A.; Kulisevsky, J.; Boltes, A.; Otermín, P.; García-Sánchez, C. Rey verbal learning test is a useful tool for differential diagnosis in the preclinical phase of Alzheimer’s disease: Comparison with mild cognitive impairment and normal aging. Int. J. Geriatr. Psychiatry 2003, 18, 1021–1028. [Google Scholar] [CrossRef]
  52. Balthazar, M.L.; Yasuda, C.L.; Cendes, F.; Damasceno, B.P. Learning, retrieval, and recognition are compromised in aMCI and mild AD: Are distinct episodic memory processes mediated by the same anatomical structures? J. Int. Neuropsychol. Soc. 2010, 16, 205–209. [Google Scholar] [CrossRef]
  53. Eckert, M.A.; Menon, V.; Walczak, A.; Ahlstrom, J.; Denslow, S.; Horwitz, A.; Dubno, J.R. At the heart of the ventral attention system: The right anterior insula. Hum. Brain Mapp. 2009, 30, 2530–2541. [Google Scholar] [CrossRef] [Green Version]
  54. Dobbins, I.G.; Simons, J.S.; Schacter, D.L. fMRI evidence for separable and lateralized prefrontal memory monitoring processes. J. Cogn. Neurosci. 2004, 16, 908–920. [Google Scholar] [CrossRef]
  55. Cosentino, S.; Brickman, A.M.; Griffith, E.; Habeck, C.; Cines, S.; Farrell, M.; Shaked, D.; Huey, E.D.; Briner, T.; Stern, Y. The right insula contributes to memory awareness in cognitively diverse older adults. Neuropsychologia 2015, 75, 163–169. [Google Scholar] [CrossRef] [PubMed] [Green Version]
  56. Shany-Ur, T.; Lin, N.; Rosen, H.J.; Sollberger, M.; Miller, B.L.; Rankin, K.P. Self-awareness in neurodegenerative disease relies on neural structures mediating reward-driven attention. Brain 2014, 137, 2368–2381. [Google Scholar] [CrossRef] [PubMed] [Green Version]
  57. Trombello, J.M.; Cooper, C.M.; Fatt, C.C.; Grannemann, B.D.; Carmody, T.J.; Jha, M.K.; Mayes, T.L.; Greer, T.L.; Yezhuvath, U.; Aslan, S.; et al. Neural substrates of emotional conflict with anxiety in major depressive disorder: Findings from the Establishing Moderators and biosignatures of Antidepressant Response in Clinical Care (EMBARC) randomized controlled trial. J. Psychiatr. Res. 2022, 149, 243–251. [Google Scholar] [CrossRef] [PubMed]
  58. Nugent, A.C.; Davis, R.M.; Zarate, C.A., Jr.; Drevets, W.C. Reduced thalamic volumes in major depressive disorder. Psychiatry Res. 2013, 213, 179–185. [Google Scholar] [CrossRef] [PubMed] [Green Version]
  59. Leh, S.E.; Petrides, M.; Strafella, A.P. The neural circuitry of executive functions in healthy subjects and Parkinson’s disease. Neuropsychopharmacology 2010, 35, 70–85. [Google Scholar] [CrossRef]
Figure 1. Workflow of the analyses. Subject-specific T1-weighted images were preprocessed using CAT12 toolbox and gray matter (GM) maps were generated. GM values of specific ROIs were extracted and entered as covariate of interest in separate GLMs to test for differences in the structural covariance connectivity among the three groups. T-contrasts were then used to compare each couple of groups. Finally, to test whether the reduced structural covariance connectivity in the VP group was explained by the lower scores in cognitive domains, a post hoc modulation analysis was run. GM: gray matter; VP: vascular parkinsonism; GLM: general linear model.
Applsci 12 07240 g001
Figure 2. Findings on conventional structural MRI in a patient with VP (A,A1), with PD (B,B1) and in a control subject (C,C1); (AC) panels: T2-weighted image; (A1C1) panels: Fluid attenuated inversion recovery (FLAIR) image.
Applsci 12 07240 g002
Figure 3. Group differences in the structural covariance of the Left Caudate. Brain maps are displayed using the neurological view. Panel (A): Voxels of the Right Insula that expressed differences in the structural association across the three groups. Panel (B): Correlations between the mean gray matter volume of the Left Caudate and the regional gray matter volume extracted from a 4 mm-radius sphere centered on the peak voxels of the significant cluster (x: 41, y = −11, z: 14). Panel (C): Voxels of the Left Thalamus that expressed differences in the structural association across the three groups. Panel (D): Correlations between the mean gray matter volume of the Left Caudate and the regional gray matter volume extracted from a 4 mm-radius sphere centered on the peak voxels of the significant cluster (x: −8, y = −9, z: 15). Blue diamonds represent HCs, red circles represent PD patients and black crosses represent VP patients. GMV: gray matter volume; HCs: healthy controls; PD: Parkinson’s disease; VP: vascular parkinsonism.
Applsci 12 07240 g003
Figure 4. Group differences in the structural covariance of the Left Putamen. Brain maps are displayed using the neurological view. Panel (A): Voxels of the Right Hippocampus that expressed differences in the structural association across the three groups. Panel (B): Correlations between the mean gray matter volume of the Left Putamen and the regional gray matter volume extracted from a 4 mm-radius sphere centered on the peak voxels of the significant cluster (x: 21, y = −26, z: −9). Panel (C): Voxels of the Left Hippocampus that expressed differences in the structural association across the three groups. Panel (D): Correlations between the mean gray matter volume of the Left Putamen and the regional gray matter volume extracted from a 4 mm-radius sphere centered on the peak voxels of the significant cluster (x: −12, y = −36, z: 3). Blue diamonds represent HCs, red circles represent PD patients and black crosses represent VP patients. GMV: Gray Matter Volume; HCs: Healthy Controls; PD: Parkinson’s Disease; VP: Vascular Parkinsonism.
Applsci 12 07240 g004
Figure 5. Group differences in the structural covariance of the Right Caudate. Brain maps are displayed using the neurological view. Panel (A): Voxels of the Left Thalamus that expressed differences in the structural association across the three groups. Panel (B): Correlations between the mean gray matter volume of the Right Caudate and the regional gray matter volume extracted from a 4 mm-radius sphere centered on the peak voxels of the significant cluster (x: −6, y= −11, z: 15). Panel (C): Voxels of the Right Insula that expressed differences in the structural association across the three groups. Panel (D): Correlations between the mean gray matter volume of the Right Caudate and the regional gray matter volume extracted from a 4 mm-radius sphere centered on the peak voxels of the significant cluster (x: 41, y= −12, z: 14). Blue diamonds represent HCs, red circles represent PD patients and black crosses represent VP patients. GMV: gray matter volume; HCs: healthy controls; PD: Parkinson disease; VP: vascular parkinsonism.
Applsci 12 07240 g005
Figure 6. Group differences in the structural covariance of the Right Putamen. Brain maps are displayed using the neurological view. Panel (A): Voxels of the Right Thalamus that expressed differences in the structural association across the three groups. Panel (B): Correlations between the mean gray matter volume of the Right Putamen and the regional gray matter volume extracted from a 4 mm-radius sphere centered on the peak voxels of the significant cluster (x: 23, y = −30, z: −3). Panel (C): Voxels of the Left Thalamus that expressed differences in the structural association across the three groups. Panel (D): Correlations between the mean gray matter volume of the Right Putamen and the regional gray matter volume extracted from a 4 mm-radius sphere centered on the peak voxels of the significant cluster (x: −14, y = −35, z: 5). Blue diamonds represent HCs, red circles represent PD patients and black crosses represent VP patients. GMV: gray matter volume; HCs: healthy controls; PD: Parkinson’s disease; VP: vascular parkinsonism.
Applsci 12 07240 g006
Table 1. Demographic, clinical and scintigraphic features of the sample.
Healthy Controls
(N = 12)
PD Patients
(N = 15)
VP Patients
(N = 13)
Group Differences
Mean ± SDMean ± SDMean ± SDF, T, p Values
Gender distribution9 m, 3 f9 m, 6 f9 m, 4 fF = 0.33, p = 0.72
Age73.9 ± 5.770.2 ± 4.375.4 ± 7.3F = 2.93, p = 0.07
MMSE28.33 ± 1.5825.9 ± 2.625.2 ± 2.7F = 5.44, p = 0.009
TOKEN31.05 ± 1.7130.15 ± 2.3321.94 ± 11.69F = 4.82, p = 0.01
COWAT26.95 ± 9.1724.53 ± 9.9814.55 ± 6.36F = 5.46, p = 0.04
RAVLT-I.R.41.78 ± 6.6736.41 ± 9.8028.40 ± 8.61F = 7.52, p = 0.002
RAVLT-D.R.7.98 ± 2.907.48 ± 4.104.5 ± 3.36F = 1.48, p = 0.24
Digit Span fw5.5 ± 1.075.29 ± 0.744.25 ± 1.00F = 6.08, p = 0.006
Digit Span bw3.67 ± 0.494 ± 0.822.92 ± 0.79F = 7.35, p = 0.002
JLO-V23 ± 4.5721.77 ± 4.8117.67 ± 4.42F = 4.42, p = 0.02
MCST5.33 ± 1.234.31 ± 1.312.33 ± 1.15F = 18.24, p < 0.001
WEIGL13.58 ± 2.2710.99 ± 2.135.74 ± 3.55F = 26.03, p < 0.001
FAB14.98 ± 2.1613.63 ± 2.2411.08 ± 2.68F = 8.42, p = 0.001
BDI8.41 ± 5.738.77 ± 4.139.67 ± 4.48F = 0.12, p = 0.88
HAMA8.83 ± 4.197.77 ± 3.569.92 ± 4.38F = 1.96, p = 0.16
Disease Duration-5.5 ± 3.64.7 ± 3.6T = 0.57, p = 0.57
UPDRS (Total Score)-34.7 ± 9.333.3 ± 9.11T = 0.42, p = 0.68
UPDRS-ME-21.9 ± 8.724.4 ± 5.6T = −0.88, p = 0.39
DAT-SPECT (Putamen/Caudate—Right)-1.01 ± 0.391.43 ± 0.88T = −1.40, p = 0.17
DAT-SPECT (Putamen/Caudate—Left)-1.06 ± 0.521.35 ± 0.58T = −1.22, p = 0.24
PD: Parkinson’s disease; VP: vascular parkinsonism; m: male; f: female; SD: Standard Deviation; F: F-value; T: T-value; p: p value; MMSE: Mini-Mental State Examination; TOKEN: Token Test; COWAT: Controlled Oral Word Association Test; RAVLT (I.R. and D.R.): Rey Auditory–Verbal Learning Test (Immediate Recall and Delayed Recall); Digit Span fw and bw: Digit Span forward and backward; JLOV: Judgement of Lines Orientation-V; MCST: Modified Card Sorting Test; WEIGL: Weigl’s Sorting Test; FAB: Frontal Assessment Battery; BDI: Beck Depression Inventory; HAMA: Hamilton Anxiety Rating Scale; UPDRS: Unified Parkinson’s Disease Rating Scale; UPDRS-ME: Unified Parkinson’s Disease Rating Scale-Motor Examination.
Table 2. Structural covariance analysis. Seed region: Left Caudate.
ANOVA Comparisons among the Three Groups
Brain RegionMNI CoordinatesF valueZ-valuep valueCluster extent
xyz
Left Thalamus−8−91516.404.280.001 **1460
Right Insula41−111413.823.960.027 **711
Post hoc comparisons
PD > VP
Brain RegionMNI CoordinatesT valueZ-valuep valueCluster extent
xyz
Left Thalamus−8−9155.484.620.034 *2993
Left Hippocampus−15−3635.074.360.02 **1049
HC > VP
Brain RegionMNI CoordinatesT valueZ-valuep valueCluster extent
xyz
Right Insula41−11145.134.40<0.001 **2918
Right Thalamus23−30−34.734.130.026 **975
* p < 0.05 fwe, whole-brain corrected. ** p < 0.05 fwe cluster level correction using an exploratory threshold of p < 0.001 uncorrected. Nothing was found for the other post hoc comparisons.
Table 3. Structural covariance analysis. Seed region: Left Putamen.
ANOVA Comparisons among the Three Groups
Brain RegionMNI CoordinatesF valueZ-valuep valueCluster extent
xyz
Right Hippocampus21−26−916.984.340.001 **1426
Left Hippocampus−12−36315.814.210.049 **590
Post hoc comparisons
PD > VP
Brain RegionMNI CoordinatesT valueZ-valuep valueCluster extent
xyz
Left Hippocampus−12−3635.554.670.028 *4318
Right Hippocampus21−26−95.504.640.05 *
HC > VP
Brain RegionMNI CoordinatesT valueZ-valuep valueCluster extent
xyz
Right Hippocampus27−11−115.664.570.02 *2132
Right Insula41−11144.954.280.001 **1895
Left Rectus−923−144.644.070.016 **1102
Right Cerebellum Crus 217−78−363.973.580.019 **1053
p < 0.05 fwe, whole-brain corrected. ** p < 0.05 fwe cluster level correction using an exploratory threshold of p < 0.001 uncorrected. Nothing was found for the other post hoc comparisons.
Table 4. Structural covariance analysis. Seed region: Right Caudate.
ANOVA Comparisons among the Three Groups
Brain RegionMNI CoordinatesF valueZ-valuep valueCluster extent
xyz
Left Thalamus−6−111516.134.250.004 **1110
Right Insula41−121413.343.890.032 **681
Post hoc comparisons
PD > VP
Brain RegionMNI CoordinatesT valueZ-valuep valueCluster extent
xyz
Left Thalamus−6−11155.434.590.038 *2801
Left Para Hippocampus−18−33−114.624.050.032 **919
Right Cerebellum Crus 214−81−364.143.710.037 **883
HC > VP
Brain RegionMNI CoordinatesT valueZ-valuep valueCluster extent
xyz
Right Insula41−12145.074.36<0.001 **2702
Left Frontal- med-orb (BA 10)−547−84.744.140.0041560
Right Cerebellum Crus 212−78−364.113.690.02 **1054
p < 0.05 fwe, whole-brain corrected. ** p < 0.05 fwe cluster level correction using an exploratory threshold of p < 0.001 uncorrected. Nothing was found for the other post hoc comparisons.
Table 5. Structural covariance analysis. Seed region: Right Putamen.
ANOVA Comparisons among the Three Groups
Brain RegionMNI CoordinatesF valueZ-valuep valueCluster extent
xyz
Right Thalamus23−30−316.554.290.001**1566
Left Thalamus−14−35514.444.040.004**631
Post hoc comparisons
PD> VP
Brain RegionMNI CoordinatesT valueZ-valuep valueCluster extent
xyz
Right Hippocampus
Left Thalamus
23
−14
−27
−35
−9
5
5.364.550.04 *4370
HC> VP
Brain RegionMNI CoordinatesT valueZ-valuep valueCluster extent
xyz
Right Hippocampus29−12−115.404.570.04 *253
Right Para Hippocampal region23−29−175.244.470.004 **1523
Left Frontal -Med- Orb−935−124.864.220.009 **1299
Right Insula41−11144.844.210.001 **1959
p < 0.05 fwe, whole-brain corrected. ** p < 0.05 fwe cluster level correction using an exploratory threshold of p < 0.001 uncorrected. Nothing was found for the other post hoc comparisons.
Table 6. Modulation Analysis of Structural Covariance.
A. Seed region: Right Caudate; Target Region: Right Insula
Cognitive variableSignificance of the interaction term
COWATT = −2.26; p = 0.029
RAVLT- DRT = −2.33; p = 0.045
MCSTT = −2.59; p = 0.029
BDIT = −3.09; p = 0.013
HAMAT = −2.64; p = 0.027
B. Seed region: Right Caudate; Target Region: Left Thalamus
BDIT = −2.64; p = 0.027
C. Seed region: Right Putamen; Target Region: Left Thalamus
MCSTT = −2.28; p = 0.048
T: T-value; p: p value; COWAT: Controlled Oral Word Association Test; RAVLT-DR: Rey Auditory–Verbal Learning Test Delayed Recall; MCST: Modified Card Sorting Test; BDI: Beck Depression Inventory.
Publisher’s Note: MDPI stays neutral with regard to jurisdictional claims in published maps and institutional affiliations.

