Abstract
In the urban environment, there are strict control requirements for deep foundation pit deformation, resulting in earth pressure on the flexible supports often being in a nonlimiting state. Therefore, it is important to consider displacement when calculating earth pressure. In this study, lateral unloading stress path triaxial compression tests were performed to investigate the radial stress–strain relationship of soft clay in an active region. Herein, a displacement-dependent earth pressure model is proposed with the assumption of the soil strain distribution in the disturbed area. From the surface of the ground to the deepest part of the support structure, the sufficient active displacement inversed by the proposed model decreased, which confirmed that the earth pressure along the entire wall could not achieve its active conditions simultaneously. The efficacy of the proposed model is demonstrated through a comparison of the predicted earth pressure with the experimental results reported in the published literature.
1. Introduction
With the exploitation of underground space, many deep excavations occur. In order to improve the safety of foundation pit engineering, which can reduce potential harm to the environment, there are strict control requirements for the deformation of the supporting structure. For key foundation pits, lateral wall deformations are controlled within 0.18% and 0.2~0.5% of the excavation depth in Shanghai (DG/TJ 08-6l-2018) [1] and Zhejiang province (DB33/T 1096-2014) [2], respectively. Meanwhile, the excavation deformation in clay at full active state is 1~2% of the excavation depth [3,4] (Clough and Duncan, 1991; Becker and Moore, 2004); additionally, measurements performed using a centrifuge test in a paper by Yue and Zhang [5] determined that the active limiting deformation in clay is 0.9~1% of the excavation depth. Therefore, the support does not show sufficient lateral movement to achieve an active condition. The Rankine and Coulomb earth pressure theories are commonly used in design and are only valid for the limiting condition; therefore, these theories are not useful in calculating the magnitude and distribution of displacement-dependent earth pressure in nonlimiting states.
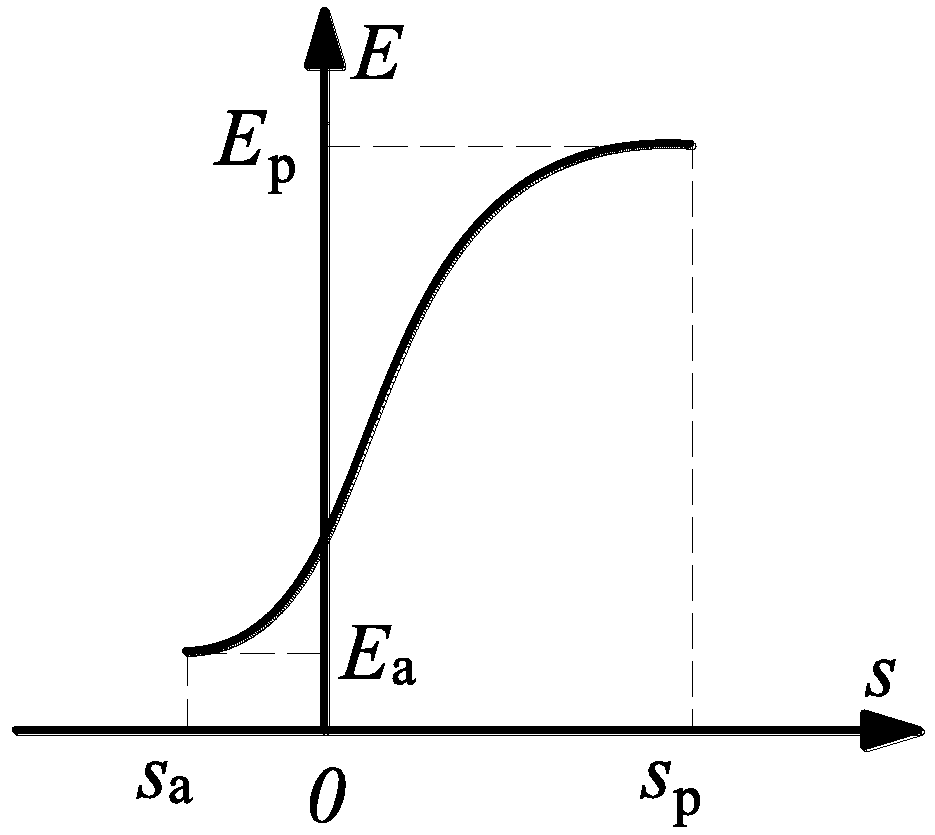
Many field monitoring [6,7] and experimental results [8,9,10] have shown that earth pressure is closely related to the deformation of the retaining walls. The research methods of these studies focus on the relationship between earth pressure and the deformation of a rigid retaining wall, which can be summarized in three aspects. First, the classical equation of active earth pressures adopts the mobilized shear strength value instead of the limiting strength value. Bang [11] assumed a linear variation in the mobilized angle of internal friction along the entire depth of the wall. Chang [12] set a linear relationship between the mobilized shearing resistance represented by the tangent and the corresponding wall displacement. According to the Mohr circle of stress under the situation of an intermediate active state and the unloading stress–strain relationship, Lu and Yang [13,14] established the relationship between the mobilized internal frictional angle and the wall movement. Using the same approach, Xu et al. [15] provided the mobilized shear strength for clay. In addition, the strength reduction method [16] and the disturbed state concept [17] have also been applied to calculate the mobilized shear strength. Second, various empirical functions have been proposed to fit the earth pressure–displacement relationship. On the basis of two centrifugal test results, the hyperbolic function model was derived by Lu. Based on the well-known curve [18] of the earth pressure–displacement relationship in practice, as shown in Figure 1, various functions, including the sigmoid functions [19,20], the exponential function [21], the sine function [22], and the hyperbolic function [23,24], can be assumed to fit the relationship. Third, earth pressure can be determined on the soil strain state. Zhang et al. [25] extended the Rankine and Coulomb theories depending on the strain increment ratio. With a new insight, Mei et al. [26] proposed a method of taking the isotropic stress state as the turning point, where the lateral strain has zero value. Tang et al. [27] developed a model based on the hyperbolic stress–strain relationship to predict earth pressure with different wall movements.

Figure 1.
The earth pressure–displacement curve.
Current methods of predicting earth pressure that account for wall deformation focus on rigid retaining walls. However, the supporting structure of a deep foundation pit is thinner than a rigid retaining wall, the so-called flexible retaining wall, which can cause obvious deflection. A series of model tests [28,29,30,31] were carried out to investigate the nonlinear earth pressure distribution of the cantilever retaining walls, while the effects of wall displacement on the earth pressure were not considered. Based on the progressive rupture mechanism that occurs in backfill, Li et al. [32] proposed a modified solution for earth pressure against the cantilever retaining wall. Considering the typical deformation mode of deep multi-strutted excavation, Ying and Cai [33] deduced the magnitude and distribution of the active earth pressure using the differential flat element method. Ying et al. [34] simplified the soil behind the wall as the combination of nonlinear springs and a rigid plasticity object; in this way, earth pressure on the flexible retaining walls under any lateral deformation can be obtained. Although nonlimited earth pressure against flexible supports has attracted attention from researchers [35,36,37,38,39], these new methods are not friendly and put forward higher technical requirements for designers. Thus, a simple model should be proposed which can be achieved by conventional methods and be easy to be used widely.
Underground excavation for construction is a typical lateral unloading process, in which the stress field and the displacement field of the soil around the foundation pit are disturbed, especially in soft soil. Therefore, it is necessary to explore the variation in earth pressure during the excavation process. In this study, reduced triaxial compression (RTC) tests, which simulate the lateral unloading stress path during excavation, were performed for the stress–strain relationship of soft clay in an active region. Combined with an assumption of soil strain distribution in the disturbed area, an active earth pressure model considering wall displacement was proposed and verified with experimental results from centrifuge model tests and full-scale tests.
2. Materials and Methods
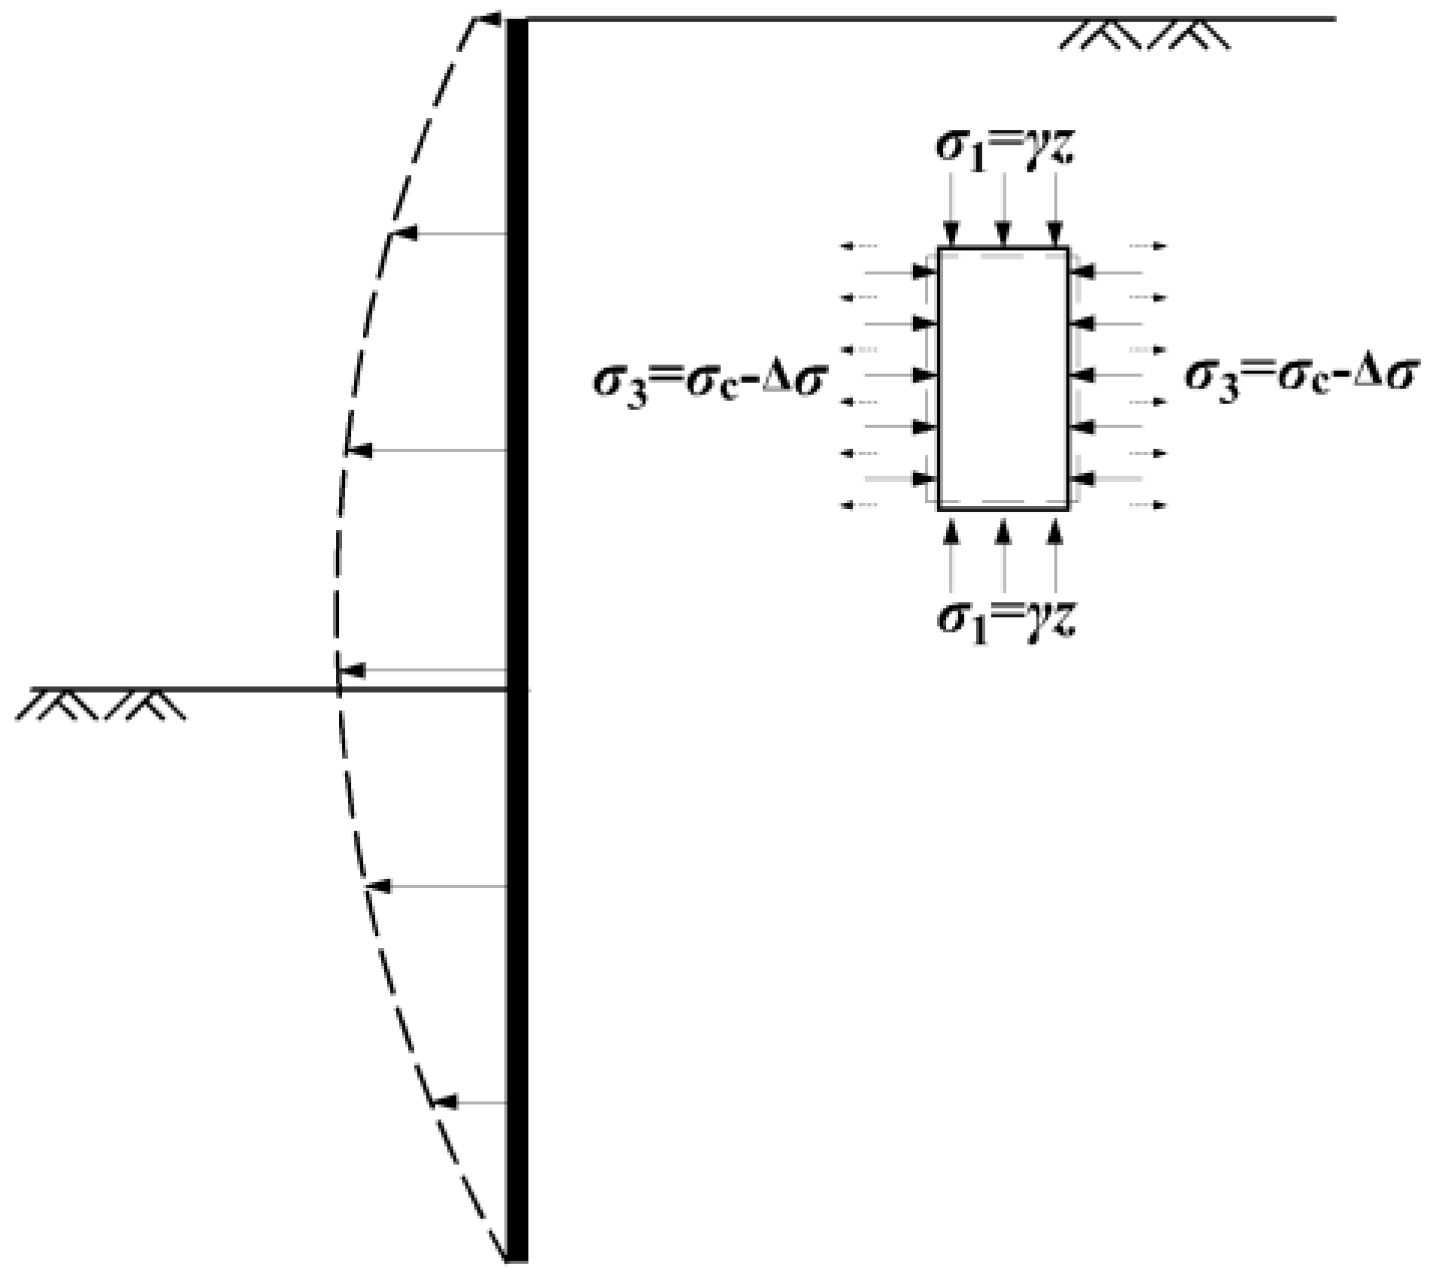
Excavation-induced soil unloading causes variation in the stress state of soil masses at the back of a wall, as shown in Figure 2. Vertical stress is a constant, as a result of the gravity affecting soil, while horizontal stress decreases during the excavation process. The conventional triaxial compression test is inappropriate for simulations of the stress path of the unloading process.

Figure 2.
Diagram of excavation.
2.1. Test Apparatus
Test equipment was required to measure the radial strain of a soil sample during the lateral unloading process. Existing methods for monitoring radial strain include the digital image measurements [40,41], the Hall effect transducers measurement [42,43], and calculation using the back volume change [44].
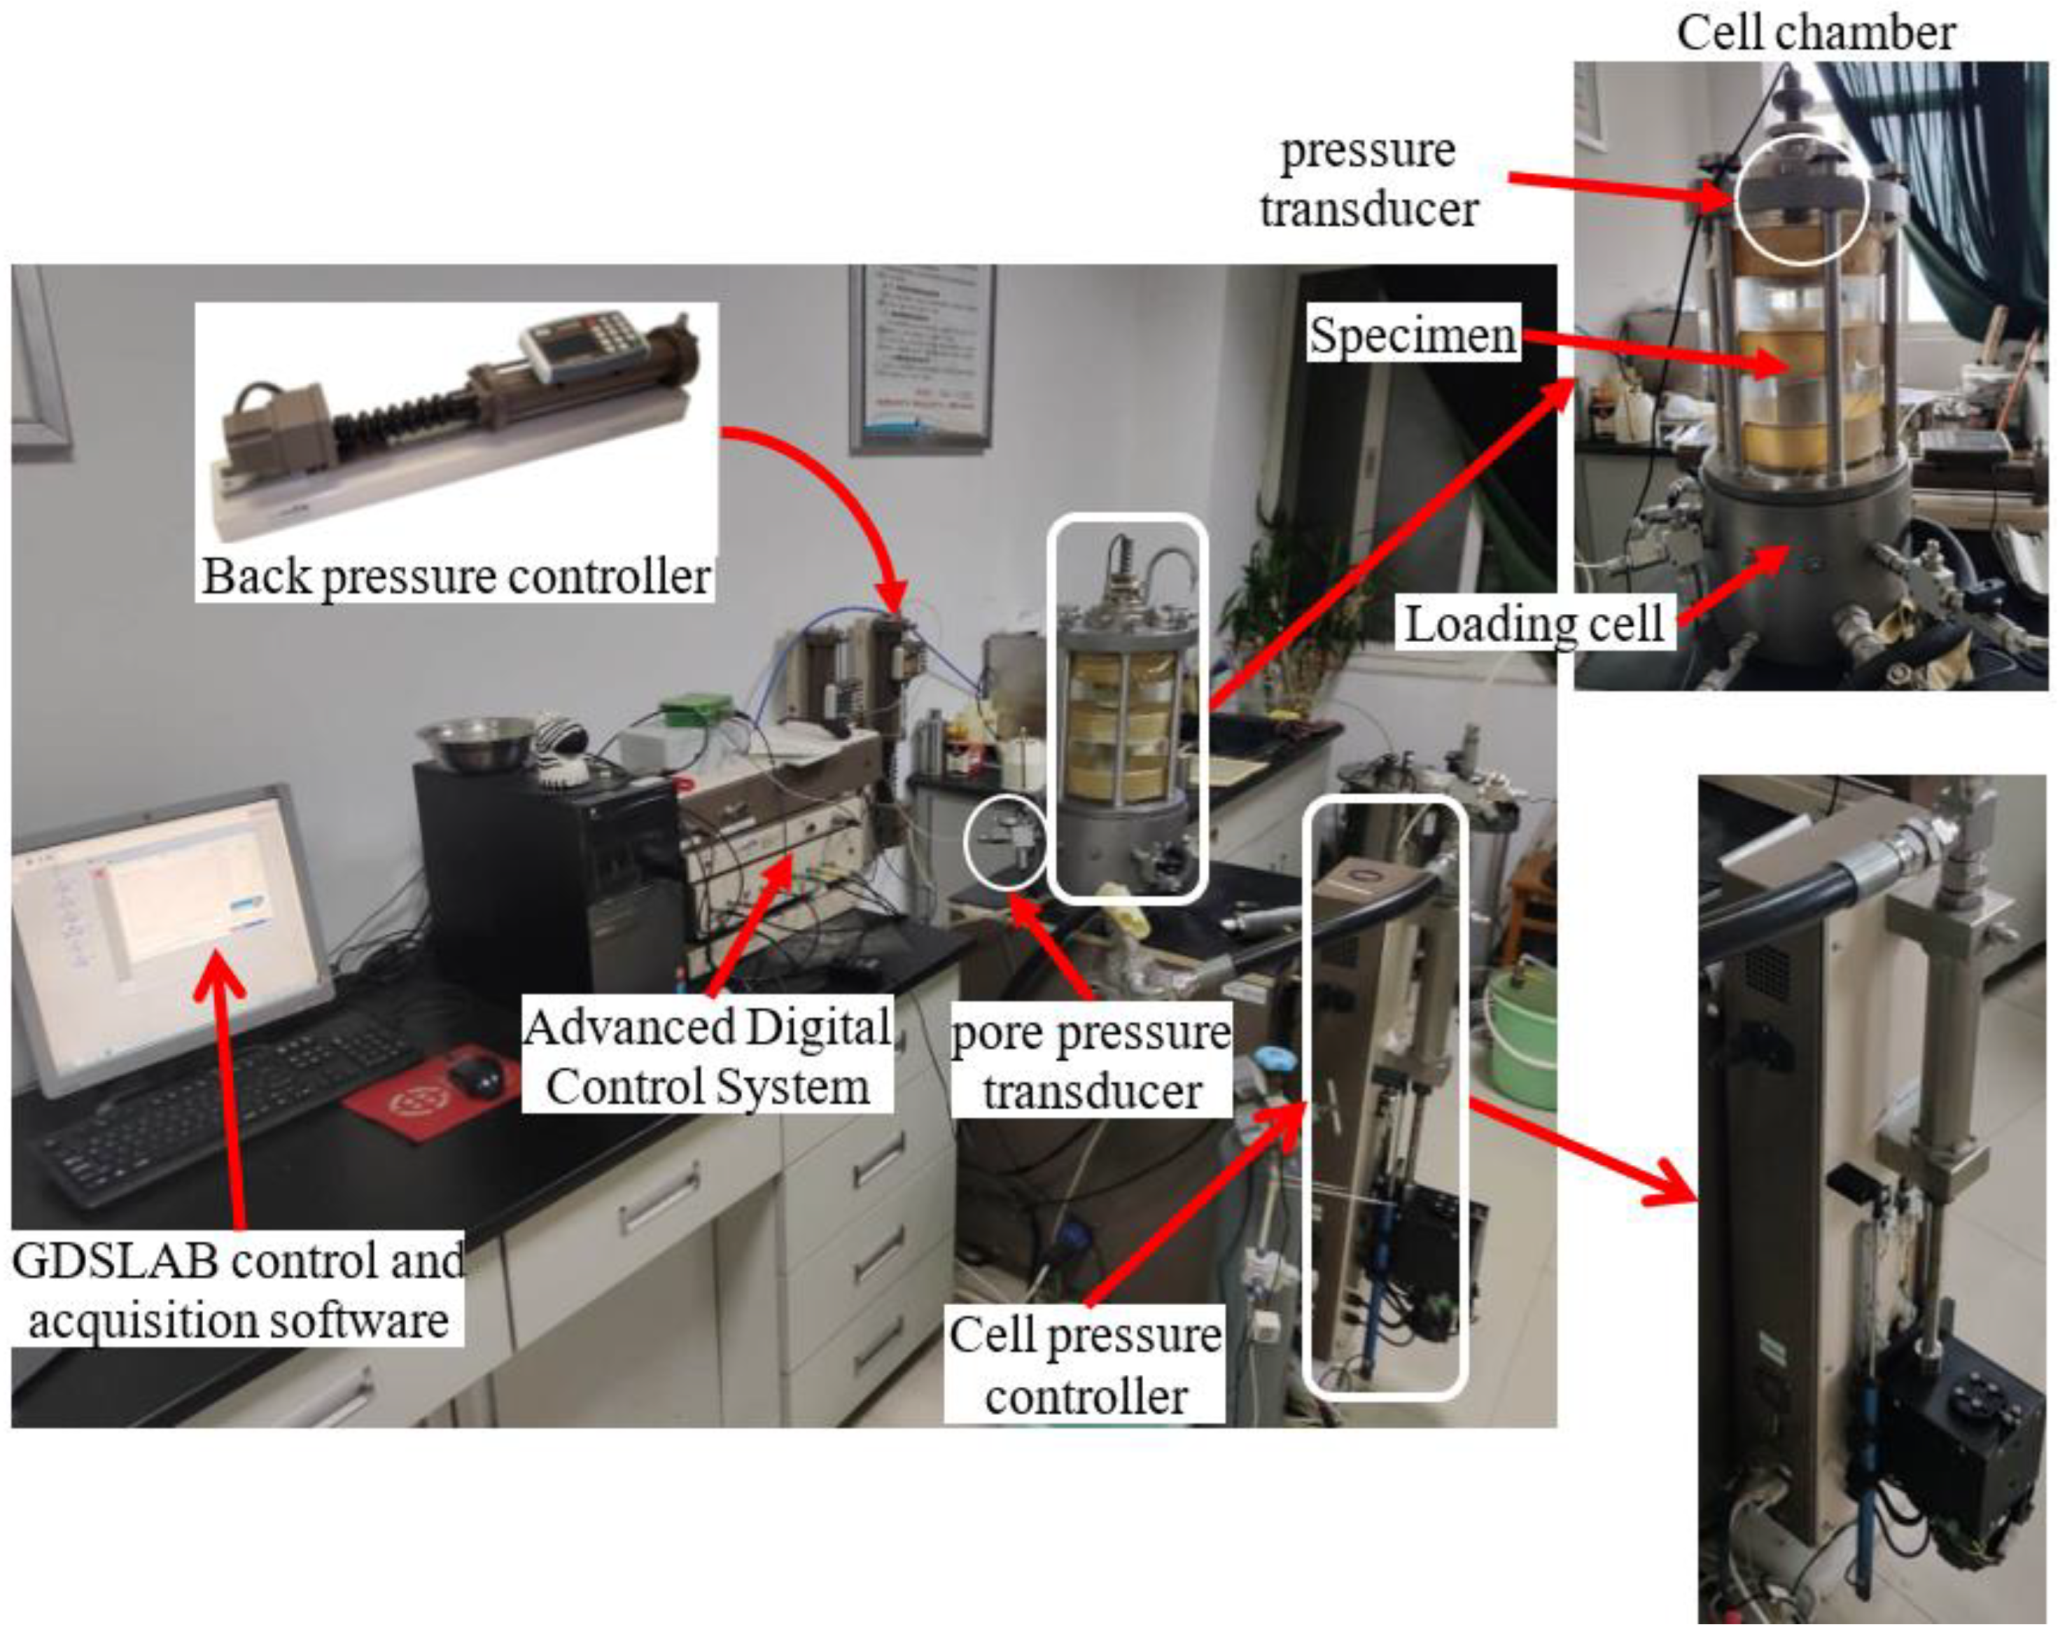
GDSTTS, an advanced, automated stress path triaxial testing system, was used in the tests. The fundamental system hardware elements are shown in Figure 3. The GDS system provides two ways to measure lateral strain: one is a direct measurement by a Hall effect transducer, and the other involves a conversion using the vertical deformation. A Hall effect transducer needs to be installed in such a way that it passes through the middle of the sample, which causes heavy disturbance to the sample. The operation is difficult to complete, especially for soft soil, and it is an intensive process that can only measure the strain of a specified section. The second approach was used to obtain the equivalent uniform radial strain in this experiment. The equivalent radial strain can be converted using Equation (1), in which the axial displacement change Δh was monitored using an external LVDT, the volume change ΔV was monitored by a back pressure controller, and other values included the initial parameters of the soil samples. It is worth noting that the radial strain obtained by this method is an average value of the diameter change rate along the whole height, which is different from the local strain measurement.
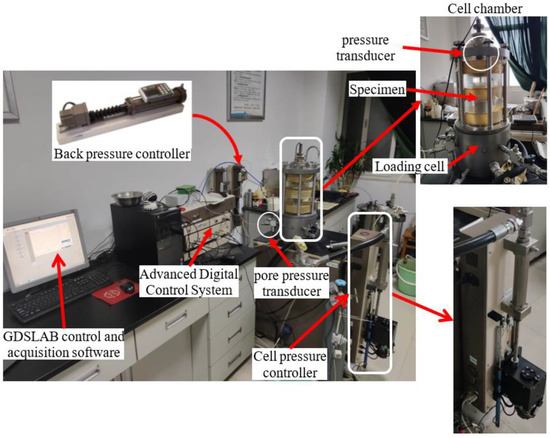
Figure 3.
Schematic diagram of GDS triaxial testing system.
2.2. Test Specimens
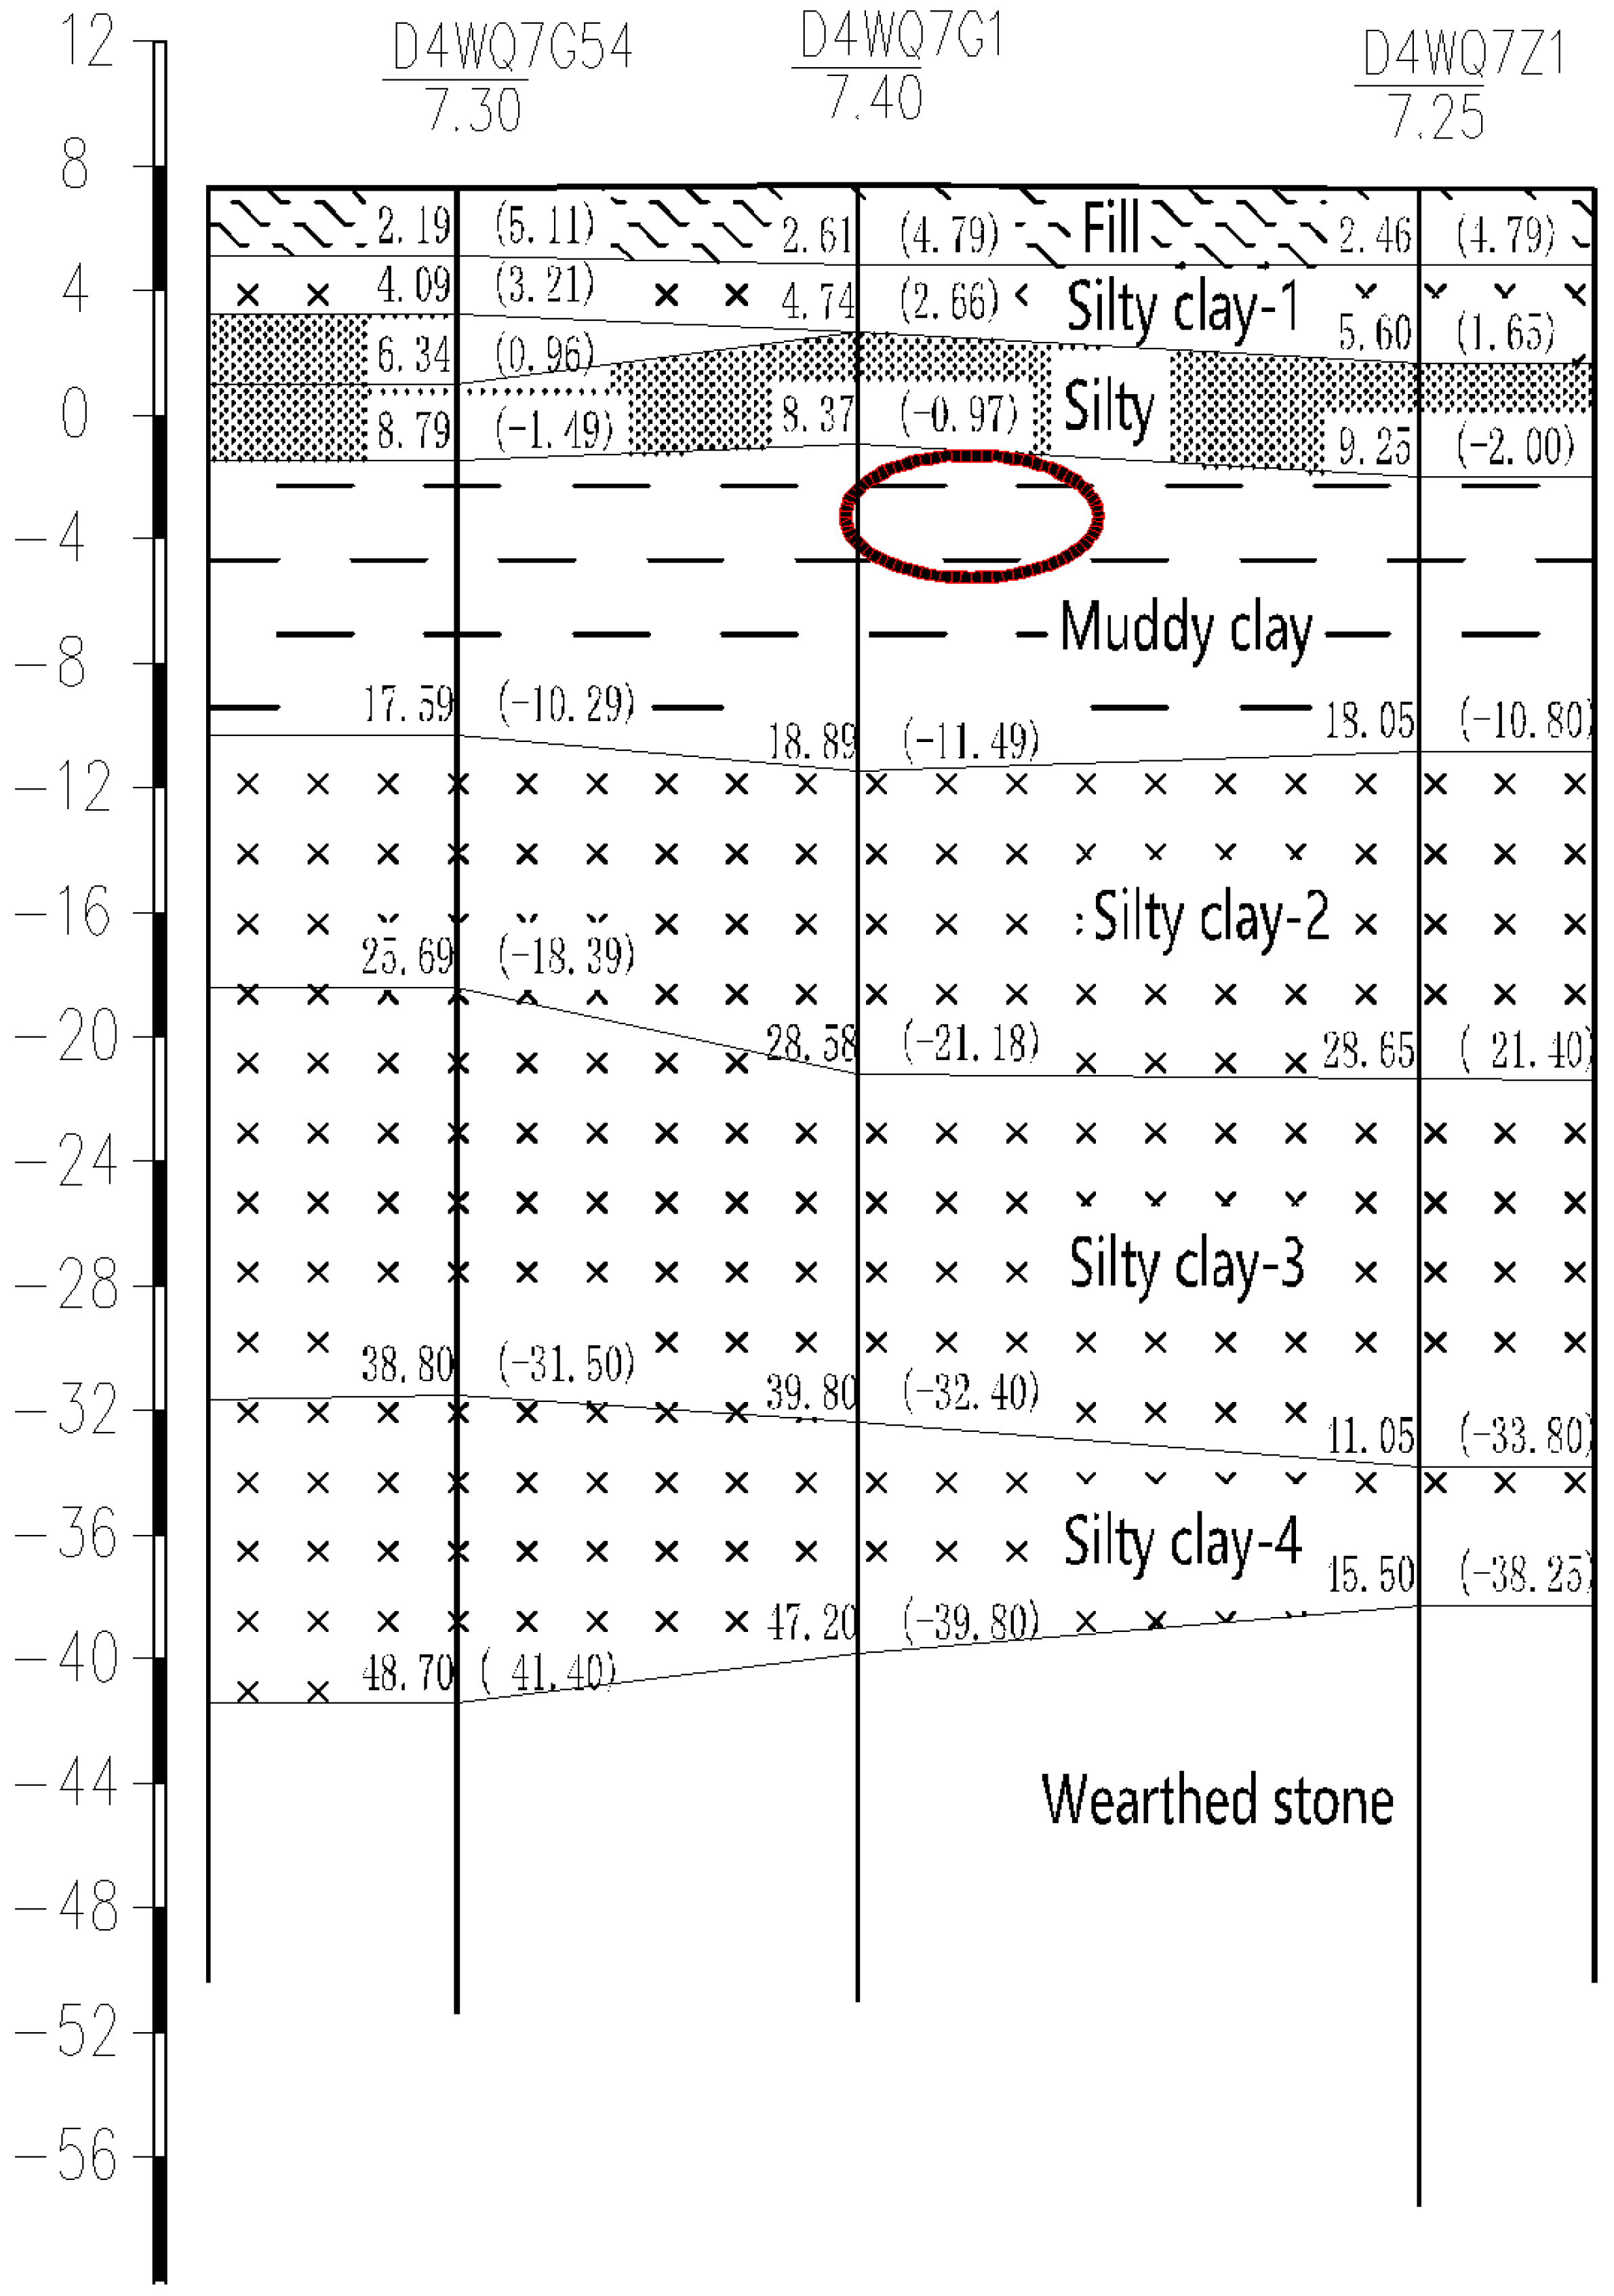
In order to eliminate the influence of complex factors such as the preconsolidation pressure and the structure of clay on the measurements, only the behavior of the reconstituted soil was studied in the tests. The soil sample, which belonged to the ancient Qinhuai River floodplain landform, was taken from a construction site (Figure 4) in Nanjing, China, at depths of 8.5–9.5 m (the red circle in Figure 4). The averaged values of the main physical properties of the sampling location are listed in Table 1.
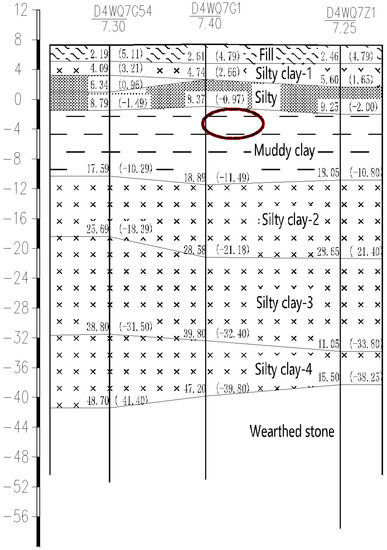
Figure 4.
Geological profile of construction site.

Table 1.
Physical properties of the excavation site.
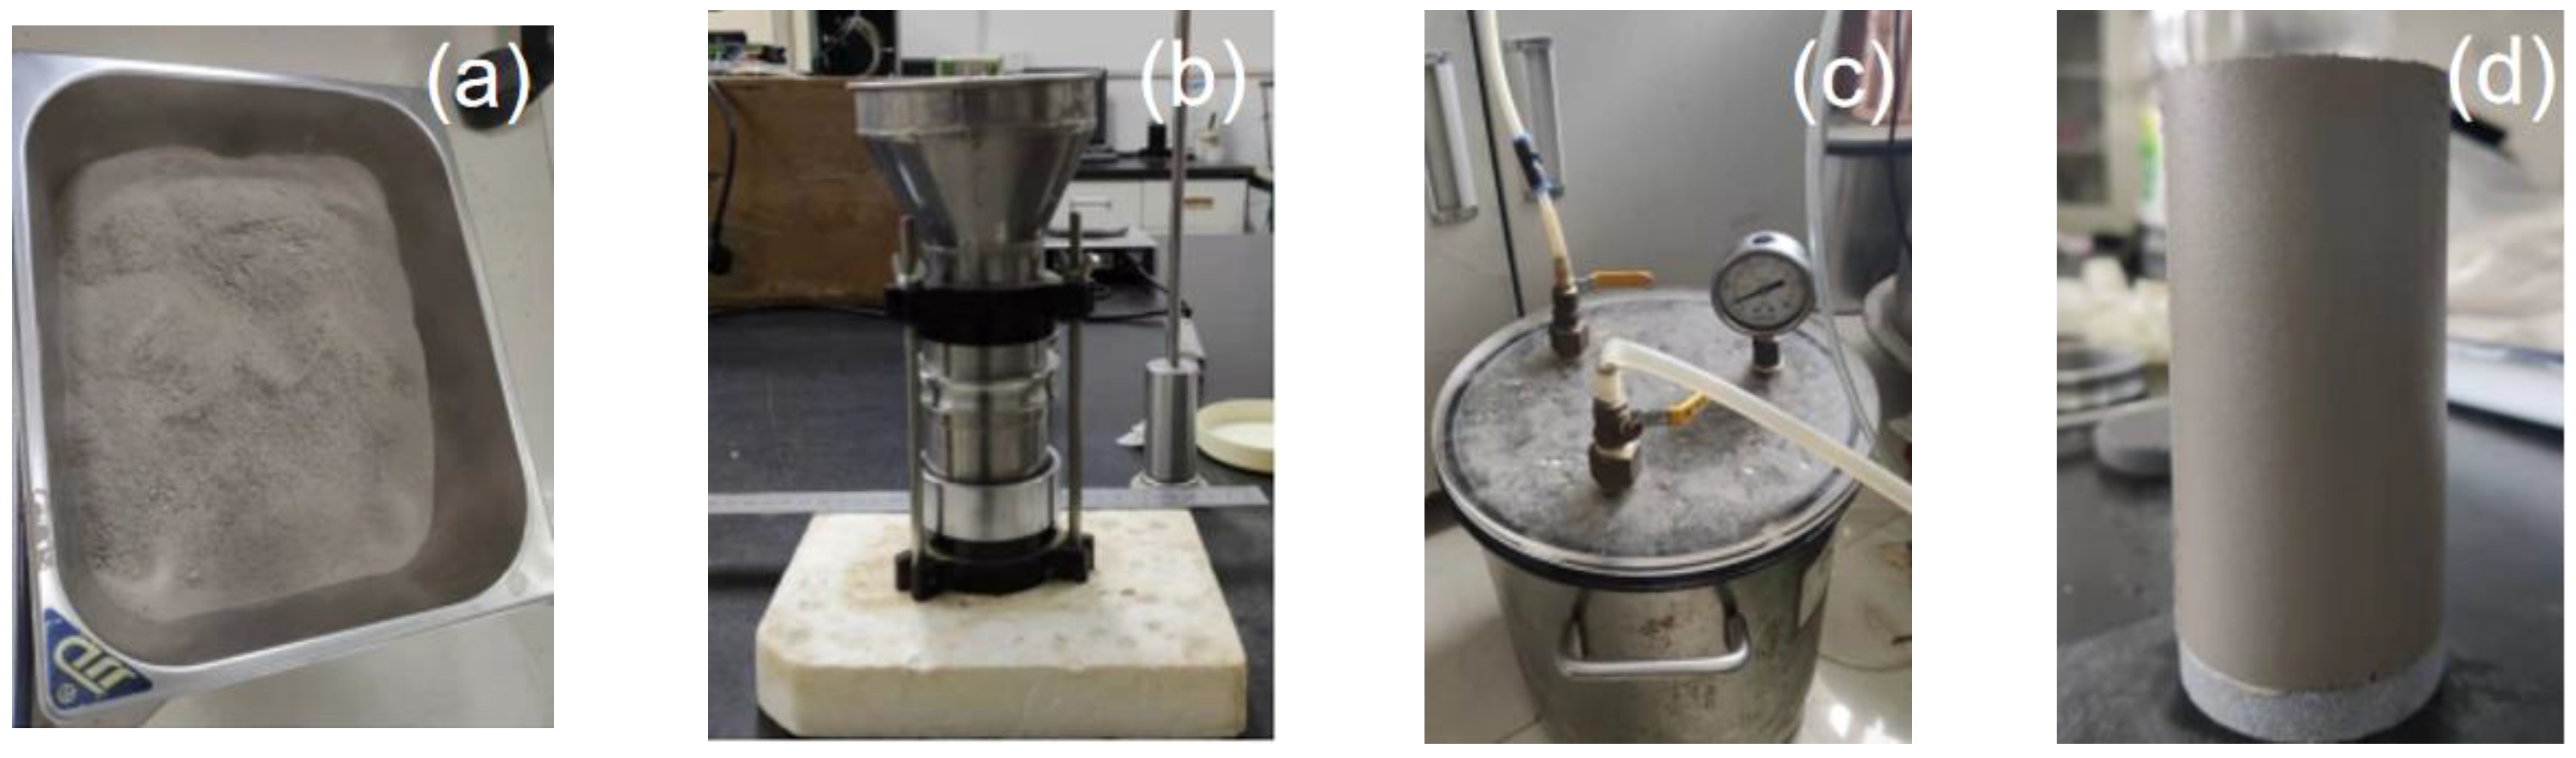
Field soil was dried in a constant-temperature oven for no less than 12 h; then, the dry soil was crushed and filtered with a 1 mm aperture screen to obtain soil powder, as shown in Figure 5a. The powder was stored in a covered container. The void ratio and saturation density of the specimens were 1.03 and 1.86 g/cm3, respectively; therefore, a sample with a diameter of 50 mm and height of 100 mm equated to 265 g dry powder. The specimens were prepared with dry soil powder in five layers using three split molds constituting circular cross-sections, as shown in Figure 5b. The dry soil specimens, created with the three split molds, were moved to a vacuum-saturated cylinder, as shown in Figure 5c. An atmospheric pressure vacuum was applied to the specimens for more than 1 h. Water was poured into the cylinders slowly, and the specimens were soaked in the water for no less than 12 h. Figure 5d shows the specimen after it was removed from the mold.
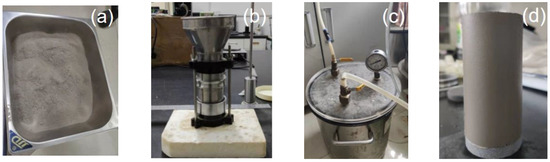
Figure 5.
The process of forming the reconstituted specimens.
2.3. Testing Program
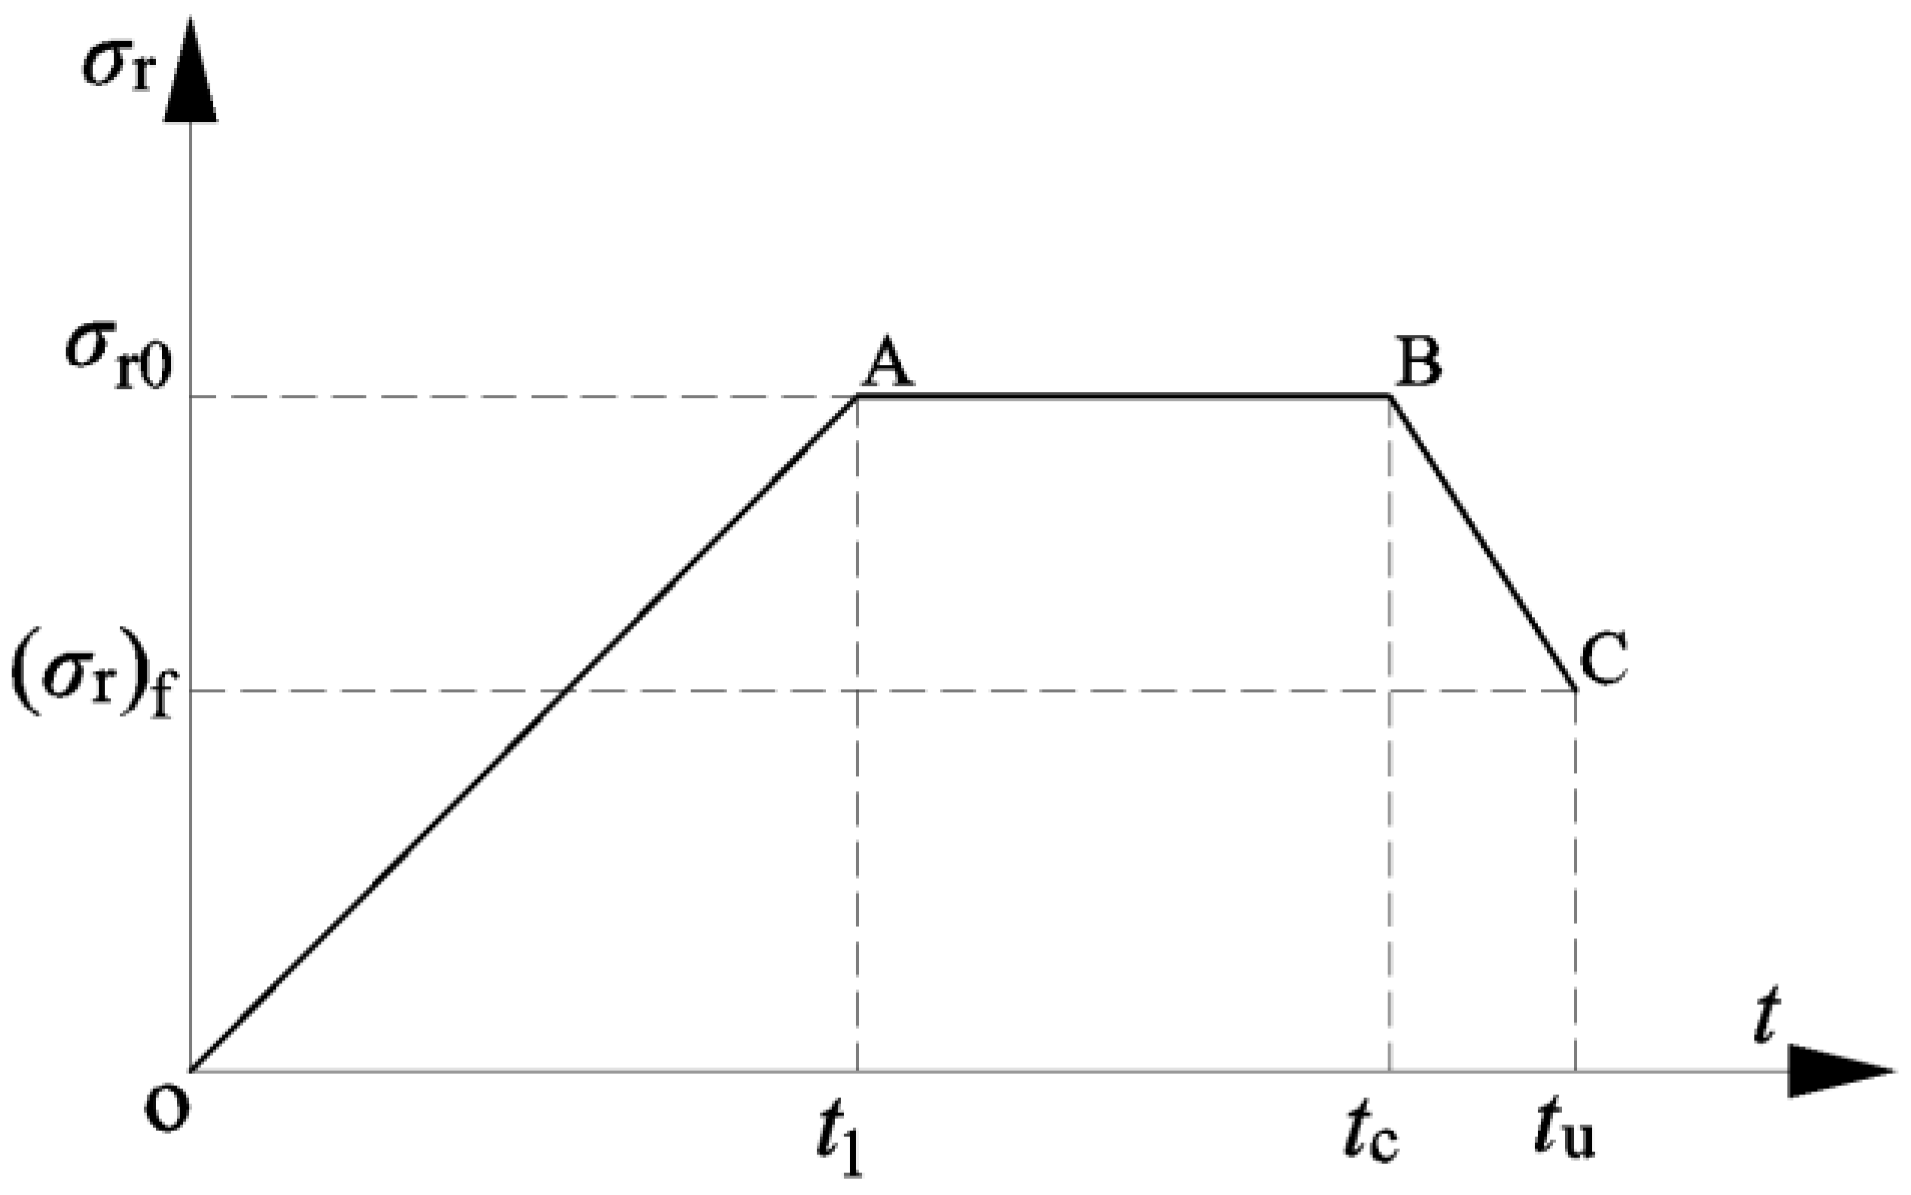
Since the soft soil is generally distributed within 20 m, the cell pressures of the tests were 50, 100, and 200 kPa, respectively. The specimens were 50 mm in diameter and 100 mm in height. The consolidated undrained (CU) test was divided into four stages: specimen preparation, saturation, K0 consolidation, and lateral unloading process. The specimens were prepared following GB/T 50123 [45] and Esmaeili-Falaki [46,47]. The specimens were saturated by applying a vacuum and back pressure until the B-value was greater than 0.98. K0 consolidation was controlled by commercial software, using a ramp of radial stress with back volume change measurement, as displayed in Figure 6. The axial displacement of the specimen was adjusted slowly to maintain the initial diameter. The loading time of the OA stage was 1000 min, while the consolidation step was terminated when the back volume change was less than 5 mm3/5 min. During the lateral unloading stage, the cell pressure decreased at a constant rate of 0.2 kPa/min in the BC stage, with constant axial stress, until the axial strain ε1 increased by 15% (GB/T 50123-2019).
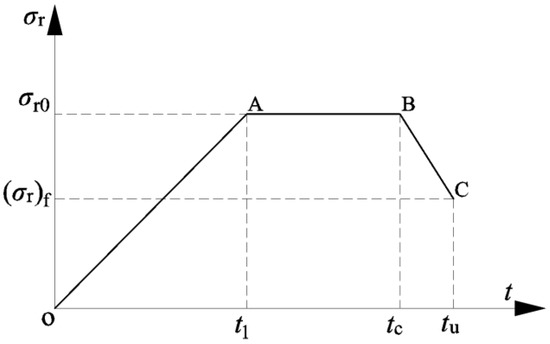
Figure 6.
History of the radial stress.
The effective stress path of the whole RTC test under three initial cell pressure values is shown in Figure 7. In first stage, the path reached the K0 consolidation state along an oblique line. From the figure, we can see that the performance of the consolidation, conducted by the automatic K0 consolidation module, was satisfying. In the unloading shear stage, the lateral pressure decreased while the axial pressure remained constant, so that the mean effective stress, p’, decreased and the deviator stress, q, increased. The path approached the critical state along the upper left, and the theoretical slope of this direction was 2/3. In the shear stage, the volume of the soil sample remained constant under undrained conditions, so the curve of the v-lnp’ relationship was a horizontal line. The stress conditions of the soil specimens in the K0 state of the tests are listed in Table 2.
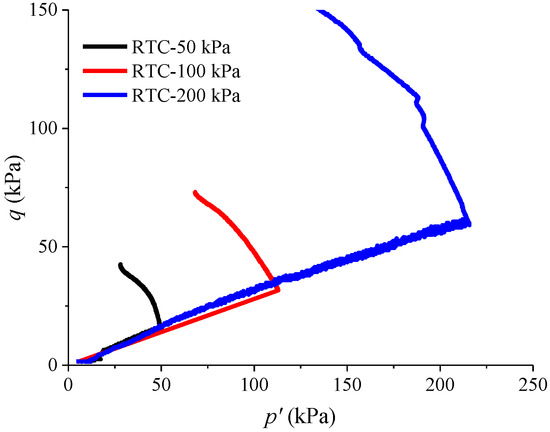
Figure 7.
The curves of p’-q.
Table 2.
The stress condition in K0 state.
2.4. Test Results and Analysis
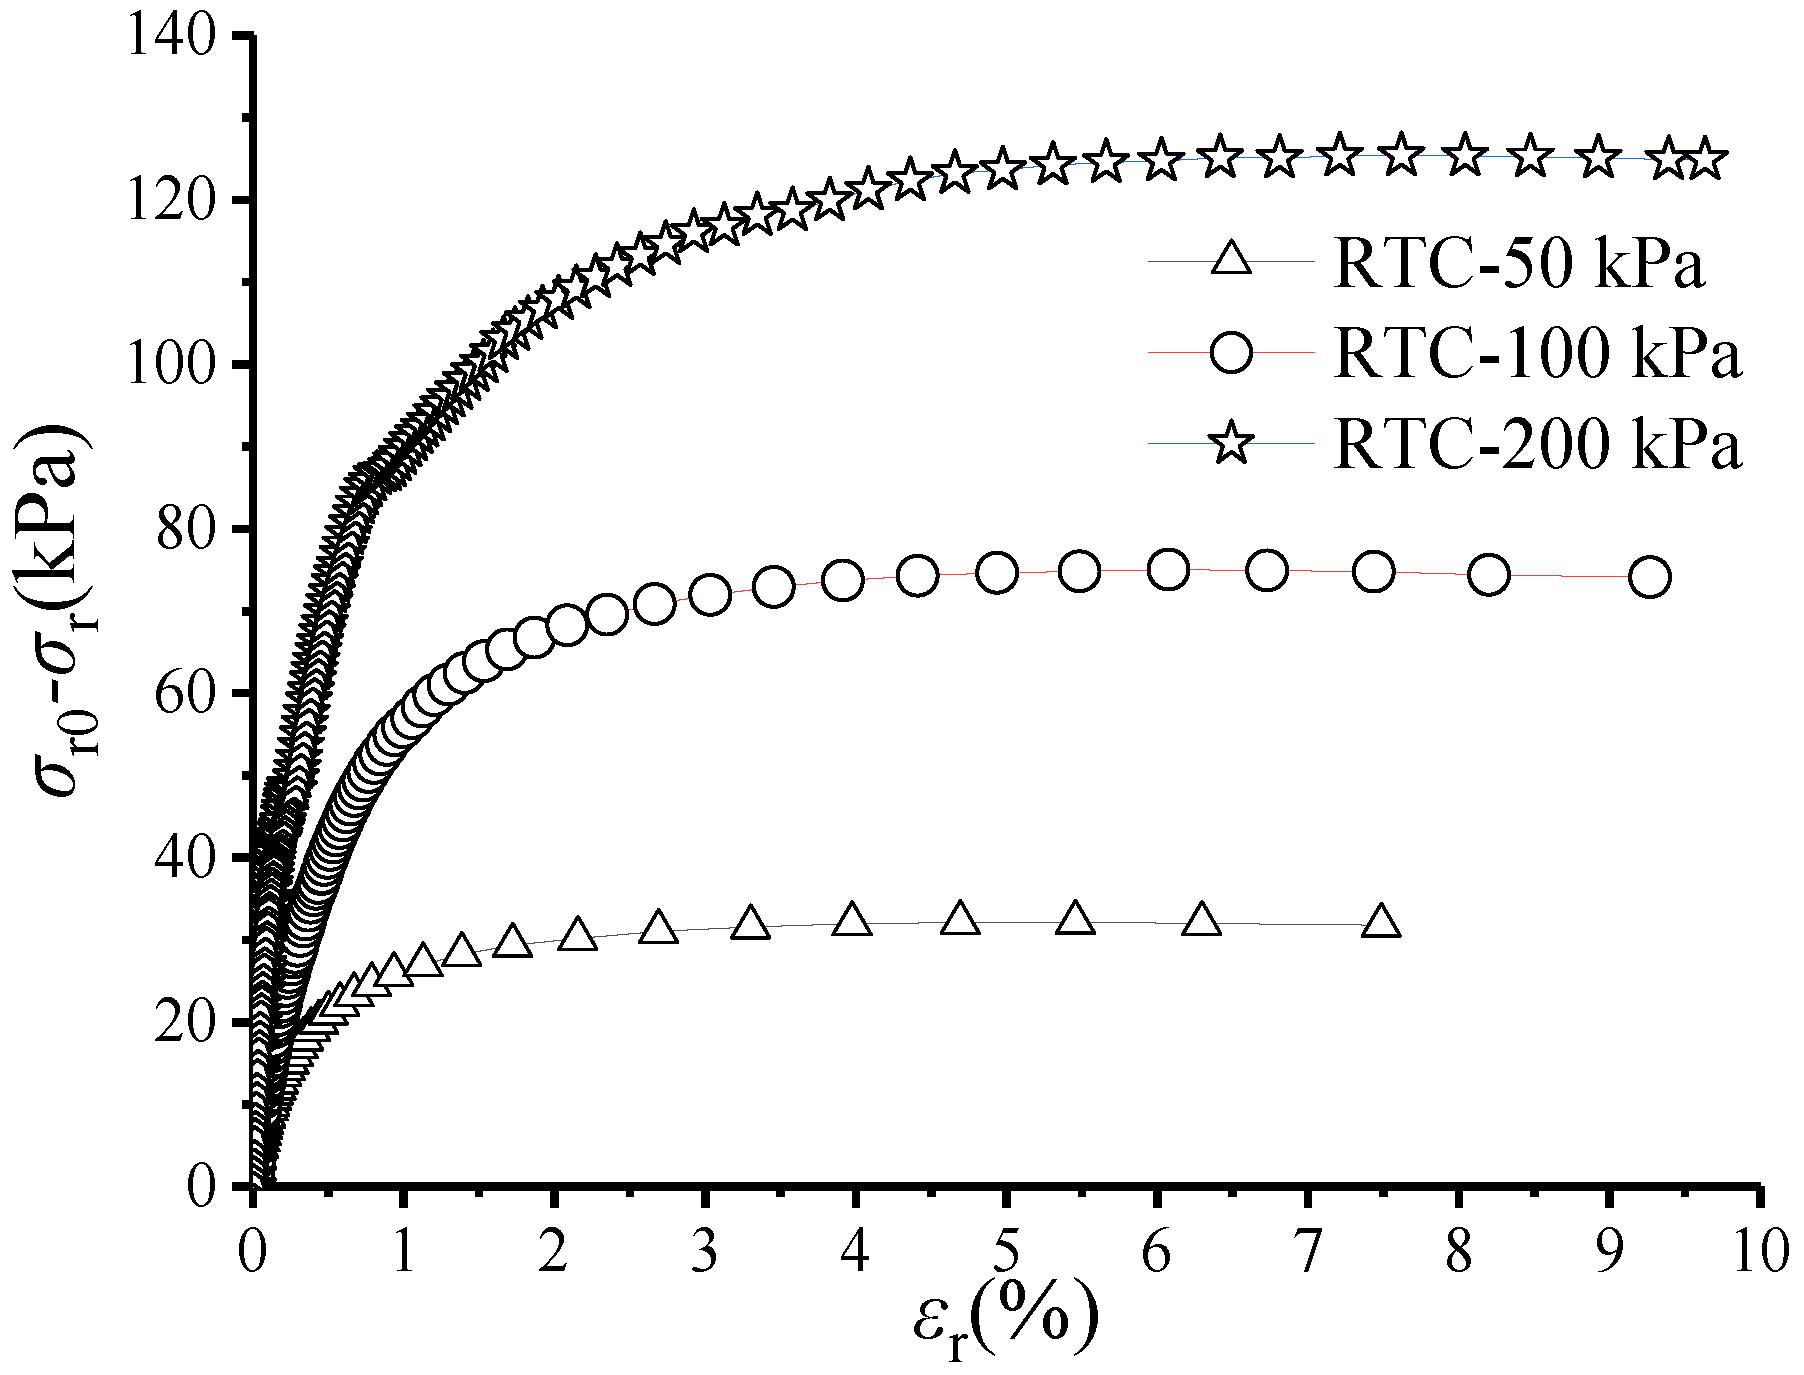
The radial stress–strain curves corresponding to the 15% axial strain range are plotted in Figure 8. It can be seen from the figure that the nonlinear relationships of the three curves are hyperbolic representations; therefore, the radial stress–strain relationship can be described on the basis of the Duncan–Chang model.
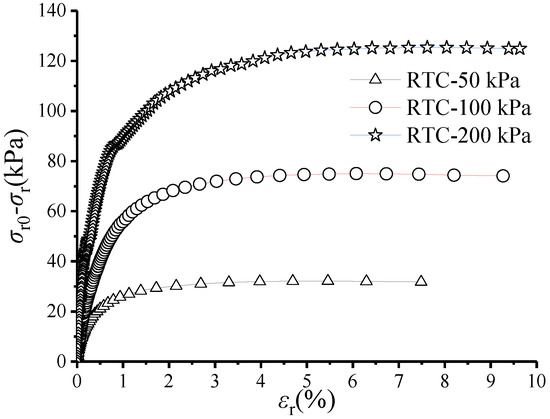
Figure 8.
The curves of (σr0 − σr)~εr.
The hyperbolic model of the soft soil is proposed in Equation (2), as follows:
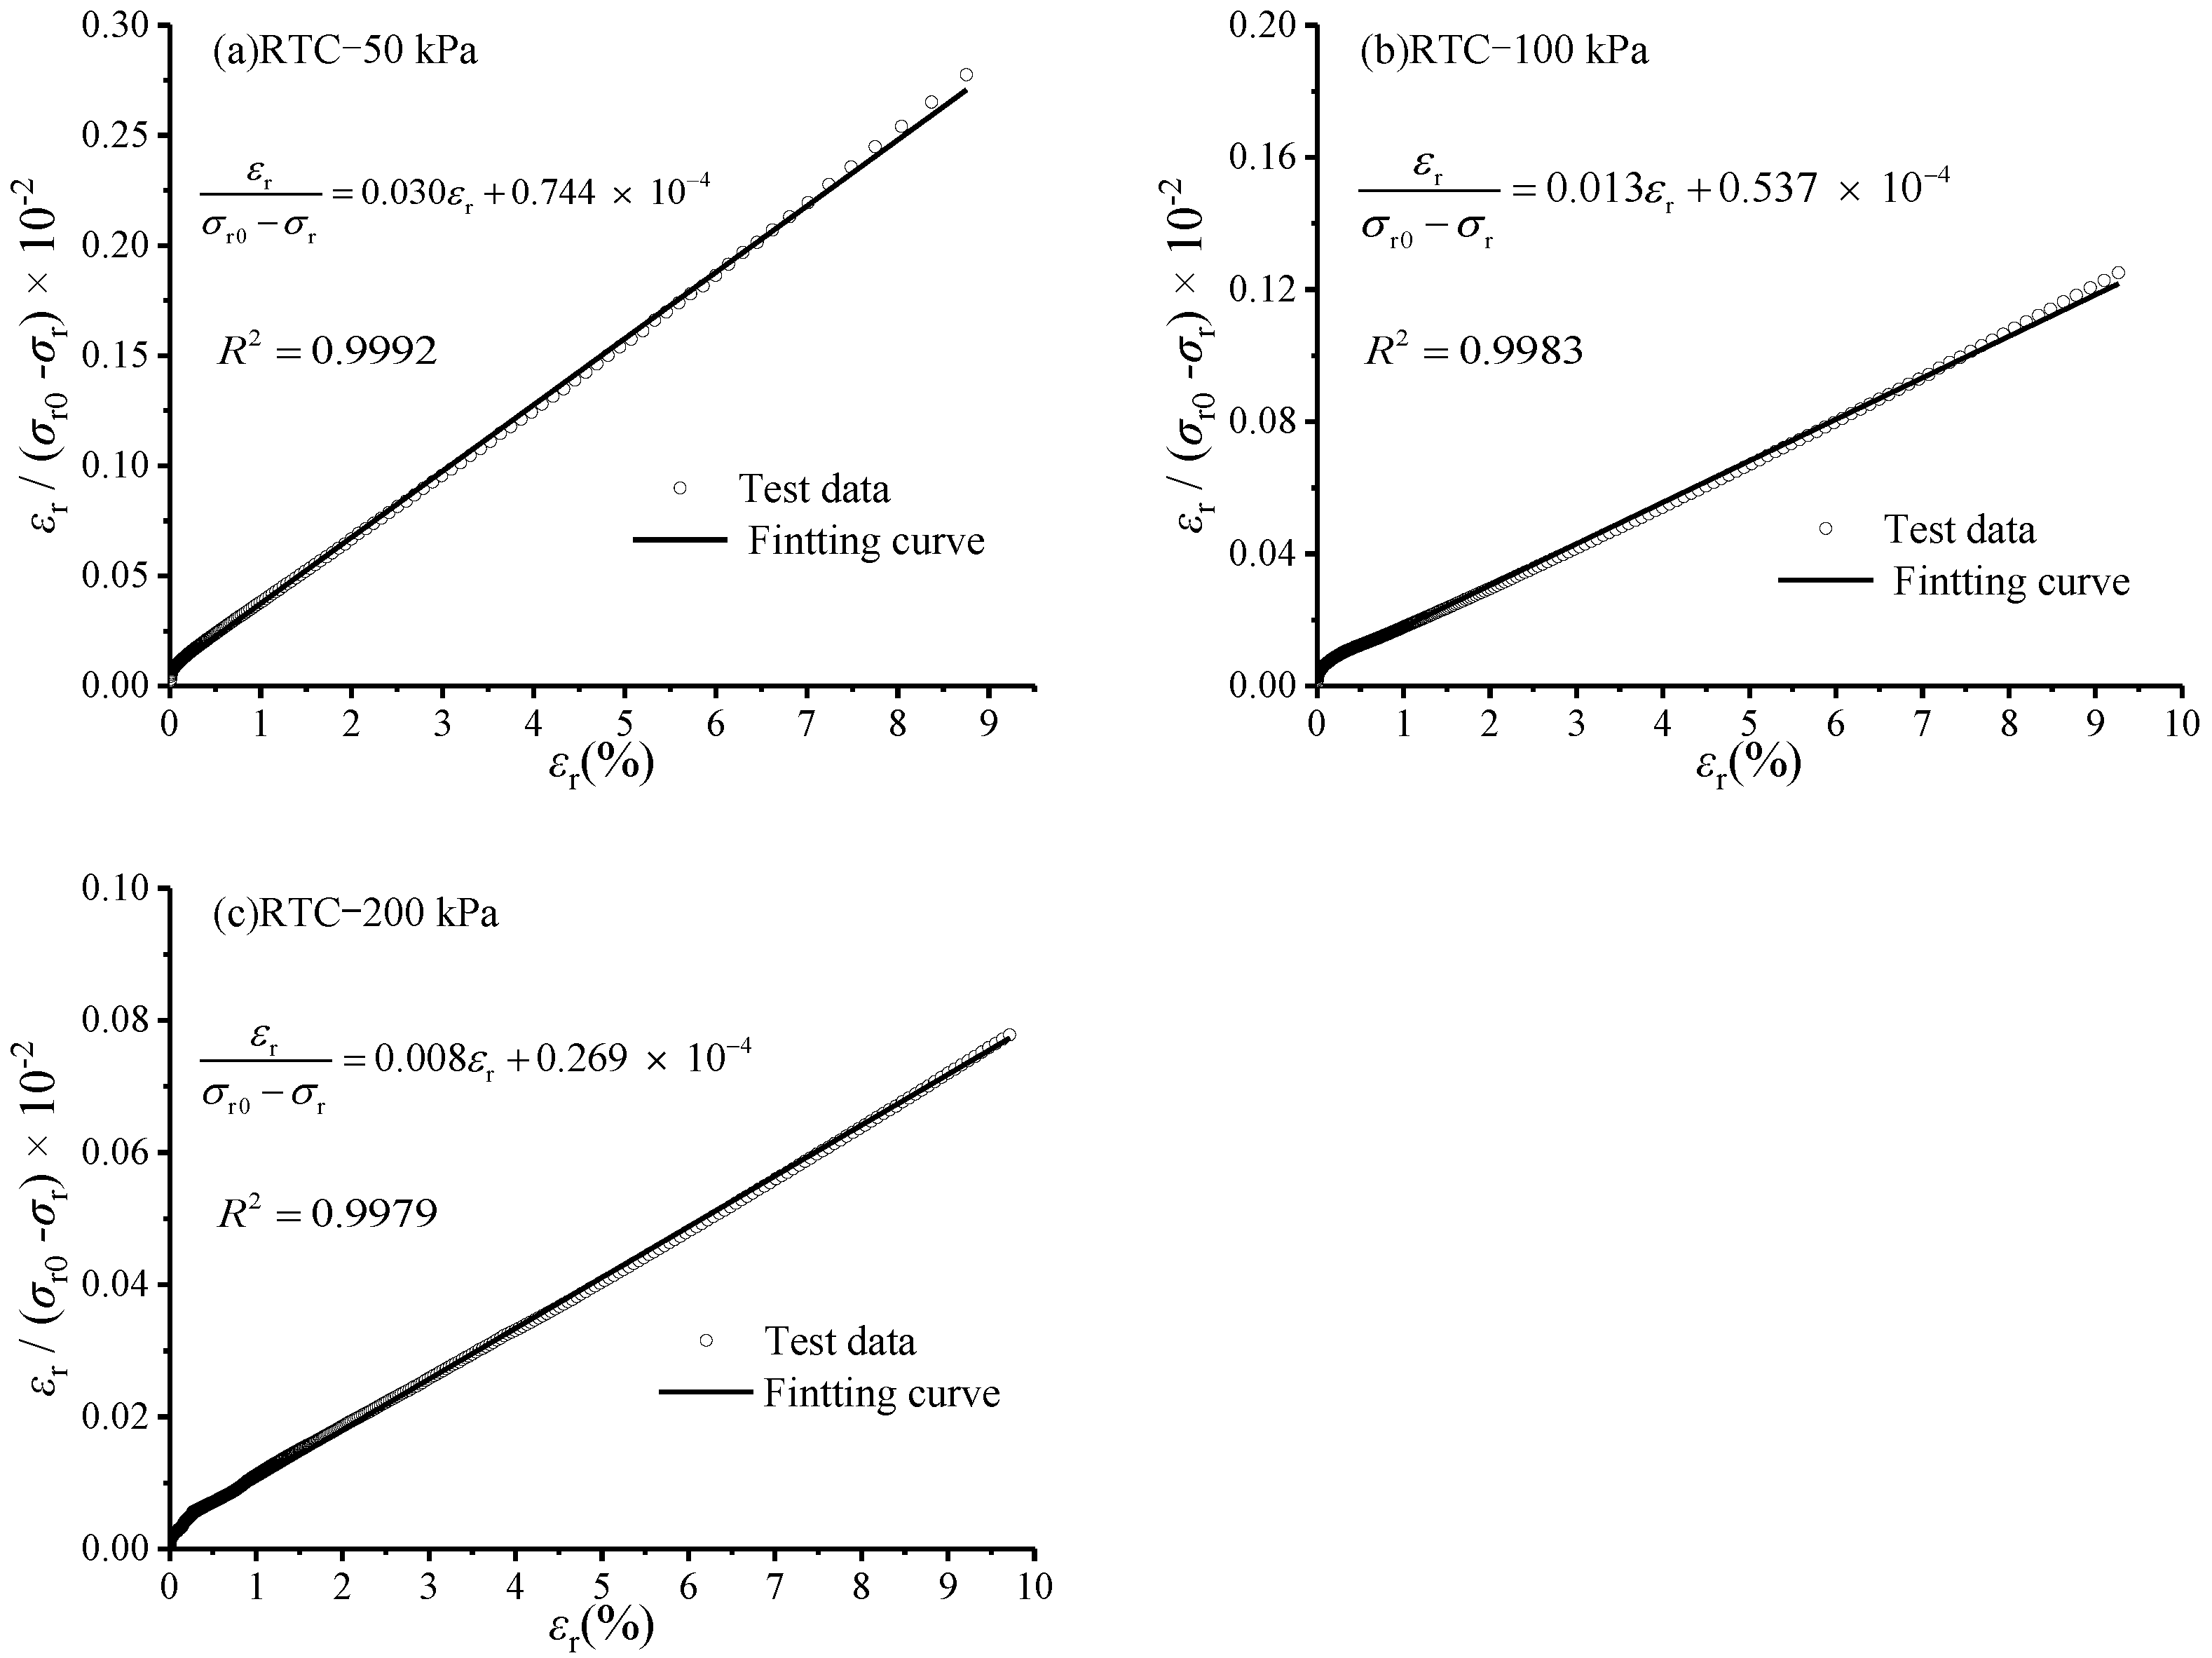
where σr0 is the initial radial stress, σr is the radial stress, and εr is the radial strain. Figure 9a–c shows the linear relationship of the test results processed by Equation (2). The coefficients of determination R2 are both larger than 0.99.
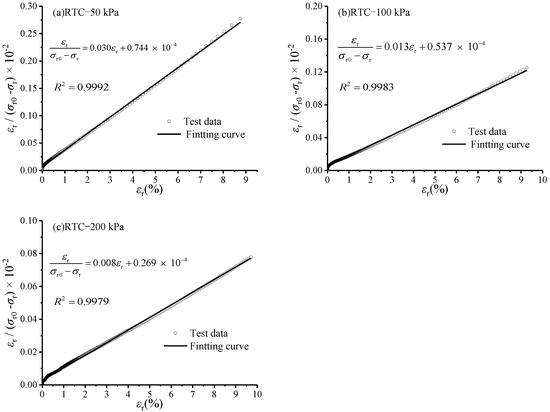
Figure 9.
The relationship between εr/(σr0 − σr) and εr.
The tangential modulus of the nonlinear curve can be obtained as follows:
When εr approaches 0, a is a reciprocal of the initial tangential modulus Ei. The intercepts of the line vary under different initial radial stress values, as shown in Figure 9a–c. According to the suggestion by Janbu [48], Ei can be described as follows:
When εr→∞, b is a reciprocal of the asymptotic value of σr − σr. If the failure ratio Rsf is defined as
then
In this case, the initial radial stress is the static earth pressure σr0 = e0 = K0γz, while the radial stress at failure is the active earth pressure (σr)f = ea. Thus (σr0 − σr)f = e0 − ea.
The expression for the displacement-dependent active earth pressure can be obtained as follows:
2.5. Model Validation
From Equation (7), if the parameters K and n of the initial tangential modulus are determined by the RTC tests, then the earth pressure can be derived from the soil strain of any position. As mentioned earlier, K and n were determined to be 209.94 and 0.73, respectively. The predictions for the radial stress–strain relationship under different initial radial stresses and assuming the failure ratio Rsf = 0.85 [49] are included in Figure 10. As shown in Figure 10, the agreement between the experimentally measured results and the predicted results proves that the proposed model can describe the radial stress–strain relationships well while considering various initial radial stresses.
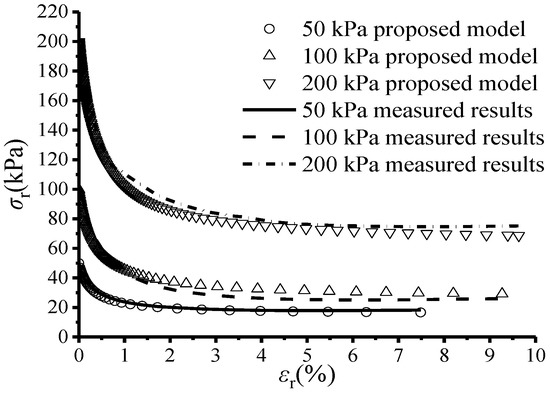
Figure 10.
Comparison between the measured and predicted radial stress–strain relationships.
3. Expression for Displacement-Dependent Active Earth Pressure
3.1. Soil Strain Distribution
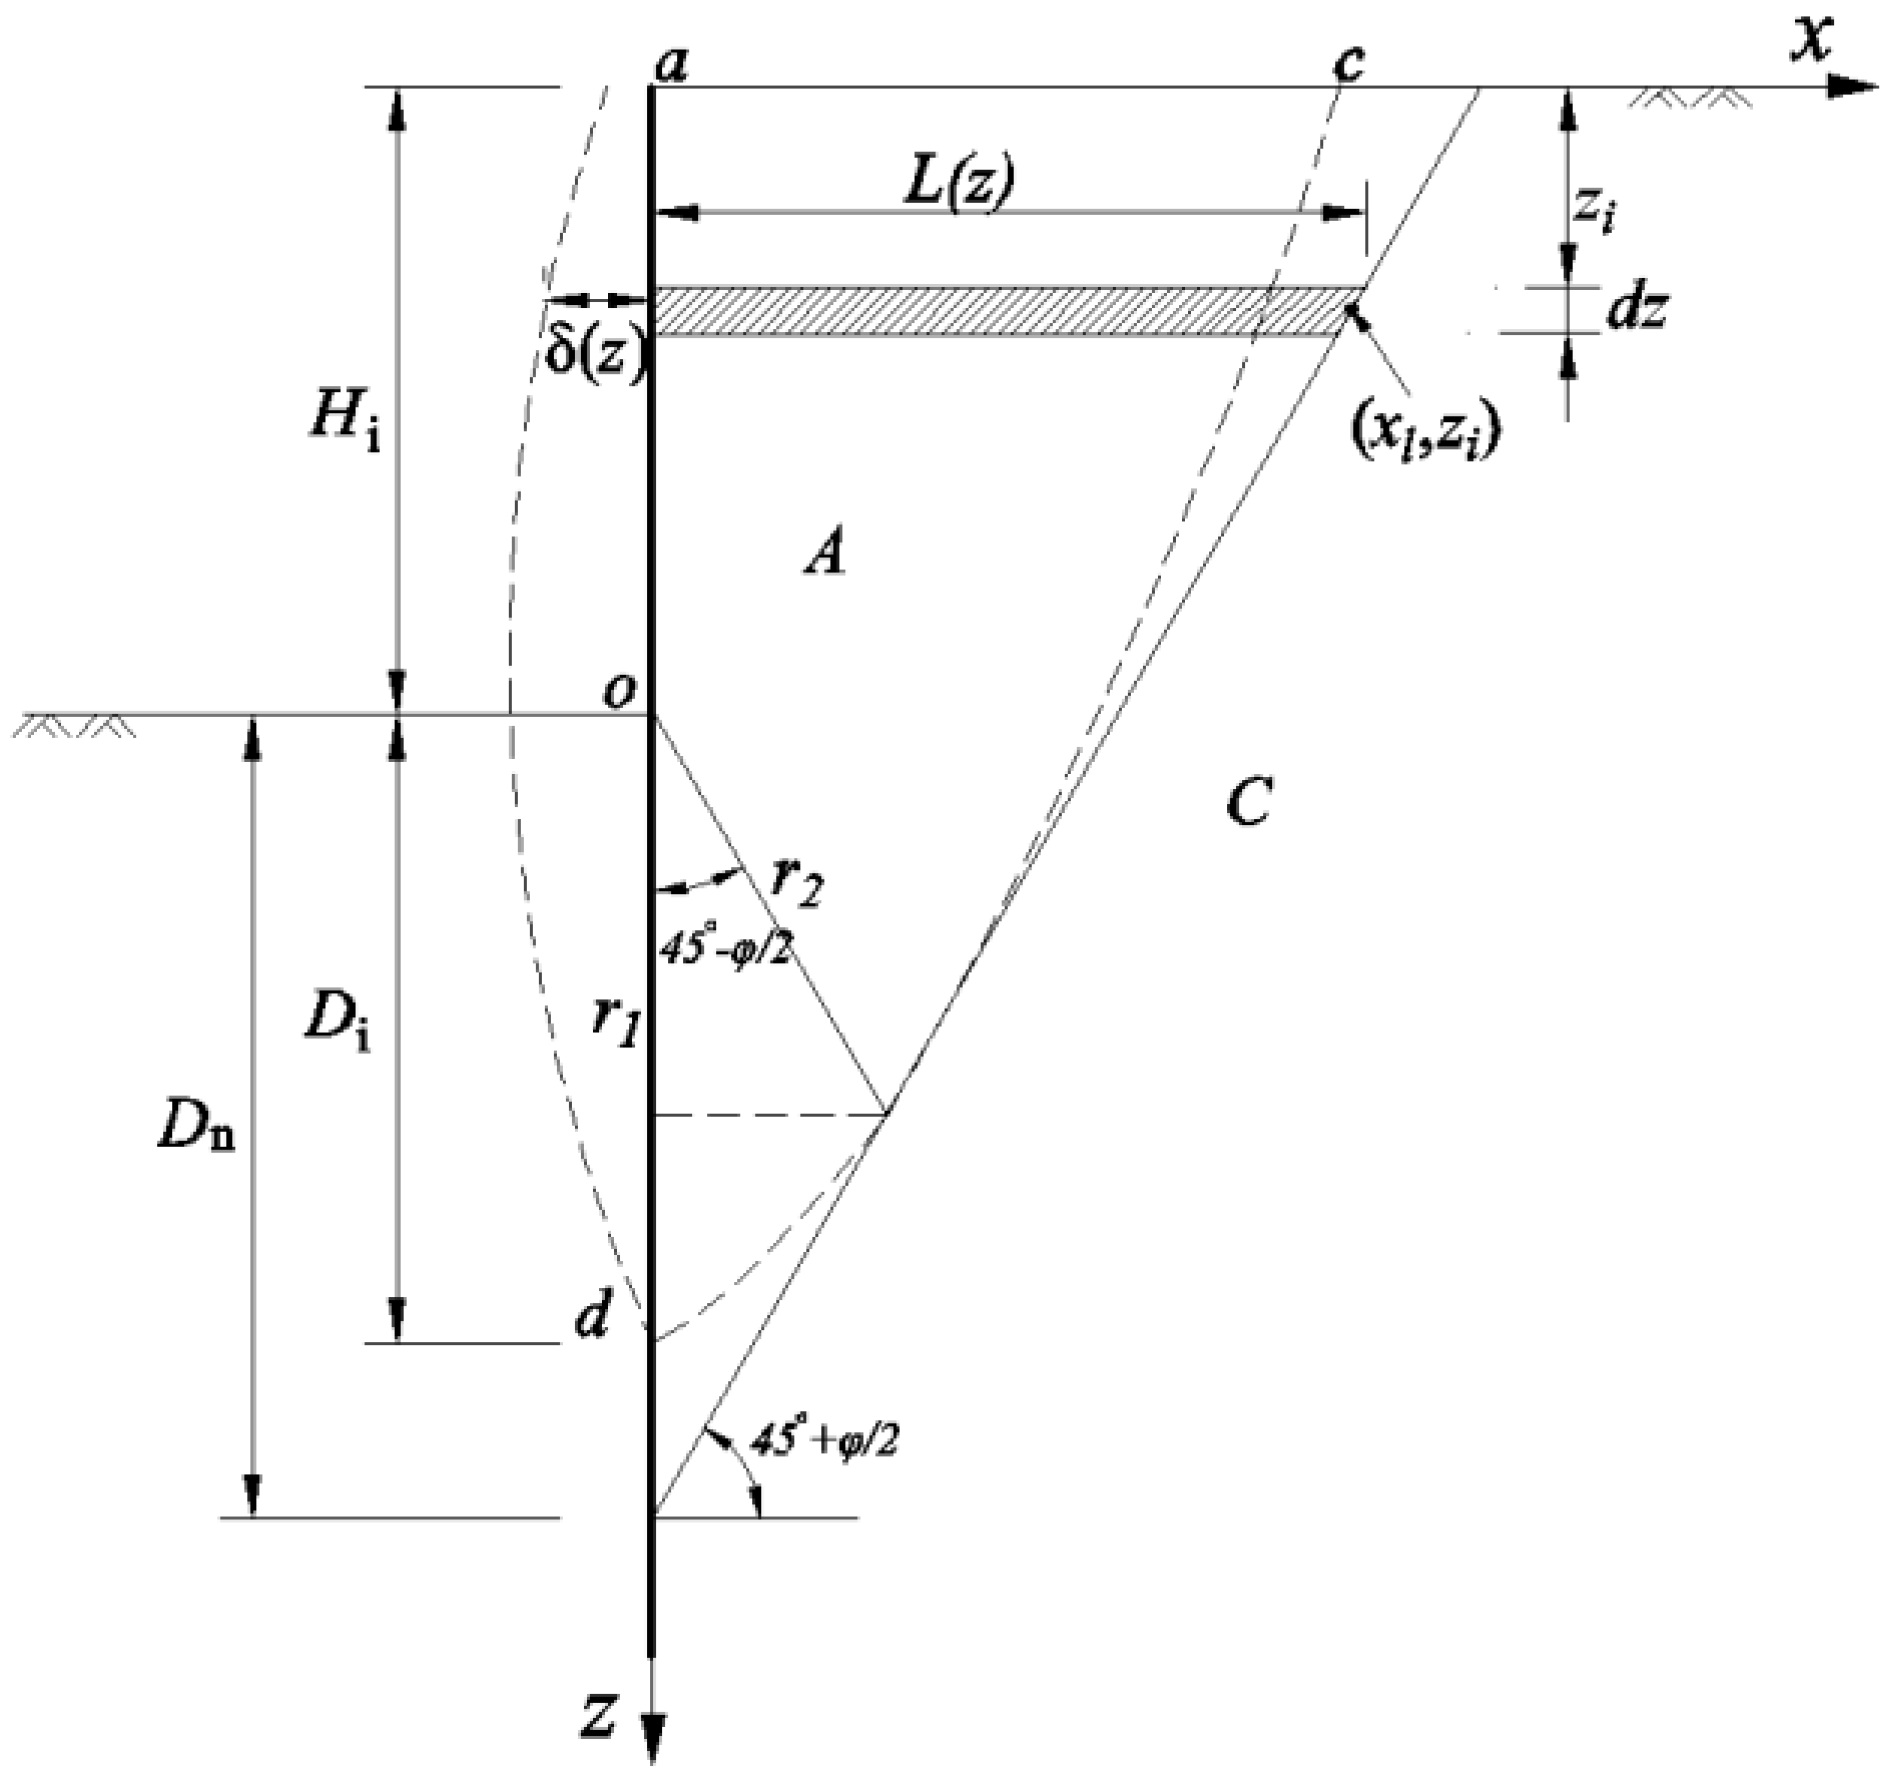
Based on the deformation compatibility between a supporting structure and the surrounding soil, the soil strain behind a wall will change with structural deformation during an excavation. In practice, measuring soil strain with conventional methods is difficult; therefore, the method for determining the soil strain is a bridge to establish the relationship between deformation and earth pressure. Caspe [50] divided the soil behind retaining walls into the plastic zone, the elastic zone, and the undisturbed zone and took the logarithmic spiral as a separation line [51,52]. simplified the boundary into a straight line, as shown in Figure 11.

Figure 11.
Simplified soil strain distribution.
The horizontal displacement of the supporting structure can be expressed by the following integration:
The width of the disturbed zone, letting L(zi) = l, is determined by
where Hi is the excavation depth and Di is the depth from the pit bottom to the zero displacement point of the supporting structure, i.e., Di = (1~1.2) Hi [52].
In this study, according to the continuity and isotropy hypotheses of the soil, the soil strain distribution in the disturbed area was assumed to be reduced linearly, as follows: ε(x) = a + bx. Introducing the boundary conditions ε(0) = εr and ε(l) = 0, the soil strain on the interaction surface was obtained: εr = ε (0) = 2δ (z)/l. Substituting εr into Equation (7), the displacement-dependent active earth pressure can be written as follows:
The calculation from Equation (11) shows that earth pressure decreases monotonically with an increase in displacement, i.e., deδ/dδ < 0, which is in accordance with the variation in earth pressure with displacement in the active condition.
3.2. Validation of Earth Pressure Prediction
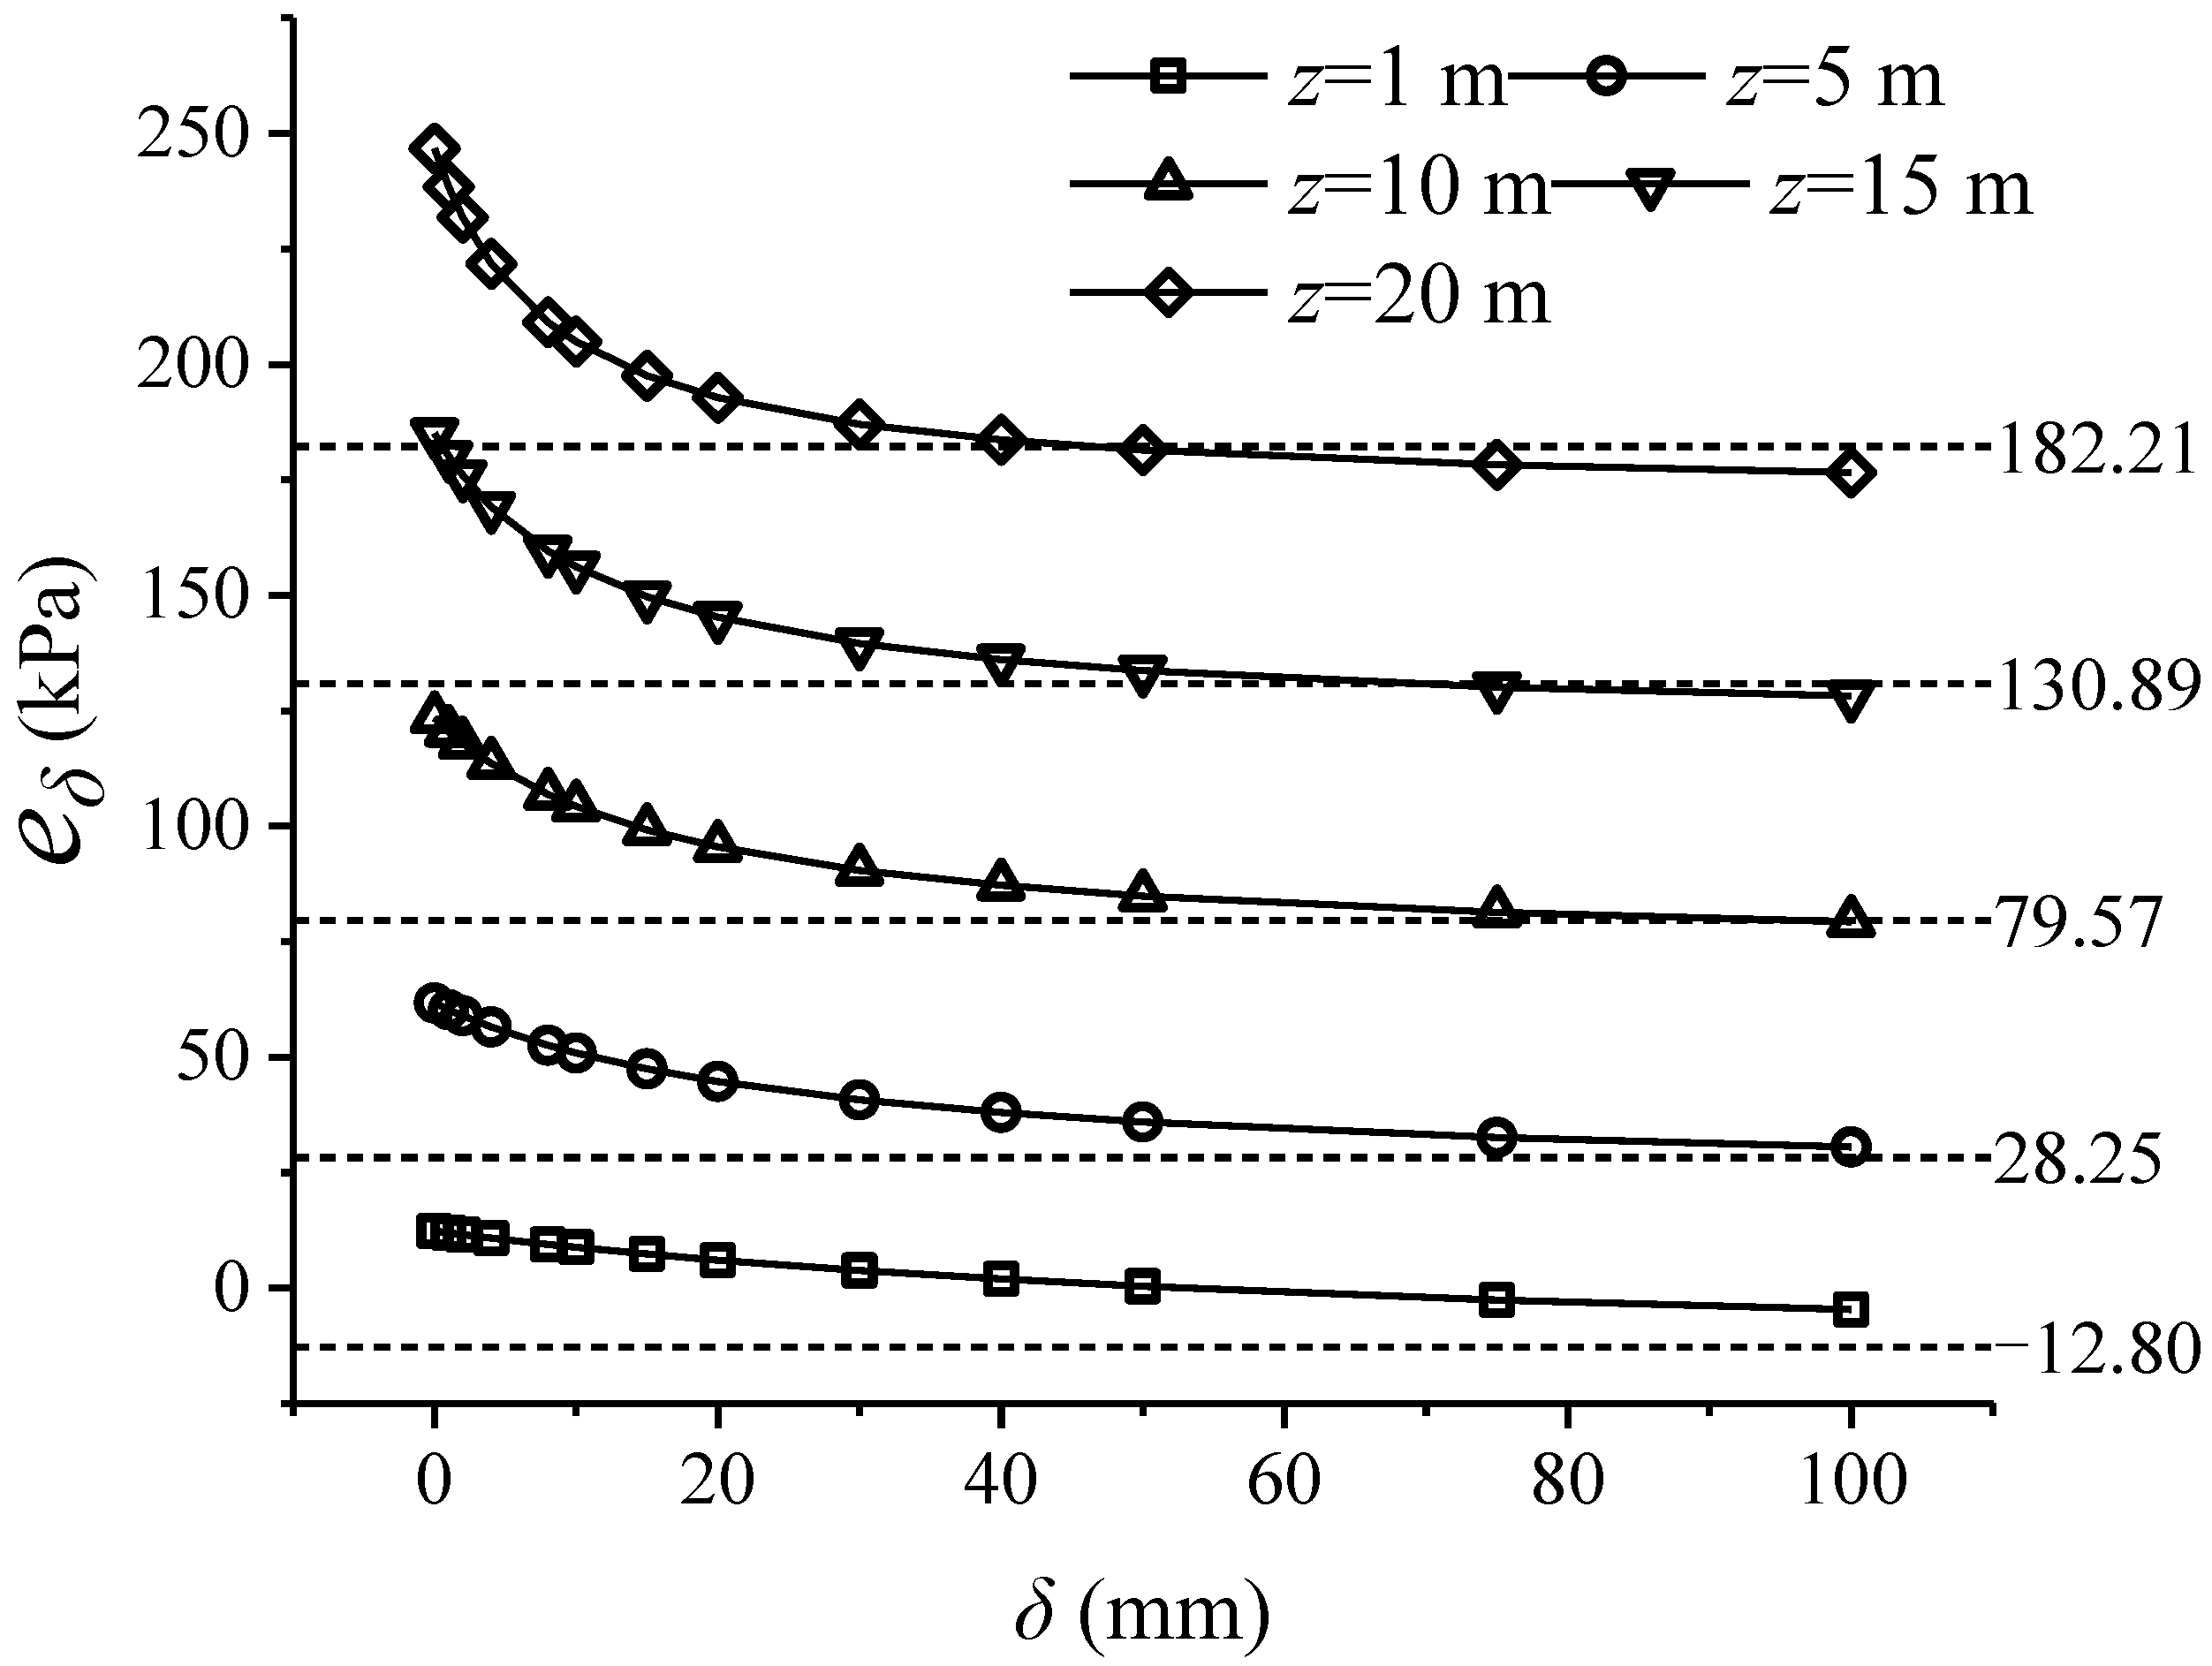
To validate the applicability of the model, an excavation case with homogenous soil was constructed. The final excavation depth was 9.5 m, and the depth of the diaphragm wall was 20 m. The properties of the homogeneous soil were the weighted averages of the values in Table 1: the unit weight was 18.79 kN/m3, the cohesion was 17.07 kPa, and the friction angle was 15.61°. For excavation to the bottom of the pit, the relationship curves between earth pressure and displacement at 1 m, 5 m, 10 m, 15 m, and 20 m below the surface are shown in Figure 12.

Figure 12.
The curves of eδ~δ.
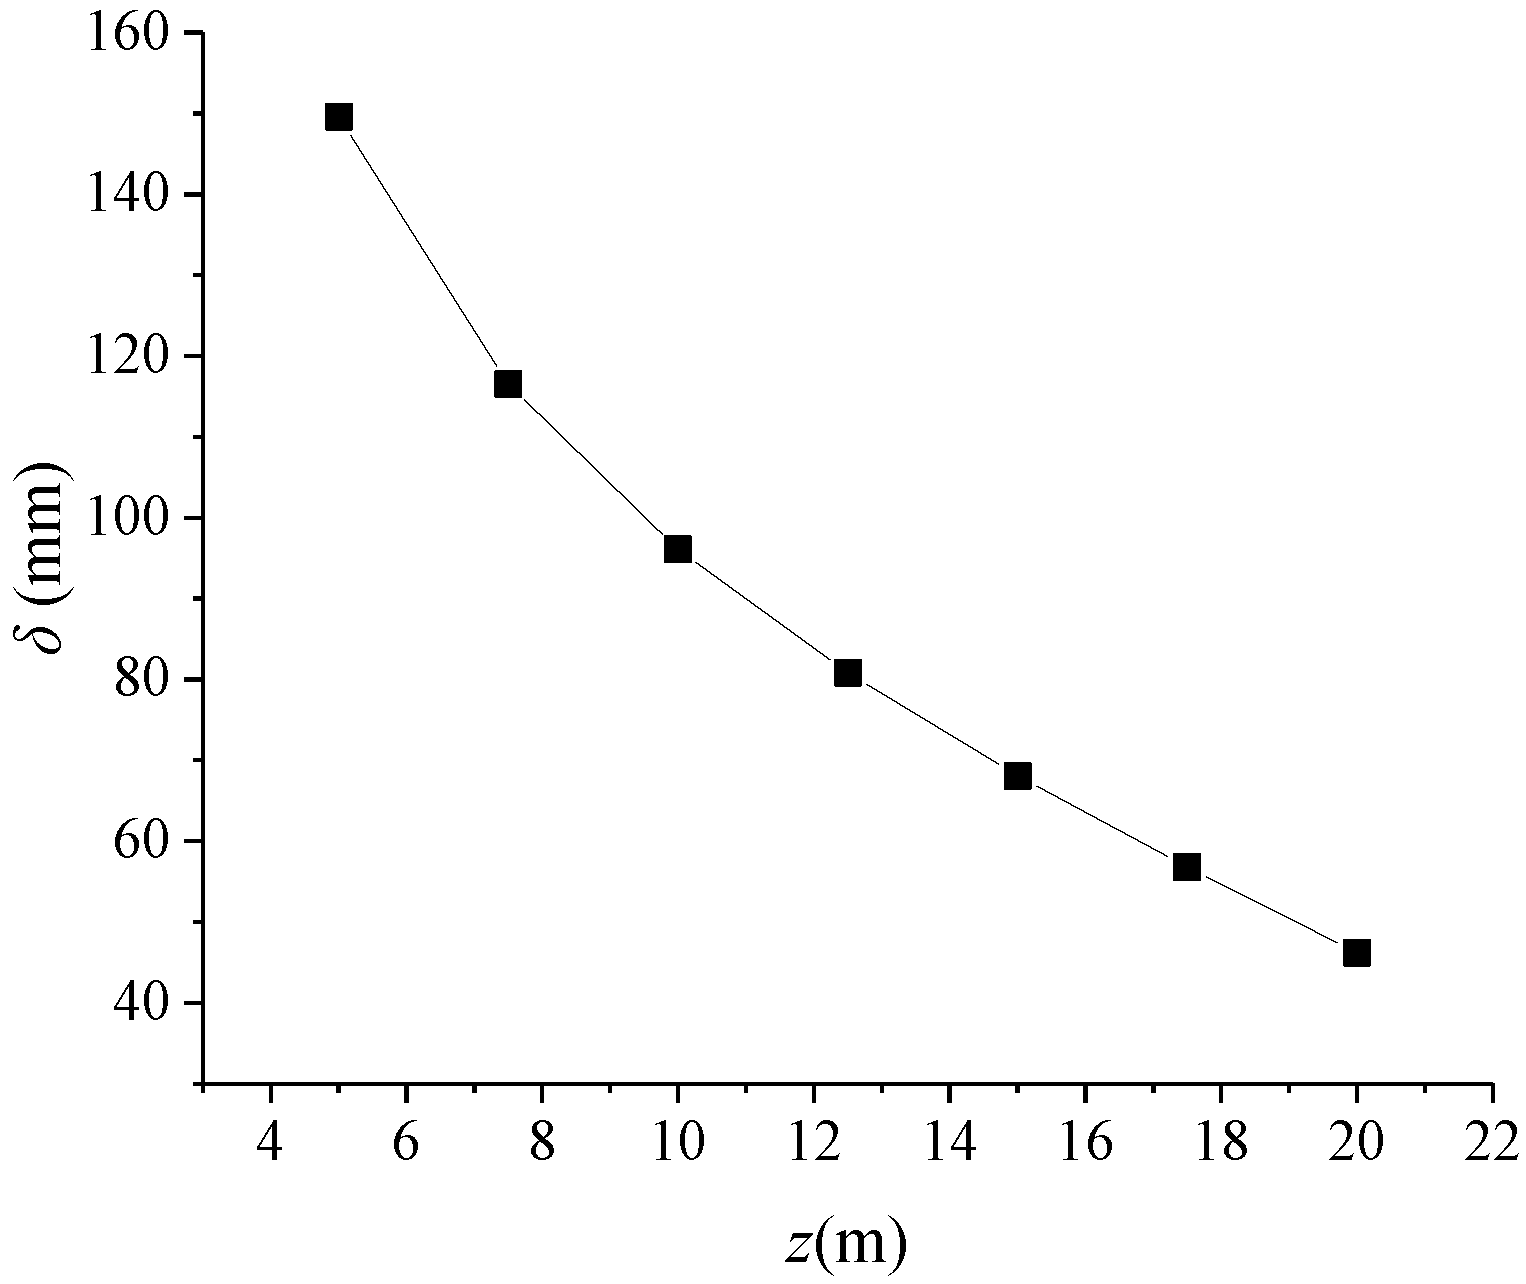
As shown in Figure 12, the soil pressure decreased with increasing displacement at different depths. For the same deformation amount, the deeper the position, the more the soil pressure changed. The earth pressure variations at 1 m and 10 m below the surface were 6.3 kPa and 27.89 kPa, respectively, for the deformation from the resting condition to 20 mm. As the deformation increased, the reduction rate of the earth pressure decreased. For example, 10 m below the surface, the earth pressure decreased by 15.49% and 2.63% for deformation from the resting condition to 10 mm and from 40 mm to 50 mm, respectively. From the curve of the earth pressure at 1 m below the surface, the proposed model can develop a tensile stress area in the cohesion soil; that is, the earth pressure is negative. After 50 mm deformation, the earth pressure at different depths tends to be constant, and approaches the limiting active state. However, the deformation required for Rankine active earth pressure is variable at different depths. Through inversion of Equation (11), the active deformation corresponding to the limiting state at different depths is shown in Figure 13.
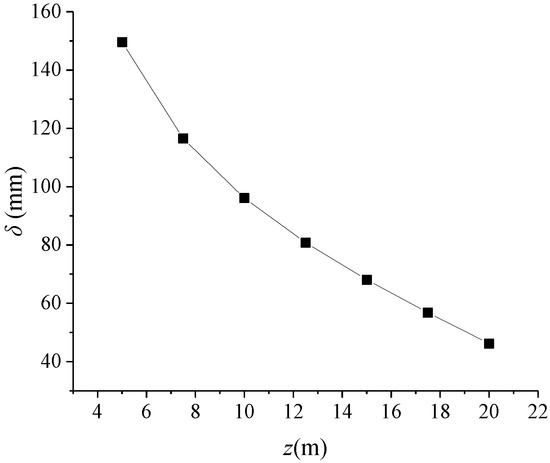
Figure 13.
The movements required to active earth pressure.
The deeper the soil layer, the smaller the deformation that corresponds to the limiting active earth pressure. In this case, the deformation required for fully active earth pressure near the excavation surface was 100 mm, while the required deformations were 150 mm and 46 mm at 5 m and 20 m below the surface, respectively. In practical deep foundation pit engineering, the allowable deformations controlled in the design and monitoring processes are the maximum lateral deformation of the supports, so it is impossible to reach a fully active earth pressure at the same time; the earth pressure of the support above the excavation surface should be greater than the active limiting value. This is based on the assumption that the support deflection mode is the quadratic parabola and that maximum deformation occurs at the excavation surface. If the active earth pressure behind the wall at the bottom of the pit reached the limiting value, then the earth pressure at 5 m below the surface would be 16.46% more than the Rankine active earth pressure, while the earth pressure at 15 m below the surface would have already reached the limiting value.
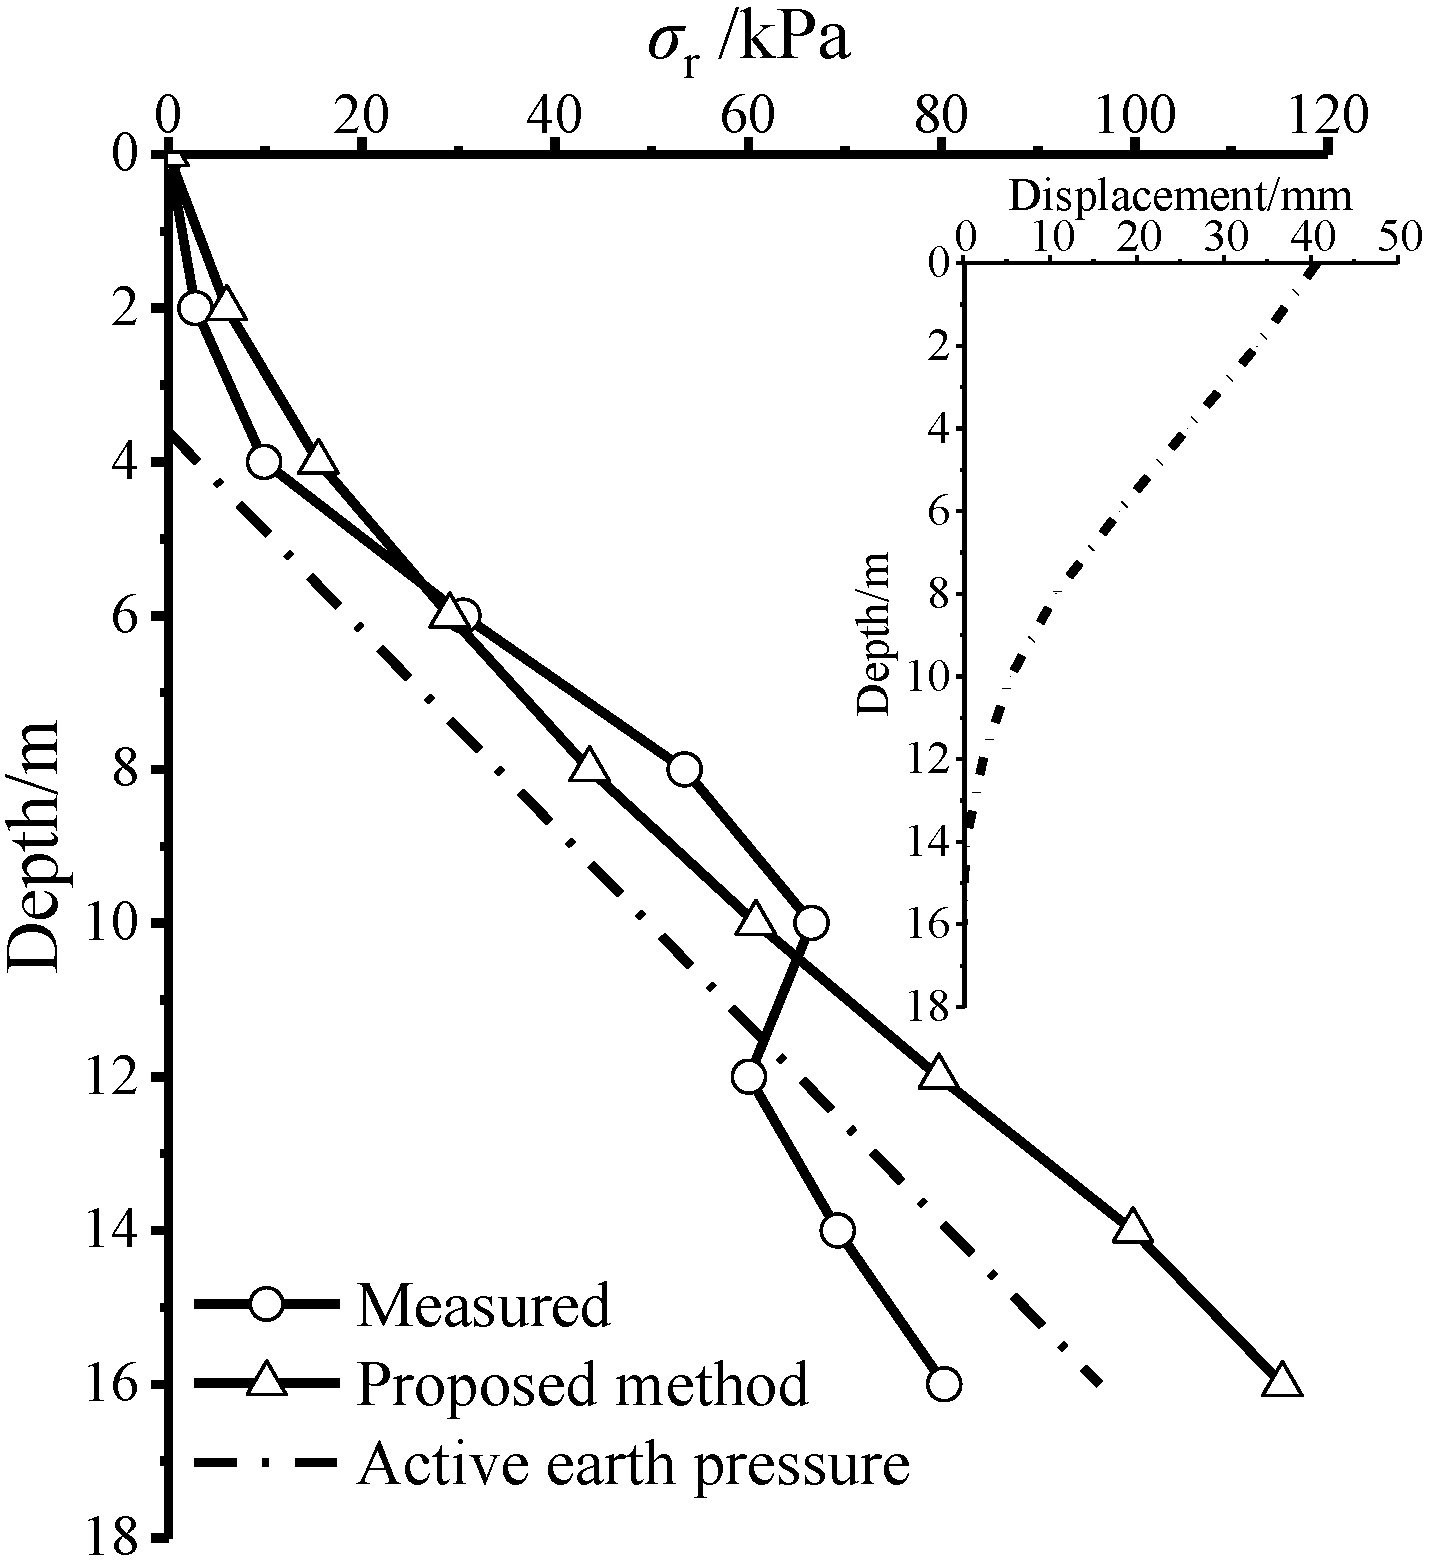
In order to verify the proposed model, two cases with similar soil characteristics were selected from the published literature. A centrifuge model test was reported by Xu et al. [53] for a 38 m deep, multi-strutted, soft ground foundation pit. The test included constant centrifugal acceleration of 120× g, the height of the model wall was 542 mm, and the excavation depth in stage 9 was 316 mm. The unit weight, the cohesion and the friction angle of the soft clay were 17.3 kN/m3, 19 kPa, and 20.1° respectively. The unit weight of the sand was 19.5 kN/m3 and the friction angle was 26.9°. The measured earth pressures were compared with the predictions under different test displacements, as shown in Figure 14. The measured earth pressures showed that the soil was under compression within 10~30 m depth, while the lateral wall moved towards the pit according to the measured displacements. The proposed method was based on the Rankine pressure theory, so the soil arching effect caused by the interaction between the supporting structure and the soil mass was neglected. The error of the prediction results from the arching effect, which the measured that earth pressure was larger than the prediction above the pit bottom. Aside from this, the proposed model provided a good prediction of earth pressure. The nonlinearity of the active earth pressure distribution can be described well using the proposed model.
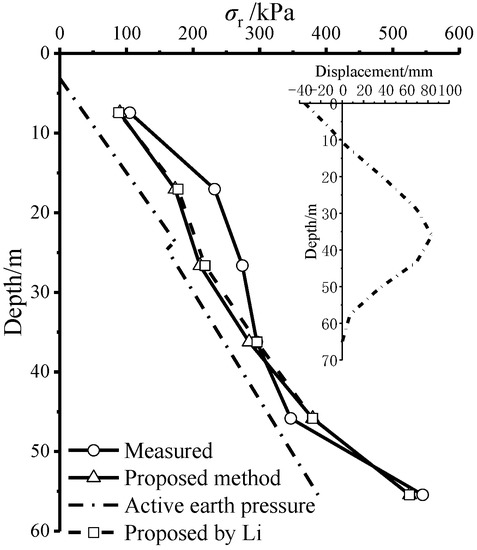
Figure 14.
Comparison between predicted earth pressures and the experimental results by Xu et al. [53].
The proposed model was also verified by the full-scale test carried out by Sheng [54]. For simplicity, the weighted average soil parameters were calculated with respect to the soil layer thickness. Figure 15 shows that the predicted earth pressures from the proposed model were in good agreement with the results measured during the last excavation. Unfortunately, the phenomenon that the earth pressure decreased sharply at the bottom of the wall, where the displacement was close to zero, was unreasonable. In contrast with Case 1, the soil arching effect of the cantilever excavation without the support constraint is minimal, and the predicted earth pressures of the cantilever excavation match the measurements well.

Figure 15.
Comparison between the predicted earth pressures and the experimental results by Sheng [54] According to the analyses, the proposed earth pressure model, which considers displacement, can predict both nonlinear distribution and magnitude. In practice, these results are significant for predicting earth pressure while accounting for support deformation based on the RTC triaxial test.
3.3. Illustrative Example
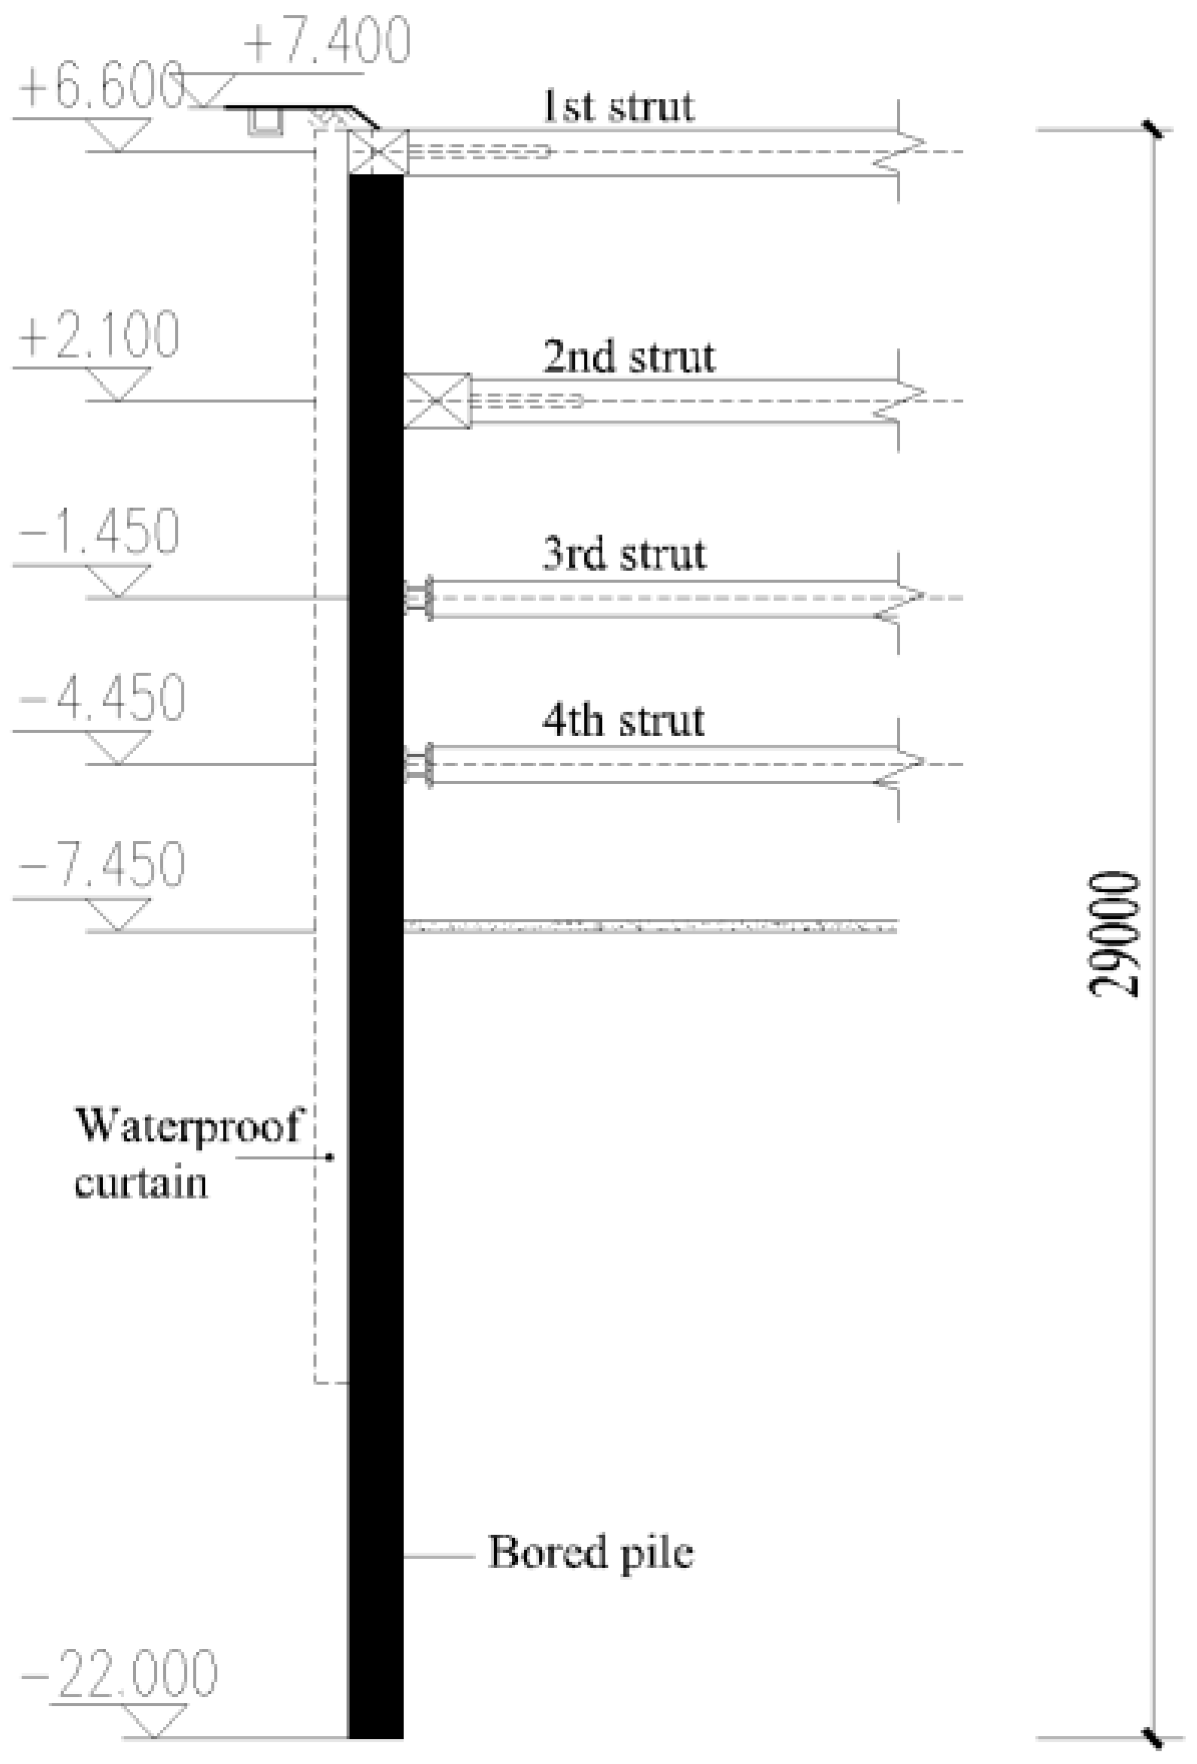
A further illustrative study was conducted on an excavation with a width of 50 m and depth of 14.85 m. Therein, 29 m deep bored piles and four levels of struts were adopted as support structures. The unit weight was 18.79 kN/m3, the cohesion was 17.07 kPa, and the friction angle was 15.61°; other details are shown in Figure 16.

Figure 16.
Cross section of the deep excavation.
The internal forces of support structure were calculated using the vertical elastic foundation beam method. According to the simplified method of deformation prediction for excavations [55], the maximum lateral deformation of the support was 36.05 mm, and the deformation at the surface and the support end were 1.80 mm and 3.60 mm, respectively. The earth pressure on support can obtained by the proposed model. According to JGJ120, parameters required for the design are listed in Table 3. The stiffness of soil springs was calculated by , where m is horizontal foundation coefficient, yi is the depth of the soil spring, and h is the excavation depth.
Table 3.
Design parameters.
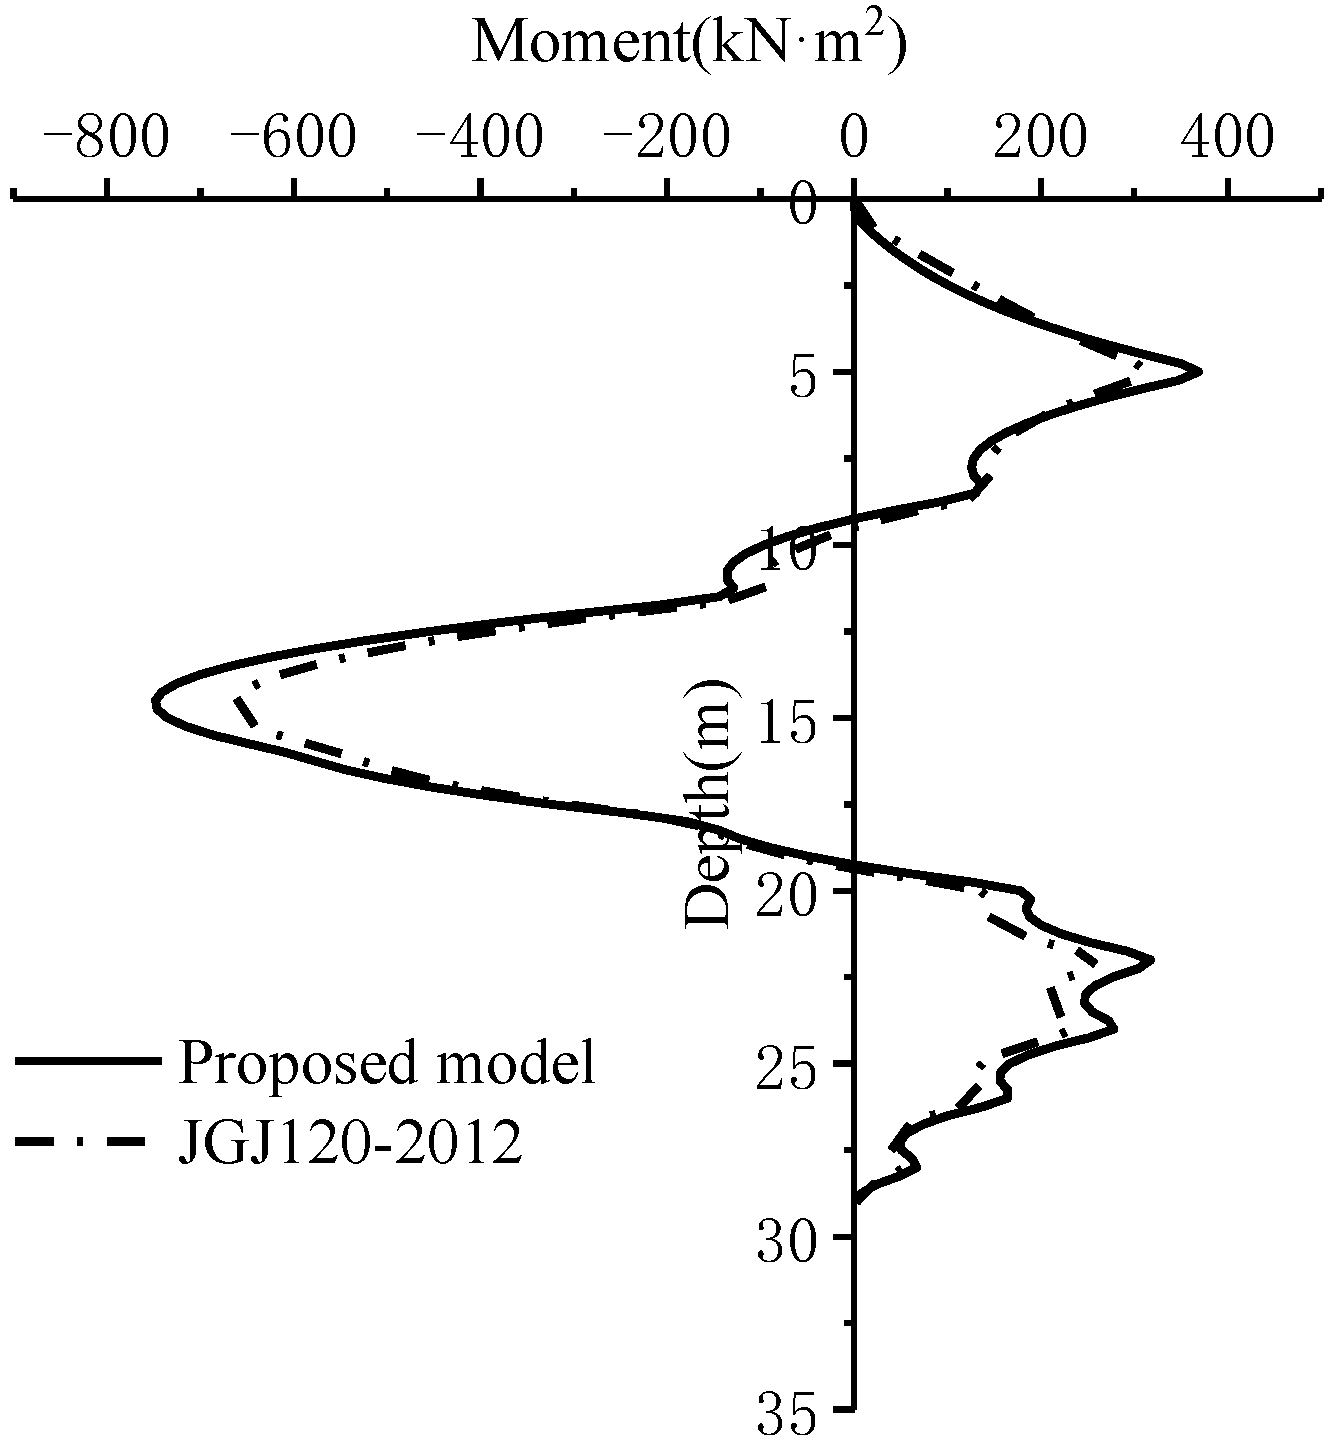
The calculation was implemented using ABAQUS, and the nonlinear earth pressure was conducted by the Dload subroutine. The internal forces obtained from the proposed model were compared with the results calculated from the Rankine active pressure based on JGJ120, as shown in Figure 17 and Figure 18. From the figures, the shear force and bending moment calculated by existing engineering design guidelines are both less than the present method, where the maximum differences of the bending moment and shear force between the two methods are 11.31% and 11.48%, respectively. Thus, the existing design guidelines are unsafe for foundation pit engineering. This issue can be resolved by the proposed method in this study.

Figure 17.
Bending moment diagram.
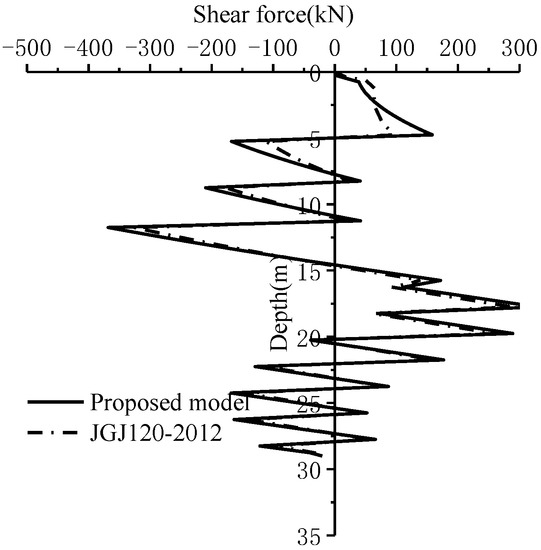
Figure 18.
Shear force diagram.
4. Conclusions
In this paper, a method for calculating the displacement-dependent active earth pressure of flexible support structures in deep foundation pit engineering was investigated. The following conclusions were drawn from the work:
- (1)
- Based on the analysis of the lateral unloading stress path triaxial test results, a hyperbolic model was proposed. The comparison between the predictions and test results showed that the proposed model can successfully estimate the radial stress from the soil strain for soft clay under various initial radial stresses.
- (2)
- According to a basic hypothesis of the soil, a simplified soil strain distribution assumption was applied to allow for the proposal of a displacement-dependent active earth pressure model. The proposed model was validated by comparison with the experimental results, showing it to be a valid model for estimating the magnitude and distribution of active earth pressure, with a consideration of the displacement of the supporting structure. More work needs to be performed given that the prediction deviation resulting from the model reflected a neglect in the interaction between the support structures and the soil mass.
- (3)
- Through an inversion of the proposed model, we confirmed that the earth pressure along the entire depth of the wall could not achieve the active condition simultaneously. This confirmed the validity of our calculation of displacement-dependent active earth pressure for deep excavations. The assumption that the required magnitude of movement of the entire soil in the fully active condition is 1% of the excavation depth is not suitable for a multi-strutted, soft-ground foundation pit; however, this assumption may be reasonable for the retaining walls rotating around the bottom.
- (4)
- The present experimental work is limited to the Nanjing floodplain muddy clay. For more generalizable conclusions, further exploration should be carried out for other soils.
Author Contributions
Conceptualization, N.L. and W.L.; methodology, N.L. and J.Z.; software, N.L. and J.Z.; validation, N.L. and W.L.; formal analysis, N.L. and S.Z.; investigation, N.L. and J.Z.; resources, N.L. and J.Z.; data curation, N.L., S.Z. and J.Z.; writing—original draft preparation, N.L.; writing—review and editing, N.L.; visualization, N.L.; supervision, W.L.; project administration, W.L.; funding acquisition, W.L. All authors have read and agreed to the published version of the manuscript.
Funding
National Natural Science Foundation of China: 51778143; Priority Academic Program Development of Jiangsu Higher Education Institutions: CE02-1-51.
Institutional Review Board Statement
Not applicable.
Informed Consent Statement
Not applicable.
Data Availability Statement
Not applicable.
Conflicts of Interest
The authors declare no conflict of interest.
References
- DG/TJ 08-6l-2018; Technical Code for Excavation Engineering. Tongji University Press: Shanghai, China, 2018.
- DB33/T 1096-2014; Technical Specification for Building Foundation Excavation Engineering. Zhejiang Gongshang University Press: Hangzhou, China, 2014.
- Clough, G.; Duncan, J.W. Earth Pressures, Chapter 6, Foundation Engineering Handbook; Fang, H.-Y., Ed.; Springer: New York, NY, USA, 1991; pp. 223–235. [Google Scholar]
- Becker, D.E.; Moore, I.D. Canadian Foundation Engineering Manual; Canadian Geotechnical Society: Alliston, Canada, 2006; p. 396. [Google Scholar]
- Yue, Z.; Peng, Y.; Zhang, S. The centrifugal model test of compacted cohesive fill Earth pressure on retaining wall. Chin. J. Geotech. Eng. 1992, 6, 90–96. (In Chinese) [Google Scholar]
- Ou, C.-Y.; Liao, J.-T.; Lin, H.-D. Performance of Diaphragm Wall Constructed Using Top-Down Method. J. Geotech. Geoenviron. Eng. 1998, 124, 798–808. [Google Scholar] [CrossRef]
- Tan, Y.; Wang, D. Characteristics of a Large-Scale Deep Foundation Pit Excavated by the Central-Island Technique in Shanghai Soft Clay. II: Top-Down Construction of the Peripheral Rectangular Pit. J. Geotech. Geoenviron. Eng. 2013, 139, 1894–1910. [Google Scholar] [CrossRef]
- Jayatheja, M.; GuhaRay, A. Earth Pressures on Retaining Walls backfilled with Red Soil admixed with Building Derived Materials under Rotational Failure mode. Géoméch. Geoengin. 2021, 17, 1011–1021. [Google Scholar] [CrossRef]
- Rui, R.; Ye, Y.-Q.; Han, J.; Zhang, L.; Zhai, Y.-X. Experimental and Theoretical Investigations on Active Earth Pressure Distributions behind Rigid Retaining Walls with Narrow Backfill under a Translational Mode. Int. J. Géoméch. 2020, 20, 04020178. [Google Scholar] [CrossRef]
- Fang, Y.S.; Ishibashi, I. Static earth pressures with various wall movements. J. Geotech. Eng. 1986, 112, 317–333. [Google Scholar] [CrossRef]
- Bang, S. Active Earth Pressure Behind Retaining Walls. J. Geotech. Eng. 1985, 111, 407–412. [Google Scholar] [CrossRef]
- Chang, M.F. Lateral earth pressures behind rotating walls. Can. Geotech. J. 1997, 34, 498–509. [Google Scholar] [CrossRef]
- Lu, K.; Yang, Y. Preliminary study of active earth pressure under nonlimit state. Rock Soil Mech. 2010, 31, 615–619. (In Chinese) [Google Scholar]
- Lu, K.; Yang, Y. Approximate calculation method of active earth pressure considering displacement. Rock Soil Mech. 2009, 30, 553–557. [Google Scholar]
- Xu, R.Q.; Liao, B.; Wu, J.; Chang, S. Computational method for active earth pressure of cohesive soil under nonlimit state. Rock Soil Mech. 2013, 34, 148–154. (In Chinese) [Google Scholar]
- Yang, T.; He, H. Displacement-earth pressure theory for cohesive soil based on shear strength reduction. Rock Soil Mech. 2009, 30, 185–188. [Google Scholar]
- Zhu, J.-F.; Xu, R.-Q.; Li, X.-R.; Chen, Y.-K. Calculation of earth pressure based on disturbed state concept theory. J. Cent. South Univ. Technol. 2011, 18, 1240–1247. [Google Scholar] [CrossRef]
- Liu, G.; Wang, W. Foundation Engineering Handbook; China Architecture & Building Press: Beijing, China, 2009. [Google Scholar]
- Mei, G.; Chen, Q.; Song, L. Model for predicting displacement-dependent lateral earth pressure. Can. Geotech. J. 2009, 46, 969–975. [Google Scholar] [CrossRef]
- Ni, P.; Mangalathu, S.; Song, L.; Mei, G.; Zhao, Y. Displacement-Dependent Lateral Earth Pressure Models. J. Eng. Mech. 2018, 144, 04018032. [Google Scholar] [CrossRef]
- Chen, Y.K.; Xu, R.Q.; Yang, X.J.; Gong, X.N. A New Method Calculating Earth Pressure on Flexible Structures for Excavation Work. Ind. Constr. 2001, 31, 1–4. (In Chinese) [Google Scholar]
- Zhang, W.; Li, N. The Method of Earth Pressure Calculationunder the State of Unlimited Equilibrium. J. QingHai Univ. 1999, 17, 8–11+46. (In Chinese) [Google Scholar]
- Zhang, W.; Tian, J.; Wang, B.T. Relationship between earth pressure on support structure of foundation pits and displacement of earth mass. J. Hohai Univ. (Nat. Sci.) 2005, 33, 575–579. (In Chinese) [Google Scholar]
- Lu, G.S. A calculation method of earth pressure considering displacement. Rock Soil Mech. 2004, 25, 586–589. (In Chinese) [Google Scholar]
- Zhang, J.-M.; Shamoto, Y.; Tokimatsu, K. Evaluation of Earth Pressure Under Any Lateral Deformation. Soils Found. 1998, 38, 15–33. [Google Scholar] [CrossRef] [Green Version]
- Mei, G.-X.; Chen, R.; Liu, J. New Insight into Developing Mathematical Models for Predicting Deformation-Dependent Lateral Earth Pressure. Int. J. Géoméch. 2017, 17, 06017003. [Google Scholar] [CrossRef]
- Tang, Y.; Li, J.P.; Ma, Y. Lateral Earth Pressure Considering the Displacement of a Rigid Retaining Wall. Int. J. Géoméch. 2018, 18, 06018031. [Google Scholar] [CrossRef]
- Milligan, G.W.E. Soil deformations near anchored sheet-pile walls. Géotechnique 1983, 33, 41–55. [Google Scholar] [CrossRef]
- Lu, P.Y.; Yan, C.; Liu, R. Research on distribution of earth pressure of clay obtained from model test in laboratory. J. Build. Struct. 2002, 23, 83–86. (In Chinese) [Google Scholar] [CrossRef]
- Ertugrul, O.L.; Trandafir, A.C. Lateral earth pressures on flexible cantilever retaining walls with deformable geofoam inclusions. Eng. Geol. 2013, 158, 23–33. [Google Scholar] [CrossRef]
- Conte, E.; Pugliese, L.; Troncone, A. Earthquake-induced permanent displacements of embedded cantilever retaining walls. Géotechnique 2022, 72, 1–10. [Google Scholar] [CrossRef]
- Li, J.P.; Ma, Y.; Rao, P.P. Calculation of earth pressure against flexible retaining wall considering displacement. Rock Soil Mech. 2012, 33, 2937–2941. [Google Scholar]
- Ying, H.W.; Cai, Q.P. Distribution of active earth pressure against flexible retaining walls with drum deformation. Chin. J. Geotech. Eng. 2008, 30, 1805–1810. (In Chinese) [Google Scholar] [CrossRef]
- Ying, H.W.; Zhu, W.; Zheng, B.B.; Wang, X.G. Calculation and distribution of active earth pressure against flexible retaining walls. Chin. J. Geotech. Eng. 2014, 36, 1–6. (In Chinese) [Google Scholar] [CrossRef]
- Huang, M.; Liu, X.-R.; Zhang, N.-Y.; Shen, Q.-W. Calculation of foundation pit deformation caused by deep excavation considering influence of loading and unloading. J. Cent. South Univ. 2017, 24, 2164–2171. [Google Scholar] [CrossRef]
- Ji, X.; Ni, P.; Barla, M.; Zhao, W.; Mei, G. Earth pressure on shield excavation face for pipe jacking considering arching effect. Tunn. Undergr. Space Technol. 2018, 72, 17–27. [Google Scholar] [CrossRef]
- Ni, P.; Song, L.; Mei, G.; Zhao, Y. On predicting displacement-dependent earth pressure for laterally loaded piles. Soils Found. 2018, 58, 85–96. [Google Scholar] [CrossRef]
- Ni, P.; Mei, G.; Zhao, Y.; Chen, H. Plane strain evaluation of stress paths for supported excavations under lateral loading and unloading. Soils Found. 2018, 58, 146–159. [Google Scholar] [CrossRef]
- Tang, L.; Cong, S.; Xing, W.; Ling, X.; Geng, L.; Nie, Z.; Gan, F. Finite element analysis of lateral earth pressure on sheet pile walls. Eng. Geol. 2018, 244, 146–158. [Google Scholar] [CrossRef]
- Shao, L.T.; Liu, G.; Zeng, F.T.; Guo, X.X. Recognition of the Stress-Strain Curve Based on the Local Deformation Measurement of Soil Specimens in the Triaxial Test. Geotech. Test. J. 2016, 39, 658–672. [Google Scholar] [CrossRef]
- Zeng, F.; Shao, L. Unloading Elastic Behavior of Sand in Cyclic Triaxial Tests. Geotech. Test. J. 2016, 39, 462–475. [Google Scholar] [CrossRef]
- Zhang, R.; Zheng, J.L.; Yang, H.P. Experimental Study on K0 Consolidation Behavior of Recompacted Unsaturated Expansive Soil. In Proceedings of the Geohunan International Conference, Changsha, China, 3–6 August 2009; pp. 27–32. [Google Scholar] [CrossRef]
- Muñoz-Castelblanco, J.; Delage, P.; Pereira, J.-M.; Cui, Y. On-sample water content measurement for a complete local monitoring in triaxial testing of unsaturated soils. Géotechnique 2012, 62, 595–604. [Google Scholar] [CrossRef] [Green Version]
- Santana, T.; Candeias, M. K0 measurement in a sand using back volume change. Soils Rocks 2015, 38, 3–8. [Google Scholar] [CrossRef]
- GB/T 50123-2019; Standard for Geotechnical Testing Method. MOHURD (Ministry of Housing and Urban-Rural Development of the People’s Republic of China): Beijing, China, 2019.
- Esmaeili-Falak, M.; Katebi, H.; Vadiati, M.; Adamowski, J. Predicting Triaxial Compressive Strength and Young’s Modulus of Frozen Sand Using Artificial Intelligence Methods. J. Cold Reg. Eng. 2019, 33, 04019007. [Google Scholar] [CrossRef]
- Esmaeili-Falak, M.; Katebi, H.; Javadi, A.A. Effect of Freezing on Stress–Strain Characteristics of Granular and Cohesive Soils. J. Cold Reg. Eng. 2020, 34. [Google Scholar] [CrossRef]
- Janbu, N. Soil compressibility as determined by oedometer and triaxial tests. In Proceedings of the European Conference on Soil Mechanics and Foundation Engineering, Wiesbaden, Germany, 15–18 October 1963; pp. 19–25. [Google Scholar]
- Duncan, J.M.; Chang, C.-Y. Nonlinear Analysis of Stress and Strain in Soils. J. Soil Mech. Found. Div. 1970, 96, 1629–1653. [Google Scholar] [CrossRef]
- Caspe, M.S. Surface settlement adjacent to braced open cuts. J. Soil Mech. Found. Eng. 1966, 92, 51–59. [Google Scholar] [CrossRef]
- Liu, X.; Yi, D.; Shi, Z. Theoretical analysis of surface settlement during excavation. China Civ. Eng. J. 2000, 33, 51–55. (In Chinese) [Google Scholar] [CrossRef]
- Li, B.; Zhao, X.H. A nonlinear earth pressure method for deep excavation considering deformation of retaining wall. Rock Soil Mech. 2004, 25, 453–458. (In Chinese) [Google Scholar] [CrossRef]
- Xu, Q.W.; Ma, X.F.; Zhu, H.H.; Ding, W. Centrifugal model test on extra-deep foundation pit excavations in soft ground. China Civ. Eng. J. 2009, 42, 154–161. (In Chinese) [Google Scholar]
- Sheng, Z.Q. Experimental Study on Engineering Properties of Foundation Soil Related to Excavation Progress. Ph.D. Thesis, China Academy of Building Research, Beijing, China, 2016. (In Chinese). [Google Scholar]
- Wang, W.D.; Wang, H.R.; Xu, Z.H. Simplified method of deformation prediction for excavations retained by embedded walls in Shanghai soft soil. Chin. J. Geotech. Eng. 2012, 34, 1792–1800. [Google Scholar]


Publisher’s Note: MDPI stays neutral with regard to jurisdictional claims in published maps and institutional affiliations. |
© 2022 by the authors. Licensee MDPI, Basel, Switzerland. This article is an open access article distributed under the terms and conditions of the Creative Commons Attribution (CC BY) license (https://creativecommons.org/licenses/by/4.0/).