Article

Analysis of Train Car-Body Comfort Zonal Distribution by Random Vibration Method

1
School of Civil Engineering, Beijing Jiaotong University, Beijing 100044, China
2
Bridge and Tunnels Department, Russian University of Transport, 127994 Moscow, Russia
*
Author to whom correspondence should be addressed.
Appl. Sci. 2022, 12(15), 7442; https://doi.org/10.3390/app12157442
Submission received: 17 June 2022 / Revised: 18 July 2022 / Accepted: 21 July 2022 / Published: 25 July 2022
(This article belongs to the Collection Analysis of Dynamics of Railway Vehicles)

Abstract

:
With the increase in train speeds on high-speed railways, the excitation frequency of track irregularities increases, which has a negative impact on train comfort and opposes the passengers’ desire for high ride comfort. In addition, the uncertainty of train comfort results from the stationary randomness of track irregularities and the different zonal distribution in the car body. Therefore, the application of the stationary random vibration method to analyze the zonal distribution of train comfort and the relevant influencing factors is important to guarantee the passengers’ comfortable experience in each ride and to provide a theoretical basis for comfort optimization. First, the train was modeled using eight independent vehicle elements. Second, the pseudo-excitation method was applied to obtain the theoretical zonal distribution of the Sperling index, an indicator of comfort, via the linearity of the power spectrum density of train acceleration. Third, considering various factors affecting train comfort, the results were compared with those calculated using the Monte Carlo method. It was found that the most comfortable area was located slightly in the front of the center of the car body. Improving track irregularities and reasonably controlling the speed of a train will increase the train’s comfort, while it will deteriorate with a loss in car-body mass and damage to the secondary suspension system.

1. Introduction

High-speed railways (HSRs) have been widely and rapidly developed in global transportation thanks to their advantages such as positive energy efficiency, safety, and reliability. The continuous acceleration of high–speed trains increases the excitation frequency of track irregularities and intensifies the interaction between the vehicle and the track, which has a negative impact on train comfort. Under these circumstances, people are increasingly dissatisfied with the inferior ride comfort of trains. In addition, the irregularity of the tracks, a type of stationary random excitation, and the different arrangement of seats in the car body are responsible for the uncertainty of ride comfort for passengers. Therefore, it is important to improve the ride comfort for passengers and apply the stationary random vibration method to analyze the zonal distribution of train comfort and the relevant influencing factors to provide a theoretical basis for comfort optimization.
Nowadays, research on train vibration comfort has attracted the attention of scientists all over the world. The main contribution of Albers et al. [1] was to develop the drive train and its assemblies to meet customers’ vibration comfort requirements. Lee et al. [2] investigated the implementation of an e-Health train that provided passengers with optimized ride comfort as well as the opportunity to provide appropriate feedback on the changed ride comfort to improve passengers’ feelings and the health service. The calculation and analysis results of Yu et al. [3] showed that: (1) the vibration of the waiting and store floor under the load of the standing crowd was small, and the comfort requirements could be met; (2) the vibration of the waiting and store floor under the load of the high-speed train was larger because the waiting and store floors were more flexible; and (3) the vibration comfort under the load of the high-speed train could meet the requirements of the corresponding code. Using frequency-domain analysis and time-domain analysis, the distribution of the main vibration frequency was given by Lu [4]. Ni et al. [5] presented an experimental study on the design of a tunable secondary suspension for high-speed trains using magnetorheological fluid dampers (hereafter referred to as MR dampers) to improve lateral ride comfort. Bao et al. [6] develop a fully coupled wind-vehicle-bridge (WVB) interaction model to evaluate the dynamic performance and ride comfort of the monorail-vehicle-bridge system in turbulent crosswinds. The TR08 car of the Shanghai Magnetic Train Demonstration Line was prototyped by Jingyu [7], and a simulation model of multibody dynamics was built. Zhu et al. [8] proposed a strategy to evaluate the comfort of the trestle in terms of the vibration of the train–bridge–trestle coupling. Alehashem et al. [9] showed that the designed MR dampers effectively reduced the rolling motion of the car body. Peng et al. [10] proposed a novel evaluation model to assess this, as the most commonly used international standard ISO 2631-1 is inappropriate.
The random vibration method is used to study the vibration response of the train system accurately and statistically significantly. Lu et al. [11] presented a detailed study on the effect of vibration modes on fatigue damage in a bogie frame of a high-speed train under random loading conditions while considering the extension of the excitation frequency range and the proportional increase of the high-frequency components. Li et al. [12,13] introduced the pseudo-excitation method (PEM) to solve the random oscillations induced by rail irregularities, and presented an efficient algorithm to analyze the random multipoint oscillations of train inverters. Tan et al. [14] established a refined 3D vibration model for a coupled system of train, rail, and beam, and solved it using the PEM. Jin et al. [15] developed a versatile semiactive suspension system with variable-stiffness magnetorheological elastomer isolators and variable-damping magnetorheological dampers for high-speed trains to improve ride comfort by avoiding car body resonance and dissipating vibration energy. Arnaud [16] proposed a new method to predict the random vibration of the train–track–bridge system during earthquakes based on the Hamiltonian Monte Carlo method (MCM). Yao et al. [17] used a combination of numerical simulation, field tests, and a random forest algorithm to predict the building vibration caused by a moving train. Guo et al. [18] proposed a method to monitor the deformation of the track slab using fiber optic sensing and an intelligent method to identify the deformation of the track slab using a random forest model.
Despite numerous research works, there is still a lack of a comprehensive analysis of train comfort from the point of view of zonal distribution and the random vibration method. In order to represent the zonal distribution of train comfort, flexible car bodies must be modeled with a larger number of degrees of freedom (DOFs) than those based on rigid-body dynamics theory, which significantly increases the complexity and inefficiency of the solution. In this case, we aimed to accurately determine the zonal distribution of the Sperling index by using stationary random excitation, including the PEM and MCM, and to analyze various influencing factors such as the degree of track irregularity, train speed, vehicle load, and damage to the secondary suspension system.

2. Establishment and Solution of the Motion Equation

2.1. Motion Equation of Train System Based on MCM

In the analysis of the train vibration, it was helpful to generate different series of random track irregularity excitations repeatedly. Later, each of them was solved using the Newmark-β method (NβM) to obtain the corresponding series of the random vibratory response of the train. When the solving process for one of series of random excitation is terminated, it is called once-sampling of MCM. The entire programming procedure was realized in MATLAB software (version R2022a). Before that, the relevant motion equation of train system needed to be established in accordance with the following assumptions [19]:
(1)
The interaction is nonexistent among vehicle elements.
(2)
Each vehicle element is composed of a rigid car-body, bogies, and wheel sets.
(3)
The springs of a train are linearly elastic, while the dampers are linearly viscous.
(4)
Each vehicle element is a linear stationary system; namely, the mass, damping, and stiffness matrices of train are constant.
(5)
The train moves at a constant speed.
(6)
The wheels and rails fit snugly. The relative displacement between the track and the bridge deck, as well as the elastic effect of the track–bridge system, are neglected.
(7)
The track irregularity is a zero-mean stationary Gaussian random process.
Based on the assumptions above, a train subsystem is made up of a certain number of mutually independent 3D vehicle elements. Each of them consists of a car-body, two bogies, four wheel sets, and a two-layer spring-damper suspension system. Each vehicle element contains 15 independent DOFs for the car-body and bogies, and three dependent DOFs for each wheel set coupled respectively with the vertical, horizontal, and torsional motion states of 4 contact points. The DOFs of each vehicle element are listed in Table 1 and correspond to those in Figure 1.
According to the D’Alembert principle, the motion equation of a train can be expressed as:
M t u ¨ t + C t u ˙ t + Κ t u t = T s u w + T d u ˙ w
where Mt, Ct, and Kt are the mass, the damping, and the stiffness matrix, respectively. Ts and Td are the projector matrices for the spring and the damper, respectively. All of them can be diagonally assembled from Mve, Cve, Kve, Tsve, and Tdve of the vehicle elements, as given in Equation (2), where ut is the vibratory displacement vector containing the DOFs of the car body and the bogies in Table 1, while uw is the vibratory displacement vector containing the DOFs of the wheel-sets in Table 1. Kve in Equation (3) contains the auto-coupling stiffness matrices of the car body and bogies, namely Kcc and Kbb expressed in Equations (5) and (6), as well as the cross-coupling stiffness matrix Kbc(η), which represents the car–bogie interaction and differentiates the front and rear bogies using η = 1 and −1, respectively. Mve is diagonally assembled using the mass of different components and their moments of inertia around different axes. Tsve in Equation (8) is a stiffness projector matrix multiplied by the displacement vector uw of wheel–track contact points to form the force vector of the train. The expression of Cve and Tsve, respectively similar to Equations (3) and (8), can be obtained simply by replacing the spring factor k with the corresponding damping factor c.
K t = diag [ K ve K ve K ve ]
Κ ve = [ K cc K bc ( 1 ) T K bc ( 1 ) T K bc ( 1 ) K bb 0 K bc ( 1 ) 0 K bb ]
M ve = diag ( m c , m c , I xc , I yc , I zc , m b , m b , I xb , I yb , I zb , m b , m b , I xb , I yb , I zb )
K cc = 2 [ k y 2 0 k y 2 h 1 0 0 0 k z 2 0 0 0 k y 2 h 1 0 k y 2 h 1 2 + k z 2 b 2 2 0 0 0 0 0 k x 2 h 1 2 + k z 2 d 2 2 0 0 0 0 0 k x 2 b 2 2 + k y 2 d 2 2 ]
K bb = [ 2 k y 1 + k y 2 0 2 k y 1 h 3 + k y 2 h 2 0 0 0 2 k z 1 + k z 2 0 0 0 2 k y 1 h 3 + k y 2 h 2 0 2 ( k y 1 h 3 2 + k z 1 b 1 2 ) + k y 2 h 2 2 + k z 2 b 2 2 0 0 0 0 0 2 ( k x 1 h 3 2 + k z 1 d 1 2 ) + k x 2 h 2 2 0 0 0 0 0 2 ( k x 1 b 1 2 + k y 1 d 1 2 ) + k x 2 b 2 2 ]
K bc ( η ) = [ k y 2 0 k y 2 h 1 0 η k y 2 d 2 0 k z 2 0 η k z 2 d 2 0 k y 2 h 2 0 k y 2 h 1 h 2 k z 2 b 2 2 0 η k y 2 d 2 h 2 0 0 0 k x 2 h 1 h 2 0 0 0 0 0 k x 2 b 2 2 ]
T sve = [ 0 0 T sve b 0 0 T sve b ] ; T sve b = [ k y 1 0 0 k y 1 0 0 0 k z 1 0 0 k z 1 0 k y 1 h 3 0 k z 1 b 1 2 k y 1 h 3 0 k z 1 b 1 2 0 k z 1 d 1 0 0 k z 1 d 1 0 k y 1 d 1 0 0 k y 1 d 1 0 0 ]
In MCM, the trigonometric series superposition method is commonly used to generate the history samples of the track irregularity to form uw. Therefore, uw can be expressed in Equation (9) with the delay vector td, which reflects the phase difference among the wheel sets in Equation (10). In addition, the symbol “∘” in Equation (9) represents the Hadamard product, also known as the element-wise product between two matrices.
u w ( t ) = [ 2 k = 1 N S ir ( n k ) d n k cos ( n k v ( t t d ) + θ k ) ]
t d = [ t d ve ( 1 ) t d ve ( 2 ) t d ve ( n v ) ] T
t d ve ( i ) = 1 1 × 12 diag [ ( i 1 ) l v I 3 , 2 d 1 + ( i 1 ) l v V I 3 , 2 d 2 + ( i 1 ) l v V I 3 , 2 ( d 1 + d 2 ) + ( i 1 ) l v V I 3 ]
S ir ( n ) = { [ S a ( n ) S v ( n ) S c ( n ) ] [ I 3 I 3 I 3 ] 3 × 12 n v } T
where nv is the total number of vehicle elements; Sir is the given vertical track irregularity PSD matrix in Equation (12) composed of the alignment, vertical, and cross-level PSDs; nk is an angular wave number sample; dn is the bandwidth; and θk is a random phase angle obeying the uniform distribution U(0,2π). The integer order of k ranges from 1 to N.

2.2. Motion Equation of Train System Based on the PEM

The PEM proposed by LIN helps to establish a series of input pseudo simple harmonic excitation by the given random excitation PSD in order to obtain the structural response PSD and the variance [20]. In the PEM, the stationary pseudo solution can be calculated through the multiplication of the frequency response function matrix (FRF). Based on the same assumptions as those presented in Section 2.1, using the D’Alembert principle, the motion equation of the train can be expressed as:
U ˜ t ( ω , t ) = [ u ˜ t a u ˜ t v u ˜ t c ] = ( ω 2 M t + j ω C t + K t ) 1 ( T s + j ω T d ) U ˜ w ( ω , t )
where U ˜ t with the overhead tilde “~” is the displacement vibratory response of the train to represent the variables in the pseudo form as the function of angular frequency ω and time t. In addition, in Equation (13), it is composed of three types of displacement response subvectors respectively controlled by three independent directional types of track irregularity PSDs, namely the alignment Sa, the vertical Sv, and the cross-level Sc. This is because the PEM does not allow the linear superposition of different pseudo inputs defined by mutually independent PSDs, and only their PSDs obey the linear superposition principle. Meanwhile, the pseudo velocity U ˜ ˙ t and acceleration U ˜ ¨ t vibratory response vectors can be expressed as Equations (14) and (15). The pseudo displacement of wheel sets can be defined in Equation (16) by converting the angular wave number domain to the angular frequency domain; it contains three types of pseudo track irregularity motions, similar to the definition of Equation (13):
U ˜ ˙ t ( ω , t ) = j ω U ˜ t ( ω , t )
U ˜ ¨ t ( ω , t ) = ω 2 U ˜ t ( ω , t )
U ˜ w ( ω , t ) = [ u ˜ w a u ˜ w v u ˜ w c ] = { [ I 3 I 3 I 3 ] 3 × 12 n v } T S ir ( n ) V exp [ j n V ( t t d ) ] = { [ I 3 I 3 I 3 ] 3 × 12 n v } T S ir ( ω ) exp [ j ω ( t t d ) ]
With the pseudo displacement vibratory response of the train in Equation (16), the PSD matrix of the displacement vibratory response can be calculated through the sum of the multiplication of the conjugate and the transpose of the corresponding pseudo vectors, as shown in Equation (17). Accordingly, the PSD matrix of acceleration vibratory response can be deduced through the multiplication of the PSD matrix of the displacement vibratory response and the fourth power of angular frequency ω. The exponential term with the variable of time t will be eliminated due to the multiplication of the conjugate and the transpose, which makes the PSD independent of time; namely, stationary. Accordingly, in Equation (18), the principal diagonal elements represents the auto-PSDs of the corresponding DOFs, while the remaining elements represent the cross-PSDs of two different DOFs.
S U ( ω ) = U ˜ w * U ˜ w T = u ˜ t a * u ˜ t a T + u ˜ t v * u ˜ t v T + u ˜ t c * u ˜ t c T
S U ¨ ( ω ) = ω 4 S U ( ω ) = ω 4 [ S y c 1 y c 1 ( ω ) S y c 1 z c 1 ( ω ) S y c 1 θ c 1 ( ω ) S z c 1 y c 1 ( ω ) S z c 1 z c 1 ( ω ) S z c 1 θ c 1 ( ω ) S θ c 1 y c 1 ( ω ) S θ c 1 y c 1 ( ω ) S θ c 1 θ c 1 ( ω ) ]

3. Sperling Index Based on Vibratory Acceleration History and PSD

3.1. Zonal Distribution Deduction of Sperling Index Based on Vibratory Acceleration History

The Sperling index, an indicator of stability, is a measurement method to determine the comfort of passengers and occupants on the rolling stock, as well as the status of transported goods. The evaluation is based on the measurement of the vehicle body’s vibration acceleration. The less comfort the passengers experience, the higher the Sperling index will be [21].
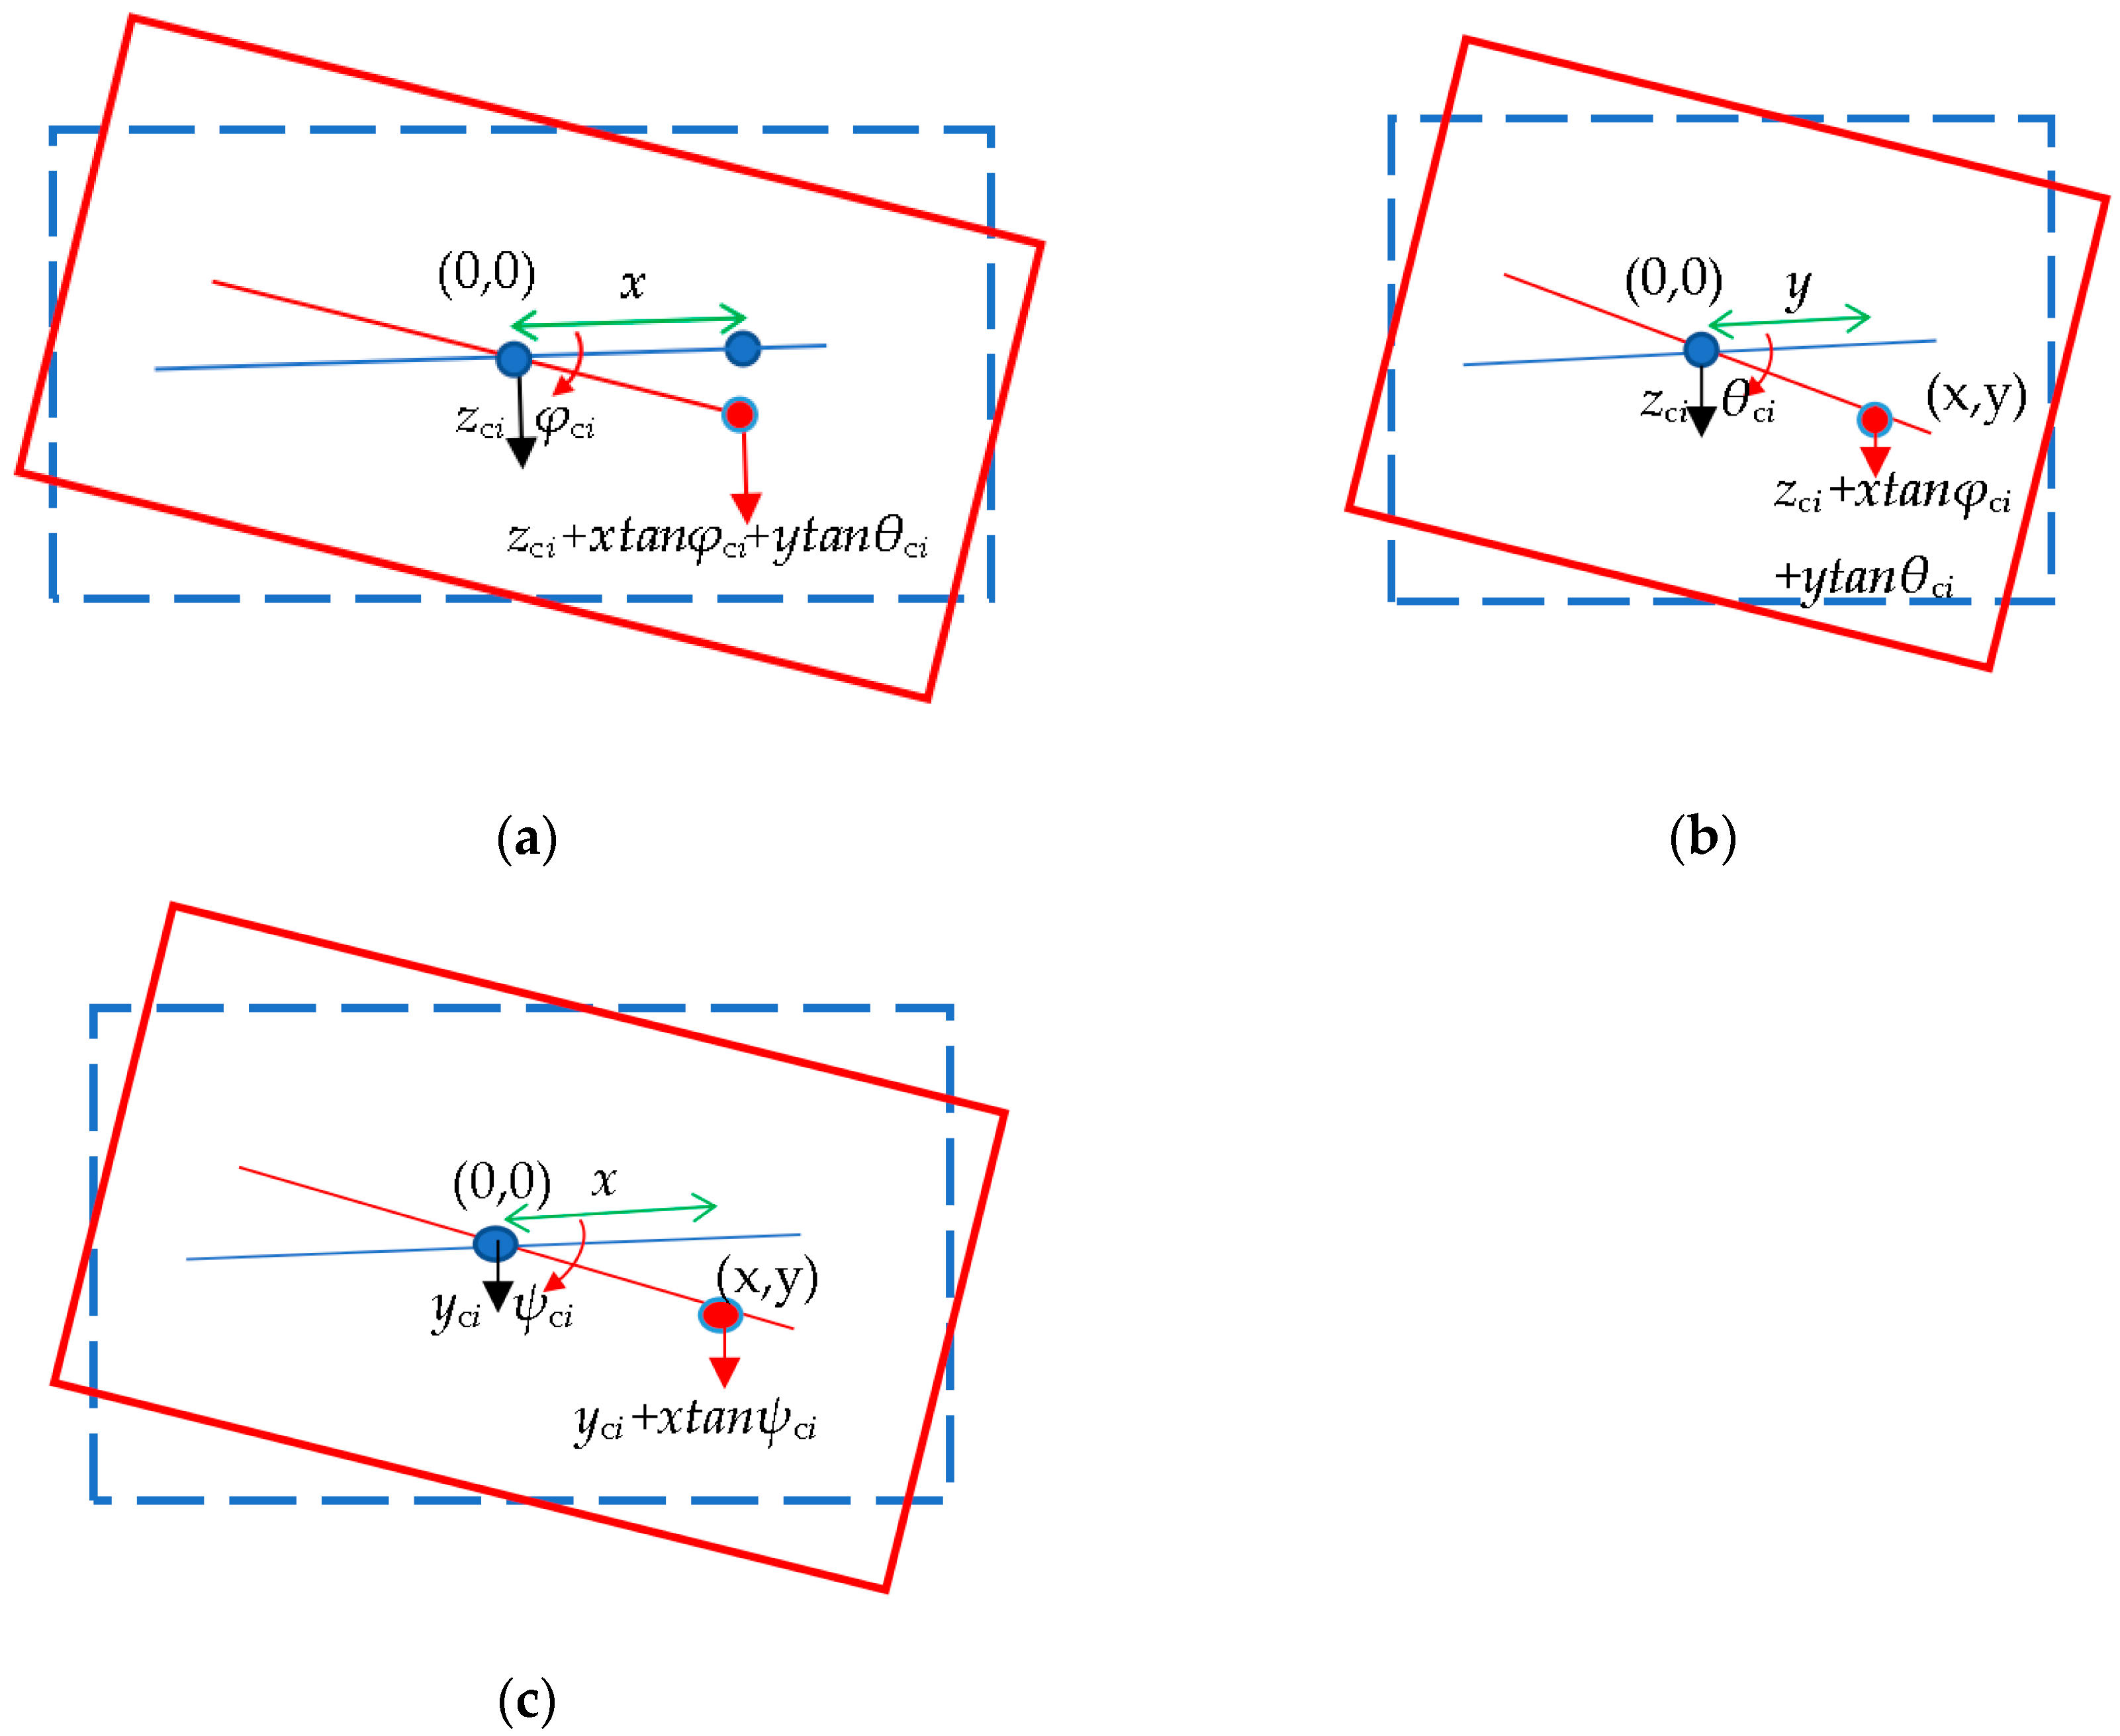
To derive the Sperling index at a given location, the zonal acceleration should first be determined. In Figure 2, the vibration acceleration is linearly distributed in the space of the car body according to the principle of rigid dynamics. The vertical vibration acceleration at any zonal location in the horizontal plane of the car-body center can be determined by considering the horizontal coordinate (x,y), vertical, roll, and pitch acceleration of the car-body center. In this case, the coordinate origin was at the car-body center.
Therefore, the zonal distribution of the vertical acceleration can be derived using Equation (19). In the case of horizontal acceleration, the horizontal coordinate (x,y), lateral sway, and yaw acceleration of the car-body center are considered. Thus, the zonal distribution of the horizontal acceleration can be expressed as Equation (20).
z ¨ c i ( x , y , t ) = z ¨ c i ( 0 , 0 , t ) + x φ ¨ c i ( 0 , 0 , t ) + y θ ¨ c i ( 0 , 0 , t )
y ¨ c i ( x , y , t ) = y ¨ c i ( 0 , 0 , t ) + x ψ ¨ c i ( 0 , 0 , t )
Secondly, the corresponding acceleration amplitude spectrum within the prescribed interval of frequency must be calculated using fast Fourier transform (FFT). In this case, the single-frequency component for the Sperling index can be defined as Equation (21), while the 10th power root of the sum of the 10th power is described in Equation (22) for the Sperling index of multiple-frequency component vibrations for the car body of vehicle element i.
W k i ( x , y ) = 3.57 A k i 3 f k F ( f k ) 10 = 3.57 | FFT [ y ¨ c i   z ¨ c i ] ( f k ) | 3 f k [ F v ( f k ) F h ( f k ) ] 10
W i = k = 1 N W k i 10 10
where Ak (unit: m/s2) represents the amplitude vector of the vibration acceleration at the frequency point fk (unit: Hz) after Fourier transform, F(fk) represents the frequency correction coefficient vector whose vertical and horizontal elements are sectionally expressed in Equations (23) and (24), and the number of frequency N is strongly related to the interval limit of frequency and the measurement duration. In accordance with the code GB/T5599-2019, the standard measurement duration is 5 s, the reciprocal of which is the bandwidth frequency df of the fast Fourier transform.
F v ( f k ) = { 0.325 f k 2 ( f k = 0.5 ~ 5.9 Hz ) 400 / f k 2 ( f k = 5.9 ~ 20 Hz ) 1 ( f k = 20 ~ 40 Hz )
F h ( f k ) = { 0.8 f k 2 ( f k = 0.5 ~ 5.4 Hz ) 650 / f k 2 ( f k = 5.4 ~ 26 Hz ) 1 ( f k = 26 ~ 40 Hz )
In general, the derivation of the zonal distribution of the Sperling index based on the course of the vibration acceleration is random, as the phase angles of the course of the track irregularities generated in each MCM vary. According to GB/T5599-2019, in order to roughly evaluate the train comfort, the average value of the Sperling index is often used.

3.2. Zonal Distribution Deduction of Sperling Index Based on Vibratory Acceleration PSD

To derive the zonal distribution of the Sperling index based on the PSD, the linearity of the PSD of the car-body acceleration must first be determined to form the auto-PSDs and cross-PSDs between the different DOFs.
The linearity of the PSD can be derived from the linearity of the correlation function of random signals. In signal processing, cross-correlation is a measure of the similarity of two series as a function of the displacement of one series relative to the other, while autocorrelation is the cross-correlation of a signal with a delayed copy of itself as a function of delay. Informally, it is the similarity between observations as a function of the time lag between them. Therefore, autocorrelation and cross-correlation can be defined as Equations (25) and (26), where τ is the time lag, T is the period of the signal, and v and h are two signals [22].
R v v ( τ ) = lim T 1 T T 2 T 2 v ( t ) v ( t + τ ) d t
R v h ( τ ) = lim T 1 T T 2 T 2 v ( t ) h ( t + τ ) d t
There exists a signal p that is equal to the linear additional relation as av + bh, where a and b are two constants. Therefore, the auto-correlation of signal p can be deduced using Equation (27), from which it can be seen that the auto-correlation of the signal p is linked to the auto-correlation and cross-correlation of signals v and h.
R p p ( τ ) = R ( a v + b h ) ( a v + b h ) ( τ ) = lim T 1 T T 2 T 2 a 2 v ( t ) v ( t + τ ) + a b v ( t ) h ( t + τ ) + a b h ( t ) v ( t + τ ) + b 2 h ( t ) h ( t + τ ) d t = a 2 R v v ( τ ) + b 2 R h h ( τ ) + a b [ R h v ( τ ) + R v h ( τ ) ]
The Wiener–Khinchin theorem illustrates that the Fourier transform of auto-correlation of a signal is equal to its PSD [23]. Therefore, the PSD of signal p can be deduced by the inverse Fourier transform given in Equation (28), namely the linearity of PSD.
S p p ( τ ) = R p p ( ω ) e j ω τ d ω = a 2 S v v ( τ ) + b 2 S h h ( τ ) + a b [ S h v ( τ ) + S v h ( τ ) ]
Accordingly, the zonal relationship of the vertical and horizontal vibration acceleration between the center of the car body and a specific location on the same plane is given in Equations (19) and (20) in Section 3.1. Therefore, for the PSD of a vertical vibration acceleration at coordinate (x,y), not only the auto-PSDs for the vertical levitation, roll, and pitch of the car-body center, but also the cross-PSDs for the vertical levitation, roll, and pitch of the car-body center are multiplied by the corresponding coordinate and superimposed shortly thereafter in Equation (29). Similarly, the PSD of the horizontal vibration acceleration at coordinate (x,y) can be calculated using (30), which includes auto-PSDs for the lateral sway and yaw of the car-body center and cross-PSDs for the lateral sway and yaw of the car-body center.
S z ¨ [ i ] ( ω , x , y ) = y 2 S θ ¨ c i + x 2 S φ ¨ c i + S z ¨ c i + x ( S z ¨ c φ ¨ c + S φ ¨ c z ¨ c ) + y ( S θ ¨ c i z ¨ c i + S z ¨ c i θ ¨ c i ) + x y ( S θ ¨ c i φ ¨ c i + S φ ¨ c i θ ¨ c i )
S y ¨ [ i ] ( ω , x , y ) = x 2 S ψ ¨ c i + S y ¨ c i + x ( S y ¨ c i ψ ¨ c i + S ψ ¨ c i y ¨ c i )
The auto-PSDs and the cross-PSDs above can be respectively withdrawn from the main and the counter diagonal elements of the vibratory acceleration PSD matrix in Equation (18). The PSD multiplied by the bandwidth dω is equal to the square of amplitude spectrum. In this way, Equation (21), which describes the simple frequency component for the Sperling index, should be modified to be the form containing the quadratic term of amplitudes to be linked with the corresponding PSDs in Equation (31):
W k i ( x , y ) = 3.57 A k i 2 [ F ( f k ) f k ] 2 3 20 3 = 3.57 2 [ S y ¨ [ i ] ( 2 π f k , x , y ) S z ¨ [ i ] ( 2 π f k , x , y ) ] [ F ( f k ) f k ] 2 3 d f 20 3
In the actual calculation, the Sperling index for multiple frequency components expressed in Equation (22) is equivalent to Equation (32):
W i = k = 1 N W k i 10 10 k = 1 N W k i 20 3 20 3
Finally, through the combination of the equations above, the zonal distribution of the Sperling index in the vertical and horizontal can be expressed as Equation (33) in the form of a 20/3 root of the integration of PSDs.
W i ( x , y ) = 4 π 0.5 40 3.57 20 3 [ S y ¨ [ i ] ( 2 π f , x , y ) S z ¨ [ i ] ( 2 π f , x , y ) ] { [ F v ( f ) F h ( f ) ] f } 2 3 d f 20 3
In general, the zonal distribution deduction of the Sperling index based on the vibratory acceleration PSD can comprehensively and precisely reflect the train comfort because the excitation is just formed of the PSD of track irregularities obtained through accurate statistics gathered by the relevant national railway department, and can be directly converted to the PSD of the response.

4. Case Study

4.1. Parameters of Track Irregularity and Train

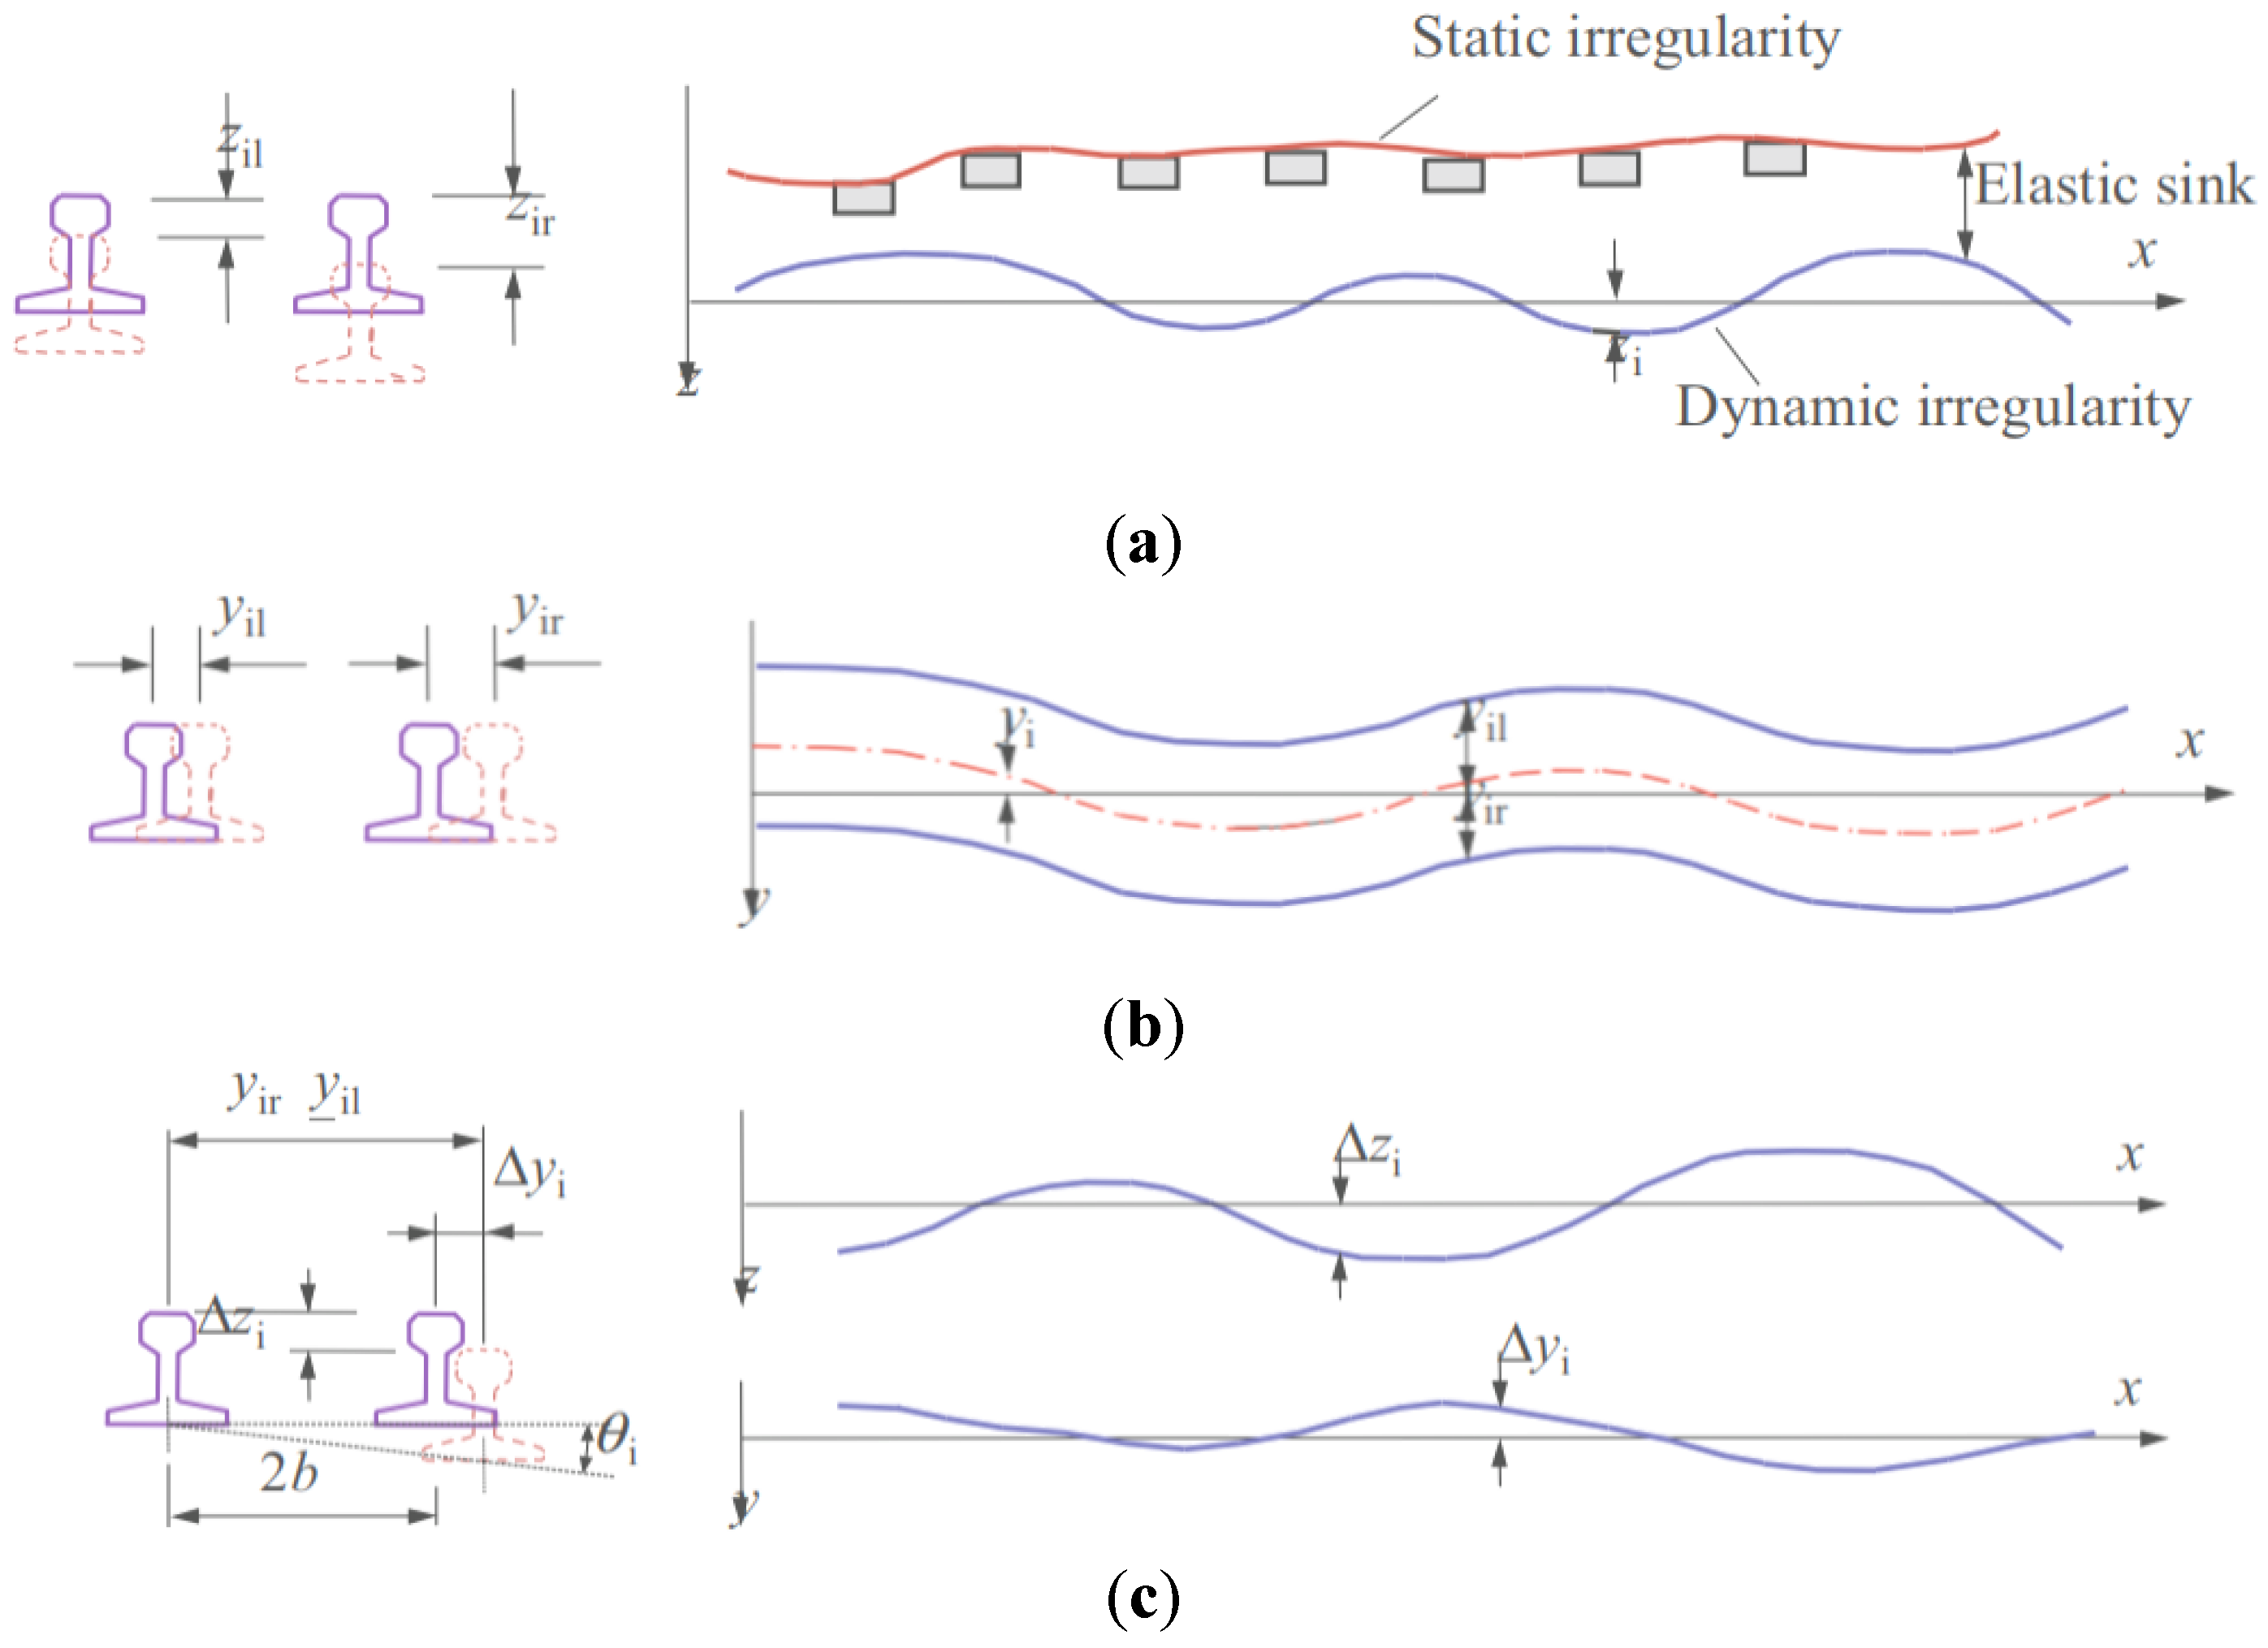
The PSDs of track irregularities adopted for the case study were proposed by the Federal Railroad Administration (FRA) [24] based on a large amount of measured data fitted with the even functions expressed by the cutoff angle wave numbers (nc and ns with units rad/m) and roughness constants (Aa and Av with units m/rad). The expressions of the PSDs for the alignment, vertical, and cross-level PSDs are given in Equation (34) through (36) and are shown in Figure 3. The PSDs were divided into Grades 1–6, and the corresponding parameters from Equations (34)–(36) are listed in Table 2.
S a ( n ) = A a n c 2 n 2 ( n 2 + n c 2 )
S v ( n ) = A v n c 2 n 2 ( n 2 + n c 2 )
S c ( n ) = 4 A v n c 2 ( n 2 + n c 2 ) ( n 2 + n s 2 )
The high-speed train CRH2 was used for analysis. To stabilize the response of the train to ensure correctness, the train began by running for an initial distance equivalent to a duration of 5 s. According to GB/T5599-2019 [25], the upper and lower limits of the angular wave number were determined. All the parameters of the train operation are listed in Table 3.

4.2. Demonstration of the Methodological Correctness

In this section, the methodological correctness is demonstrated by analyzing the probability characteristics of the random vibration acceleration of the car-body center. The expected value of the random process can be obtained by averaging the samples at each measurement time from the total sample. Due to ergodicity in all states of a stationary process, a sample history basically contains the properties reflecting all probability and statistical characteristics of the random process. The expected value of the family of random variables corresponds to the time average of a single random time sample, as shown in Equation (37), where vj represents a particular random time sample of the family of random variables V. For the stationary Gaussian random process with a zero mean, the variance can be expressed as Equation (38). By combining Equation (25) with the time lag τ = 0, the autocorrelation of the signal is equal to its variance.
μ = E [ V ( t ) ] = E [ v j ( t ) ] = i = 1 n v j ( t ) n = lim T 1 T T 2 T 2 v j ( t ) d t
σ 2 = E [ V ( t ) μ ] 2 = E [ v j 2 ( t ) ] = lim T 1 T T 2 T 2 v j 2 ( t ) d t = R v v ( 0 )
The track irregularities as input of the linear train system are a stationary Gaussian random process with a zero mean, which theoretically has the same properties of probability distribution as the train oscillation response. According to the Wiener–Khinchin theorem and the statistical control for a random signal with a zero mean value [26], the theoretical standard variance of the vertical vibration acceleration of the car body can be obtained via the square root of the integration of the PSD calculated using the PEM, as shown in Equation (31), similar to the horizontal acceleration. The preliminary history curve of the expected value and the standard variance of the history samples can be calculated by the statistical method at each time point.
σ z ¨ c i = + S z ¨ c i ( ω ) d ω
A vehicle element was simulated to run at a speed of 350 km/h for 5 s to cross a distance of a Grade-4 track irregularity. The PEM and MCM with 100 times of sampling were adopted to analyze the characteristics of the possibility distribution for the car-body center acceleration. In Figure 4, concerning the possibility distribution of the car-body center vibratory acceleration for only one vehicle element in the time history domain, it can be seen that:
  • In Figure 4a,c, the expected value μ and the limits of the 3σ normal distribution of the vibration response of the Car-Body center using MCM–NβM and PEM-FRF, respectively, are in substantial agreement. The response patterns are also well within the bounds of the 3σ principle for normal distributions. Compared to MCM, which required multiple solutions, the PEM was much more accurate and efficient.
  • In Figure 4b,d, the preliminary probability density curve calculated using MCM-NβM agrees with the theoretical normal distribution calculated using PEM-FRF.
  • In general, the train vibration acceleration under track irregularities obeyed the stationary zero-mean normal distribution, the statistical properties of which can be described by the 3σ-principle, and which is consistent with the original assumption regarding the track irregularities as a stationary zero-mean Gaussian random process. Therefore, it was demonstrated that the methodology was correct and suitable for the analysis outlined in the following sections.

4.3. Analysis of the Car-Body Center Comfort in Different Vehicle Elements

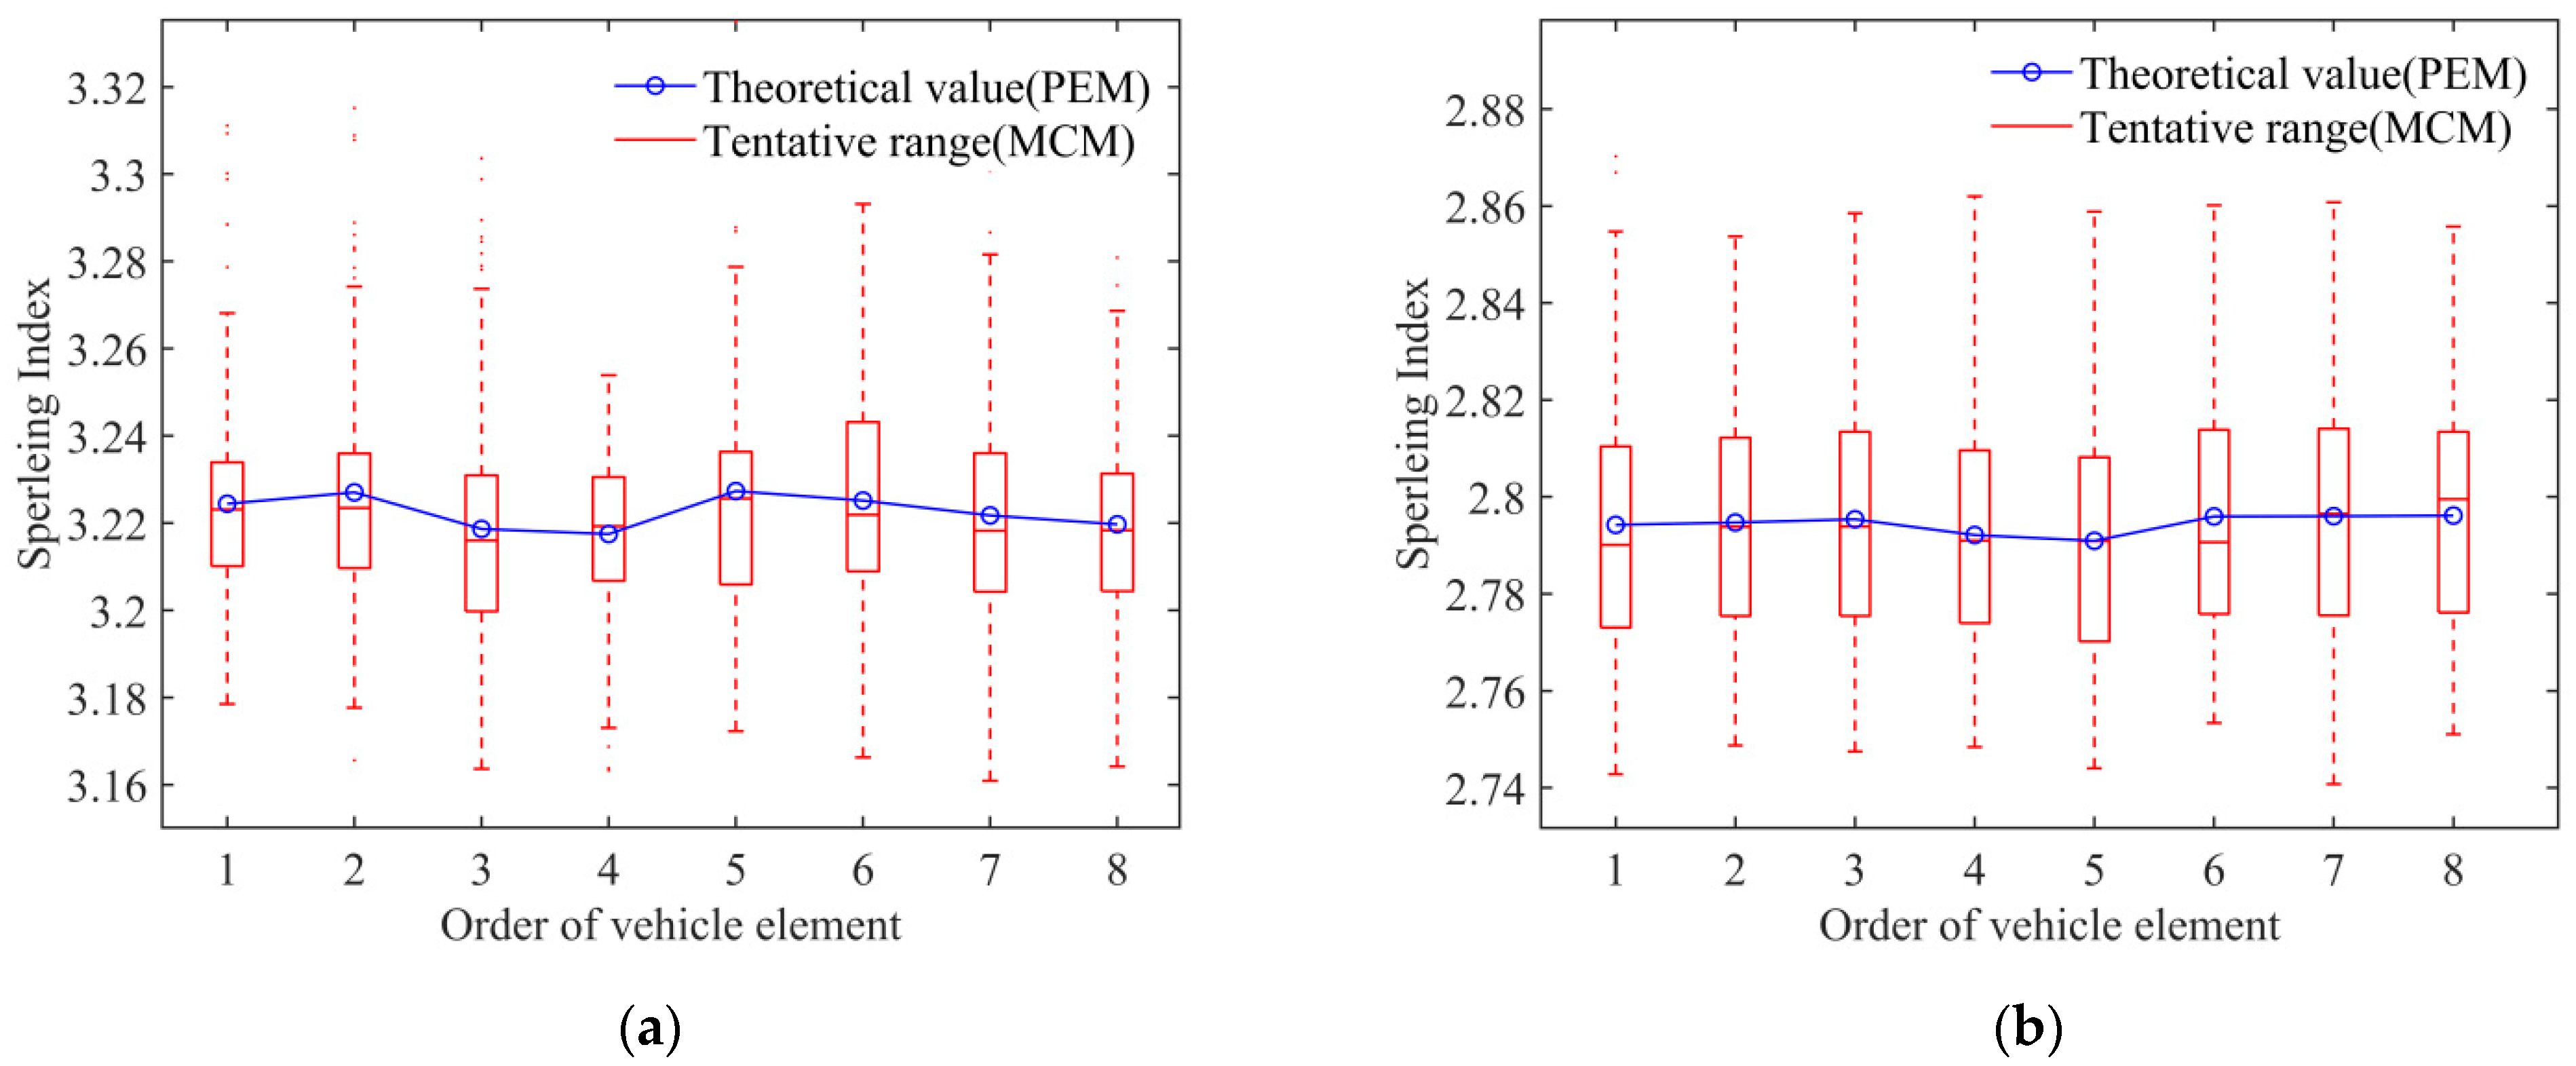
The train, which consisted of eight independent vehicle elements, was adopted for 5 s at a speed of 350 km/h over a track with Grade-4 track irregularities for the simulation. The MCM was applied 100 times to calculate the vibration acceleration of the car body at the center of each vehicle element and derive the Sperling indices, which are shown in Figure 5 in the form of box plots, and compared with the theoretical values calculated using the PEM. In Figure 5, it can be seen that:
  • The variations in the theoretical Sperling index of the car-body center according to the PEM between the different vehicle elements were insignificant for both the horizontal and vertical components. The theoretical Sperling index for the horizontal component was obviously higher than that for the vertical component;
  • In all sequences of vehicle elements, the difference between the upper and lower provisional range limits of the Sperling index sampling distribution according to MCM did not exceed 0.12 for both the horizontal and vertical components;
  • In general, the discomfort was strongly related to the horizontal vibration acceleration of the car body. In addition, the Sperling index was a stationary indicator of comfort that was independent of the order of vehicle elements when the train was subjected to track irregularities. In this way, the comfort of the center of the car body could be characterized by simply selecting a vehicle element to analyze.

4.4. Analysis of the Zonal Distribution Characteristics of Train Comfort

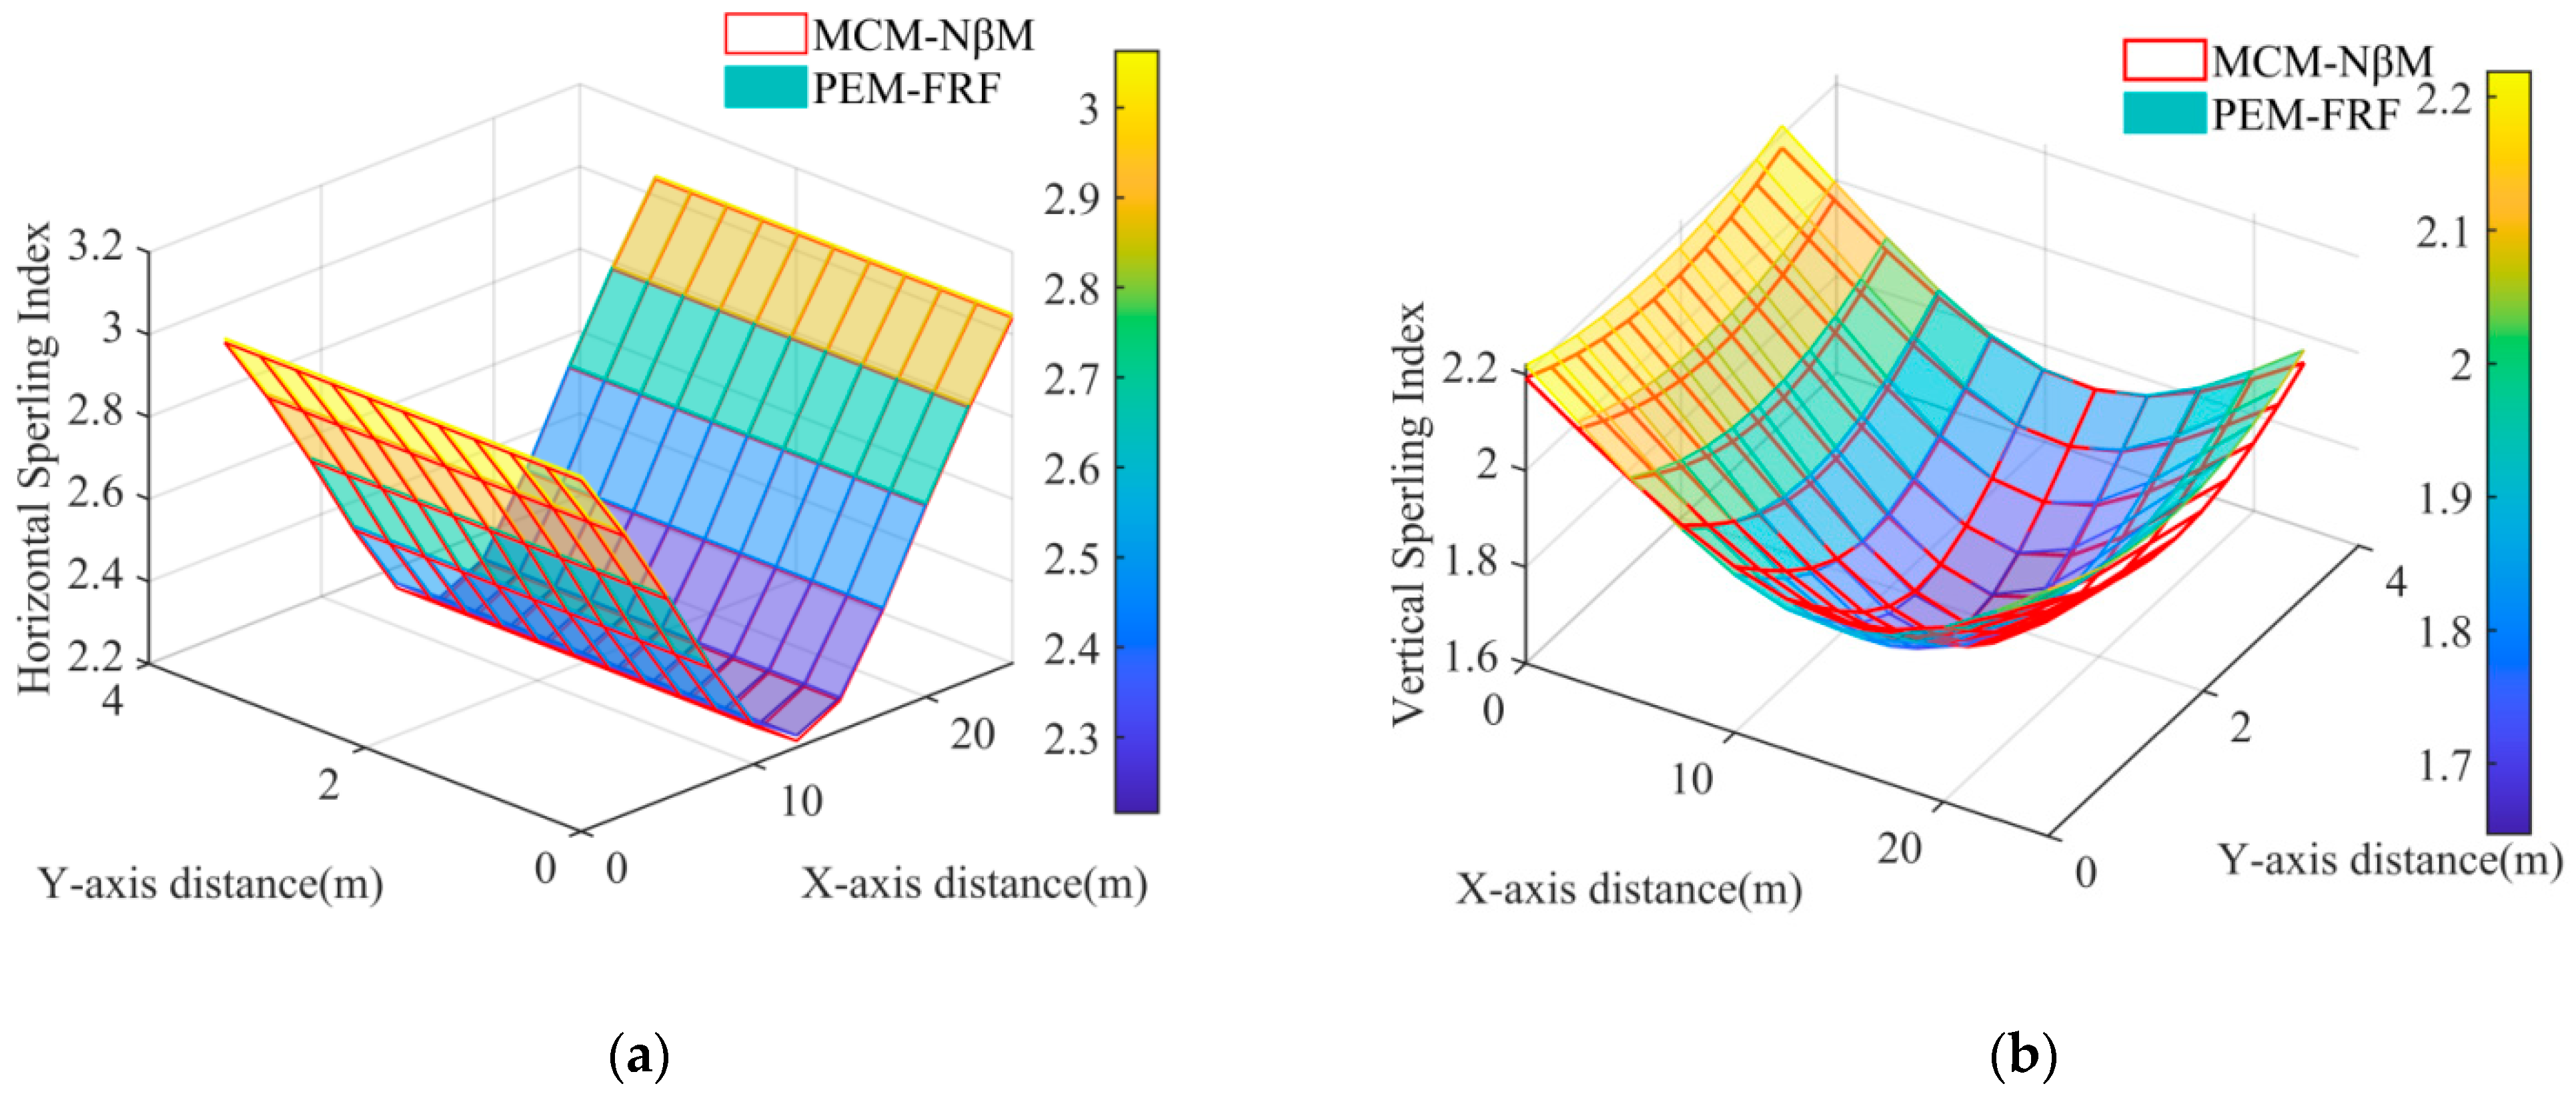
In the simulation, a vehicle element was selected to traverse a track with Grade-6 track irregularities for 5 s at a speed of 350 km/h. MCM was applied 100 times to calculate the vibration acceleration of the car-body center of each vehicle element and then calculate the preliminary average of the zonal distribution of the Sperling index shown in Figure 6 according to Section 3.1 and compare it with the theoretical values calculated using the PEM according to the linearity of PSDs given in Section 3.2. To simplify the representation in the figure, the coordinate (x,y) was replaced by a length of the car body of 25 m and a width of the car body of 4 m. The mesh of the plane in which the car body was located was divided into 10 × 10. In Figure 6, it can be seen that:
  • The mean network of the zonal distribution of the Sperling index calculated using MCM–NβM was almost identical to the theoretical network calculated using PEM-FRF for both the horizontal and vertical components;
  • In Figure 6a, the zonal distribution of the horizontal Sperling index is symmetric with respect to the pitch and roll axis of the car-body center. It has the cylindrical shape of the letter “V” and reaches the highest line at the rear and front edges of the car-body, respectively, while it reaches the lowest line on the pitch axis of the car-body;
  • In Figure 6b, the zonal distribution of the vertical Sperling index is a symmetrically curved surface with respect to the roll axis of the Car-Body center. It reaches the highest points at the four vertices of the X−Y plane, where the center of the car body is located, while the lowest point is slightly in front of the center of the car body in the direction of travel;
  • Compared to Figure 5 in Section 4.3, the Sperling index of the center of the car body is smaller for both the horizontal and vertical components for Grade-6 track irregularities than for Grade-4 track irregularities;
  • In general, a small track irregularity had a negative effect on train comfort, and the zonal distribution of train comfort was not strictly symmetrical with respect to the center of the car body. The most comfortable area for the vertical component was near the front of the center of the car body, while the most comfortable area for the horizontal component was on the pitching axis of the center of the car body. The realistic evaluation of train comfort could be roughly characterized by the average value of the Sperling index during train operation, while the theoretical design of train comfort could be accurately determined by the PEM.

4.5. Analysis of Influence of the Quality of Track Irregularity on the Zonal Distribution Characteristics of Train Comfort

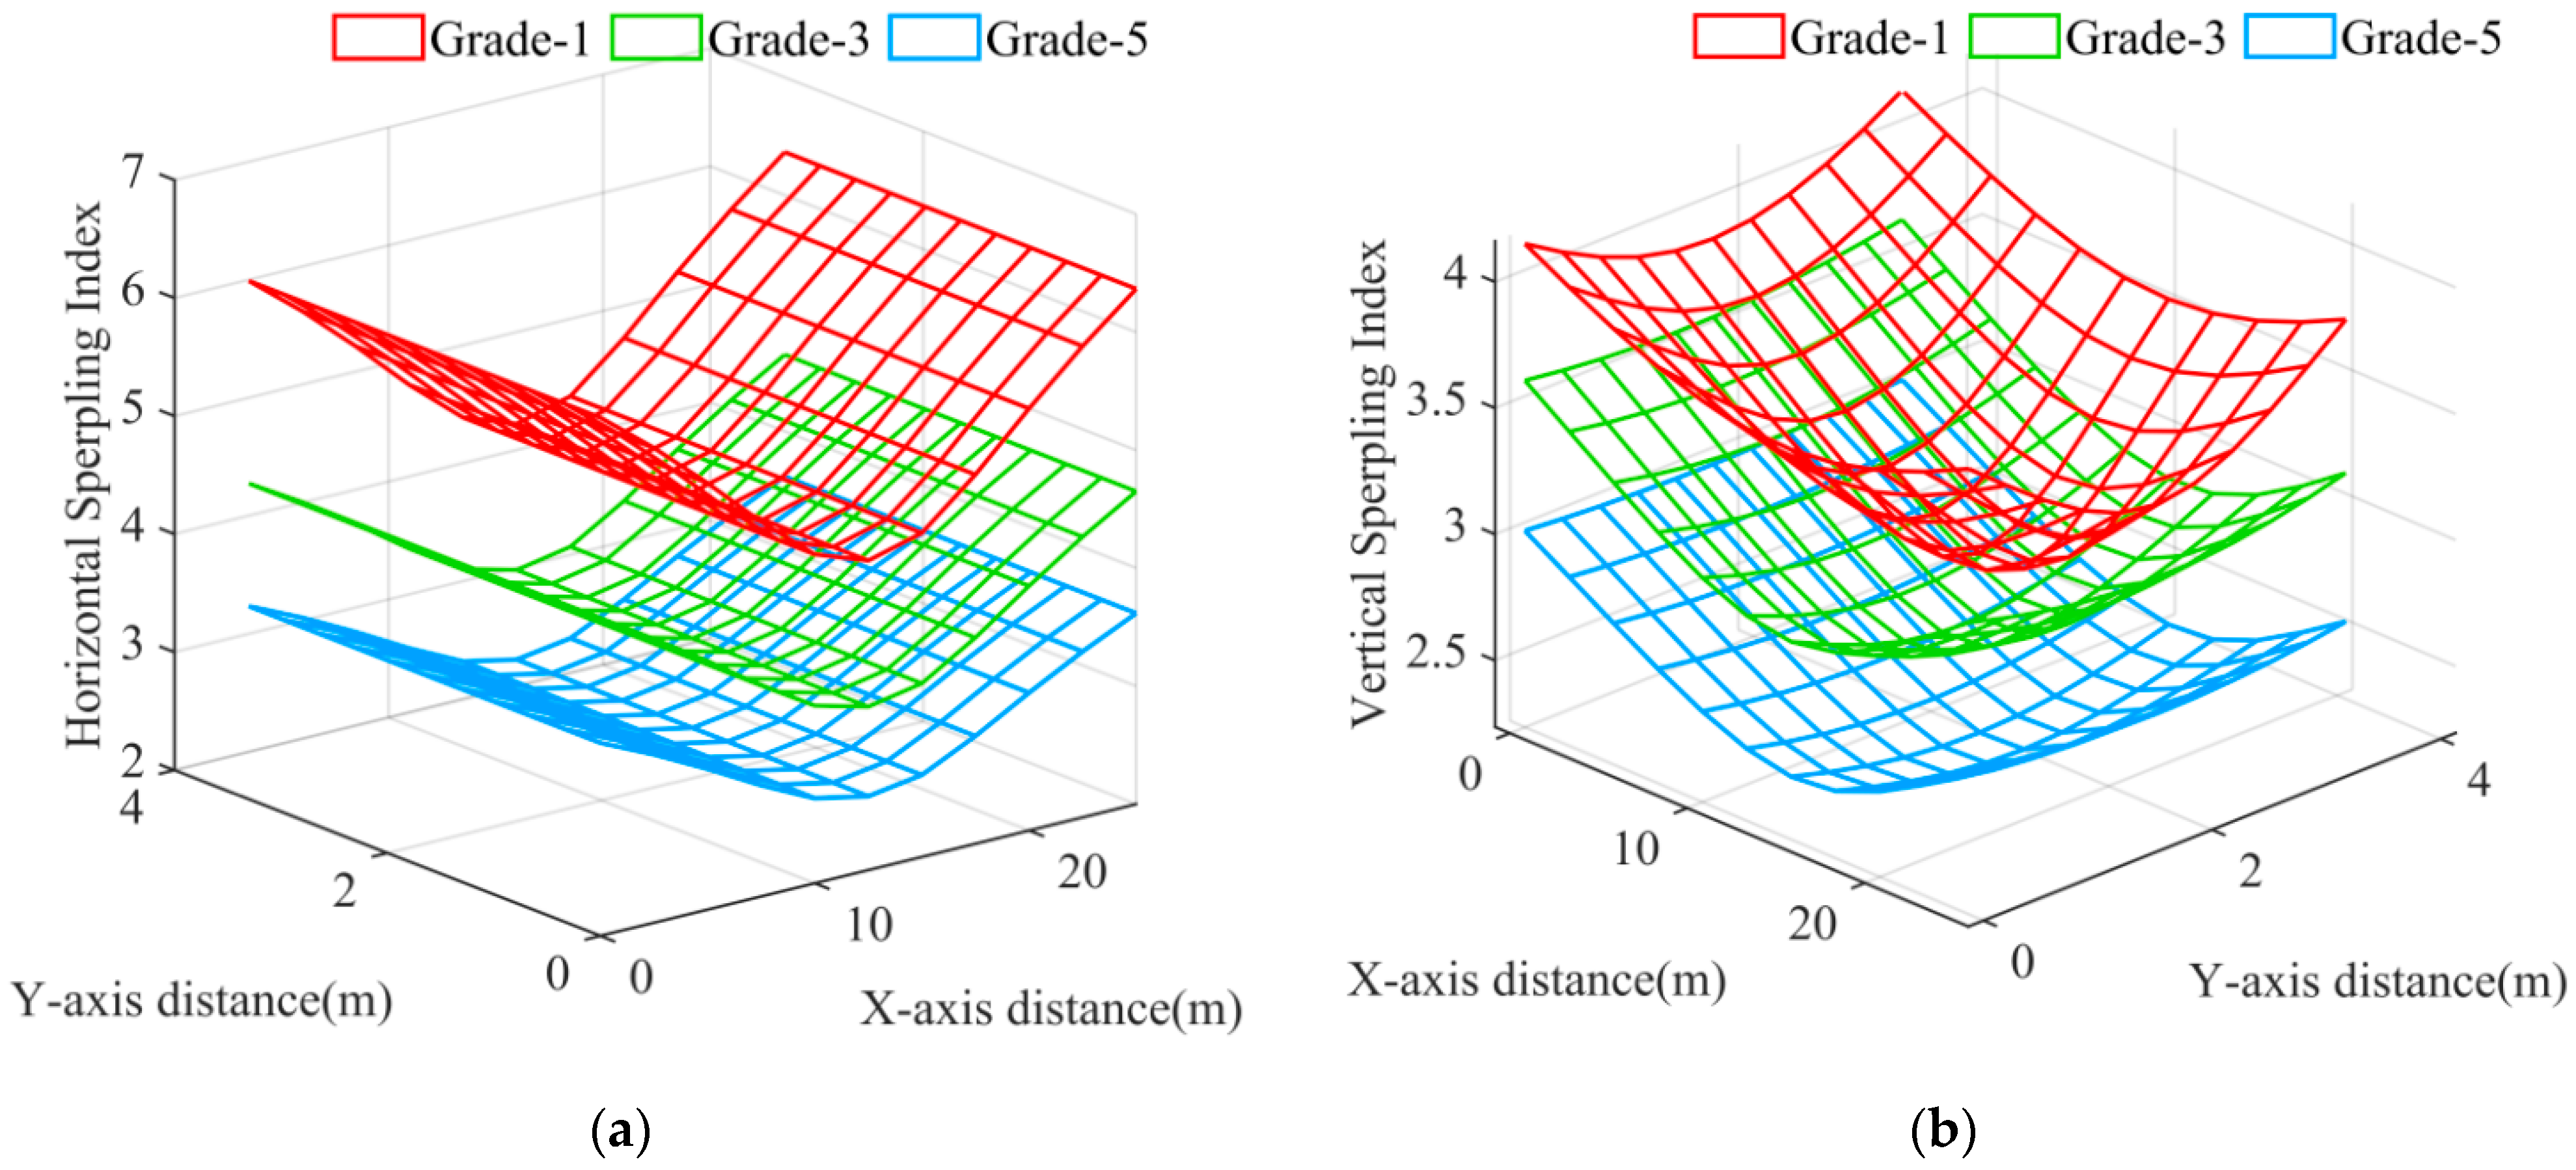
A vehicle element was simulated using the PEM to respectively cross a distance of track irregularity of Grade-1, Grade-3, and Grade-5 at a speed of 350 km/h to compare the different qualities of the track irregularities’ influences on the zonal distribution of the Car-Body Sperling index, as shown in Figure 7. It can be seen in Figure 7 that:
  • The symmetrical characteristic of the zonal distribution of the car-body Sperling index of the car body for the horizontal and vertical components was identical to that in Section 4.4;
  • With the deterioration in the quality of the track irregularities, the values of the Sperling index for the entire network increased significantly for both the horizontal and vertical components;
  • In general, train comfort deteriorated with the deterioration of the quality of track irregularities, so regular track maintenance is of great importance.

4.6. Analysis of Influence of the Train Speed on the Zonal Distribution Characteristics of Train Comfort

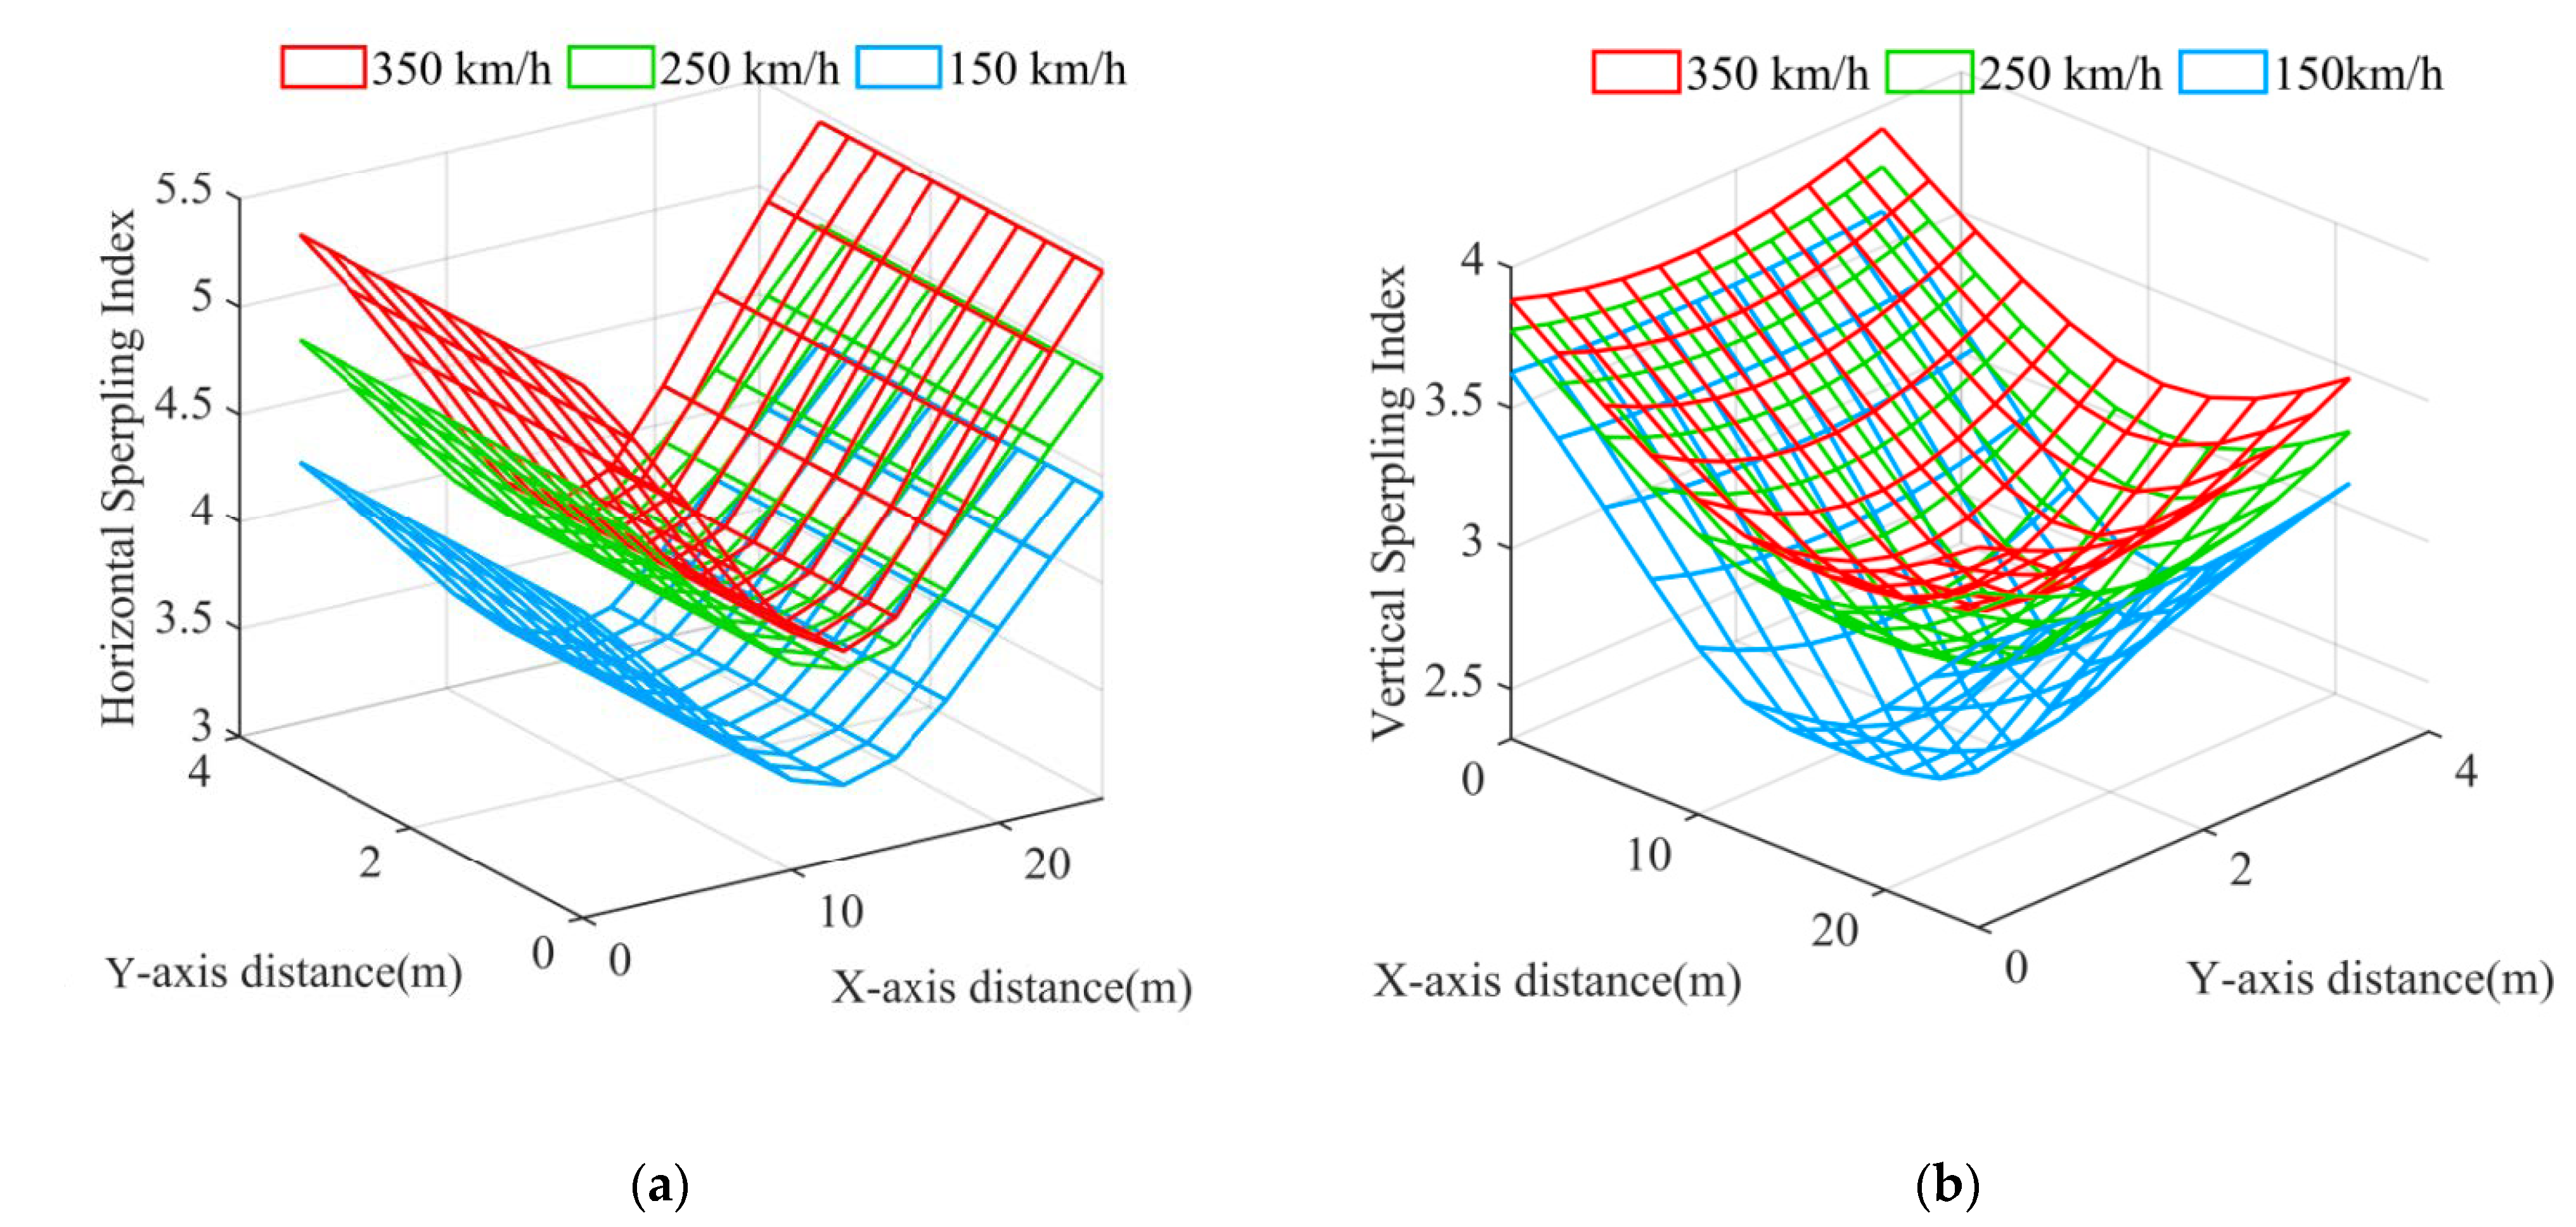
A vehicle element was simulated using the PEM to run a train with a track irregularity of Grade-2 at speeds of 150 km/h, 250 km/h, and 350 km/h to compare the influence of the different train speeds on the zonal distribution of the Car-Body Sperling index of the car body, as shown in Figure 8. In Figure 8, it can be seen that:
  • The symmetrical characteristic of the zonal distribution of the car-body Sperling index of the car body was identical to that shown in Section 4.4 for both the horizontal and vertical components;
  • As the train accelerated, the values of the car-body Sperling index for the entire network increased significantly for both the horizontal and vertical components;
  • In general, the train comfort deteriorated when the train traveled too fast. This was because the amplitude of the vibration velocity and the acceleration of the track irregularity contained the linear and quadratic terms of the train speed V, respectively. When the train accelerated, the amplitudes increased rapidly, which increased the input excitation and led to a significant increase in the vibration response of the car body. Therefore, appropriate control of a train’s speed can help to improve passenger comfort.

4.7. Analysis of Influence of the Car-Body Mass on the Zonal Distribution Characteristics of Train Comfort

In rigid dynamics, the moment of inertia of a car-body center is equivalently linear to the car-body mass. Considering the that center of mass is overlapped by the car-body center, the mass matrix of the vehicle element in Equation (4) can be respectively redefined as Equation (40) where α is the mass factor:
M ve = diag ( α m c , α m c , α I xc , α I yc , α I zc , m b , m b , I xb , I yb , I zb , m b , m b , I xb , I yb , I zb )
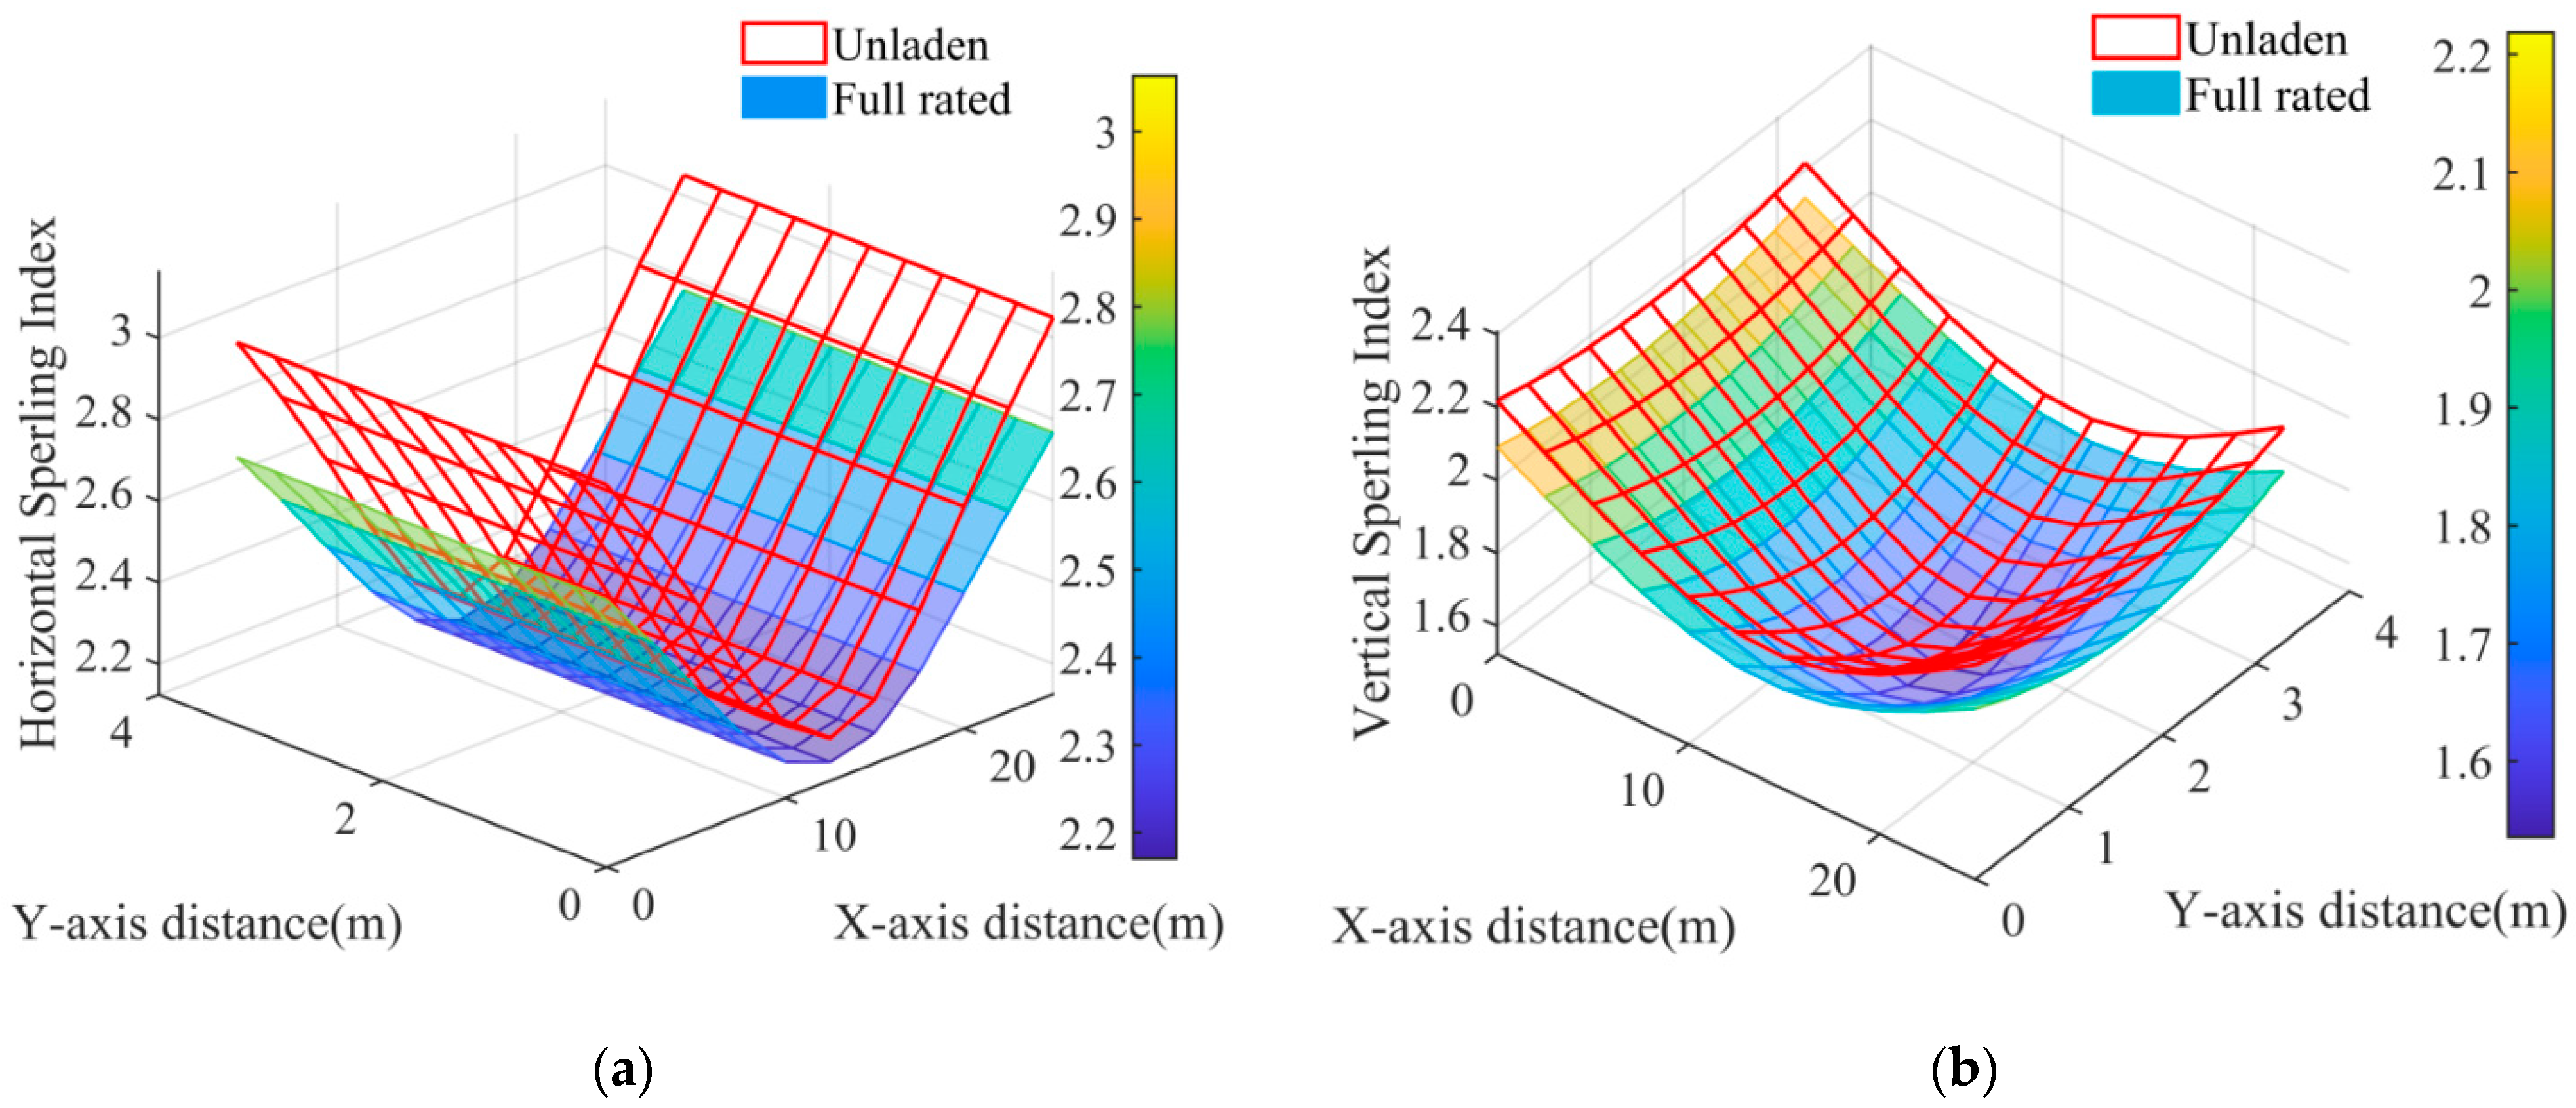
A vehicle element was simulated using the PEM to run on a track with a Grade-6 track irregularity for 5 s at a speed of 250 km/h to compare the influence of a full load (Full rated, α = 1.2) and an empty load (Unladen, α = 1) on the zonal distribution of the car body’s Sperling index, as shown in Figure 9. In Figure 9, it can be seen that:
  • The symmetrical characteristics of the zonal distribution of the car body’s Sperling index for the horizontal and vertical components were identical to those shown in Section 4.4;
  • With the additional mass of the car body, the values of the Sperling index for the entire mesh decreased significantly for both the horizontal and vertical components;
  • In general, the comfort of the train deteriorated with the loss in the car-body mass. Therefore, it is important to reasonably distribute the number of passengers during transfer and optimize the original mass design of the car body.

4.8. Analysis of Influence of the Damage of Secondary Suspension System on the Zonal Distribution Characteristics of Train Comfort

The comfort of a train is highly dependent on the performance of the secondary suspension system. Reducing the stiffness and increasing the damping can help to simulate the damage of the secondary suspension system. In this way, one of the vertical springs and dampers in the secondary suspension system connecting the car body to the front bogie was multiplied by the damage factors dfk and dfc, respectively. Therefore, the corresponding stiffness submatrix of the vehicle element including Equations (3) and (5)–(7) was updated in Equations (41)–(44).
Κ ve = [ K ¯ cc K ¯ bc ( 1 ) T K bc ( 1 ) T K ¯ bc ( 1 ) K ¯ bb 0 K bc ( 1 ) 0 K bb ]
K ¯ cc = [ 2 k y 2 0 2 k y 2 h 1 0 0 0 3 + d fk 2 k z 2 1 d fk 2 k z 2 b 2 d fk 1 2 k z 2 d 2 0 2 k y 2 h 1 1 d fk 2 k z 2 b 2 2 k y 2 h 1 2 + 3 + d fk 2 k z 2 b 2 2 0 0 0 d fk 1 2 k z 2 d 2 0 2 k x 2 h 1 2 + 3 + d fk 2 k z 2 d 2 2 0 0 0 0 0 2 k x 2 b 2 2 + 2 k y 2 d 2 2 ]
K ¯ bb = [ 2 k y 1 + k y 2 0 2 k y 1 h 3 + k y 2 h 2 0 0 0 2 k z 1 + 3 + d fk 4 k z 2 1 d fk 2 k z 2 b 2 0 0 2 k y 1 h 3 + k y 2 h 2 1 d fk 2 k z 2 b 2 2 ( k y 1 h 3 2 + k z 1 b 1 2 ) + k y 2 h 2 2 + 3 + d fk 4 k z 2 b 2 2 0 0 0 0 0 2 ( k x 1 h 3 2 + k z 1 d 1 2 ) + k x 2 h 2 2 0 0 0 0 0 2 ( k x 1 b 1 2 + k y 1 d 1 2 ) + k x 2 b 2 2 ]
K ¯ bc ( 1 ) = [ k y 2 0 k y 2 h 1 0 k y 2 d 2 0 1 + d fk 2 k z 2 0 1 + d fk 2 k z 2 d 2 0 k y 2 h 2 0 k y 2 h 1 h 2 1 + d fk 2 k z 2 b 2 2 0 k y 2 d 2 h 2 0 0 0 k x 2 h 1 h 2 0 0 0 0 0 k x 2 b 2 2 ]
Similarly, the damping submatrix was formed by replacing the spring coefficient k and the spring damaged factor dfk with the damping coefficient c and the damper damaged factor dfc. The top row of the submatrix in the following equations means that damage was present.
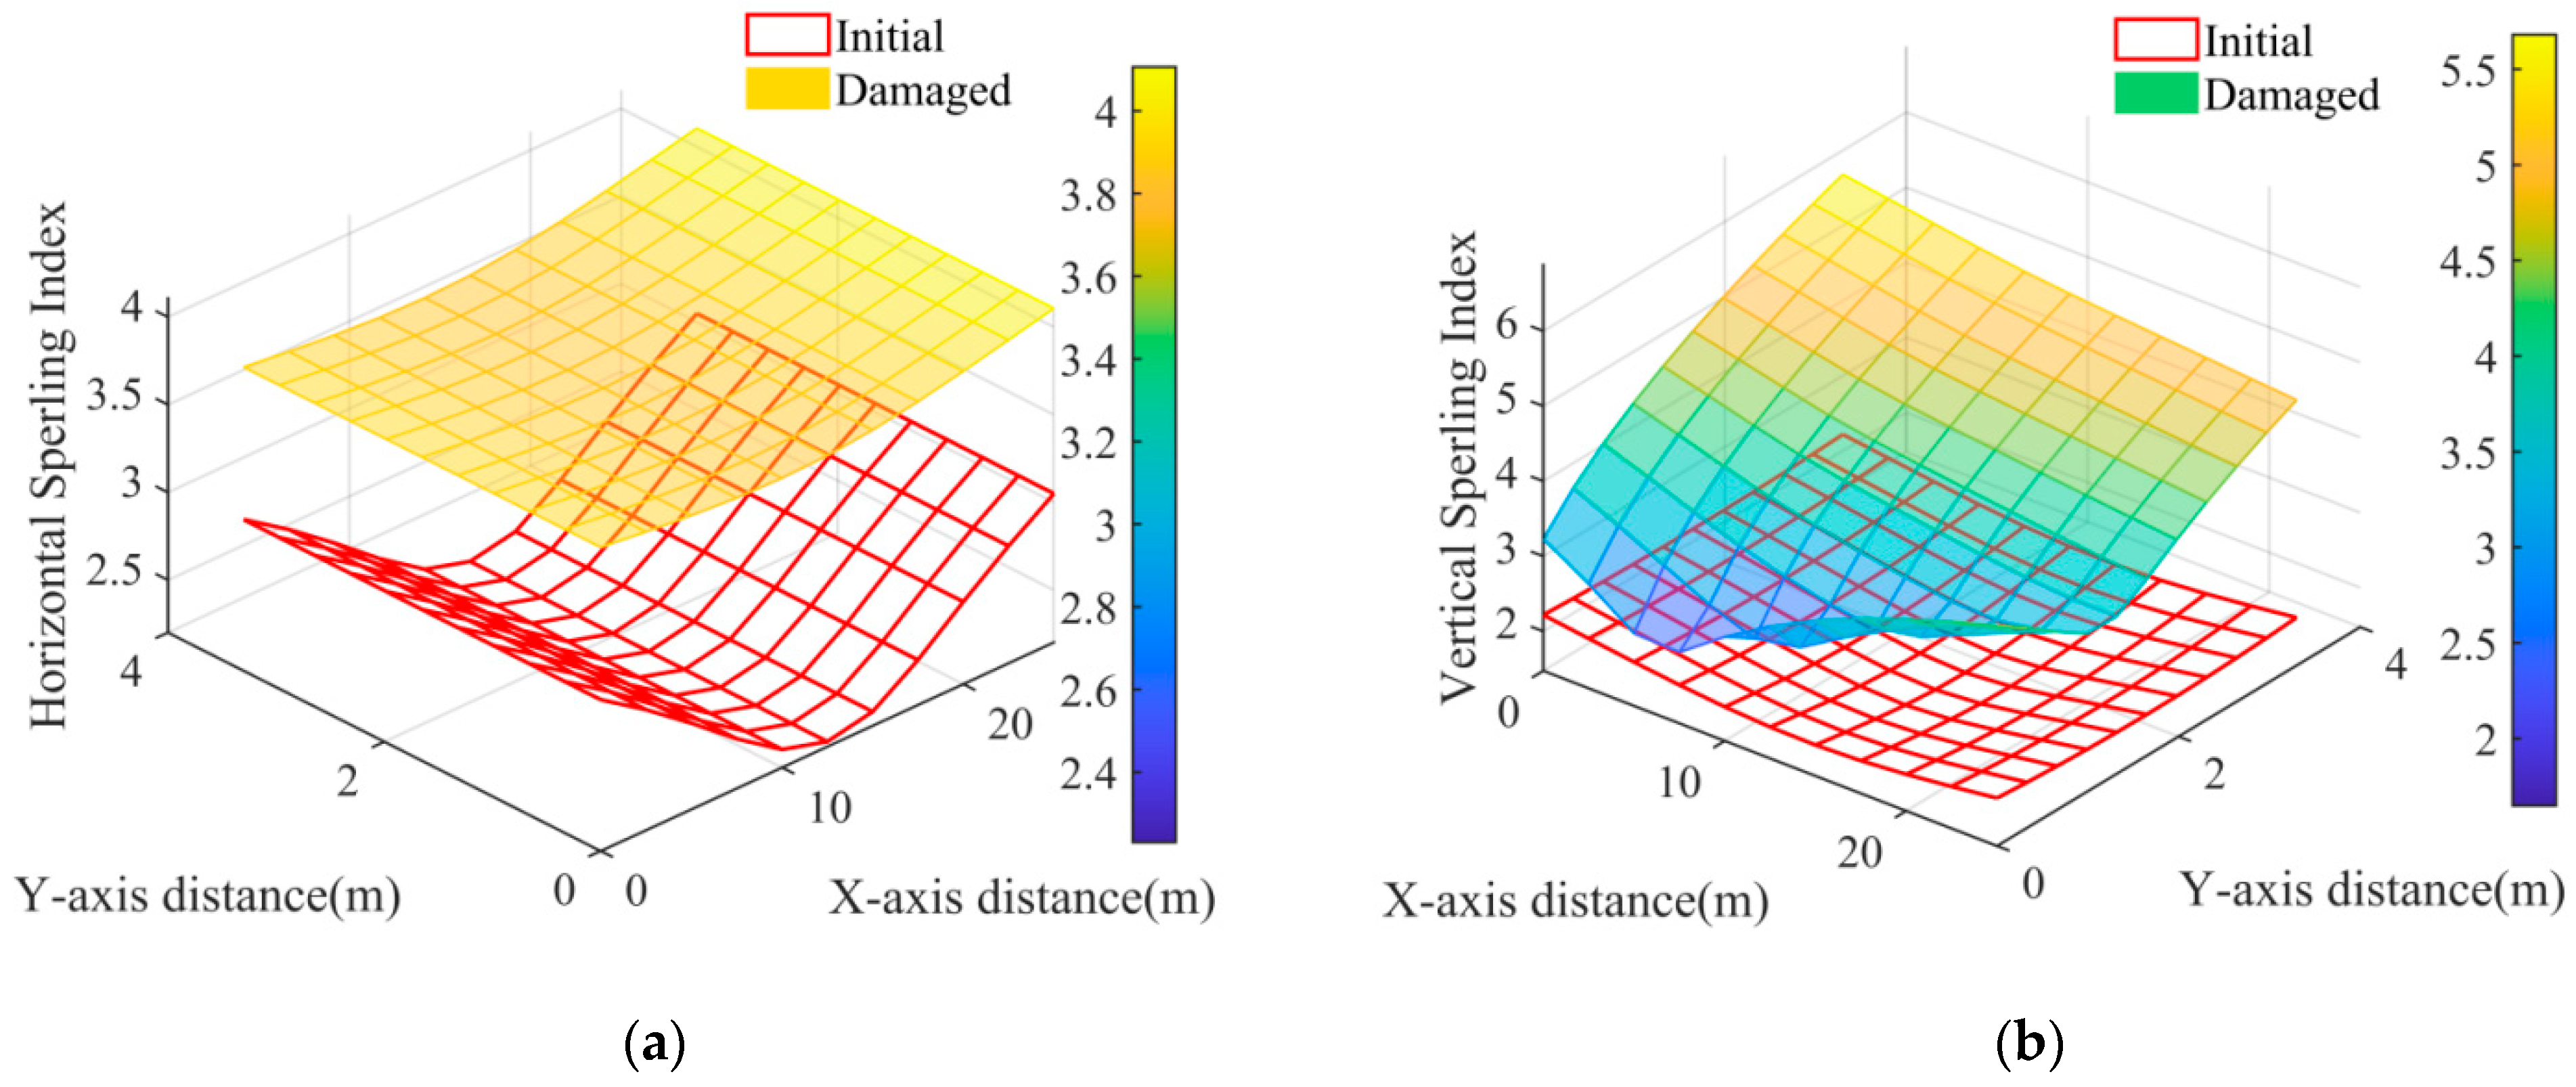
In this case, a vehicle element was simulated using the PEM to traverse a track with a Grade-6 track irregularity for 5 s at a speed of 250 km/h and compare the effects of the original secondary suspension system (dfk = 1 and dfc = 1) and the damaged secondary suspension system (dfk = 10 and dfc = 0.1) on the zonal distribution of the car body’s Sperling index, as shown in Figure 10. In Figure 10, it can be seen that:
  • In Figure 10a, the symmetrical characteristic of the network of the horizontal Sperling index after damage to a vertical spring damper in the secondary suspension system was still consistent with the initial condition, but the overall magnitude of the horizontal Sperling index was much higher than the initial condition. This was because the damaged vertical spring damper affected the lateral car-body sway by influencing the car-body roll in conjunction with the vertical car-body sway;
  • It can be seen in Figure 10b that after the damage to the vertical spring damper in the secondary suspension system, the network of the vertical Sperling index could not maintain the uniformly curved surface as in the initial state, and reached the highest values when the damaged spring damper was located and gradually decreased toward the areas where the other healthy vertical spring dampers were located. The overall magnitude of the vertical Sperling index far exceeded that of the initial condition;
  • In general, the damage to the secondary suspension system led to an overall deterioration in the train comfort for both the horizontal and vertical components, even if only one local vertical spring damper in the secondary suspension system was damaged. The comfort of the train suffered more on the side where the damage occurred. The train comfort for the horizontal and vertical components were not independent of each other. Therefore, it is important to consider both components comprehensively when optimizing the train comfort.

5. Conclusions

This study established a spatial train model that adopted the random vibration method to study the zonal distribution of train comfort; the model could overcome the uncertainty caused by the randomness of track irregularities and the zonal difference in the vibratory acceleration in a car body. Our relevant conclusions are as follows:
  • Compared with the Monte Carlo method and depending on a large amount of samples, the pseudo-excitation Method, based on the linearity of the power spectrum density of the car-body vibratory acceleration, was more efficient to derive the accurate zonal distribution of the Sperling index.
  • The realistic evaluation of train comfort can be roughly characterized by the average value of the Sperling index during train operation, while the theoretical design of train comfort can be accurately determined using the pseudo–excitation method.
  • The vibration acceleration of the train during track irregularities is a stationary Gaussian random process with a zero mean value, the statistical properties of which can be described by the 3σ–principle.
  • The Sperling index is a stationary indicator of comfort that is independent of the order of the vehicle elements when the train is subjected to a track irregularity. In this way, train comfort can be characterized by simply selecting a vehicle element to analyze.
  • The zonal distribution of train comfort is not strictly symmetrical with respect to the center of the car body. The most comfortable area for the vertical component was located near the front of the center of the car body, while the most comfortable area for the horizontal component was located on the axis of the tilt axis of the center of the car-body center.
  • The comfort of the train deteriorated with a loss in mass of the Car-Body and with irregularities in the tracks, while reasonable control of the train speed, regular maintenance of the tracks, and reasonable distribution of the number of passengers when changing trains improved the comfort of the train.
  • The overall comfort of the train deteriorated even if only one local vertical spring damper in the secondary suspension system was damaged. It suffered more on the side where the damage was present. The comfort of the train was not independent of the horizontal and vertical components. To optimize the comfort of the train, it is therefore important to consider both components comprehensively.

Author Contributions

Z.W. came up with the concept, realized the simulation, analyzed the data, and edited the draft of manuscript. N.Z. conducted the literature review, checked the computations, wrote the draft of the manuscript, replied to reviewers’ comments, and revised the final version. J.Y. verified the simulated data and polished the article. V.P. corrected the model of simulation and debugged the programming. All authors have read and agreed to the published version of the manuscript.

Funding

This project received funding from the National Natural Science Foundation of China (Grant No. 52178101).

Institutional Review Board Statement

Not applicable.

Informed Consent Statement

Not applicable.

Data Availability Statement

The data presented in this study are available upon request from the corresponding author.

Acknowledgments

We thank the National Natural Science Foundation of China for the support of this work.

Conflicts of Interest

The authors declare no conflict of interest.

References

  1. Albers, A.; Lerspalungsanti, S.; Düser, T.; Ott, S.; Wang, J. A Systematic Approach to Support Drive Train Design Using Tools for Human Comfort Evaluation and Customer Classification. In Proceedings of the ASME 2008 International Design Engineering Technical Conferences and Computers and Information in Engineering Conference, Brooklyn, NY, USA, 3–6 August 2008; pp. 651–662. [Google Scholar] [CrossRef]
  2. Lee, Y.; Shin, K.; Song, Y.; Han, S.; Lee, M. Research of Ride Comfort for Tilting Train Simulator Using ECG. IFMBE Proc. 2009, 22, 1906–1909. [Google Scholar] [CrossRef]
  3. Yu, Y.L.; He, W. Comfortable Evaluation of Bridge-Station Combined Large Span High Speed Railway Station under High Speed Train Load. Appl. Mech. Mater. 2013, 477–478, 727–731. [Google Scholar] [CrossRef]
  4. Lu, L. The effects forthe ride comfort of high-speed trains’ operating conditions on the open and tunnel track. In Proceedings of the 2015 12th IEEE International Conference on Electronic Measurement & Instruments (ICEMI), Qingdao, China, 16–18 July 2015; Volume 3, pp. 1344–1349. [Google Scholar] [CrossRef]
  5. Ni, Y.; Ye, S.; Song, S. An experimental study on constructing MR secondary suspension for high-speed trains to improve lateral ride comfort. Smart Struct. Syst. 2016, 18, 53–74. [Google Scholar] [CrossRef]
  6. Bao, Y.; Zhai, W.; Cai, C.; Zhu, S.; Li, Y. Dynamic interaction analysis of suspended monorail vehicle and bridge subject to crosswinds. Mech. Syst. Signal Process. 2021, 156, 107707. [Google Scholar] [CrossRef]
  7. Huang, J.; Zhou, X.; Shang, L.; Wu, Z.; Xu, W.; Wang, D. Influence analysis of track irregularity on running comfort of Maglev train. Transp. Syst. Technol. 2018, 4, 129–140. [Google Scholar] [CrossRef]
  8. Zhu, Y.; Chen, G.; Li, X.; Lu, Y.; Liu, J.; Xu, T. Comfort assessment for rehabilitation scaffold in road-railway bridge subjected to train-bridge-scaffold coupling vibration. Eng. Struct. 2020, 211, 110426. [Google Scholar] [CrossRef]
  9. Alehashem, S.M.S.; Ni, Y.Q.; Liu, X.Z. A Full-Scale Experimental Investigation on Ride Comfort and Rolling Motion of High-Speed Train Equipped With MR Dampers. IEEE Access 2021, 9, 118113–118123. [Google Scholar] [CrossRef]
  10. Peng, Y.; Wu, Z.; Fan, C.; Zhou, J.; Yi, S.; Peng, Y.; Gao, K. Assessment of passenger long-term vibration discomfort: A field study in high-speed train environments. Ergonomics 2022, 65, 659–671. [Google Scholar] [CrossRef] [PubMed]
  11. Lu, Y.; Xiang, P.; Dong, P.; Zhang, X.; Zeng, J. Analysis of the effects of vibration modes on fatigue damage in high-speed train bogie frames. Eng. Fail. Anal. 2018, 89, 222–241. [Google Scholar] [CrossRef]
  12. Li, Y.-C.; Feng, S.-J.; Chen, H.-X.; Chen, Z.-L.; Zhang, D.-M. Random vibration of train-track-ground system with a poroelastic interlayer in the subsoil. Soil Dyn. Earthq. Eng. 2019, 120, 1–11. [Google Scholar] [CrossRef]
  13. Li, Y.; Liu, Y.; He, G.; Chen, J.; Peng, X. Multipoint Random Vibration Analysis of Train Converter Equipment. In Proceedings of the 2019 IEEE Vehicle Power and Propulsion Conference (VPPC), Hanoi, Vietnam, 14–17 October 2019; pp. 1–3. [Google Scholar] [CrossRef]
  14. Tan, S.; Yu, Z.; Shan, Z.; Mao, J. Influences of train speed and concrete Young’s modulus on random responses of a 3D train-track-girder-pier coupled system investigated by using PEM-ScienceDirect. Eur. J. Mech. A/Solids 2018, 74, 297–316. [Google Scholar] [CrossRef]
  15. Jin, T.; Liu, Z.; Sun, S.; Ren, Z.; Deng, L.; Yang, B.; Christie, M.D.; Li, W. Development and evaluation of a versatile semi-active suspension system for high-speed railway vehicles. Mech. Syst. Signal Process. 2019, 135, 106338. [Google Scholar] [CrossRef]
  16. Arnaud, W. Hamiltonian Monte Carlo with application to train-track-bridge coupled interactions subjected to seismic excitation with uncertainties. 2021; preprint. [Google Scholar] [CrossRef]
  17. Yao, J.; Fang, L. Building Vibration Prediction Induced by Moving Train with Random Forest. J. Adv. Transp. 2021, 2021, 6642071. [Google Scholar] [CrossRef]
  18. Guo, G.; Cui, X.; Du, B. Random-Forest Machine Learning Approach for High-Speed Railway Track Slab Deformation Identification Using Track-Side Vibration Monitoring. Appl. Sci. 2021, 11, 4756. [Google Scholar] [CrossRef]
  19. Xia, H.; Zhang, N.; Guo, W. Dynamic Interaction of Train-Bridge Systems in High-Speed Railways: Theory and Applications; Springer: Berlin/Heidelberg, Germany, 2018. [Google Scholar] [CrossRef]
  20. Lin, J.; Zhang, Y.; Li, Q.; Williams, F. Seismic spatial effects for long-span bridges, using the pseudo excitation method. Eng. Struct. 2004, 26, 1207–1216. [Google Scholar] [CrossRef]
  21. Feng, Z.; Xiao, H. Analysis of Stability and Vibration Transmission Law of Type A Metro Vehicles. J. Phys. Conf. Ser. 2021, 1846, 012029. [Google Scholar] [CrossRef]
  22. Gerekos, C.; Bruzzone, L.; Imai, M. A Coherent Method for Simulating Active and Passive Radar Sounding of the Jovian Icy Moons. IEEE Trans. Geosci. Remote Sens. 2019, 58, 2250–2265. [Google Scholar] [CrossRef]
  23. Koyama, A.; Nicholson, D.A.; Andreev, M.; Rutledge, G.C.; Fukao, K.; Yamamoto, T. Discretized Wiener-Khinchin theorem for Fourier-Laplace transformation: Application to molecular simulations. arXiv 2020, arXiv:2004.097922020. [Google Scholar] [CrossRef]
  24. Wang, T. Impact in a railway truss bridge. Comput. Struct. 1993, 49, 1045–1054. [Google Scholar] [CrossRef]
  25. GB/T-5599-2019; Specification for Dynamic Performance Assessment and Testing Verification of Rolling Stock. Standardization Administration: Beijing, China, 2019.
  26. Leibovich, N.; Barkai, E. Aging Wiener-Khinchin Theorem. Phys. Rev. Lett. 2015, 115, 080602. [Google Scholar] [CrossRef] [PubMed] [Green Version]
Figure 1. Vehicle element model: (a) front view; (b) lateral view; (c) top view.
Applsci 12 07442 g001
Figure 2. Linear zonal relation model of car-body motion between the center and a certain point. (a) front view of car-body motion of the vertical levitation and the pitch; (b) lateral view of car-body motion of the vertical levitation and the roll; (c) top view of car-body motion of the lateral sway and the yaw.
Applsci 12 07442 g002
Figure 3. Illustrations of track irregularities: (a) vertical profile; (b) alignment; (c) cross-level.
Applsci 12 07442 g003
Figure 4. Car-Body center vertical and horizontal vibratory acceleration responses: (a) history samples distribution for the horizontal; (b) possibility density curve for the horizontal; (c) history samples distribution for the vertical; (d) possibility density curve for the horizontal.
Applsci 12 07442 g004
Figure 5. Car-body center Sperling index as the function of the order of vehicle element using MCM and PEM: (a) horizontal Sperling index; (b) vertical Sperling index.
Applsci 12 07442 g005
Figure 6. Zonal distribution of car-body Sperling index using MCM and PEM: (a) horizontal Sperling index; (b) vertical Sperling index.
Applsci 12 07442 g006
Figure 7. Zonal distribution of car-body Sperling index as influenced by the quality of the track irregularities using PEM: (a) horizontal Sperling index; (b) vertical Sperling index.
Applsci 12 07442 g007
Figure 8. Zonal distribution of car-body Sperling index influenced by the train speed according to PEM: (a) horizontal Sperling index; (b) vertical Sperling index.
Applsci 12 07442 g008
Figure 9. Zonal distribution of car-body Sperling index influenced by the addition of the car-body mass using PEM: (a) horizontal Sperling index; (b) vertical Sperling index.
Applsci 12 07442 g009
Figure 10. Zonal distribution of Car-Body Sperling index influenced by the damage of a vertical spring damper in secondary suspension system using PEM: (a) horizontal Sperling index; (b) vertical Sperling index.
Applsci 12 07442 g010
Table 1. The DOFs of a vehicle element.
Vehicle Element iDOF
Car body5 DOFs: yci, zci, θci, φci, ψci 1
Bogies10 DOFs: yfbi, zfbi, θfbi, φfbi, ψfbi, yrbi, zrbi, θrbi, φrbi, ψrbi
Wheel sets12 DOFs: yw1i, zw1i, θw1i, yw2i, zw2i, θw2i, yw3i, zw3i, θw3i, yw4i, zw4i, θw4i
1 y is the lateral sway, z is the vertical levitation, θ is the roll, φ is the pitch, and ψ is the yaw. Subscript “f” and “r” respectively denote the front and the rear bogie, while the numbers represent the orders of wheel sets. Subscript i denotes the number of a certain vehicle element and equals 1, 2, 3 … 8. Back-and-forth along the x-axis was neglected because the train ran at a constant speed according to the 7th assumption. Subscripts “c”, “b”, and “w”, respectively refer to “car body”, “bogies”, and “wheel sets”.
Table 2. Parameters of the PSDs of track irregularities defined in FRA standard.
ItemsGrade-1Grade-2Grade-3Grade-4Grade-5Grade-6
Alignment roughness constant Aa1.211 × 10−41.018 × 10−40.682 × 10−40.538 × 10−40.210 × 10−40.034 × 10⁻⁴
Vertical roughness constant Av3.363 × 10−41.211 × 10−40.413 × 10−40.303 × 10−40.076 × 10−40.034 × 10⁻⁴
Cutoff angular wave number nc0.60460.9308 0.85201.13120.82090.4380
Cutoff angular wave number ns0.82450.82450.82450.82450.82450.8245
Table 3. Parameters of the train operation.
ItemsValues
Half of longitudinal distance of wheel sets d11.25 m
Half of longitudinal distance of bogies d28.75 m
Half of lateral distance of springs in 1st suspension system b11.00 m
Half of lateral distance of springs in 2nd suspension system b21.00 m
Vertical distance, car body center to 2nd suspension system h10.80 m
Vertical distance, 2nd suspension system to bogie center h20.20 m
Vertical distance, bogie center to 1st suspension system h30.10 m
Mass of wheel set mw2000 kg
Mass of bogie mb3000 kg
Moment of inertia of bogie in longitudinal direction Ibx3000 kg·m2
Moment of inertia of bogie in lateral direction Iby3000 kg·m2
Moment of inertia of bogie in vertical direction Ibz3000 kg·m2
Mass of car body mb40 t·m2
Moment of inertia of car body in longitudinal direction Icx100 t·m2
Moment of inertia of car body in lateral direction Icy2000 t·m2
Moment of inertia of car body, about vertical direction Icz2000 t·m2
Longitudinal damping of 1st suspension system/bogie side cx1 1 kN·s/m
Lateral damping of 1st suspension system/bogie side cy11 kN·s/m
Vertical damping of 1st suspension system/bogie side cz120 kN·s/m
Longitudinal damping of 2nd suspension system/car-body side cx260 kN·s/m
Lateral damping of 2nd suspension system/car-body side cy260 kN·s/m
Vertical damping of 2nd suspension system/car-body side cz210 kN·s/m
Longitudinal stiffness of 1st suspension system/bogie side kx11000 kN/m
Lateral stiffness of 1st suspension system/bogie side ky11000 kN/m
Vertical stiffness of 1st suspension system/bogie side kz11000 kN/m
Longitudinal stiffness of 2nd suspension system/car-body side kx2200 kN/m
Lateral stiffness of 2nd suspension system/car-body side ky2200 kN/m
Vertical stiffness of 2nd suspension system/car-body side kz2200 kN/m
Lower limit of angular wave number nminπ/V rad/m
Upper limit of angular wave number nmax80π/V rad/m
Sampling rate of angular wave number dn2π/5V rad/m
Lower limit of time tmin0 s
Upper limit of time tmax10 s
Time sampling rate dt1/80 s
Publisher’s Note: MDPI stays neutral with regard to jurisdictional claims in published maps and institutional affiliations.