Article

Numerical Investigation on the Spudcan Penetration into Sand Overlying Clay Considering the Strain Effects

1
College of Ocean Science and Engineering, Shanghai Maritime University, Shanghai 201306, China
2
School of Mechanical Engineering, Beijing Institute of Petrochemical Technology, Beijing 102617, China
3
School of Mechanical and Electrical Engineering, Dezhou University, Dezhou 253023, China
*
Author to whom correspondence should be addressed.
Appl. Sci. 2022, 12(15), 7454; https://doi.org/10.3390/app12157454
Submission received: 23 June 2022 / Revised: 22 July 2022 / Accepted: 22 July 2022 / Published: 25 July 2022
(This article belongs to the Section Marine Science and Engineering)

Abstract

:

Featured Application

Numerical analysis of offshore geotechnical engineering in sand.

Abstract

A numerical model with a Coupled Eulerian–Lagrangian (CEL) approach is proposed for spudcan penetration into sand overlying clay. Both stress-dependence and strain-softening effects are incorporated into the M–C model to describe the sand, whereas the Tresca model with softening effect is used to describe the clay. Effects of the critical state strain threshold in the strain-softening model of sand and the clay sensitivity in the strain-softening model for clay are investigated. The model is verified against different soil conditions: uniform sand, loose sand overlying clay, and dense sand overlying clay. It is found that the stress-dependence effect dominates shallow penetration, whereas the strain-softening effect dominates deep penetration. The assumption of a constant peak friction angle for the accumulated deviatoric plastic strain less than the threshold of peak friction angle leads to an overestimation of the resistance in loose sand. Furthermore, the fit parameter obtained from triaxial tests tends to underestimate the peak resistance in dense sand. The proposed model should provide a valuable tool for geotechnical engineering analysis in sand.

1. Introduction

Owing to their mobile, efficient, and economical nature, jack-up rigs are widely employed for offshore oil and gas exploration in water up to 150 m deep. To guarantee its stability during operation, the jack-up rig is usually preloaded to enable the spudcan to penetrate deeply into the seabed. However, the preloading process is still one of the most dangerous procedures of a jack-up rig’s operation due to frequent accidents, including punch-through and sliding. Punch-through refers to the rapid penetration of the jack-up rig’s leg during preloading, which often occurs in a strong layer overlying weak layers [1,2]. Severe punch-through may induce structural damage, capsizing, and even human casualty.
A thin layer of sand overlying a weaker layer of clay is particularly hazardous for spudcan installation. Therefore, great efforts have been made to find the mechanism and a prediction method. At the early stage, many studies with 1 g tests [3,4,5,6] were performed, although with the inherent disadvantage of simulating the high-stress status of in-site sands. As centrifuge tests have the advantages of simulating the stress-dependent behavior of sand, the soil back-flow during penetration, and the surcharge pressure of the overburden soil, centrifuge tests [7,8,9,10,11] were conducted to study the foundation penetration in sand overlying clay after 1990. Craig and Chua [7] conducted a series of tests and concluded that a small, tapered sand plug with a depth equal to the initial sand layer thickness moved into the clay layer at deep penetration (penetration depth beyond the sand–clay interface). Teh et al. [9] observed a truncated cone sand plug, and the failure mechanism of spudcan foundation on dense sand overlying clay was discussed. Lee et al. [10] performed more tests of spudcan penetration in dense sand overlying clay and proposed a simplified conceptual model for the bearing capacity on dense sand overlying clay. Hu et al. [12] performed more tests of spudcan penetration in medium-loose sand overlying clay and extended the model proposed by Lee et al. [13] to medium-loose sand overlying clay. Yin et al. conducted field tests of spudcan penetration in sand overlying clay [14], providing valuable references for future study. These tests are inadequate to cover all the spudcan foundations and the soil properties of the seabed. Therefore, tremendous numerical analyses were conducted to further study the problem and to propose prediction methods [1,15,16,17].
Many researchers tried to propose an accurate numerical model for the problem [18,19,20,21,22]. The numerical approaches used in these papers are RITSS and CEL. As reviewed by Wang et al. [23], RITSS and CEL agree well for quasi-static problems, so the main difference between these numerical models is the constitutive model of the soil, especially the sand. The constitutive models and the simulation performance models are compared in Table 1 and Figure 1, respectively. Both Yu et al. [18] and Tho et al. [19] used the M–C model for sand and the Tresca model for clay and obtained a similar prediction of the resistance profile in loose sand overlying clay. Hu et al. [21] used the M–C model for sand and incorporated the softening effect into the Tresca model of clay, with which the peak resistance is well captured; however, the post-peak resistance is overestimated. Qiu and Henke [20] used the hypoplastic model for sand and gave an accurate prediction of the peak resistance. However, the post-peak resistance is also significantly overestimated. To improve the prediction of post-peak resistance, Qiu and Grabe [24] employ the viscohypoplastic model for clay. It predicts smaller resistance for the post-peak stage than Qiu and Henke [20], but it is still much larger than the test. Zhao et al. (2019) [22] subsequently tried some other constitutive models for the sand and clay material, as summarized in Table 1.
This paper takes into account the strain effect for both loose and dense sand and proposes a numerical model for spudcan penetration, which can capture both the peak bearing resistance and the post-peak behavior. In Section 2, the numerical methodology is proposed based on the CEL approach. The CEL model is implemented with a new constitutive model of sand, taking into account both the stress-dependence and strain softening. In Section 3, sensitivity analysis is conducted. The influence of mesh density, the critical state thresholds of the sand model, and the clay sensitivity on the prediction accuracy of the numerical model is investigated. In Section 4, the performance of the numerical model is investigated with validations against experimental data of centrifuge tests for different soil conditions, including uniform sand, loose sand overlying clay, and dense sand overlying clay. Finally, the main findings and limitations of the paper are concluded.

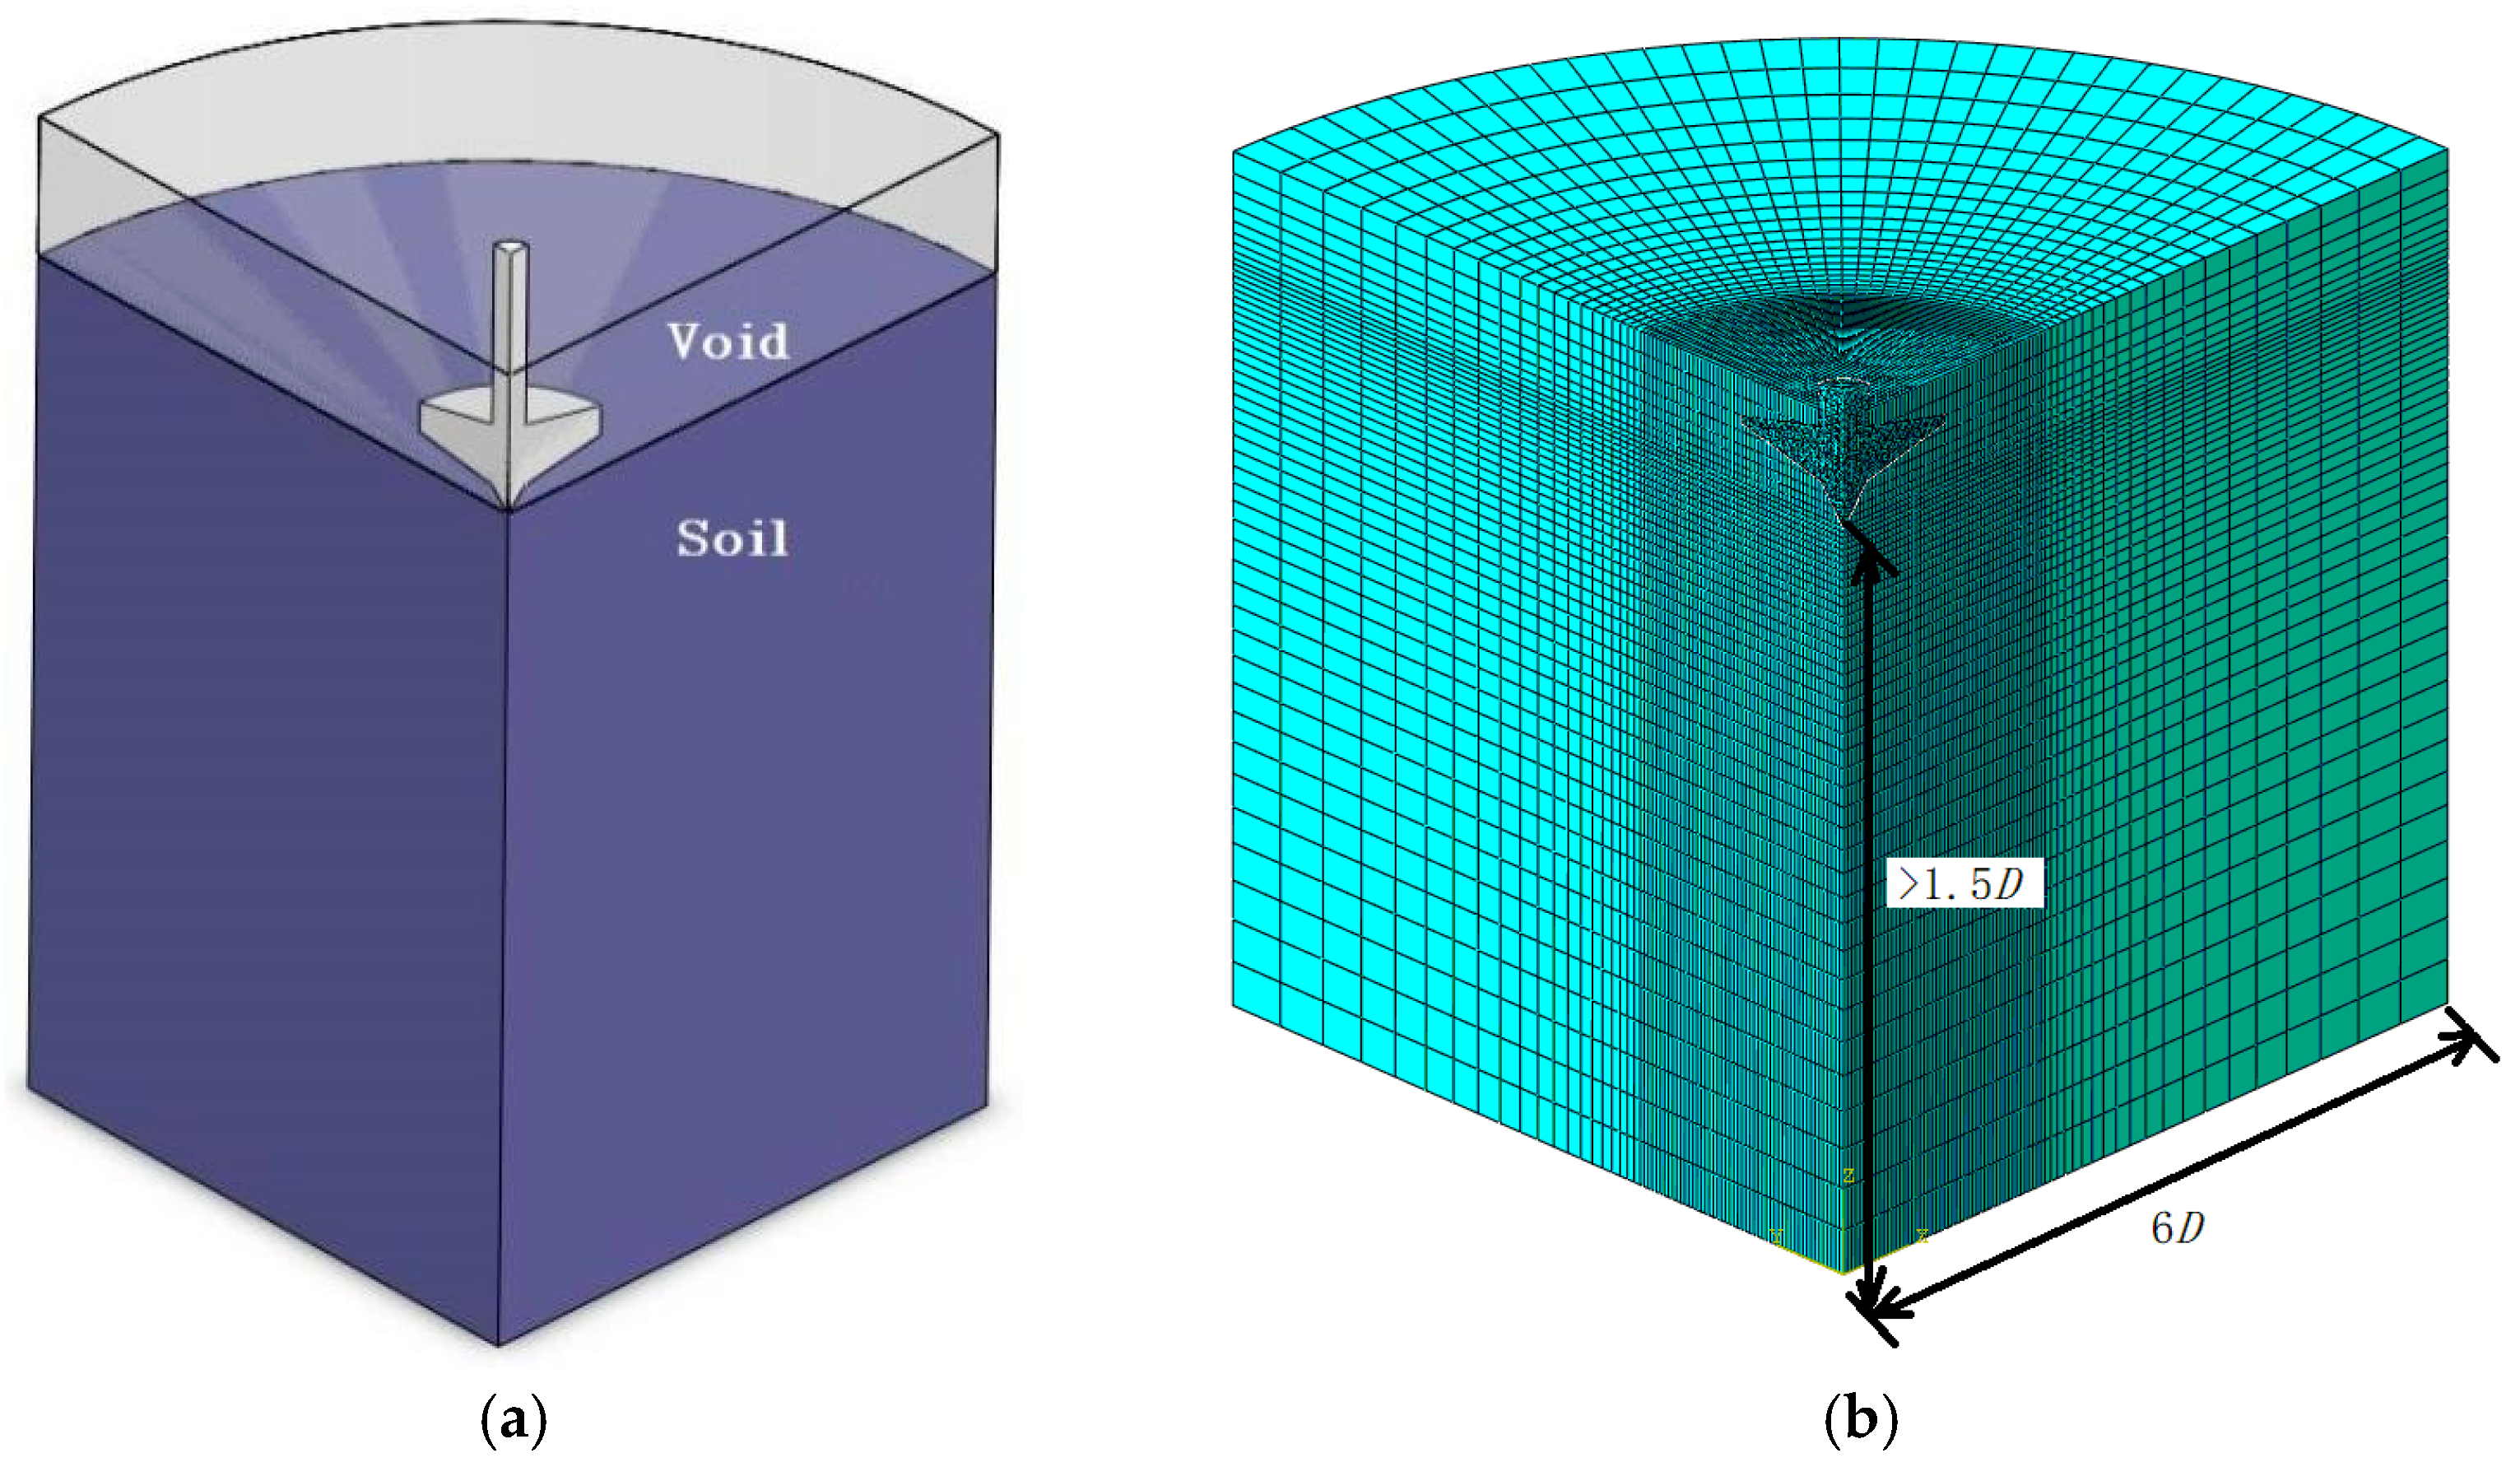
2. Numerical Methodology

2.1. Implementation of the CEL Approach

The CEL approach is provided by the commercially available software Abaqus, in which an Eulerian domain can be coupled with Lagrangian domains in the same model. Qiu et al. [29] and Tho [19] verified its applications in geotechnical problems and spudcan penetration, respectively. In the present model, the spudcan is modeled as a Lagrangian part, while the soil is modeled as an Eulerian part. Eulerian mesh is fixed in the space and allows the soil material to flow through the elements, which can avoid mesh distortion induced in the Lagrangian approach. An Eulerian element can comprise several materials, of which the element volume fraction (EVF) is employed to describe the composition of each element. In contrast, a Lagrangian element can only have one material and deforms with the material. However, during analysis, the spudcan is constrained as a rigid body, as its deformation is not significant and of concern. Moreover, the EVF of each soil material in each Eulerian element is tracked and recorded.
The CEL approach with Abaqus can only support 8-node linear hexahedron elements, which implies that only a 3D model is supported by the CEL approach. Due to the symmetry of the problem, only one-fourth of the spudcan and soil are modeled. The Eulerian part is initially divided into the void region and soil region, as shown in Figure 2a. To allow soil berm development at the soil surface, the void region is initially configured with no soil. The soil region is filled with different soils in regard to the problem.
In the present model, the distance between the outer boundary to the spudcan center is 6D (D, the spudcan diameter), and the vertical distance between the soil base and the spudcan tip in all the cases is larger than 1.5D, as shown in Figure 2b. According to the studies by Ullah et al. [30,31], the boundary effect can be neglected in the present study. Therefore, unlike some previous models [32,33,34], the shearing on the boundaries can be neglected, and the boundary conditions of the model are set symmetric, which can avoid soil leakage during analysis. The Eulerian domain is discretized with 8-node linear hexahedron elements with reduced integration and hourglass control (EC3D8R). As shown in Figure 2b, the mesh of the region within 2D to the spudcan center is refined, and the influence of mesh density will be discussed later.
During each incremental step of the CEL approach, an updated Lagrangian calculation is firstly conducted with an explicit integration scheme, followed by an advective Eulerian phase to map the solution variables (such as material properties, stresses, strains, velocities, and accelerations). The Eulerian material boundaries and interfaces are tracked and updated by updating the element volume fraction of each material. Similarly, the contact interface between the soil and spudcan is updated continuously with the “general contact” algorithm, which is based on a frictional contact with the Coulomb friction model using the penalty method. The frictional contact is described by defining a roughness factor in Equation (1):
α = tan δ / tan ϕ
in which δ is the friction angle between sand and spudcan, ϕ′ is the effective friction angle of sand.
The spudcan will always be in contact with the sand after penetrating the sand layer. Hu et al. (2014) have demonstrated that the shape and volume of the sand plug depend on the roughness of the spudcan [11]. The rougher the spudcan is, the less the strength mobilization is induced in the sand layer, and the more sand is trapped under the spudcan. The study also showed the resistance profile changes significantly by increasing α from 0 to 0.5 but insignificantly from 0.5 to 1. Therefore alpha = 0.5 is adopted in the present model, which is also consistent with the SNAME specification [35]. As the critical friction angle of sand at the contact interface will soon be mobilized, the critical value of the friction angle is used to calculate the friction coefficient of the Coulomb friction model.

2.2. Constitutive Models

For drained shear of dilating sands, it is common practice to compute the peak friction angle ϕ P as the sum of the critical state friction angle ϕ C and the dilatancy term ψ which depends on void ratio e and effective mean pressure p .
ϕ = ϕ c + ψ ( p , e )
A widely used expression in the form of Equation (2) is that of Bolton [36], which can be put in the form:
ϕ P = ϕ C + ϕ Ι R = ϕ C + ϕ ( I D ( Q ln ( p p r e f ) ) 1 ) ,   0 Ι R 4
Using the data of 17 soils, Bolton [36] proposed that the fit parameter Q = 10 , ϕ = 5 for plane strain and ϕ = 3 for triaxial strain, with reference pressure p r e f taken as 1 kPa. And the peak dilation angle ψ P is also a function of the relative dilatancy index Ι R :
ψ P = 0.8 ϕ Ι R = 0.8 ϕ ( I D ( Q ln ( p p r e f ) ) 1 )
in which I D is the relative density of sand. Negative value of Ι R indicates that large contractile strains will occur before ϕ C can be mobilized, which typically happens in loose sand.
For positive value of Ι R , the effective friction angle ϕ is larger than the critical friction angle ϕ C . However, if progressive failure occurs, all ϕ values in excess of ϕ C are transitory with larger strains, which is defined as strain softening behavior of the sand. As depicted in Figure 3, a simple model proposed by Conte et al. [37] is adopted to describe the softening behavior.
In the softening model shown in Figure 3, the effective friction angle ϕ and dilation angle Ψ changes with the accumulated deviatoric plastic strain k s h e a r . ϕ decreases from ϕ p to ϕ c as k s h e a r increases from k s h e a r p to k s h e a r c , whereas Ψ decreases from Ψ p to 0. The parameter k s h e a r is defined as follows:
k s h e a r = k ˙ s h e a r d t
in which
k ˙ s h e a r = 0.5 e i j p e i j p
t is time, and k ˙ s h e a r is the deviatoric plastic strain rate tensor, of which the expression is
e i j p = ε i j p 1 3 ε k k p δ i j
where δ i j is the Kronecker tensor, and ε k k p is the plastic deformation rate tensor.
Spudcan penetration involves large plastic strain in clay, which means that the strain softening effect of clay should be considered in the present model. The model proposed by Evian and Randolph [28] is incorporated into the present model as follows:
S u = [ δ r e m + ( 1 δ r e m ) exp ( 3 ξ ξ 95 ) ] S u 0
in which S u is the undrained shear strength of clay used for simulation, while S u 0 is the initial undrained shear strength of the clay; δ r e m is the residual degradation factor which is the inverse of soil sensitivity St; ξ is the accumulated plastic shear strain; and ξ 95 is the reference accumulated plastic shear strain which is taken as 10 [38,39].

3. Sensitivity Analysis

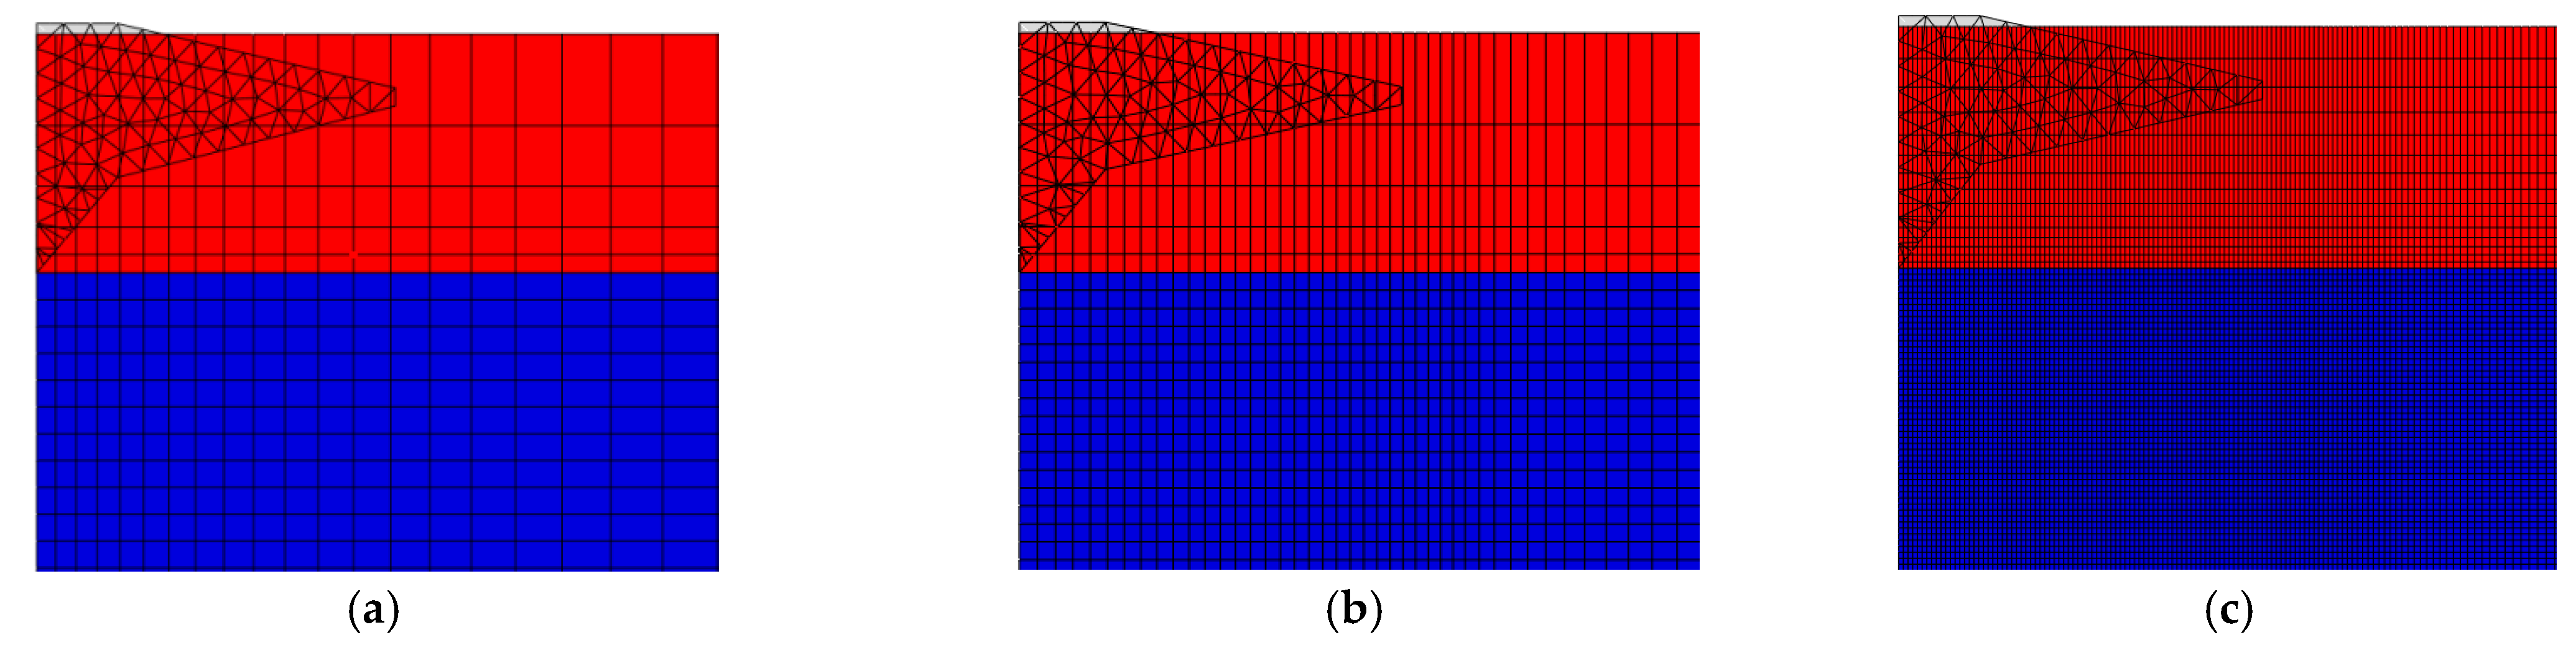
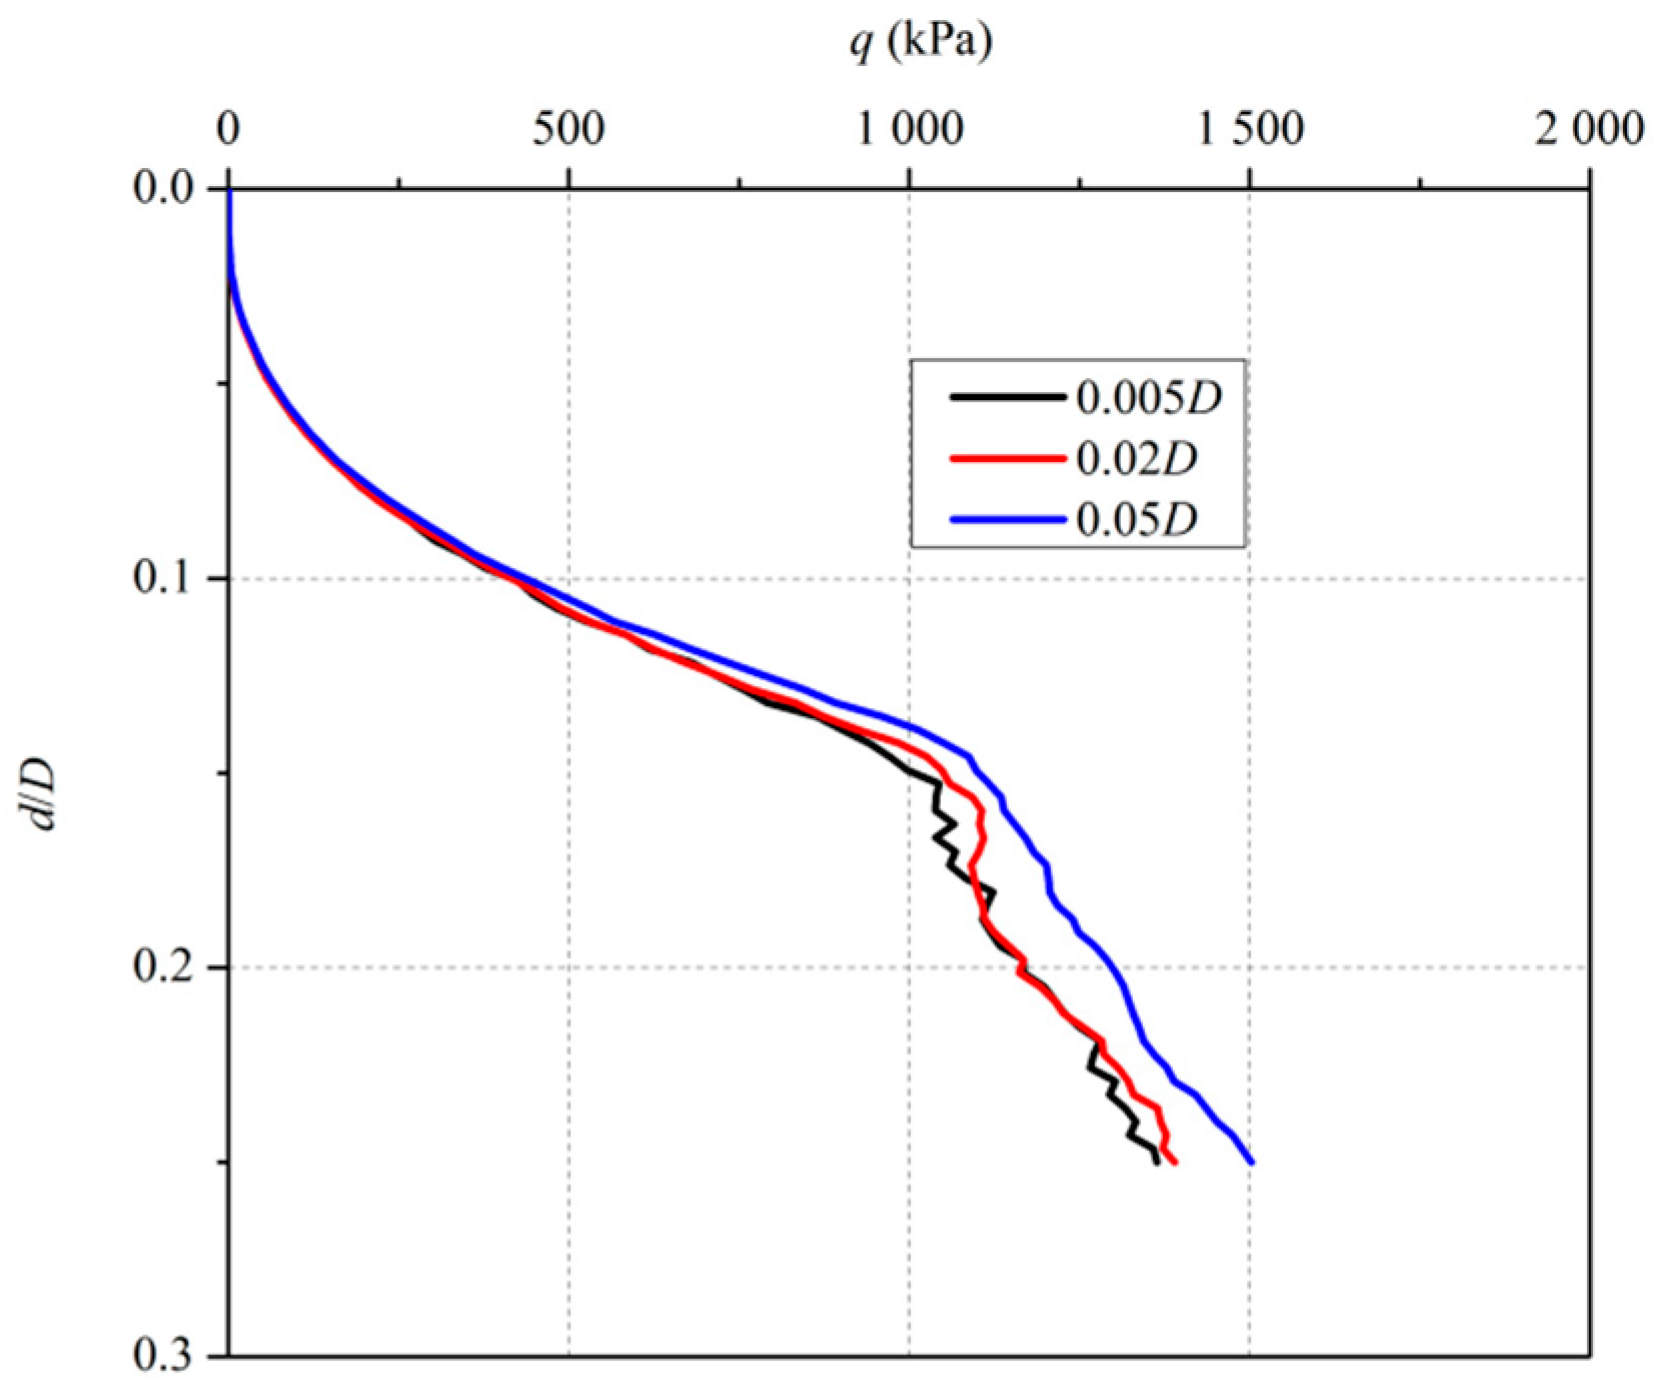
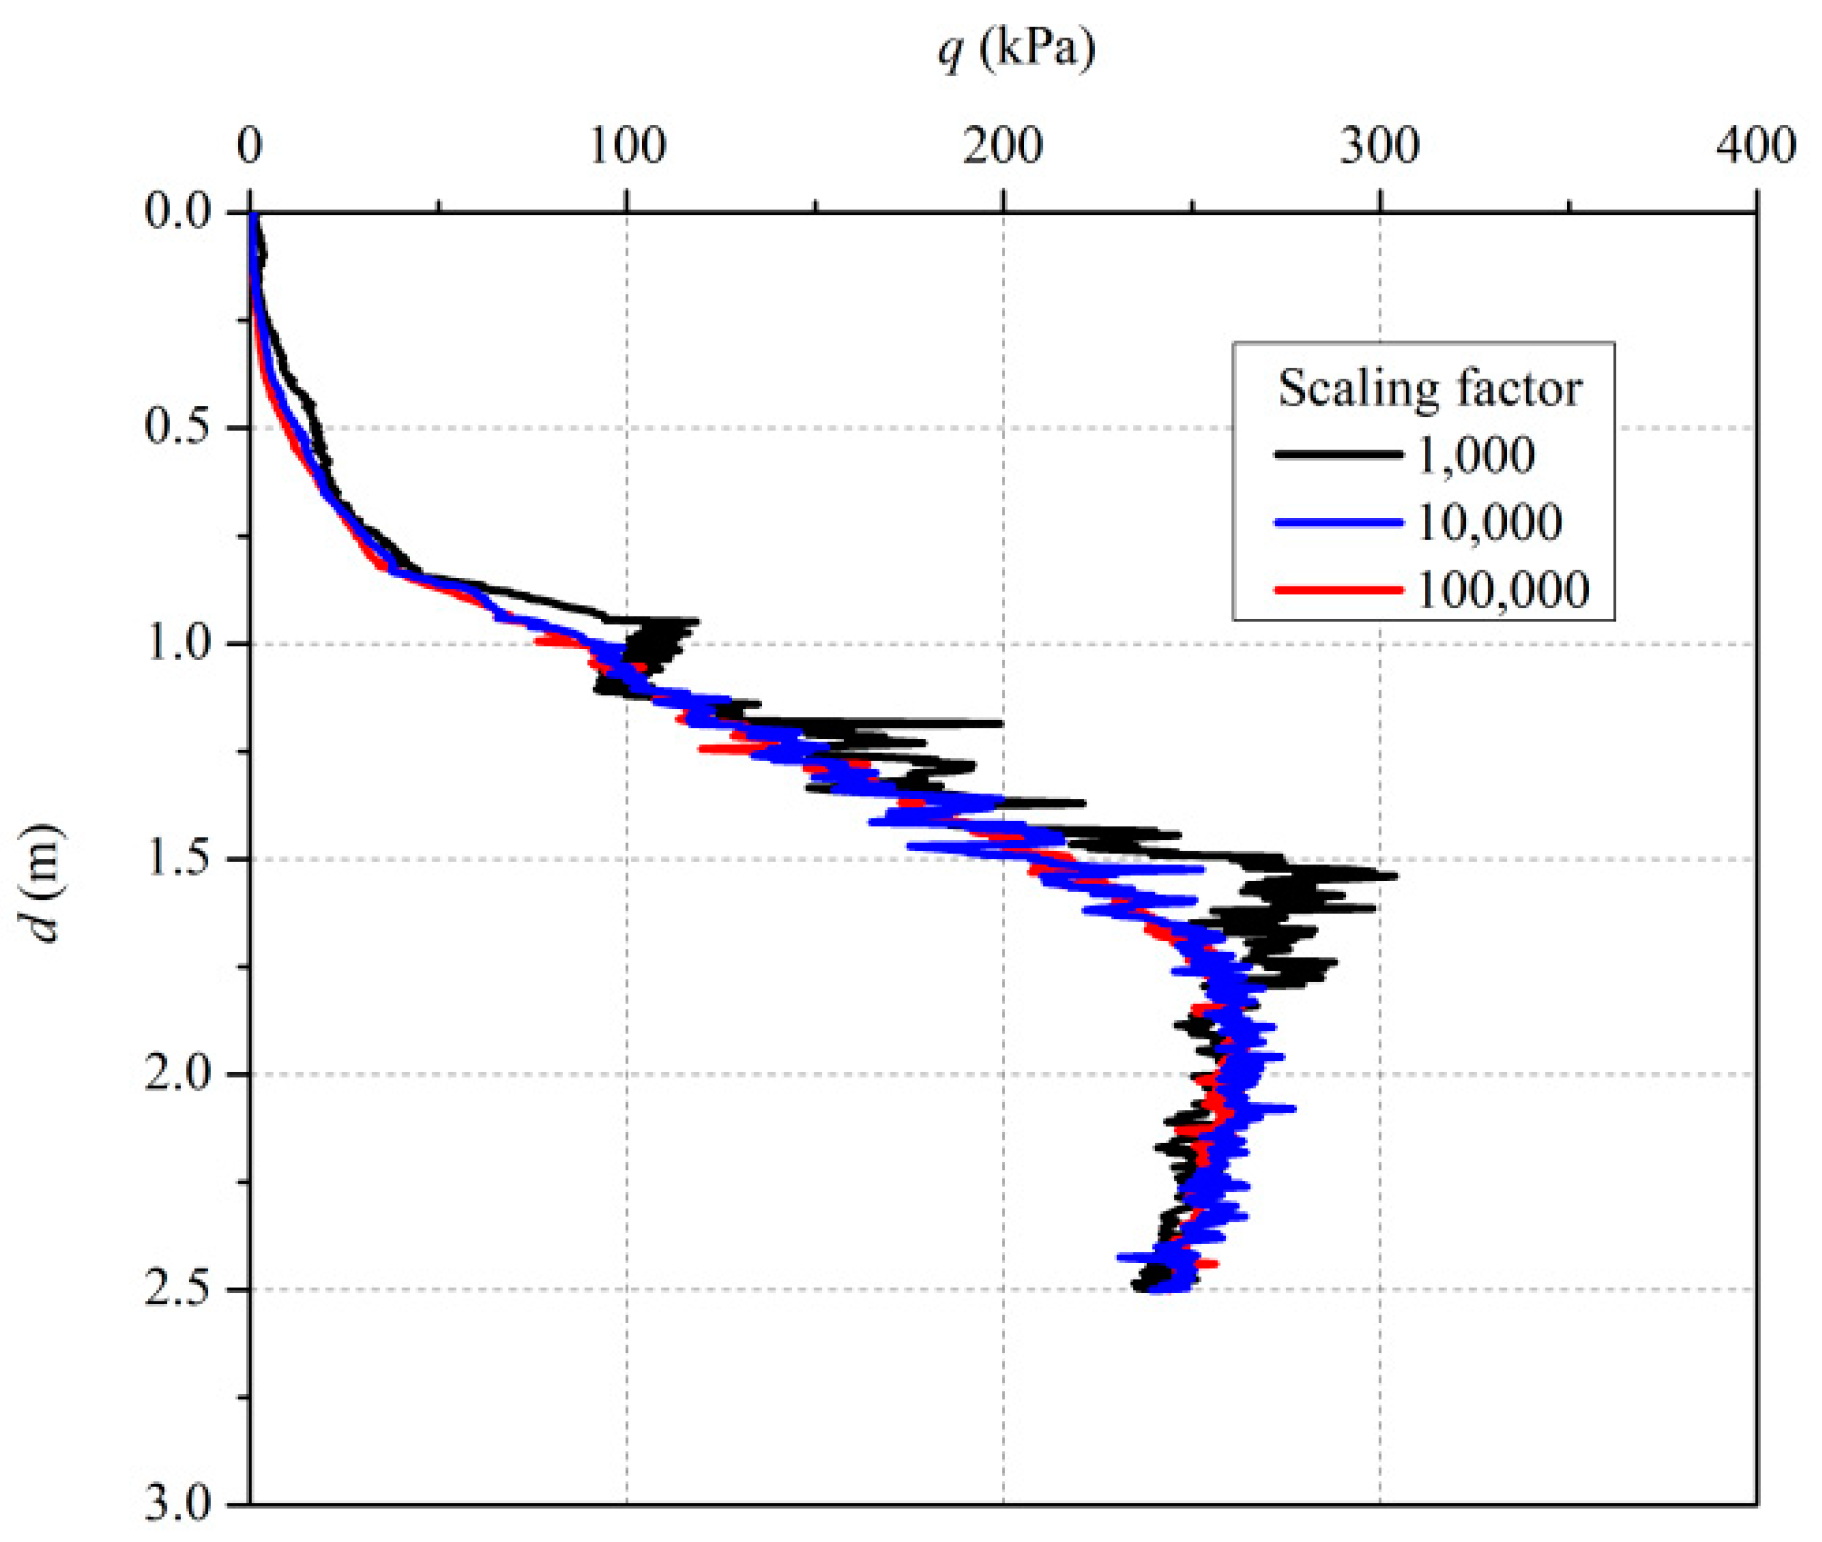
3.1. Mesh Convergence and Mass Scaling Effect

The mesh in the region close to the spudcan is refined to guarantee accuracy. Providing that the Coupled Eulerian–Lagrangian approach is also mesh-dependent, three cases of spudcan penetration in uniform sand are conducted with different mesh sizes close to the spudcan (0.05D, 0.02D, 0.005D), as shown in Figure 4. The red color in the figure represents zero filling of the element, while the blue color represents the full filling of the element with soil material.
As shown in Figure 5, the estimated resistance decreases with the mesh size. In the case of 0.02D, the resistance diverges less than 2% to 005D. It is implied that the mesh size of 0.02D is small enough to guarantee the prediction accuracy.
It is known that the computation cost reduces with an increased penetration rate. However, the increased penetration rate may have a significant influence on the result if the material is rate dependent. Alternatively, scaling the mass has the same effect as increasing penetration velocity. In Figure 6, 3 cases of different scaling factors, 1000, 10,000, and 100,000, are compared to each other. A scaling factor of 1000 and 10,000 show good resemblance to each other, while a scaling factor of 100,000 shows a significant inertia effect.
Based on the above analysis, a mesh size close to the spudcan of 0.02D and a mass scaling factor of 10,000 are selected for the analysis.

3.2. Effect of the Critical State Strain Threshold of Sand

The effect of the critical state strain threshold k s h e a r c of the sand strain softening model is studied. The critical threshold k s h e a r c describes how fast the critical state is mobilized. If the strain threshold of the critical state equals to the strain threshold of the peak friction angle, e.g., k s h e a r c = k s h e a r p , it implies immediate mobilization of critical state once the peak value is reached. If k s h e a r c = , it implies the non-strain softening of the sand. Assuming k s h e a r p = 0.18, the spudcan penetrations into dense sand overlying clay with different k s h e a r c are summarized in Figure 7. The peak resistance in the sand layer increases with the strain threshold of the critical state k s h e a r c and it converges at k s h e a r c = 0.5 to the case of non-strain softening of sand. The post-peak resistance in the sand layer also increases with the strain threshold of the critical state. However, it has little effect on the resistance in the underlying clay layer, which implies total mobilization of the critical state of sand.
The strain thresholds k s h e a r p and k s h e a r c strongly depend on the state of sand, and can be obtained with conventional triaxial tests. The selection of the two thresholds has a significant effect on the peak and post-peak resistances in the sand layer.

3.3. Effect of Clay Sensitivity

As the underlying clay will be softened due to the large deformation induced by deep penetration of spudcan, the effect of the sensitivity of underlying clay on the resistance profile is studied. Three cases of spudcan penetration into sand overlying clay with different clay sensitivities ( S t = 1, 3, 5) are compared in Figure 8. The resistance at the sand-clay interface decreases about 10% from S t = 1 to 3, while the resistance profiles are nearly identical for S t = 3 and 5. For most offshore soft to medium soft clays, the typical range of soil sensitivity is between 2 and 5 [11]. The clay sensitivity shows little influence on the peak resistance in the sand layer. However, it has a significant effect on the post-peak resistance profile.

4. Model Verification

The model is verified for different soil conditions, including uniform sand, loose sand overlying clay, and dense sand overlying clay. All the centrifuge tests used for verification were conducted at the University of Western Australia (UWA), which normally uses super fine sand and kaolin clay. As the sand used in UWA centrifuge tests has a friction angle ( ϕ c = 32 ~ 34) very close to that of Conte et al. [3] ( ϕ c = 33), k s h e a r p = 11% and k s h e a r c = 14% are selected for the simulation similarly. Moreover, the kaolin clay used in UWA centrifuge tests has a sensitivity of 3 [11].

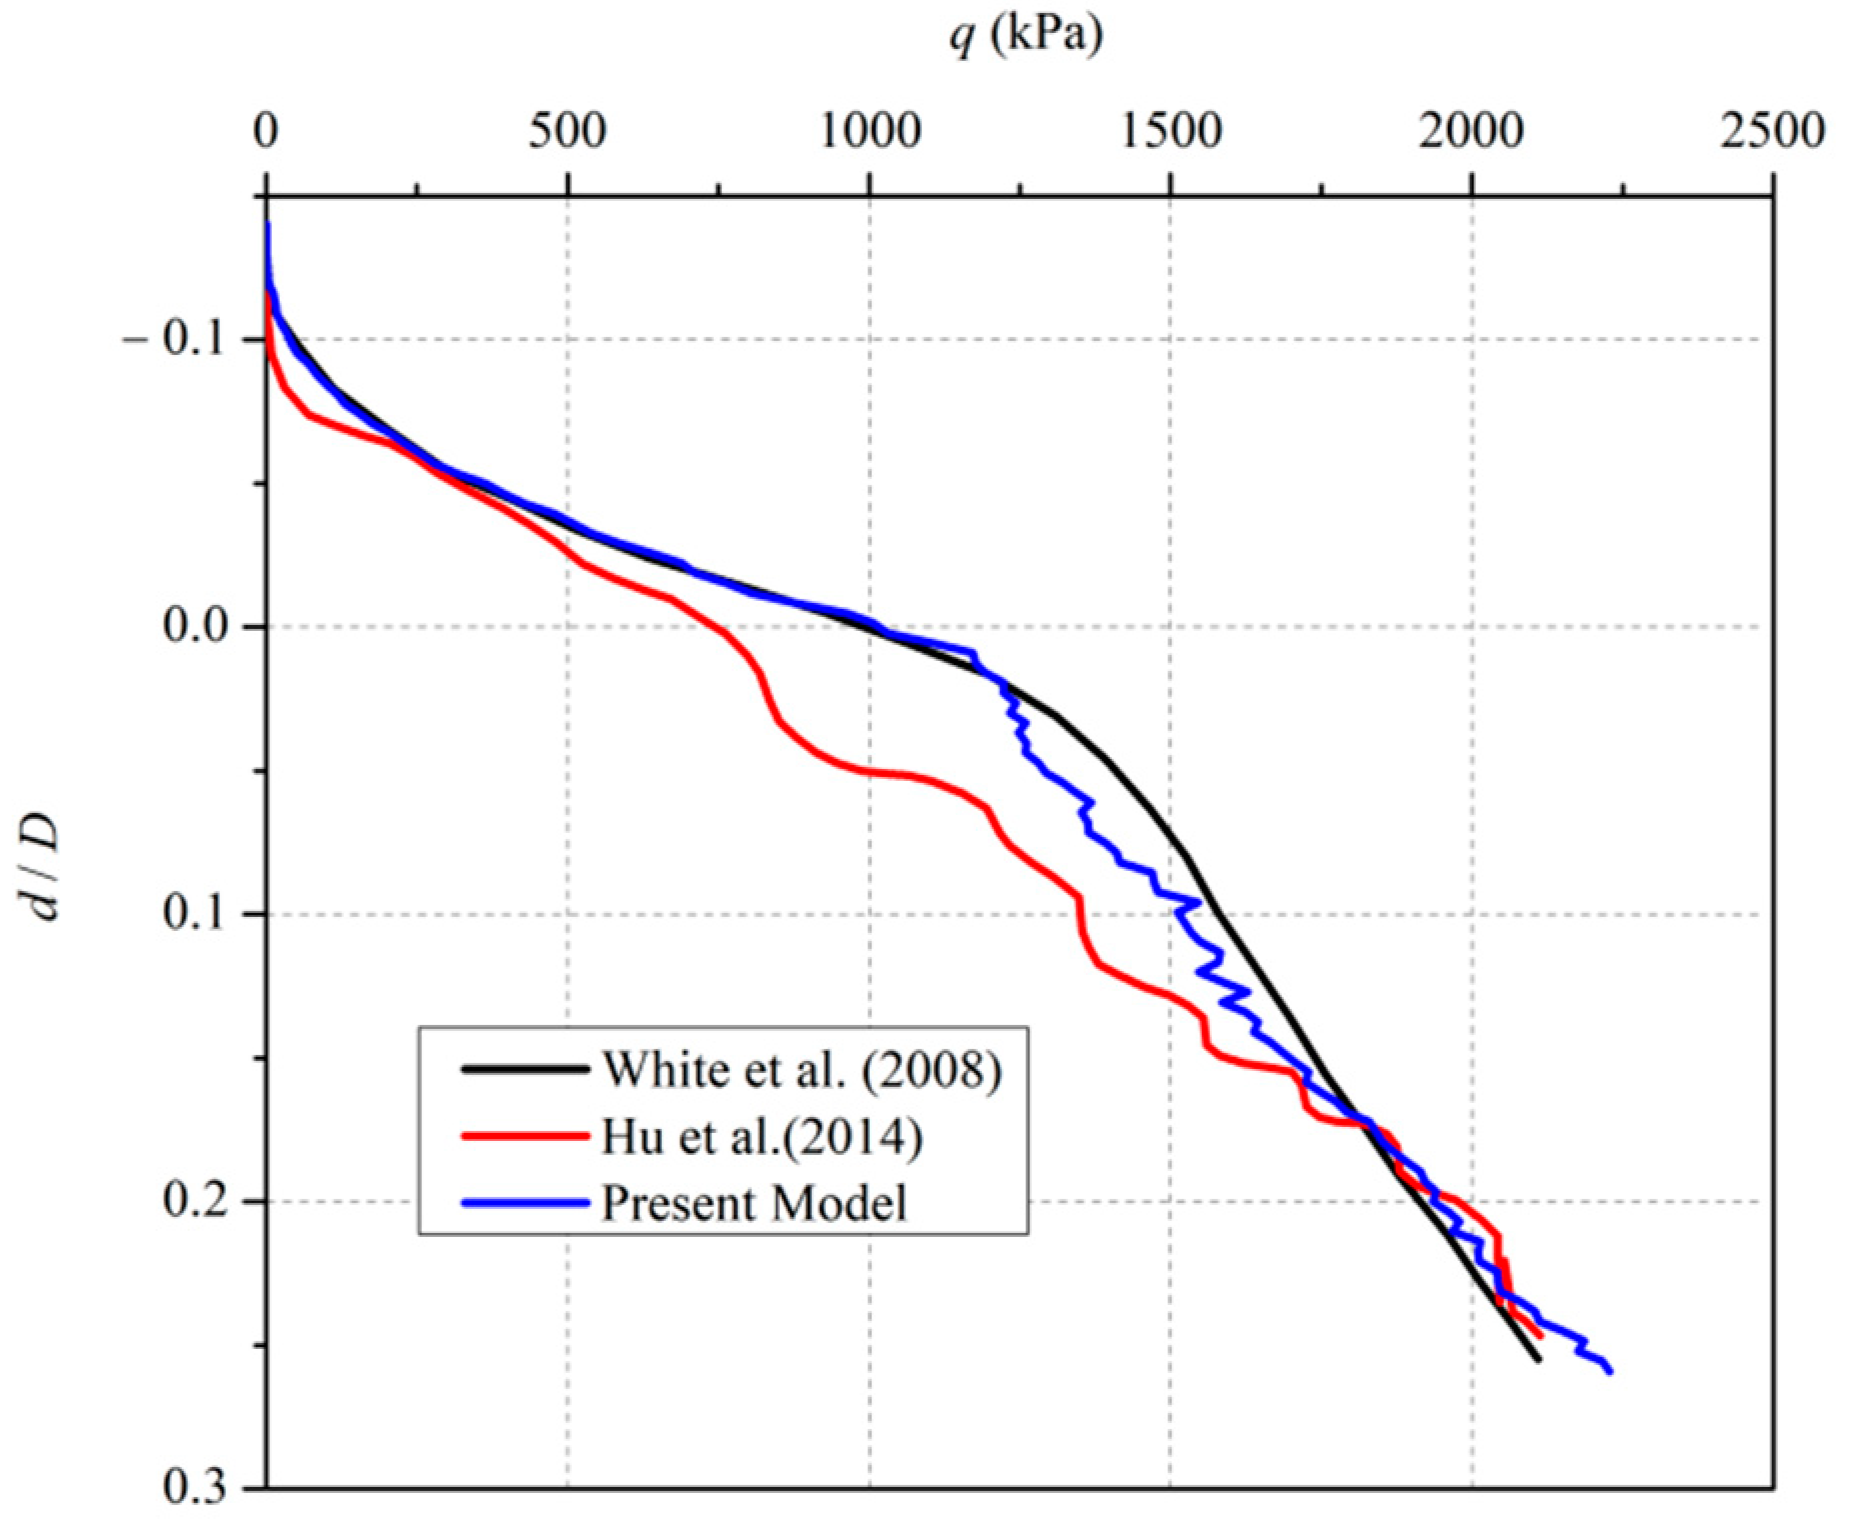
4.1. Spudcan Penetration into Uniform Sand

White et al. [40] conducted a series of centrifuge tests of foundations on sand. The present study chooses a case of a conical circular foundation in which the footing has a diameter of 4.8 m (in prototype scale). And the superfine sand used has a critical friction angle of 32, a relative density of 54%, and a bulk unit weight of 16.4 kN / m 3 .
The present numerical model is compared to the test and the model proposed by Hu et al. [11]. The peak friction angle of sand in the present model is larger than the back-analyzed friction angle used in Hu et al. [11], which results in a larger resistance in shallow penetration depth and a very good resemblance to the test (see Figure 9). As the spudcan penetrates, more sand is mobilized to reach the critical state. Therefore, the strain softening effect in the present model reduces the penetration resistance, which induces a smaller increasing rate of resistance in deep penetration depth.

4.2. Spudcan Penetration into Loose Sand Overlying Clay

The model is also validated against a centrifuge test of spudcan penetration into loose sand overlying clay conducted by Craig and Chua [7]. The spudcan has a diameter of 14 m. The sand layer is 7 m in depth and filled with loose sand with a critical friction angle of 32°. The underlain clay has a uniform undrained shear strength of 30 kPa.
The same configuration of the test is set for the numerical model. In the test, the sand was placed as loose as possible, but the relative density was not measured. When the relative density is below 33%, the sand is categorized as loose. According to our experience, the assumption of 10% is supposed to be appropriate, which implies very loose sand. The simulated resistance profile is compared to the test result in Figure 10, which also includes the other two numerical models. The present model predicts smaller resistance than the other two models and is very close to the test result. This improvement is very probably attributed to the consideration of the softening effect of clay. However, the resistance at shallow penetration is overestimated. The overestimation may be because of the assumption of a constant peak friction angle for k s h e a r < k s h e a r p , providing the fact that the peak friction angle of sand needs a process to be mobilized.

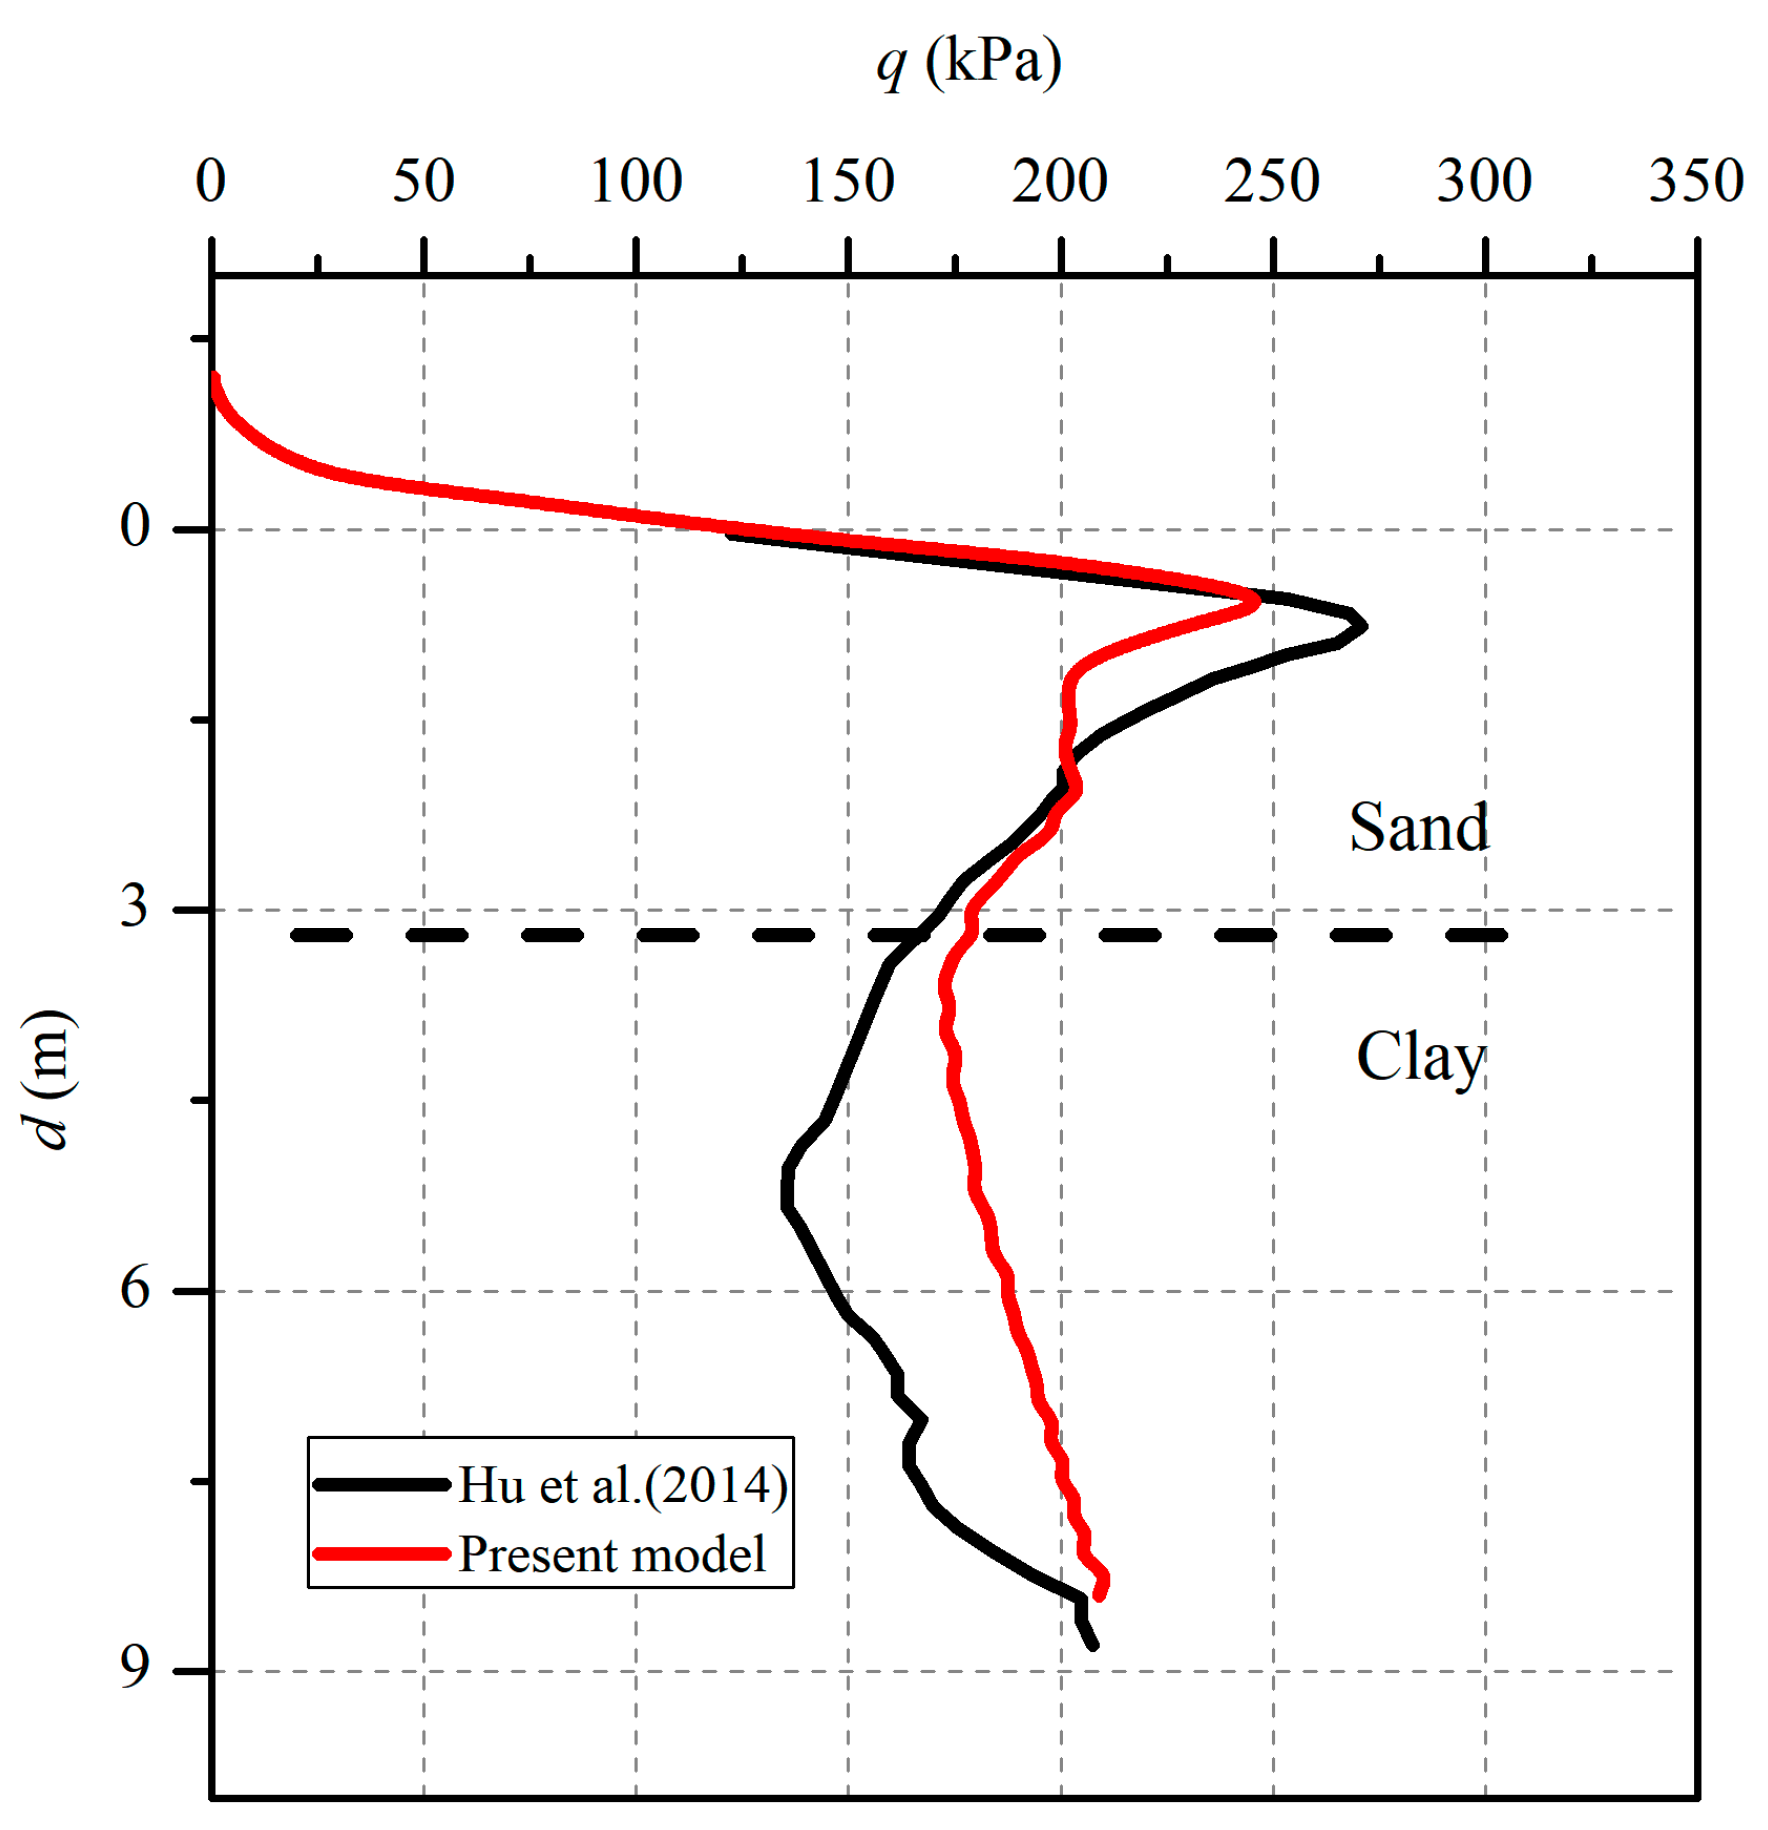
4.3. Spudcan Penetration into Dense Sand Overlying Clay

Teh et al. [9] conducted a series of centrifuge tests of spudcan penetration in dense sand overlying clay. The UWA-F4 case was conducted in a 3.5 m thick dense sand layer overlying a kaolin clay layer. The dense sand has a relative density of 99%, an effective unit weight of 11.15 kN/m3, and a critical friction angle of 34°. The underlain clay has an effective unit weight of 6.5 kN/m3, and its undrained shear strength is 7.22 kPa at the sand-clay interface and increases 1.2 kPa/m with the depth.
As shown in Figure 11, the numerical model captures the peak resistance and post-peak trend very well. However, it underestimates the peak resistance and overestimates the resistance in the underlain clay layer a little. This may be attributed to the selection of Δ ϕ = 3 ° obtained from triaxial tests, while the real process of spudcan penetration is different from triaxial test conditions.

5. Conclusions

In this paper, a numerical model of spudcan penetration into sand overlying clay with the CEL approach is proposed. An M–C model incorporating both stress-dependence and strain-softening is proposed for sand. Furthermore, the strain softening effect is also considered for clay. Sensitivity analysis and verification of the model are performed. All the studies show the following:
  • The peak and post-peak resistances in the sand layer increase with the critical threshold of accumulated deviatoric shear strain. However, the peak resistance will converge at a certain value of k s h e a r c (0.5 for the case of Figure 6). No significant peak resistance is observed for k s h e a r c = (non-strain softening of sand). The resistance in the underlain clay is barely affected by k s h e a r c . The resistance at the sand–clay interface decreases about 10% from S t = 1 to 3, while the resistance profiles are nearly identical for S t = 3 and 5.
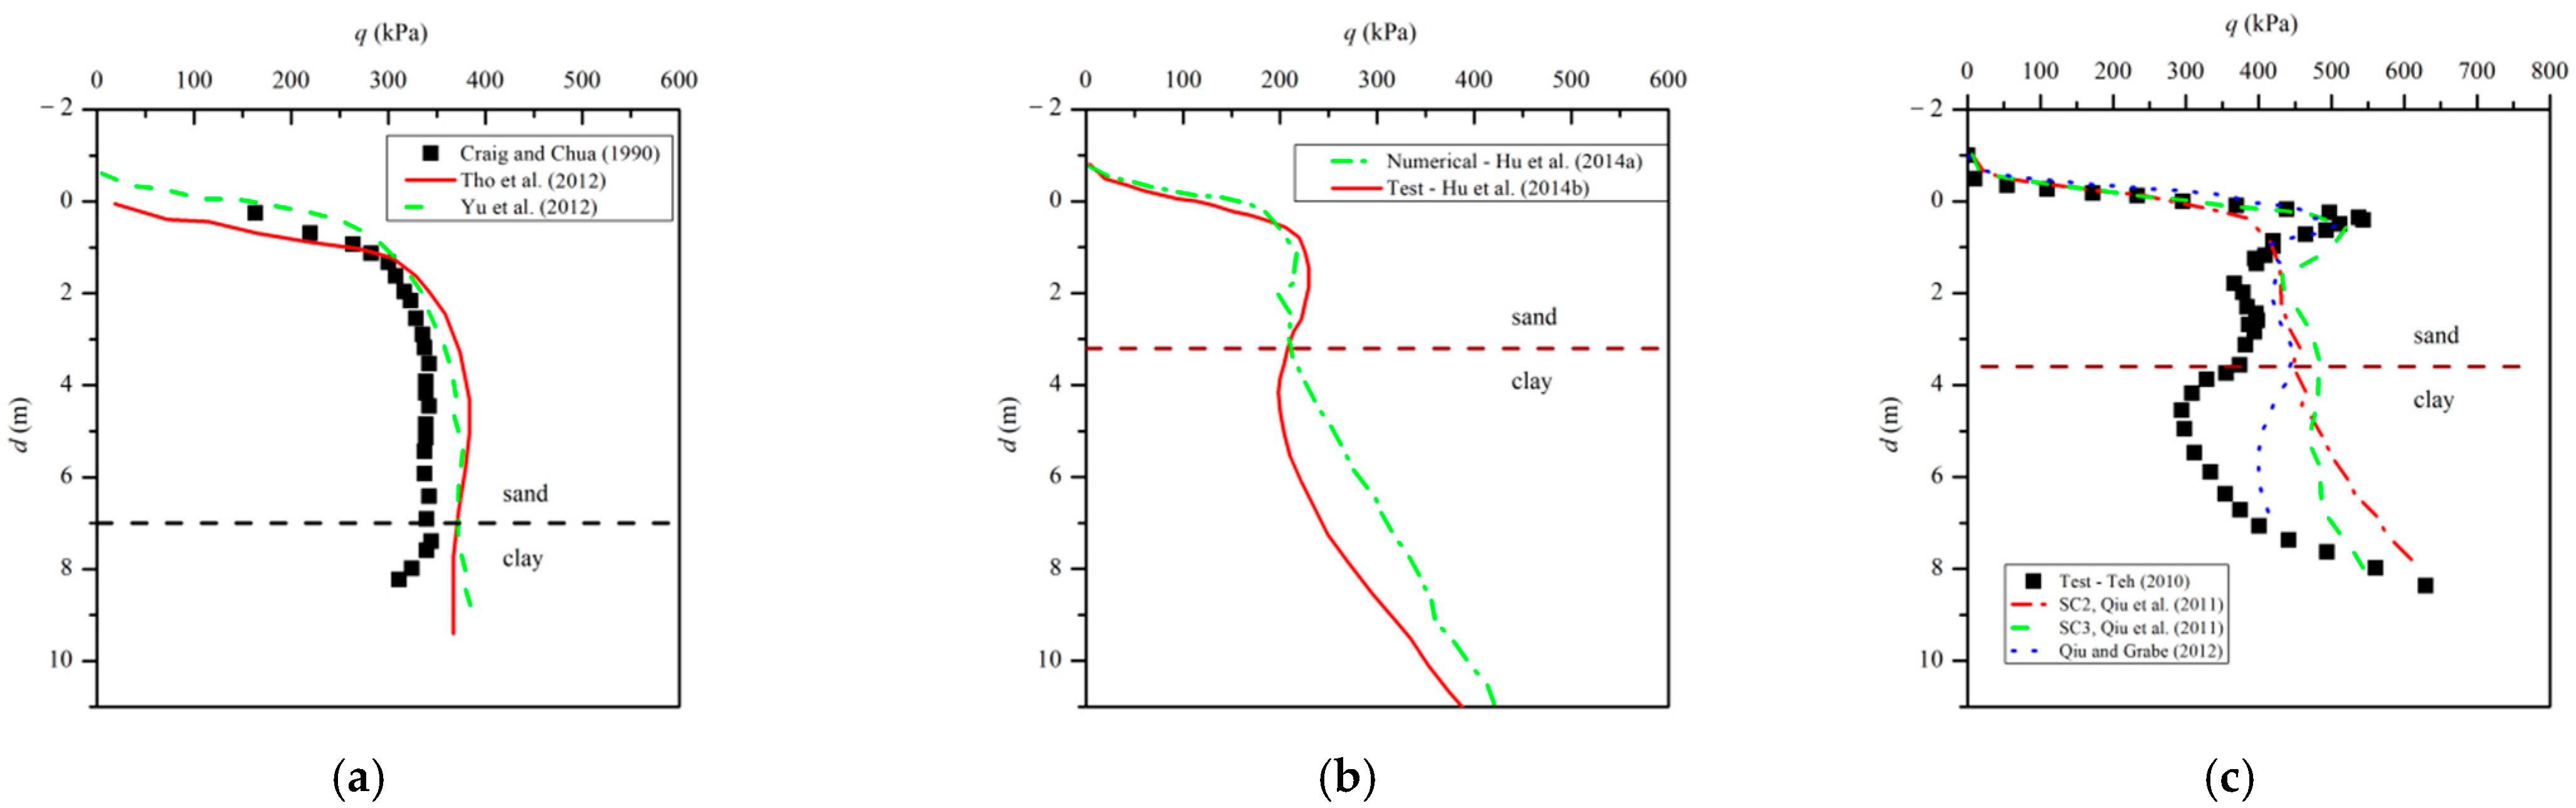
  • The proposed model agrees very well with the centrifuge test of spudcan penetration into uniform sand. The penetration in shallow depth is well simulated due to the incorporation of the stress-dependence behavior of sand. Furthermore, the relatively slow increasing rate of resistance is captured by the strain–softening model of sand.
  • The spudcan penetration resistance in loose sand overlying clay is also well simulated. However, the resistance in shallow depth is a little overestimated, which is very probably attributed to the assumption of constant peak friction angle for k s h e a r < k s h e a r p , providing the fact that the peak friction angle of sand needs a process to be mobilized.
  • The numerical model captures the peak resistance and post-peak profile in dense sand overlying clay relatively well. However, it underestimates the peak resistance and overestimates the resistance in the underlain clay layer. The difference may be due to the selection of Δ ϕ = 3 ° obtained from triaxial tests, which is different from the real process of spudcan penetration conditions.
The proposed method provides a framework for the numerical analysis of geotechnical engineering in sand. The prediction accuracy of the model depends on the parameters. Those parameters involved should be determined based on geotechnical tests. Otherwise, inappropriate selection of the parameters may induce errors.

Author Contributions

Conceptualization, P.G. and M.L.; Data curation, S.Y.; Formal analysis, S.Y.; Funding acquisition, P.G., J.C., and M.L.; Investigation, P.G. and J.C.; Methodology, P.G.; Supervision, M.L.; Validation, S.Y.; Writing—original draft, P.G.; Writing—review and editing, J.C. and M.L. All authors have read and agreed to the published version of the manuscript.

Funding

This research and the APC were funded by the Natural Science Foundation of China, grant number 51709164, 51909030. This study was also supported by the Open Project Program of Beijing Key Laboratory of Pipeline Critical Technology and Equipment for Deepwater Oil & Gas Development (Grant No. BIPT2020004).

Institutional Review Board Statement

Not applicable.

Informed Consent Statement

Not applicable.

Acknowledgments

Many thanks are given to Li Tingting for her kind help in improving the English writing of this paper.

Conflicts of Interest

The authors declare no conflict of interest.

References

  1. Hu, P.; Xiao, Z.; Leo, C.; Liyanapathirana, S. Advances in the prediction of spudcan punch-through in double-layered soils. Mar. Struct. 2021, 79, 103038. [Google Scholar] [CrossRef]
  2. Hu, P.; Haghighi, A.; Coronado, J.; Leo, C.; Liyanapathirana, S.; Li, Z. A comparison of jack-up spudcan penetration predictions and recorded field data. Appl. Ocean Res. 2021, 112, 102713. [Google Scholar] [CrossRef]
  3. Dembicki, E.; Odrobinski, W. A contribution to the tests on the bearing capacity of stratified subsoil under the foundation. In Proceedings of the 8th International Conferences on Soil Mechanics and Foundation Engineering, Moscow, Russia, 6 August 1973; pp. 61–64. [Google Scholar]
  4. Meyerhof, G.G. Ultimate Bearing Capacity of Footings on Sand Layer Overlying Clay. Can. Geotech. J. 1974, 11, 223–229. [Google Scholar] [CrossRef]
  5. Love, J.P.; Burd, H.J.; Milligan, G.W.E.; Houlsby, G.T. Analytical and model studies of reinforcement of a layer of granular fill on a soft clay subgrade. Can. Geotech. J. 1987, 24, 611–622. [Google Scholar] [CrossRef]
  6. Kenny, M.J.; Andrawes, K.Z. The bearing capacity of footings on a sand layer overlying soft clay. Geotechnique 1997, 47, 339–345. [Google Scholar] [CrossRef]
  7. Craig, W.H.; Chua, K. Deep penetration of spud-can foundations on sand and clay. Geotechnique 1990, 40, 541–556. [Google Scholar] [CrossRef]
  8. Okamura, M.; Takemura, J.; Kimura, T. Centrifuge Model Tests on Bearing Capacity And Deformation of Sand Layer Overlying Clay. Soils Found. 1997, 37, 73–88. [Google Scholar] [CrossRef] [Green Version]
  9. Teh, K.L.; Leung, C.F.; Chow, Y.K.; Cassidy, M.J. Centrifuge model study of spudcan penetration in sand overlying clay. Geotechnique 2010, 60, 825–842. [Google Scholar] [CrossRef]
  10. Lee, K.K.; Cassidy, M.J.; Randolph, M.F. Bearing capacity on sand overlying clay soils: Experimental and finite-element investigation of potential punch-through failure. Geotechnique 2013, 63, 1271–1284. [Google Scholar] [CrossRef] [Green Version]
  11. Hu, P.; Wang, D.; Cassidy, M.J.; Stanier, S.A. Predicting the resistance profile of a spudcan penetrating sand overlying clay. Can. Geotech. J. 2014, 51, 1151–1164. [Google Scholar] [CrossRef]
  12. Hu, P.; Stanier, S.A.; Cassidy, M.J.; Wang, D. Predicting Peak Resistance of Spudcan Penetrating Sand Overlying Clay. J. Geotech. Geoenviron. Eng. 2014, 140, 04013009. [Google Scholar] [CrossRef] [Green Version]
  13. Lee, K.K.; Randolph, M.F.; Cassidy, M.J. Bearing capacity on sand overlying clay soils: A simplified conceptual model. Geotechnique 2013, 63, 1285–1297. [Google Scholar] [CrossRef]
  14. Yin, Q.; Yang, J.; Xu, G.; Xie, R.; Tyagi, M.; Li, L.; Zhou, X.; Hu, N.; Tong, G.; Fu, C.; et al. Field experimental investigation of punch-through for different operational conditions during the jack-up rig spudcan penetration in sand overlying clay. J. Pet. Sci. Eng. 2020, 195, 107823. [Google Scholar] [CrossRef]
  15. Zheng, J.; Chen, Y.; Chen, X.; Wang, D.; Jing, S. Improved Prediction of Peak Resistance for Spudcan Penetration in Sand Layer Overlying Clay. J. Geotech. Geoenviron. Eng. 2022, 148, 04021174. [Google Scholar] [CrossRef]
  16. Jiang, J.; Wang, D.; Zhang, S. Improved Prediction of Spudcan Penetration Resistance by an Observation-Optimized Model. J. Geotech. Geoenviron. Eng. 2020, 146, 06020014. [Google Scholar] [CrossRef]
  17. Hossain, M.S.; Hu, P.; Cassidy, M.J.; Menzies, D.; Wingate, A. Measured and calculated spudcan penetration profiles for case histories in sand-over-clay. Appl. Ocean Res. 2019, 82, 447–457. [Google Scholar] [CrossRef]
  18. Yu, L.; Hu, Y.; Liu, J.; Randolph, M.F.; Kong, X. Numerical study of spudcan penetration in loose sand overlying clay. Comput. Geotech. 2012, 46, 1–12. [Google Scholar] [CrossRef]
  19. Tho, K.K.; Leung, C.F.; Chow, Y.K.; Swaddiwudhipong, S. Eulerian Finite-Element Technique for Analysis of Jack-Up Spudcan Penetration. Int. J. Geomech. 2012, 12, 64–73. [Google Scholar] [CrossRef]
  20. Qiu, G.; Henke, S. Controlled installation of spudcan foundations on loose sand overlying weak clay. Mar. Struct. 2011, 24, 528–550. [Google Scholar] [CrossRef]
  21. Hu, P.; Cassidy, M.J. Predicting jack-up spudcan installation in sand overlying stiff clay. Ocean Eng. 2017, 146, 246–256. [Google Scholar] [CrossRef] [Green Version]
  22. Zhao, J.; Jang, B.S.; Duan, M.; Liang, C. A finite element approach for predicting the full resistance profile of a spudcan deeply penetrating in dense sand overlying clay. Appl. Ocean Res. 2019, 87, 155–164. [Google Scholar] [CrossRef]
  23. Wang, D.; Bienen, B.; Nazem, M.; Tian, Y.; Zheng, J.; Pucker, T.; Randolph, M.F. Large deformation finite element analyses in geotechnical engineering. Comput. Geotech. 2015, 65, 104–114. [Google Scholar] [CrossRef]
  24. Qiu, G.; Grabe, J. Numerical investigation of bearing capacity due to spudcan penetration in sand overlying clay. Can. Geotech. J. 2012, 49, 1393–1407. [Google Scholar] [CrossRef]
  25. Abbo, A.J.; Sloan, S.W. A smooth hyperbolic approximation to the Mohr-Coulomb yield criterion. Comput. Struct. 1995, 54, 427–441. [Google Scholar] [CrossRef]
  26. Wolffersdorff, P.-A. von A hypoplastic relation for granular materials with a predefined limit state surface. Mech. Cohesive-Frict. Mater. 1996, 1, 251–271. [Google Scholar] [CrossRef]
  27. Niemunis, A.; Krieg, S. Viscous behaviour of soil under oedometric conditions. Can. Geotech. J. 1996, 33, 159–168. [Google Scholar] [CrossRef]
  28. Einav, I.; Randolph, M.F. Combining upper bound and strain path methods for evaluating penetration resistance. Int. J. Numer. Methods Eng. 2005, 63, 1991–2016. [Google Scholar] [CrossRef]
  29. Qiu, G.; Henke, S.; Grabe, J. Application of a Coupled Eulerian-Lagrangian approach on geomechanical problems involving large deformations. Comput. Geotech. 2011, 38, 30–39. [Google Scholar] [CrossRef]
  30. Ullah, S.N.; Hu, Y.; Stanier, S.; White, D. Lateral boundary effects in centrifuge foundation tests. Int. J. Phys. Model. Geotech. 2017, 17, 144–160. [Google Scholar] [CrossRef]
  31. Ullah, S.N.; Hu, Y. A numerical investigation into the bottom boundary effect for spudcan penetration on sand overlying clay in centrifuge test. In Proceedings of the International Conference on Offshore Mechanics and Arctic Engineering—OMAE, Rio de Janeiro, Brazil, 10–15 June 2012; Volume 4, pp. 229–237. [Google Scholar]
  32. Forcellini, D. 3D Numerical simulations of elastomeric bearings for bridges. Innov. Infrastruct. Solut. 2016, 1, 45. [Google Scholar] [CrossRef] [Green Version]
  33. Mina, D.; Forcellini, D. Soil–structure interaction assessment of the 23 november 1980 irpinia-basilicata earthquake. Geosci. 2020, 10, 152. [Google Scholar] [CrossRef] [Green Version]
  34. Castelli, F.; Grasso, S.; Lentini, V.; Sammito, M.S.V. Effects of soil-foundation-interaction on the seismic response of a cooling tower by 3d-fem analysis. Geosci. 2021, 11, 200. [Google Scholar] [CrossRef]
  35. SNAME. Guidelines for Site Specific Assessment of Mobile Jack-Up Units, T&R Bulletin 5-5 and 5-5A.; SNAME: Jersey City, NJ, USA, 2008. [Google Scholar]
  36. Bolton, M.D. The strength and dilatancy of sands. Geotechnique 1986, 36, 65–78. [Google Scholar] [CrossRef] [Green Version]
  37. Conte, E.; Donato, A.; Troncone, A. Progressive failure analysis of shallow foundations on soils with strain-softening behaviour. Comput. Geotech. 2013, 54, 117–124. [Google Scholar] [CrossRef] [Green Version]
  38. Gao, P.; Duan, M.; Gao, Q.; Jia, X.; Huang, J. A prediction method for anchor penetration depth in clays. Ships Offshore Struct. 2016, 11, 782–789. [Google Scholar] [CrossRef]
  39. Gao, P.; Liu, Z.; Shi, D.; Fu, X.; Yan, K. Mitigation effect of perforation drilling on the sliding risk during spudcan installation close to footprints. J. Mar. Sci. Eng. 2020, 8, 118. [Google Scholar] [CrossRef] [Green Version]
  40. White, D.J.; Teh, K.L.; Leung, C.F.; Chow, Y.K. A comparison of the bearing capacity of flat and conical circular foundations on sand. Geotechnique 2008, 58, 781–792. [Google Scholar] [CrossRef] [Green Version]
Figure 1. Comparison of simulated resistance profiles in dense sand overlying clay of the existing numerical models: (a) loose sand overlying clay [7,18,19]; (b) medium-loose sand overlying clay [11,12]; (c) dense sand overlying clay [9,20,24].
Applsci 12 07454 g001
Figure 2. Diagram of the quarter symmetric CEL model: (a) Schematic diagram; (b) Mesh.
Applsci 12 07454 g002
Figure 3. Variation of the effective friction angle and dilation angle with the accumulated deviatoric plastic strain: (a) ϕ k s h e a r relationship; (b) Ψ k s h e a r relationship.
Applsci 12 07454 g003
Figure 4. Mesh close to the spudcan with different mesh sizes: (a) 0.05D; (b) 0.02D; (c) 0.005D.
Applsci 12 07454 g004
Figure 5. Penetration resistance profiles for different mesh sizes.
Applsci 12 07454 g005
Figure 6. Penetration resistance profiles for different mass scaling factors.
Applsci 12 07454 g006
Figure 7. Penetration resistance profiles with different critical thresholds.
Applsci 12 07454 g007
Figure 8. Penetration resistance profiles with different clay sensitivities.
Applsci 12 07454 g008
Figure 9. Penetration resistance profiles from centrifuge tests and numerical analyses (uniform sand) [11,40].
Applsci 12 07454 g009
Figure 10. Penetration resistance profiles from centrifuge tests and numerical analyses (loose sand overlying clay) [7,18,19].
Applsci 12 07454 g010
Figure 11. Penetration resistance profiles from centrifuge tests and numerical analysis (dense sand overlying clay) [11].
Applsci 12 07454 g011
Table 1. Summary of the existing FEM models for sand overlying clay.
ModelNumerical ApproachConstitutive Models SandConstitutive Models Clay
Yu et al. [18]RITSSSmooth hyperbolic Mohr–Coulomb (M–C) model [25]Tresca
Tho et al. [19]CELM–C modelTresca
Qiu and Henke [20]CELLoose: M–C model
Dense: hypoplastic model [26]
Tresca
Qiu and Grabe [24]CELHypoplastic modelViscohypoplastic model (Niemunis 2003) [27]
Hu et al. [11].CELM–C modelTresca model with softening effect [28]
Zhao et al. (2019) [22]CELStrain-dependent modified M–C modelTresca model with softening effect [28]
Publisher’s Note: MDPI stays neutral with regard to jurisdictional claims in published maps and institutional affiliations.

