Article

Recurrent Neural Network-Based Multimodal Deep Learning for Estimating Missing Values in Healthcare

1
Contents Convergence Software Research Institute, Kyonggi University, Suwon-si 16227, Gyeonggi-do, Korea
2
Division of AI Computer Science and Engineering, Kyonggi University, Suwon-si 16227, Gyeonggi-do, Korea
*
Author to whom correspondence should be addressed.
Appl. Sci. 2022, 12(15), 7477; https://doi.org/10.3390/app12157477
Submission received: 29 May 2022 / Revised: 15 July 2022 / Accepted: 22 July 2022 / Published: 26 July 2022
(This article belongs to the Section Computing and Artificial Intelligence)

Abstract

:
This estimation method operates by integrating the input values that are redundantly collected from heterogeneous devices through the selection of a representative value and estimating missing values by using a multimodal RNN. Users use a heterogeneous healthcare platform mainly in a mobile environment. Users who pay a relatively large amount of attention to healthcare possess various types of healthcare devices and collect data through their mobile devices. The collected data may be duplicated depending on the types of these devices. This data duplication causes an ambiguity issue in that it is difficult to determine which value among multiple data should be taken as the user’s actual value. Accordingly, it is necessary to create a neural network structure that considers the data value at the time previous to the current time. RNNs are appropriate for handling data with a time series characteristic. To learn an RNN-based neural network, learning data that have the same time step are required. Therefore, an RNN in which one variable becomes single-modal was designed for each learning run. In the RNN, a cell is a gated recurrent unit (GRU) cell that presents sufficient accuracy in the small resource environment of mobile devices. The RNNs that are learned according to the variables can each operate without additional learning, even if the situation of the user’s mobile device changes. In a heterogeneous environment, missing values are generated by various types of errors, including errors caused by battery charge and discharge, sensor failure, equipment exchange, and near-field communication errors. The higher the missing value ratio, the greater the number of errors that are likely to occur. For this reason, to achieve a more stable heterogeneous health platform, missing values must be considered. In this study, a missing value was estimated by means of multimodal deep learning; that is, a multimodal deep learning method was designed with one neural network that was connected with each learned single-modal RNN using a fully connected network (FCN). Each RNN input value delivers mutual influence through the weights of the FCN, and thereby, it is possible to estimate an output value even if any one of the input values is missing. According to the evaluation in terms of representative value selection, when a representative value was selected by using the mean or median, the most stable service was achieved. As a result of the evaluation according to the estimation method, the accuracy of the RNN-based multimodal deep learning method is 3.91%p higher than that of the SVD method.

1. Introduction

Soft computing is a technique for solving a given problem flexibly when no perfect algorithm for resolving the problem exists [1]. To answer a question, soft computing utilizes fuzzy logic, evolutionary computation, machine learning, and probability inference. It allows inaccuracy, uncertainty, partial truth, and approximation, and continuously changes to find the appropriate answer to a question [2]. A health platform involves complicated relations between multiple variables; therefore, it is appropriate to apply soft computing, which flexibly accepts environment changes. With the advancement of soft computing, IT convergence technology in various areas, such as society, science, and industry, has been used to develop a health platform. Accordingly, health data are collected through many different routes, such as electronic medical records (EMRs), personal health records (PHRs), and life logs [3]. In addition, through the digitalization of medical records, new data are accumulated continuously.
Health data vary continuously, and their variables and attributes are diverse [4]. Many health data have a time series characteristic. In other words, the data continuously occur and change as time elapses. A soft computing-based heterogeneous healthcare platform observes and analyzes how multiple variables, such as weather, nutrition, and activity, influence health over time [1,2,3,4,5]. The influence of these variables on personal health differs according to the individual’s living habits, family history, and disease status, and the range of collected variables differs according to the user’s surroundings, devices, and personal situation [6].
Multimodality describes the integrated environment of data from multiple sensors or sources for a single object [7]. In a health platform, user data are collected in multimodal form: temperature, humidity, GPS, travel range, PHRs, and EMRs. Many different data can be redundant or omitted according to the user’s interest or device type. The main concern in a health platform is to provide a flexible and continuous service in a situation where data are collected differently according to the users’ situation [8]. In a situation where various devices have been developed and distributed to people, people may feel confused due to overlapping information. Accordingly, research on a method for integrated management of information is needed. Therefore, if user data are redundant or omitted, representative values are used to remove duplicate data and estimate omitted values. A representative value can be selected, such as the mean, median, mode, quartile, percentile, or trimmed mean [9]. An omitted value is represented with a missing value or null, which is estimated using methods such as collaborative filtering, mean imputation, regression analysis, and neural networks [10].
In this study, we propose a recurrent neural network-based multimodal deep learning for estimating missing values in healthcare. This RNN-based estimation is achieved by using two proposed techniques. The first is to analyze the manner in which data duplication caused by multimodality influences the estimation of a missing value. The second technique is to evaluate the missing value estimation method that uses variable-by-variable RNN learning and multimodal deep learning. In the case of data duplication by heterogeneous devices in the user’s healthcare environment, it is provided using a representative value processing method. If a missing value occurs according to the user environment, it is imputation with the predicted value from the RNN for each variable. The contributions of the proposed method are as follows:
  • It is possible to determine the direction of data integration in an environment where the types of wearable devices are diversifying and contribute to enabling continuous service to users.
  • This is a method for dealing with the data duplication that occurs in a heterogeneous healthcare environment.
  • Previous studies on the imputation of missing values were conducted on one device or one data set in healthcare.
  • The proposed method is more suitable for healthcare environments by the imputation of missing values in a structure where different devices complement each other.
  • The proposed method can flexibly integrate the data collected in the perfume healthcare environment.
This study consists of the following: Section 2 describes the research trends of soft computing and the data characteristics in heterogeneous health platforms. Section 3 describes the proposed RNN-based multimodal deep learning for estimating missing values in healthcare. Section 4 describes the experimental results and the performance evaluation. Finally, Section 5 draws conclusions.

2. Related Work

2.1. Research Trends of Soft Computing

Soft computing is a technique for dealing with inaccurate and uncertain data that are not easily or cannot at all be modeled mathematically. It includes fuzzy logic, evolutionary computing, swarm intelligence, and deep learning [11,12]. Fuzzy logic is used to support decision making in a real-world situation where it is difficult to divide an issue accurately and dichotomously. Propositions that have different and ambiguous criteria according to the individual, such as large, small, cold, and hot, are changed to those that can be understood by a computer. Unclear or subjective criteria are explained by means of sets, hedges, rules, and inferences. Evolutionary computing is used to conduct repeated searches to design a better model for machine learning, just as nature attempts to find better genes. It finds the highest goodness-of-fit model through the repeated encoding and evaluation of a given issue. Swarm intelligence is used to allow objects with similar characteristics to solve a given problem according to rules. This means that multiple objects taking action according to simple rules interact with each other and the overall action becomes intelligent. Each object repeats its simple rules without central control, and the objects gather together to appear as one artificial intelligence system. Swarm intelligence is found mainly in logistic robots, smart factories, and the IoT.
Deep learning, one of the machine learning areas, is based on artificial neural networks (ANNs) combined with massive data. To find an answer to a given problem, a weight is updated repeatedly by using refined training data. Currently, deep learning shows high accuracy rates in cognitive areas, including those of images, video, and voice. A variety of services using deep learning has been developed. Thus, soft computing has led to significant results in the fields of global optimization and nonlinear data processing and has attracted considerable attention in the imaging processing field in particular. Soft computing applied to image processing provides a useful tool for decision makers in multiple application areas, including agriculture, mineralogy, transportation, and security. For example, a change in radar images is detected by using an RBM, or a monthly rainfall map is established by using a fuzzy model. Thus, soft computing is applied in many different industries. In addition, fuzzy logic can be used for various applications, such as the extraction of information from remote detection images, change detection, splitting, bandwidth selection, classification, separation, and clustering [11,12,13,14]. Erturk et al. [13] proposed adaptive neuro-fuzzy inference systems (ANFISs) for predicting software defects. Software defect prediction by means of soft computing is used to predict the possibility of a defect occurring. ANFISs were developed to combine the advantages of fuzzy inference systems and ANNs. They consist of four layers: fuzzing, rule execution, normalization, and nonfuzzing. They predict a software defect in the sequence of the layers. Moretti et al. [14] used soft computing-based hybrid modeling to predict urban traffic flow. They proposed a modeling approach that implements hybrid modeling, using a combination of ANNs and a statistical approach, for predicting traffic flow in the unit of one hour. Based on the ensemble technique, their approach generated a prediction from multiple models for the same variable at the same time. By generating a prediction through multiple routes for a single object, it is possible to collect diverse candidate values. Using the results from multiple models, their method estimated an optimal value. Thus, it is possible to create the model with the highest accuracy for one variable.

2.2. Data Characteristics in Heterogeneous Healthcare Platfrom

A heterogeneous healthcare platform is an environment where various health devices such as health bands, smartwatches, blood glucose meters, and weight scales collect data from smartphones. Private health data are recorded by the heterogeneous devices for managing user health, such as drug administration and diet. It supports decision making by collecting the health-related data collected by users as observation targets. Variables that can be collected differ depending on the device, and even the same variable may change the observed value depending on the wearing area. Different types of devices collect data on a single object, resulting in redundancy. The diverse data collected in a heterogeneous healthcare platform have a variety of characteristics according to the variables. Variables, such as weather, ECG data, EMG data, and temperature, have the time series characteristic of continuous numerical data [4]. EMR and PHR data, as unstructured data, have diverse categories and attributes, and feature a mixture of strings and numbers [5,15]. Weather, x-ray, and endoscopy data are collected in the format of videos or images [16]. In addition to these, there are numerous variables that influence human health. It is impossible to collect all the variables using the current technologies. Thus, soft computing is used to find the optimal answer using the given variables. ANN is classified into DNN, CNN, and RNN according to the characteristics of the neural network. RNN is most suitable for healthcare data with time series features. When the variables show the time series feature, most frequently, RNNs are used to predict a change in the current state of healthcare [17]. Each variable is collected in a different cycle, and therefore a basic time step is ambiguous in RNN learning. Therefore, the variables not collected in the same cycle learn the RNN separately. To consider the hidden associations of multiple variables, the neural network structure needs to integrate each neural network [18]. Unstructured data, such as EMR and PHR data, are analyzed through natural language processing, text mining, and association analysis. For this purpose, the data need to be preprocessed in line with the output [19]. Image or video data are applied to decision making by using a neural network specialized for classification or clustering, as shown in a CNN.
The data sets used in a health platform are the wearable stress and affect detection (WESAD) data set [20], the mobile health (mHealth) data set [21], the diabetes data set [22], the bike sharing data set [23], and the health news data set [24]. The WESAD data set [20] contains data collected from devices worn on the wrist and the chest. It includes ECG, electrodermal activity, EMG, respiration, body temperature, 3-axis acceleration, and blood amount pulse data. The mHealth data set [21] contains the data of body movement and bio signals generated by 12 types of physical activities. The data were recorded via mobile devices. The 12 types of physical activities include walking, stair climbing, biking, running, and jumping. Their repeated count or practice time were recorded. The data, such as x-axis acceleration, y-axis acceleration, z-axis acceleration, ECG, and magnetic field, were recorded using 24 sensors. The diabetes data set [22] contains the data collected through the EMRs and paper records of diabetic patients. In the case of an EMR, the time-stamp for an event is automatically recorded by the device’s internal watch. In the case of paper records, a certain time is fixed, and then the medical record is filled at breakfast, lunch, dinner, and sleep time. The variables of the data set are date, time, code, and value. The code consists of the blood sugar before a meal, the blood sugar after a meal, the general meal amount, and the amount of insulin. The bike sharing data set [23] contains the data collected by a bike sharing system, including, date, time, travel route, weather, temperature, humidity, and wind velocity. Using the data, it is possible to analyze bike use according to weather and the floating population according to the travel routes. The health news data set [24] contains the data collected from health news posted in the Twitter accounts of news channels. It includes date and time. It is used to extract keywords, subjects, and emotions from short texts, and is used for document clustering. RNN is an artificial neural network that can best reflect the temporal characteristics of data [25]. RNNs are typically classified into Long Short Term Memory (LSTM) [26] and Gated Recurrent Unit (GRU) [27], depending on the cell structure. The variables that show the time series characteristic among the heterogeneous data collected using multimodal sensors of devices are used for each RNN; therefore, the state change of each variable is predicted.

3. Recurrent Neural Network-Based Multimodal Deep Learning for Estimating Missing Values in Healthcare

It is difficult to define healthcare solutions clearly because the variables and attributes are diverse. Therefore, it is important to find an optimal solution through soft computing. There are various methods for providing the best solution for users. Recently, deep learning-based methods have attracted attention [5,8,14]. A heterogeneous healthcare platform is a multimodal platform in which applications and heterogeneous devices, such as personal health devices, are connected in a mobile environment. In heterogeneous healthcare platform, data are collected through diverse routes. A multimodal environment means that diverse kinds of devices are connected to one terminal and continuously operate, regardless of the device types and numbers [4,7]. In a heterogeneous health platform, for one variable, values with the same time step can be collected because of the multimodal characteristic. If there are multiple values for one variable, data duplication occurs [17]. The duplication is a variable that can be provided in common by multiple devices. In Figure 1, heart rate is collected from a smart band, heart rate monitor, smartwatch, and smartphone to represent the four duplications. The healthcare data appears continuously over time, and accordingly, RNN, which shows an advantage for continuity among various artificial neural networks, is used. If multiple values for one variable are duplicated, it is difficult to input data in the neural network and it is necessary to remove the redundant values to achieve data reliability and scalability. In addition, the range of data collection changes according to the user’s device type or situation. A neural network that learns on data that are collected by devices can be of no use if the input variables are changed when the device is changed. Accordingly, multimodal deep learning is necessary for establishing a neural network using data variables. To reflect time series characteristics, the predictive model for each variable is learned with RNN, which is an ANN structure that can reflect the passage of time, and the cell uses GRU at this time. The correlation between each variable is used as a DNN structure emphasizing interconnectivity in ANN. Figure 1 illustrates the RNN-based multimodal deep learning for estimating missing values. Through the connection of neural networks that are established differently according to the data variables, the proposed method estimates the missing values that occur in different user situations.

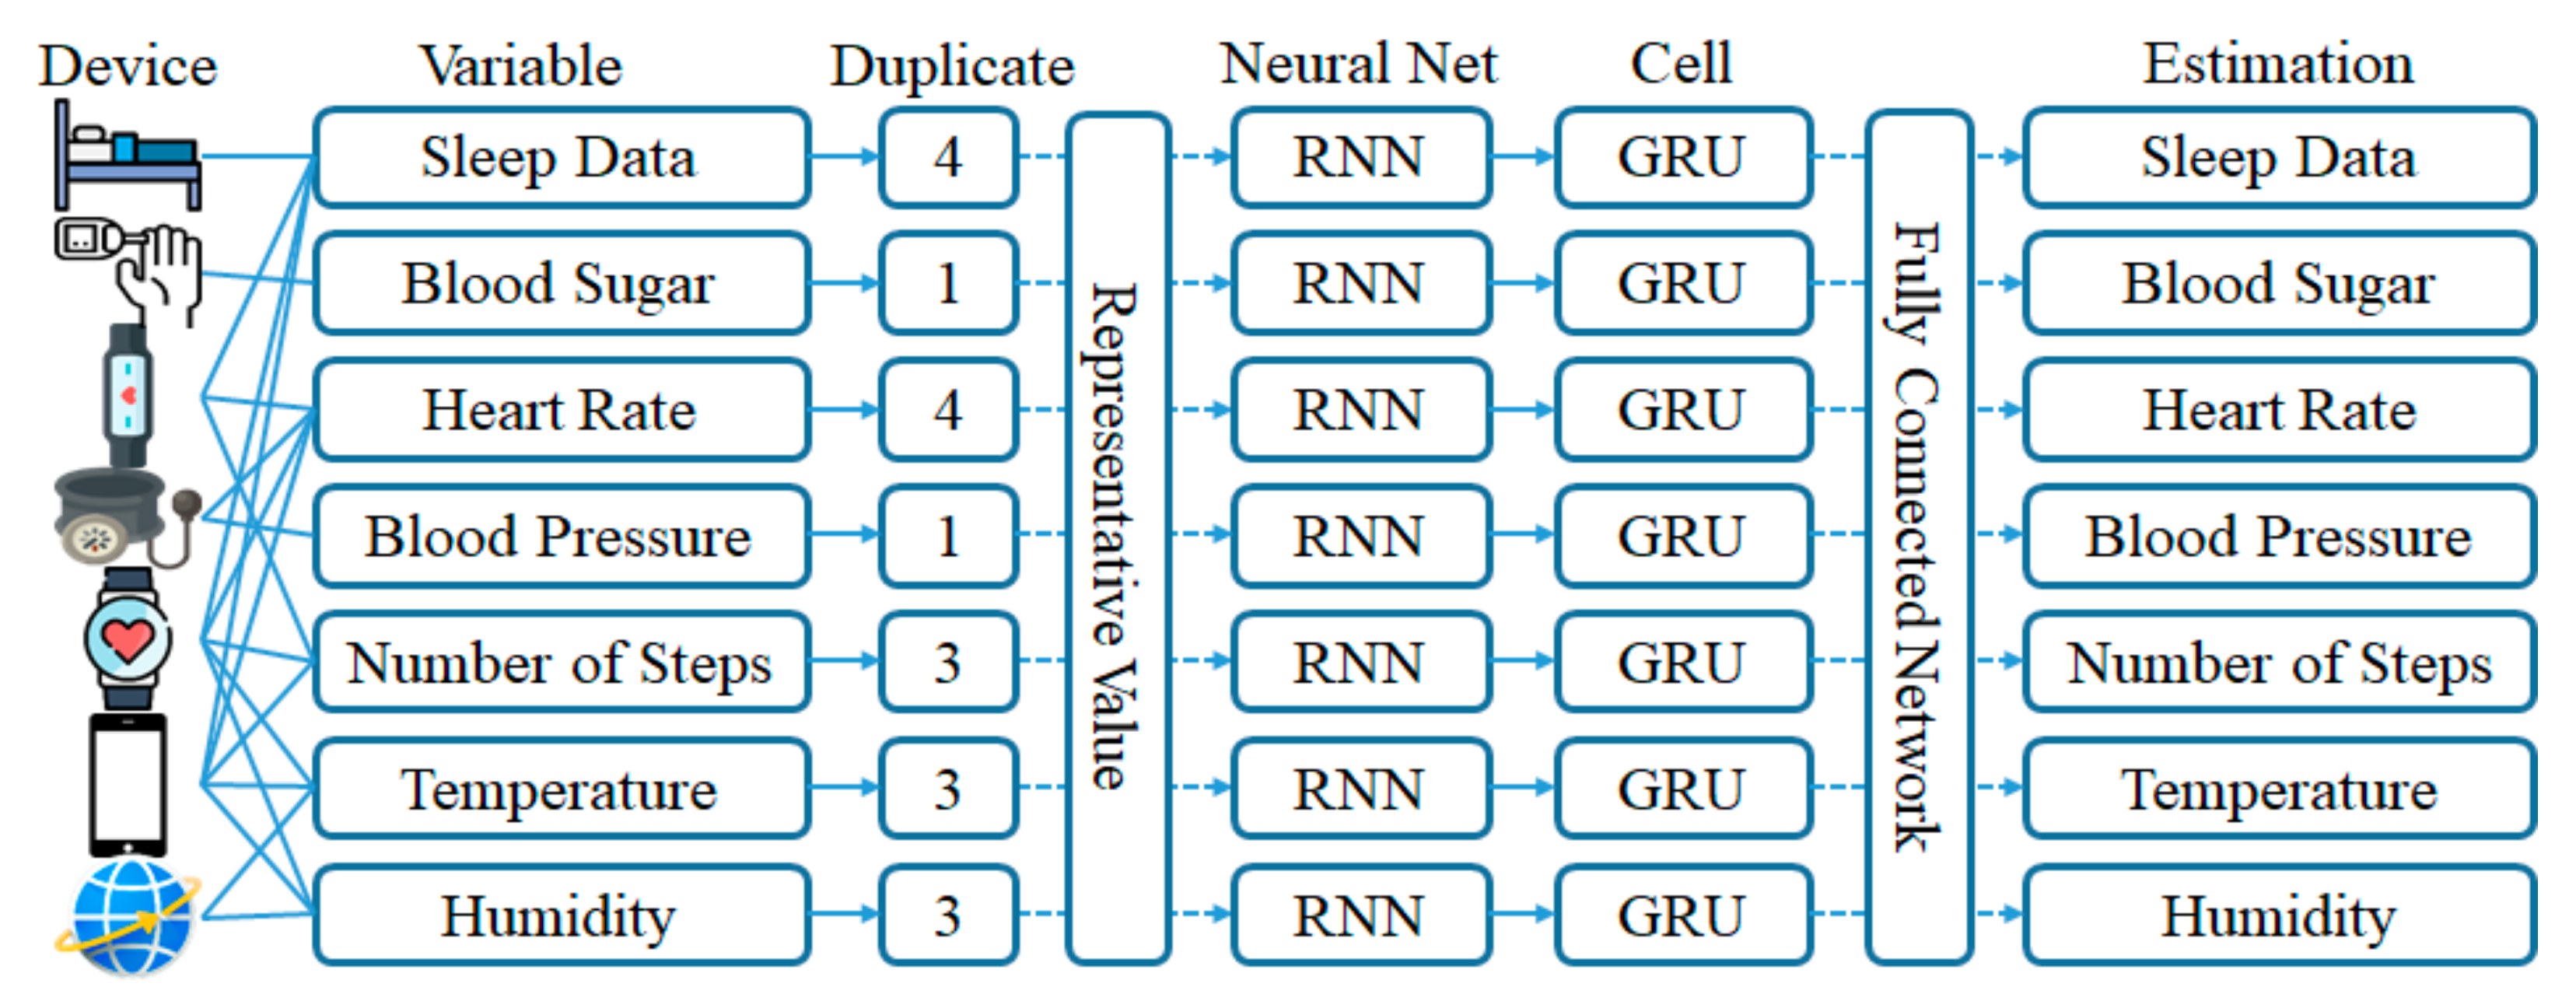
3.1. Selection of a Representative Value for Data Duplication Processing

In a heterogeneous healthcare platform, variable duplication occurs one to n times according to user situations. For instance, a user’s step count can be collected by means of a smartphone, health band, or GPS. To calculate a user’s step count, smartphones and health bands use a gyro sensor and GPS uses the travel distance [28]. Smartphones and health bands produce different results according to the body region on which they are worn and redundantly collect multiple values of a user’s count at the same time. If data duplication occurs and variable “A” has multiple values at time t, a user can be confused in his/her decision making. In this case, it is necessary to integrate the redundant values into the most appropriate single value. Such data duplication frequently changes according to the user’s surrounding situation. By applying the method of selecting a representative value among collected data, it is possible to use a conventional deep learning model regardless of the user’s situation and device type changes. Even if two or more devices measure a user’s travel distance or a new device is added, there is no need to relearn the existing neural networks. Figure 2 shows the data duplication of heterogeneous devices.
If data redundancy occurs, a representative value selection method is used to choose the value at time t of data variable A. Various methods exist for selecting a representative value, such as calculating the mean, median, mode, quartile, percentile, and trimmed mean [9].
Here, health proof data were collected under the supervision of a health examination center. These are the data from 26 people, including 10 men in their 20s, 5 women in their 20s, 7 men in their 30s, and 3 women in their 30s, who are interested in health care. The data were collected from 10 sleeping mats, 6 smartwatches, 17 health bands, 26 smartphones, and blood glucose meters. These empirical health care data were collected for 300 days using 11 sphygmomanometers, 11 sphygmomanometers, and mobile applications. A variety of PHRs were collected through smartphone applications. In this study, variables that have the time series characteristic were used. In reality, two to four data items are redundant on average. In the preprocessing process, an input of the deep learning is a selected representative value from each method. The variables were sleep data, heart rate, step count, temperature, and humidity. Table 1 shows the devices of the healthcare participants. According to the device type that they used, the participants were classified into five groups; Group A consisted of participants who had a smartphone, a mobile application, a health band, a blood pressure meter, and a blood sugar meter.
Table 2 presents the data redundancy count by device type. The sleep data were collected from 10 persons by means of smartphone, smart watch, health band, and sleep mat. The attributes of the sleep data were deep sleep, light sleep, and roll over in sleep. There were redundant sleep data in groups B, D, and E. Both Groups B and D had three duplicate data, and group E had four. The heart rate data were collected by means of smartphone, smart watch, and health band.
In the case of mode, the error of no calculation can occur if none of the values among the redundant values are the same. In the case of percentile, the calculated result can differ according to k as the value of percentile defined by a user. If the k value is 0%, 25%, 50%, 75%, or 100%, the calculated result is the same as the quartile value. In the case of trimmed mean, a different calculated result appears according to the k value as the mean of the user-defined k values, excluding the maximum and minimum values [9]. Accordingly, in a heterogeneous healthcare platform, a representative value of data is selected from the effective mean, median, and quartile values. In this case, the second quartile produces the same result as the median, which is excluded. Algorithm 1 illustrates the selection algorithm of the representative values.
Algorithm 1. Selection of representative values
Input dk,c // unique value of the variable c collected on device k
    Vc // eigenvalues of the variable c
    dkmatrix[c] // variable c data matrix of device k
    Vcmatrix // data matrix of variable c
Output (i) Uamatrix// data matrix of user a
Step 1. Device scan of variables
  for k = 1 to num_decvice do
   for c = 1 to num_variable do
    if Vc == dk,c then
     Vcmatrix <- dkmatrix[c]
  // Store the variable c matrix of the device k in the data matrix of the variable c
Step 2. Selection of a data matrix for variable c
  for c = 1 to num_variable do
   find representative value from Vcmatrix[t] save data matrix return
Table 3 presents the selection of representative values using the mean, median, and quartile when the redundancy value of step count is “3”. As shown in this table, the step count calculation was based on smartphone, health band, and travel distance data. The first time step is shown at t001. At t001, the step count calculated by the smartphone was 4011, 4237 by the health band, and 3678 by travel distance. At this time, as representative values, the mean is 3975, the median is 4011, the first quartile is 3678, the third quartile is 4124, and the fourth quartile is 4237. Smartphones and health bands count steps by means of their gyro sensor. Travel distance is the accumulated travel distance according to the GPS.

3.2. Recurrent Neural Network Learning by Variables Using GRU Cells

Most data collected in heterogeneous healthcare platforms have the time series characteristic. Accordingly, an RNN that is suitable for the time series characteristic is learned. To learn an RNN, learning data with the same time step are required. In heterogeneous health, variables are collected in different time steps; therefore, it is difficult to design learning data. If the same variable has redundant data, it is difficult to determine which value should be used as the input for the RNN. In this study, by using GRU cells, the RNN was learned according to variables. Each RNN that was learned according to variables has no need to relearn the neural network, even if the situations of the user device are changed. Among the data collected from 26 persons, the data from 150 days were used for RNN learning, the data from 100 days were used for FCN learning, and the data from 50 days were used for testing. The healthcare proof data were divided into five sets according to the device types: A, B, C, D, and E. Learning was repeated five times with each set. Sleep data consisted of 6500 learning data that were based on the time when the sleep ends, with one time step daily. Sleep data attributes were light sleep (min), deep sleep (min), and roll over in sleep (count). The heart rate was the average heart beats per minute and was measured in the morning, afternoon, and evening, consisting of 19,500 data. The step count data collected were based on the steps measured from the time the individual finished work to the time he/she went to bed. Average temperature, highest temperature, lowest temperature, and relative humidity were recorded at 09:00, 12:00, and 18:00. Data collected on the basis of one day can be assumed to have the same time step; however, the collection time differs. Therefore, it was necessary to consider the time point. As a result, through preprocessing, one input for each variable was selected for every time step and applied to each RNN. According to the attributes, seven input values that had continuous time steps were applied, and the values for three time steps were predicted from the time when the last value was input. In other words, this RNN model used a {t − 7, t − 6, t − 5, t − 4, t − 3, t − 2, t − 1} matrix to predict {t + 0, t + 1, t + 2}.
Figure 3 presents GRU cells-based RNN learning according to variables. For a variable with multiple attributes, a many-to-many model was created, and for a variable with one attribute, a one-to-many model was designed. If the current input step is 1 January 2020, three forward points of time present the prediction data up to 3 January.

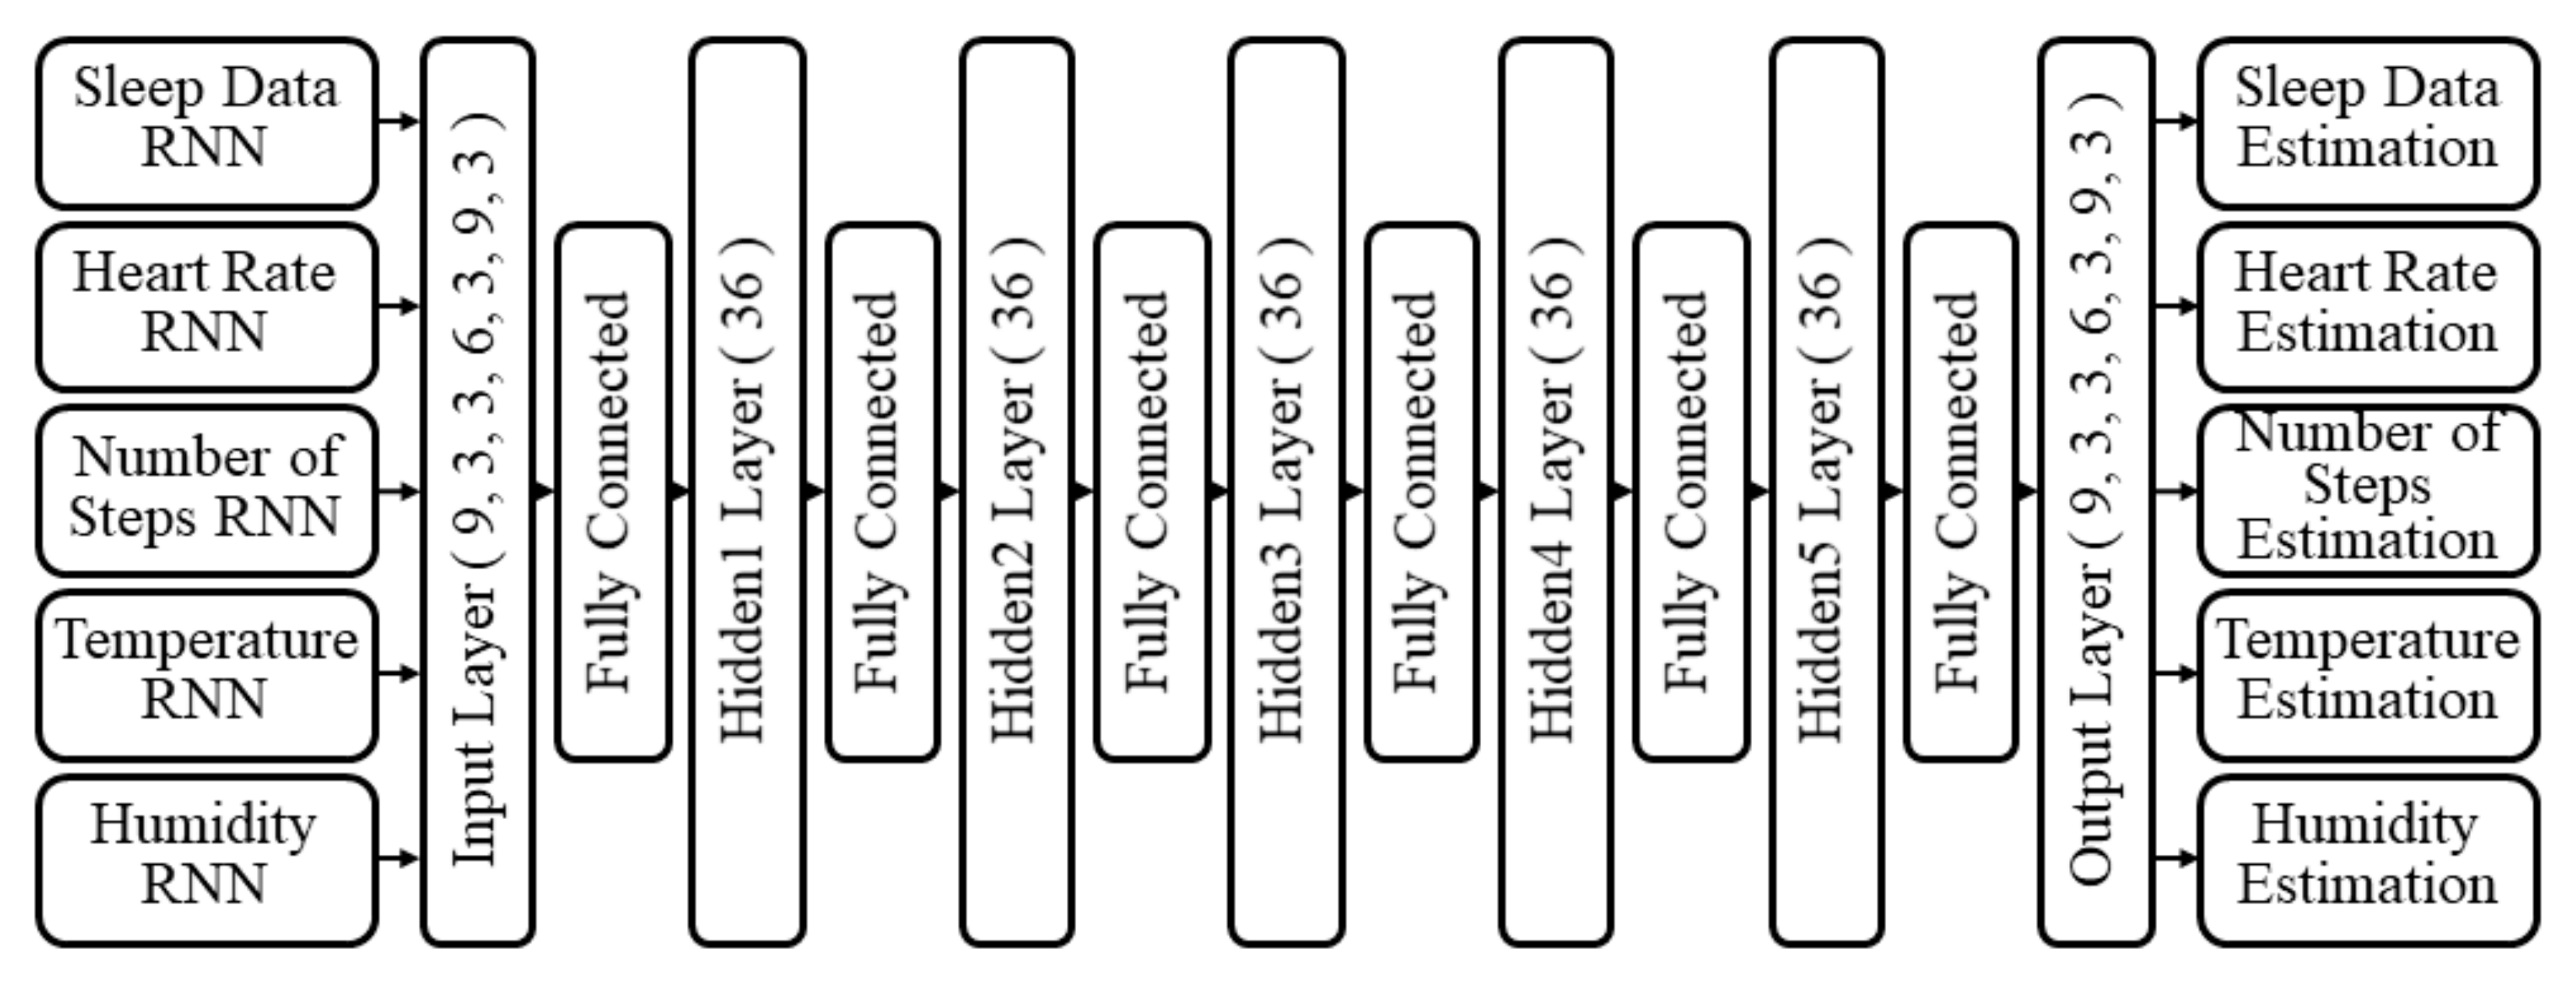
3.3. Estimation of Missing Value Using Multimodal Deep Learning

In a heterogeneous healthcare platform, missing values can occur because of the condition of the user’s device. Missing values are caused mainly by battery charge or discharge. They are also caused by various hardware and software errors, such as sensor failure, equipment replacement, and near-field communication error [29]. The higher the rate of the missing values, the more accurate the analysis or prediction influences the health analysis or decision making. Therefore, to achieve a more stable health platform, missing values need to be taken into consideration. A missing value is handled by replacing it with a mean, median, or estimated value, or by removing a relevant attribute [9]. In the method where it is replaced with a mean or median, if there are many missing values, the overall reliability can decrease, and the item is highly likely to become noise in terms of the time series characteristic. Estimation is a method of finding an approximate value to replace incomplete or uncertain data [11,12,13,14]. If it is difficult to find an accurate value for a target, an optimal result is therefore found by means of estimation. Deep learning is able to predict a missing value through the connection of nodes. Nodes are linked with each other through a weight that is updated through repeated learning and back propagation. Deep learning calculates an output value by using the updated weight and the influence of input variables that are transmitted by nodes. In such a structure, deep learning is able to estimate a missing value by means of an FCN.
The deep learning-based estimation of missing values solves the first-rating problem and sparsity problem (from which other estimation methods suffer) through the weight learning of nodes. The first-rating problem means that if a new variable has no data at the same time as other variables, it is impossible to make an estimation [4,30]. Sparsity occurs when a variable has many missing values. If sparsity occurs, either an estimation is impossible, or a large error occurs [31]. Accordingly, in this study, an approximate value of a missing value was determined through the neural network-based estimation. As described in Section 3.2, RNNs that are learned according to variables are connected with each other through an FCN to estimate a missing value. In an FCN, all the nodes are connected with each other. As the learning data of the FCN, the healthcare proof data that were collected for 100 days were used. The data did not include those used for RNN learning and performance evaluation. In learning, the answer for weight correction has the next time step of each variable. The input layer of the FCN comprised five variables as output values of an individual RNN. As shown in Figure 3, the RNN had 36 outputs: 9, 3, 3, 6, 3, 9, and 3. Accordingly, the input layer had 36 nodes and the output layer also had 36 nodes.
As a result of learning by changing the number of hidden layers in the proposed network, when the number of hidden layers is small, it appears sensitive to missing values, and when the number of hidden layers increases, it appears that excessive learning is required. The nodes of the hidden layer of the FCN were the same as those of the output layer; therefore, they also numbered 36.
According to an experiment, the best performance is achieved when the hidden layer has five nodes. Five layers were designed. In the design, the weight of the FCN numbers was (36 × 36) × 7. Therefore, 9072 weight values were generated. In an FCN, the weight values are updated in the flow of learning data. Through such repetition, the FCN is adapted to the complex correlation of the RNN output values. Figure 4 illustrates the structure of the proposed multimodal deep learning for estimating missing values.

4. Results and Performance Evaluation

4.1. Performance of Time Series Prediction

In a heterogeneous healthcare platform, multiple values for the same variable can be redundantly collected because of the multimodal characteristic of the platform. In this study, we propose a method for solving the redundancy problem through selecting representative values. Each of the RNNs was learned according to the representative value selection method, and their performance was evaluated. As the representative value, the mean, median, and quartile were used. The redundancy of healthcare proof data differed according to the device sets. In data sets B, D, and E, which had considerable redundancy of sleep data and step counts with high time series fluctuation, the data of 50 days (the data of the other 250 days were used for learning) were used to evaluate accuracy. Data set B had five persons, D had four persons, and E had one person. There was a total of 500 transactions. For accuracy, RMSE was used to evaluate the degree of error.
Table 4 shows the RMSE and representative value of sleep data. In this table, to +0 in Attribute means the value at the current time (+0) for “roll over in sleep,” and to +1 represents the value at the next time. ls means light sleep, and ds means deep sleep. The greater the distance of the sleep data prediction from the current time, the larger the error range.
According to the RMSE evaluation results of the representative value selection method, the difference between the mean and the median is not large. The quartile value was at a greater distance from the center of the data distribution than the mean or median. If it is used as a representative value, the prediction error is high. When the mean or median value was used as a representative value, the difference was not large. Therefore, using this method, it is possible to solve the redundancy problem of multiple devices.
Table 5 presents the RMSE of the number of steps. In this table, ns + 0 represents the value of the step count at the current time, and ns + 1 represents the value at the next time. The number of steps had a wide range and differed significantly according to the device used to record it. For this reason, the RMSE was high overall. In terms of the number of steps, the difference between the mean and the median values was not large, and the quartile value showed a high error. In a heterogeneous healthcare platform, in most cases data redundancy occurs two to four times. The mean-based representative value selection method uses the same calculation formula in all situations, regardless of the redundancy count, and therefore it is the most efficient method.

4.2. Performance by Estimation of Missing Values

Several missing value estimation methods exist, including collaborative filtering (CF), regression model (RM), k-nearest neighbor (KNN), and deep learning (DL) [10,31]. The missing value estimation method proposed in this study uses RNN-based multimodal deep learning (RMD). CF, RM, and KNN are widely used as traditional prediction methods and are commonly used in data mining. A large amount of data are required to train a deep learning model, and in the real world, data analysts or companies mainly use traditional methods before data are obtained for this situation. These methods were compared in terms of accuracy and turnaround time. The healthcare data are the test data selected by the mean-based representative value selection method. To assess the accuracy, the RMSE metric was applied to evaluate the degree of error. To assess the turnaround time, the mean of the time taken from the input time to the output time was evaluated. Table 6 shows the RMSE and turnaround time of each missing value estimation method. In this table, bs is blood sugar, hr is heart rate, sb is systolic blood pressure, db is diastolic blood pressure, ns is the number of steps, tm is the average temperature, lt is the lowest temperature, ht is the highest temperature, and hu is the average relative humidity. The turnaround time is the time taken from the data input to the end of the operation, and to the calculation of an output value [4]. According to the evaluation, the proposed RMD-based method had the lowest error overall. Nevertheless, RMD requires a great number of operations because of the large number of weights, and therefore it consumes a high turnaround time.

4.3. Performance by Sparse Coding

The accuracy of an FCN is high, as it has many nodes and a high depth. Unfortunately, a large number of nodes and a high depth generate a large number of weights and therefore a considerable number of resources are required. A heterogeneous healthcare platform should have high-level accuracy and a fast turnaround time. For this reason, it is necessary to reduce the amount of computation required. A neural network can be expressed by a continuation of matrix operations and can generate multiple approximate values of “0” in a weight matrix through repeated learning. Sparse coding is used to reduce multiple weights and thereby decrease the amount of computation. It has been studied for executing deep learning in environments with limited resources, such as mobile, wearable, and embedded environments. There are multiple means of achieving sparse coding, of which the typical ones are the singular value decomposition (SVD) method of removing the weights approximate to “0” [32] and a method of changing the neural network structure [33]. A weight that approximates “0” influences output less, and sparse coding is applied to reduce the values approximate to “0” to save resources [32]. The method of changing the neural network structure replaces the fully connected (FC) layer with a different layer [33] to reduce weights. In a mobile environment, sparse coding can be used to save resources if the loss of accuracy is taken into account [34,35]. In addition to sparse coding, resource distribution methods, such as cloud computing or edge computing, exist for executing deep learning in a mobile environment. These methods require a high cost without influencing the basic computation of deep learning [36]. Sparse coding-based deep learning can obtain additional benefits by reducing the amount of computation in a healthcare platform environment where device performance is limited. The proposed multimodal deep learning model was sparse-coded in each method for performance evaluation [37,38]. The performance comparison was conducted in terms of accuracy, parameters, turnaround time, and model size. The proposed multimodal deep learning model (MDM), SVD-based multimodal deep learning model (S_MDM), layer replacement-based multimodal deep learning model (D_MDM), and SVD and layer replacement-based multimodal deep learning model (SD_MDM) were compared [39,40,41]. In the completely learned RNN-based multimodal deep learning model, sparse coding was applied to remove the weights that approximated to “0”. Sparse coding is accompanied by a loss of accuracy because of the weight reduction; therefore, weights should be reduced only in an allowable range. Table 7 shows the effect of sparse coding on the performance of the multimodal deep learning models.

5. Conclusions

This study proposed a recurrent neural network-based multimodal deep learning for estimating missing values. By using the deep learning of soft computing, the proposed method solves both the data redundancy problem caused by data collection from heterogeneous devices and the problem of missing values caused by changing user situations. The multimodal design eases the requirement that the deep learning model has to be relearned when the mobile devices change. By selecting the representative values, the data redundancy caused by heterogeneous devices is removed. For the selection of a representative value, the mean, which features the simplest computation and is easily applicable to any situation, is used.
Using the data from which redundant items have been removed, an RNN is learned according to variables. Thus, it is possible to avoid the issue of relearning an existing model according to a device change or the addition of a new device. In addition, it is possible to smoothly learn the time series data that are collected in diverse time steps from heterogeneous devices. For estimating the missing value, each learned RNN is connected in a multimodal deep learning structure to learn the influence of variables on each other. An FCN is used to apply this influence on each one’s output values through weights. Thus, even if one variable has a missing value, it is possible to estimate an output value that is approximate to the missing value through other variables. For the assessment of the proposed method, the RMSE was used to evaluate the representative value selection and the RMSE and turnaround time to evaluate the estimation methods. The effect of sparse coding on the models’ performance was also evaluated.
According to the evaluation in terms of representative value selection, when a representative value was selected by using the mean or median, the most stable service was achieved. As a result of the evaluation according to the estimation method, the accuracy of the RNN-based multimodal deep learning method is 3.91%p higher than that of the SVD method. According to the evaluation in terms of estimation methods, the RNN-based multimodal deep learning had the smallest error. Nevertheless, the large number of operations in deep learning caused a big difference between the turnaround time of the proposed method and other methods. Therefore, sparse coding was applied to the learned models to reduce computation and decrease turnaround time. Sparse coding caused a loss of accuracy. For this reason, the model that had a higher accuracy rate than the other estimation models and achieved the shortest turnaround time was selected. By using the proposed missing value estimation method that uses RNN-based multimodal deep learning in a heterogeneous healthcare platform, it is possible to solve the problems that heterogeneous devices and deep learning generate. Nevertheless, it is necessary to preprocess learning data in the integration process of RNNs in the multimodal deep learning structure. If an RNN for a new variable is added, relearning for the FCN is required. These problems can be alleviated by combining deep learning techniques and machine learning techniques. Research and experiments on them are required. It is planned in the future research to solve this problem and study further the scalability of multimodal deep learning.

Author Contributions

Conceptualization, J.-C.K.; methodology, J.-C.K. and K.C.; validation, J.-C.K. and K.C.; writing—original draft preparation, J.-C.K. and K.C.; writing—review and editing, J.-C.K. and K.C.; visualization, J.-C.K. and K.C.; supervision, K.C.; project administration, K.C.; funding acquisition, K.C. All authors have read and agreed to the published version of the manuscript.

Funding

This work was supported by the GRRC program of Gyeonggi province [GRRC KGU 2020-B03, Industry Statistics and Data Mining Research].

Institutional Review Board Statement

Not applicable.

Informed Consent Statement

Not applicable.

Data Availability Statement

Data sharing not applicable.

Conflicts of Interest

The authors declare no conflict of interest.

References

  1. Zadeh, L.A. Fuzzy logic, neural networks, and soft computing. In Fuzzy Sets, Fuzzy Logic, and Fuzzy Systems: Selected Papers by Lotfi A Zadeh; Word Scientific: Singapore, 1996; pp. 775–782. [Google Scholar]
  2. Mitra, S.; Pal, S.K.; Mitra, P. Data mining in soft computing framework: A survey. IEEE Trans. Neural Netw. 2002, 13, 3–14. [Google Scholar] [CrossRef] [Green Version]
  3. Yoo, H.; Chung, K. PHR based diabetes index service model using life behavior analysis. Wirel. Pers. Commun. 2017, 93, 161–174. [Google Scholar] [CrossRef]
  4. Kim, J.C. Collaborative Layer Based Hybrid Multi-Modal Deep Learning for Improving Prediction Accuracy. Ph.D. Thesis, Department of Computer Science, Kyonggi University, Suwon-si, Korea, 2020. [Google Scholar]
  5. Das, T.K.; Mohapatro, A. A System for Diagnosing Hepatitis Based on Hybrid Soft Computing Techniques. Indian J. Public Health Res. Dev. 2018, 9, 235–239. [Google Scholar] [CrossRef]
  6. Bernal, E.A.; Yang, X.; Li, Q.; Kumar, J.; Madhvanath, S.; Ramesh, P.; Bala, R. Deep Temporal Multimodal Fusion for Medical Procedure Monitoring Using Wearable Sensors. IEEE Trans. Multimed. 2018, 20, 107–118. [Google Scholar] [CrossRef]
  7. Radu, V.; Tong, C.; Bhattacharya, S.; Lane, N.D.; Mascolo, C.; Marina, M.K.; Kawsar, F. Multimodal deep learning for activity and context recognition. In ACM on Interactive, Mobile, Wearable and Ubiquitous Technologies; Association for Computing Machinery: New York, NY, USA, 2018; Volume 1, p. 157. [Google Scholar]
  8. Kim, J.H.; Ahn, S.H.; Soh, J.Y.; Chung, K.Y. U-health platform for health management service based on home health gateway. In IT Convergence and Security 2012; Springer: Dordrecht, The Netherlands, 2013; pp. 351–356. [Google Scholar]
  9. Greco, S.; Kadziński, M.; SŁowiński, R. Selection of a representative value function in robust multiple criteria sorting. Comput. Oper. Res. 2011, 38, 1620–1637. [Google Scholar] [CrossRef]
  10. Han, J.; Pei, J.; Kamber, M. Data Mining: Concepts and Techniques; Elsevier: Amsterdam, The Netherlands, 2011. [Google Scholar]
  11. Zhong, Y.; Zhu, Z.; Ong, Y.S. Soft computing in remote sensing image processing. Soft Comput. 2016, 20, 4629–4630. [Google Scholar] [CrossRef] [Green Version]
  12. Zhang, J.; Tao, C.; Wang, P. A review of soft computing based on deep learning. In Proceedings of the International Conference on Industrial Informatics-Computing Technology, Intelligent Technology, Industrial Information Integration (ICIICII), Wuhan, China, 3–4 December 2016; pp. 136–144. [Google Scholar]
  13. Erturk, E.; Sezer, E.A. A comparison of some soft computing methods for software fault prediction. Expert Syst. Appl. 2015, 42, 1872–1879. [Google Scholar] [CrossRef]
  14. Moretti, F.; Pizzuti, S.; Panzieri, S.; Annunziato, M. Urban traffic flow forecasting through statistical and neural network bagging ensemble hybrid modeling. Neurocomputing 2015, 167, 3–7. [Google Scholar] [CrossRef]
  15. Yoo, H.; Park, R.C.; Chung, K. IoT-Based Health Big-Data Process Technologies: A Survey. KSII Trans. Internet Inf. Syst. 2021, 15, 974–992. [Google Scholar]
  16. Esteva, A.; Robicquet, A.; Ramsundar, B.; Kuleshov, V.; DePristo, M.; Chou, K.; Dean, J. A guide to deep learning in healthcare. Nat. Med. 2019, 25, 24–29. [Google Scholar] [CrossRef]
  17. Kang, J.S.; Baek, J.W.; Chung, K. PrefixSpan Based Pattern Mining using Time Sliding Weight from Streaming Data. IEEE Access 2020, 8, 124833–124844. [Google Scholar] [CrossRef]
  18. Xi, R.; Li, M.; Hou, M.; Fu, M.; Qu, H.; Liu, D.; Haruna, C.R. Deep Dilation on Multimodality Time Series for Human Activity Recognition. IEEE Access 2018, 6, 53381–53396. [Google Scholar] [CrossRef]
  19. Feldman, R.; Sanger, J. The Text Mining Handbook: Advanced Approaches in Analyzing Unstructured Data; Cambridge University Press: Cambridge, UK, 2007. [Google Scholar]
  20. Schmidt, P.; Reiss, A.; Duerichen, R.; Marberger, C.; Van Laerhoven, K. Introducing WESAD, a Multimodal Dataset for Wearable Stress and Affect Detection. In Proceedings of the International Conference on Multimodal Interaction, Boulder, CO, USA, 16–20 October 2018; pp. 400–408. [Google Scholar]
  21. Banos, O.; Villalonga, C.; Garcia, R.; Saez, A.; Damas, M.; Holgado-Terriza, J.A.; Rojas, I. Design, implementation and validation of a novel open framework for agile development of mobile health applications. Biomed. Eng. Online 2015, 14, S6. [Google Scholar] [CrossRef] [Green Version]
  22. Han, J.; Rodriguez, J.C.; Beheshti, M. Diabetes data analysis and prediction model discovery using rapidminer. In Proceedings of the International Conference on Future Generation Communication and Networking, Sanya, China, 13–15 December 2008; pp. 96–99. [Google Scholar]
  23. Fanaee-T, H.; Gama, J. Event labeling combining ensemble detectors and background knowledge. Prog. Artif. Intell. 2014, 2, 113–127. [Google Scholar] [CrossRef] [Green Version]
  24. Karami, A.; Gangopadhyay, A.; Zhou, B.; Kharrazi, H. Fuzzy approach topic discovery in health and medical corpora. Int. J. Fuzzy Syst. 2018, 20, 1334–1345. [Google Scholar] [CrossRef]
  25. Mikolov, T.; Karafiát, M.; Burget, L.; Černocký, J.; Khudanpur, S. Recurrent neural network based language model. Int. Speech Commun. Assoc. 2018, 2, 1045–1048. [Google Scholar]
  26. Sak, H.; Senior, A.; Beaufays, F. Long short-term memory recurrent neural network architectures for large scale acoustic modeling. arXiv 2014, arXiv:1402.1128. [Google Scholar]
  27. Chung, J.; Gulcehre, C.; Cho, K.; Bengio, Y. Empirical evaluation of gated recurrent neural networks on sequence modeling. arXiv 2014, arXiv:1412.3555. [Google Scholar]
  28. Hassanalieragh, M.; Page, A.; Soyata, T.; Sharma, G.; Aktas, M.; Mateos, G.; Andreescu, S. Health monitoring and management using Internet-of-Things (IoT) sensing with cloud-based processing: Opportunities and challenges. In Proceedings of the 2015 IEEE International Conference on Services Computing, New York City, NY, USA, 27 June–2 July 2015; pp. 285–292. [Google Scholar]
  29. Batista, G.E.; Monard, M.C. An analysis of four missing data treatment methods for supervised learning. Appl. Artif. Intell. 2003, 17, 519–533. [Google Scholar] [CrossRef]
  30. Lika, B.; Kolomvatsos, K.; Hadjiefthymiades, S. Facing the cold start problem in recommender systems. Expert Syst. Appl. 2014, 41, 2065–2073. [Google Scholar] [CrossRef]
  31. Zhu, X.; Zhang, S.; Jin, Z.; Zhang, Z.; Xu, Z. Missing value estimation for mixed-attribute data sets. IEEE Trans. Knowl. Data Eng. 2011, 23, 110–121. [Google Scholar] [CrossRef]
  32. Teoh, E.J.; Tan, K.C.; Xiang, C. Estimating the number of hidden neurons in a feedforward network using the singular value decomposition. IEEE Trans. Neural Netw. 2006, 17, 1623–1629. [Google Scholar] [CrossRef]
  33. Lane, N.D.; Bhattacharya, S.; Georgiev, P.; Forlivesi, C.; Jiao, L.; Qendro, L.; Kawsar, F. Deepx: A software accelerator for low-power deep learning inference on mobile devices. In Proceedings of the 15th International Conference on Information Processing in Sensor Networks, Vienna, Austria, 11–14 April 2016; p. 23. [Google Scholar]
  34. Baek, J.W.; Chung, K. Context Deep Neural Network Model for Predicting Depression Risk Using Multiple Regression. IEEE Access 2020, 8, 18171–18181. [Google Scholar] [CrossRef]
  35. Shin, D.H.; Park Roy, C.; Chung, K. Decision Boundary-Based Anomaly Detection Model Using Improved AnoGAN from ECG Data. IEEE Access 2020, 8, 108664–108674. [Google Scholar] [CrossRef]
  36. Shin, D.H.; Chung, K.; Park Roy, C. Prediction of Traffic Congestion Based on LSTM through Correction of Missing Temporal and Spatial Data. IEEE Access 2020, 8, 150784–150796. [Google Scholar] [CrossRef]
  37. Kim, J.C.; Chung, K. Discovery of Knowledge of Associative Relations using Opinion Mining Based on a Health Platform. Pers. Ubiquitous Comput. 2020, 24, 583–593. [Google Scholar] [CrossRef]
  38. Choi, S.Y.; Chung, K. Knowledge Process of Health Big Data using MapReduce-based Associative Mining. Pers. Ubiquitous Comput. 2020, 24, 571–581. [Google Scholar] [CrossRef]
  39. Kim, J.C.; Chung, K. Neural-Network based Adaptive Context Prediction Model for Ambient Intelligence. J. Ambient. Intell. Humaniz. Comput. 2020, 11, 1451–1458. [Google Scholar] [CrossRef]
  40. Chung, K.; Jung, H. Knowledge-based Dynamic Cluster Model for Healthcare Management using a Convolutional Neural Network. Inf. Technol. Manag. 2020, 21, 41–50. [Google Scholar] [CrossRef]
  41. Yoo, H.; Chung, K. Deep Learning-based Evolutionary Recommendation Model for Heterogeneous Big Data Integration. KSII Trans. Internet Inf. Syst. 2020, 14, 3730–3744. [Google Scholar]
Figure 1. RNN-based multimodal deep learning for estimating missing values.
Applsci 12 07477 g001
Figure 2. Data duplication of heterogeneous devices.
Applsci 12 07477 g002
Figure 3. GRU cells-based RNN learning according to variables.
Applsci 12 07477 g003
Figure 4. Structure of the proposed multimodal deep learning for estimating missing values.
Applsci 12 07477 g004
Table 1. Devices of healthcare participants.
Consist of Device
GroupABCDE
Smart PhoneOOOOO
Mobile App.OOOOO
Health BandOOO-O
Sleep Mat-O-OO
Smart Watch--OOO
Blood Pressure MonitorO----
Glucose MeterO----
People115541
Table 2. Data duplication count by device type.
GroupMemberNumber of Data Duplication
SleepHRStepsTemp.Hum.
A1103322
B532322
C503433
D432333
E143333
Table 3. Selection of representative values with the uses of the mean, median, and quartile (redundancy value of step count is ‘3’).
Representative Valuet001t002t003t004t005t006t007
smartphone4011789310,0483212877235414065
travel range3678698098873098832232893808
smartband4237801210,8323348884537434261
median4011789310,0483212877235414065
mean3975762810,2553219864635244044
Table 4. RMSE and representative value of sleep data.
RMSE of Sleep Data
Attributeto + 0, 1, 2ls + 0, 1, 2ds + 0, 1, 2
Mean1.29814.2408.122
Median1.31014.3978.147
1Quartile2.61917.1559.299
2Quartile2.37616.4878.802
3Quartile2.55417.1789.169
Table 5. RMSE of number of steps.
RMSE of Number of Steps
Attributens + 0ns + 1ns + 2
Mean80.47896.474107.023
Median82.89799.501111.051
1Quartile160.489190.984212.258
2Quartile120.714150.418170.143
3Quartile160.529191.019211.879
Table 6. RMSE and turnaround time of each missing value estimation methods.
RMSE of Number of Steps Estimation
DataEstimation Methods
VariableAttributeMeanCFRMKNNRMD
Sleep Datato + 0, 1, 218.2991.6151.8961.6241.298
ls + 0, 1, 2154.12217.71720.80717.82114.240
ds + 0, 1, 270.04810.10611.86810.1658.122
Blood Sugar mg/dLbs + 0, 1, 2147.82029.81332.29428.30227.029
Heart Ratehr + 0, 1, 288.2608.63110.1378.6836.938
Blood Pressure
mmHg
sb + 0, 1, 2118.9159.84010.46812.0888.829
db + 0, 1, 283.1757.5077.8767.4066.933
Number of Stepsns + 0, 1, 28864.11383.21624.41391.41111.7
Temperature
(°C)
tm + 0, 1, 215.2621.4911.8671.5041.068
lt + 0, 1, 27.2150.3410.4230.3400.262
ht + 0, 1, 218.6612.4752.8152.5251.955
Humidity (%)hu + 0, 1, 278.14010.83712.72710.9018.711
Average805.33123.63144.80124.3999.76
Avg.0.8970.8110.9411.194
Table 7. Performance according to the sparse coding of multimodal deep learning models.
MeasureModel
MDMS_MDMD_MDMSD_MDM
Accuracy75.37%71.46%69.51%66.47%
Parameter15,15711,57810,5787578
Turnaround Time (sec)Max.1.3561.1561.0140.814
Min.1.0770.8660.7810.611
Avg.1.1940.9180.8440.784
Data Size2.7 MB2.2 MB1.9 MB1.3 MB
Publisher’s Note: MDPI stays neutral with regard to jurisdictional claims in published maps and institutional affiliations.

