Article

Liver Disease Assessment in Children with Fontan and Glenn Surgeries for Univentricular Hearts—The Role of Elastography and Biochemical Fibrosis Markers

by
Roxana-Cristina Mareș
1,
Lorena Elena Meliț
1,*,
Rodica Togănel
2,
Răzvan-Gheorghiță Mareș
3 and
Cristina Oana Mărginean
1
1
Department of Pediatrics, George Emil Palade University of Medicine, Pharmacy, Science, and Technology of Targu Mures, Gheorghe Marinescu Street No. 38, 540136 Targu Mures, Romania
2
Department of Pediatric Cardiology, George Emil Palade University of Medicine, Pharmacy, Science, and Technology of Targu Mures, Gheorghe Marinescu Street No. 38, 540136 Targu Mures, Romania
3
Department of Pathophysiology, George Emil Palade University of Medicine, Pharmacy, Science, and Technology of Targu Mures, Gheorghe Marinescu Street No. 38, 540136 Targu Mures, Romania
*
Author to whom correspondence should be addressed.
Appl. Sci. 2022, 12(15), 7481; https://doi.org/10.3390/app12157481
Submission received: 6 July 2022 / Revised: 22 July 2022 / Accepted: 23 July 2022 / Published: 26 July 2022

Abstract

:
Background: Children born with single-ventricle hearts require surgery in order to survive. Liver fibrosis is a known complication of Fontan surgery for univentricular hearts. Methods: In this study on 13 post-Fontan and 21 post-Glenn patients, we used elastography (shearwave and transient elastography) as well as serum biochemical fibrosis markers to evaluate the degree of liver fibrosis in comparison to 32 controls. Results: The mean Emedian and Vmedian values determined by shear wave elastography in the Fontan Group were significantly higher than the controls (4.85 kPa vs. 3.91 kPa and 1.25 m/s vs. 1.12 m/s, respectively). Fontan patients had significantly increased Fibrotest, Actitest, AST-to-Platelet Ratio index, ALT and GammaGT levels compared to controls. For post-Glenn patients, the mean Emedian and Vmedian values were similar to healthy controls, whereas the Fibrotest, Actitest and AST-to-Platelet Ratio index were significantly increased. Using transient elastography, we found significantly higher values for Emedian and Vmedian in Fontan patients compared to Glenn patients. Conclusions: Elastography and biochemical fibrosis markers are valuable non-invasive tools for screening and monitoring liver fibrosis in patients with Fontan and Glenn interventions.

1. Introduction

Complex heart malformations with single ventricular physiology are severe congenital diseases, and in order to survive, patients with these conditions require a staged reconstruction, depending on the type of existing defects. The first operative step is performed immediately after birth and is represented by systemic-pulmonary shunt, pulmonary artery banding or Noorwood surgery. The second stage is the Glenn operation which connects the superior vena cava to the pulmonary artery and is performed in the first year of life. The final step is the Fontan operation which connects the inferior vena cava to the pulmonary artery [1].
Glenn and Fontan palliative surgeries have increased the life expectancy and quality of life of patients with complex congenital heart defects [2]. They have been used in patients with tricuspid valve atresia, pulmonary valve atresia, double-inlet right ventricle, total atrioventricular septal defects, right ventricle with double outlet with transposition of the great vessels and left ventricular hypoplasia with aortic stenosis [1].
Despite the undeniable beneficial role of Fontan surgery, survivors of the intervention develop many short- and long-term postoperative complications: arrhythmias, kidney failure, plastic bronchitis and liver fibrosis [3,4]. Liver damage secondary to Fontan surgery ranges from mild fibrosis to cirrhosis [5], but isolated cases of hepatocellular carcinoma have also been reported in adolescents and young adults [6]. Liver disease in patients with Fontan surgery occurs secondary to increased central venous pressure due to hemodynamic changes, decreased cardiac output and preoperative injuries (medication, hypoxia, perioperative injuries during systemic-pulmonary shunt or Glenn surgery) [7,8]. Liver biopsy is the gold standard for diagnosing fibrosis in many pathologies. However, the procedure can have life-threatening complications, especially in children, thus it is difficult to use as a follow-up tool. Given these limitations, several indices that incorporate parameters associated with inflammation or fibrogenesis have been proposed. These non-invasive methods for estimating liver fibrosis have been extensively studied in various pathologies in the adult population and much less in children, especially those addressing congestive liver disease [9].
Elastography is an imagistic technique used to noninvasively evaluate the stiffness of the liver, measuring the changes in the tissue when applying an outer mechanical force or an internal acoustic radiation. Elastography techniques may therefore be grouped into three categories: transient elastography (TE), which uses an external mechanical pulsation; acoustic radiation force impulse (ARFI) elastography, which uses an internal acoustic pulse; and strain elastography, which interprets the tissue deformation caused by external pressure or secondary to physiologic internal phenomena. The ARFI technique is divided into point-shear wave and 2D-shearwave, respectively [10]. TE and SWE have been used and validated in various studies for a wide-spectrum of liver diseases in adults, but cutoff values in children have just recently been published [11,12]. These methods are relatively inexpensive and easy to use for monitoring the evolution of the disease. Another great advantage over liver biopsy is that they allow extensive hepatic parenchyma assessment [13]. TE is performed using a special device which incorporates a vibrator positioned on the chest wall that generates an elastic wave. This device sends a signal of low amplitude to the liver tissue, inducing an elastic shear wave that propagates through the tissue. The speed of these waves is directly proportional to the stiffness of the tissue. The main strong point of TE is that it is widely available, whereas its weaknesses are the lack of imagistic guidance and the fact that it cannot be used in the case of ascites [10]. The 2D-SWE technique generates shear waves in the liver parenchyma by using the radiation force from a focalized ultrasound beam. The software offers a quantitative estimation of the rigidity of the tissue in the region of interest. In order to aid in the evaluation, color coding can be used to display the rigidity values [10]. Unlike TE elastography, SWE elastography is incorporated into an ultrasound system. Thus, a conventional ultrasound can be performed at the same time to select an area of the parenchyma without blood vessels or focal changes [14]. Moreover, this method is not influenced by the respiratory stages and does not require the cooperation of children on breathing, which is quite challenging at a young age. Several papers have reported higher accuracy of SWE than TE and it is also less operator-dependent [14,15]. Another great advantage is the fact that the color map can be stored and retrospectively analyzed as opposed to TE, making it especially suitable for children. SWE and TE are based on measuring the shear wave velocity propagating through the liver tissue. The liver stiffness in kPa is subsequently determined by converting the shearwave speed using Young’s elastic modulus (E = 3ρv2, where E is the stiffness, v is the shear wave velocity (m/s) and ρ is the density of tissue). The calculation is based on assumptions that the tissue is of constant density, homogenous, incompressible and with a linear elastic response. Thus, the conversion from velocity to stiffness may be inaccurate and it is preferable to report both measurements—velocity and stiffness [16].
Non-invasive serum markers have also been studied in various liver conditions in adults and children, yet fewer studies have been performed on non-invasive serum markers of liver fibrosis in postoperative Fontan and Glenn patients [17]. FibroTest investigation (proprietary formula, Biopredictive, Paris, France) was developed by Poynard and colleagues [18] and is based on an algorithm that uses the results of several serum biochemical markers (alpha 2 macroglobulin, haptoglobin, apolipoprotein A1, total bilirubin, gammaglutamyl-transpeptidase) to evaluate the level of fibrosis and necro-inflammatory activity [19]. The Actitest estimates the degree of necro-inflammatory activity by associating ALT with the before-mentioned markers. These investigations have been validated in patients with chronic hepatitis B and C, toxic hepatopathy and non-alcoholic hepatic steatosis [20,21,22]. The AST to Platelet ratio index (APRI) was originally used to estimate the level of liver fibrosis in patients with chronic hepatitis C. The APRI values > 0.7 showed a sensitivity of 77% and a specificity of 72% for the detection of fibrosis. For the detection of severe fibrosis or cirrhosis of the liver, it has been shown that APRI > 1 has a sensitivity of 61% and a specificity of 64% [23]. The FIB-4 score, originally developed for HIV-HCV co-infected patients, uses age, AST, ALT and platelet count to estimate liver fibrosis [24]. A FIB-4 score > 3.25 has a specificity of 97% and a positive predictive value of 65% for advanced fibrosis.
The aim of the study was to evaluate the degree of liver damage in patients that underwent Fontan or Glenn surgery compared to a group of healthy children using non-invasive methods, such as liver elastography and biochemical markers of fibrosis and liver inflammation. Secondly, we aimed to compare the serological biomarkers and elastography results of the Fontan group to the Glenn group.

2. Materials and Methods

2.1. Study Sample Selection

We performed a prospective, observational study on 66 children aged between 0 and 17 years in the Pediatric Clinic I in Târgu Mureș and the Pediatric Cardiology Clinic between January 2019 and March 2022. The children were included in 3 groups: 13 children who underwent the Fontan procedure (“Fontan group”), 21 children following the Glenn procedure (“Glenn group”) and 32 healthy children (“Control group”).
The inclusion criteria for the Fontan and Glenn groups consisted of children who had undergone the Fontan or Glenn surgery for functional univentricular hearts, without other acute or chronic digestive or respiratory illnesses. The malformations for which the Glenn (as an intermediate operative step) and afterward the Fontan operation (the final palliative step) was performed are: double-outlet right ventricle with malposition of the great vessels, large ventricular septal defect with transposition of the great vessels and pulmonary stenosis, pulmonary valve atresia, mitral valve atresia, tricuspid valve atresia with hypoplasia of the right ventricle and complete atrioventricular canal. The inclusion criteria for the control group were: clinically healthy children with a normal weight, without an acute or chronic illness, no history of recent medication, normal ultrasonographic morphology of the liver and normal laboratory parameters.
The exclusion criteria for the Fontan and Glenn groups were: children with obesity, hepatitis (of viral, autoimmune, metabolic or toxic origin), Gilbert syndrome or hemolysis (both of which can impair the results of the Fibrotest investigation), other acute or chronic respiratory, digestive or renal illnesses. The exclusion criteria for the control group consisted of children with modified laboratory parameters, abnormal liver ultrasound, obesity and acute or chronic illnesses.
A clinical exam was performed for each patient, determining the weight, height, BMI and oxygen saturations. Medical records were reviewed, and relevant demographic, anatomical, surgical and clinical patient characteristics were extracted.

2.2. Ethics

Our study was approved by the Ethics Committee of the University of Medicine, Pharmacy, Sciences and Technology Târgu Mureș (No 26/17 March 2016), the Ethics Committee of the Emergency County Hospital Târgu Mureș (No 29921/18 December 2015) and the Ethics Committee of the Emergency Institute for Cardiovascular Diseases and Transplantation Târgu Mureș (No 7908/6 November 2018). The study was performed according to the principles of the Helsinki Declaration. The study was explained to both children and their parents/caregivers prior to their inclusion. Signed informed consent was obtained from the parent/caregiver for the participation in the study, as well as on behalf of the child.

2.3. Elastography

Liver stiffness was determined by two methods: 2D-SWE and TE. The 2D-SWE method was performed using Logiq S8 General Electric equipment (General Electric Healthcare, Wauwatosa, WI, USA) and a LOGIQ Shear Wave Elastography S8 XDclear 2.0 software. The investigations were performed using a C1-6-D XDClear convex probe (General Electric Healthcare Company). For each child, 12 measurements were recorded and the final value was represented by their median (Emedian—median elasticity measured in kilo Pascals—kPa, Vmedian—median velocity). The measurements were performed at 1–2 cm below Glisson’s capsule, in a homogenous, free from blood vessels region of interest with a size of 0.5 cm, using an intercostal approach. An interquartile range of <0.3 was used for validation of the measurements.
TE was performed with FibroScan module IPX0 (Echosens, Paris, France) using the M probe. The measurements were performed by placing the probe in the seventh or eighth intercostal space in the right anterior axillary line. Investigations with ten valid shots and an interquartile range <0.3 were included, and the stiffness results were reported in kPa and the velocity in m/s.
Fasting duration before the investigations ranged from 4 h in infants to 6 h in adolescents. Children old enough to cooperate were placed with the right arm in abduction in a supine position, whereas infants were held in the supine position by an assistant. The right and left liver lobe lengths as well as the spleen length were measured and compared to normal length of subjects of the same age [25]. SWE was performed in 13 Fontan patients and 20 Glenn patients, and TE in 7 Fontan patients and 14 Glenn patients.
Liver elastography and ultrasonography were performed by a highly skilled physician with over 10 years’ experience in pediatric echography and 5 years in hepatic elastography.

2.4. Laboratory

The following blood parameters were determined after overnight fasting: blood count, AST, ALT, GGT, total bilirubin, a2-macroglobulin, apolipoprotein A1 and haptoglobin. The blood count and AST were assessed using a Cobas Integra 400 plus automated analyzer (Roche Diagnostics GmbH). The FibroTest investigation was performed in an external laboratory. Alpha2-macroglobulin, haptoglobin, apolipoprotein A1, bilirubin, GGT and ALT were determined following the preanalytical and analytical recommendations required to obtain the fibrosis marker score results. The FibroTest-ActiTest score was computed from the results of the six biochemical parameter assays (alpha2-macroglobulin, haptoglobin, apolipoprotein A1, bilirubin, GGT, ALT), adjusted for age and gender. The APRI score was calculated using the formula: (AST [U/L]) AST normal level [U/L]/Platelet count − PLT [10(9)/L] × 100 [26]. The FIB-4 score was calculated using the formula: (Age ([years] × AST [U/L])/((PLT [10(9)/L]) × (ALT [U/L])(1/2)) [24].

2.5. Statistical Analysis

We performed both descriptive statistical analysis (mean, median, standard deviation) and inferential statistics. To compare the different values between groups the Mann–Whitney test for non-parametric data, two-tails was used. The Spearman test for non-parametric data, two-tails was used for assessing the correlations. All tests with a p < 0.05 were considered statistically significant. The statistical analysis was performed using the GraphPad Prism 9 program.

3. Results

3.1. Clinical Characteristics of the Groups
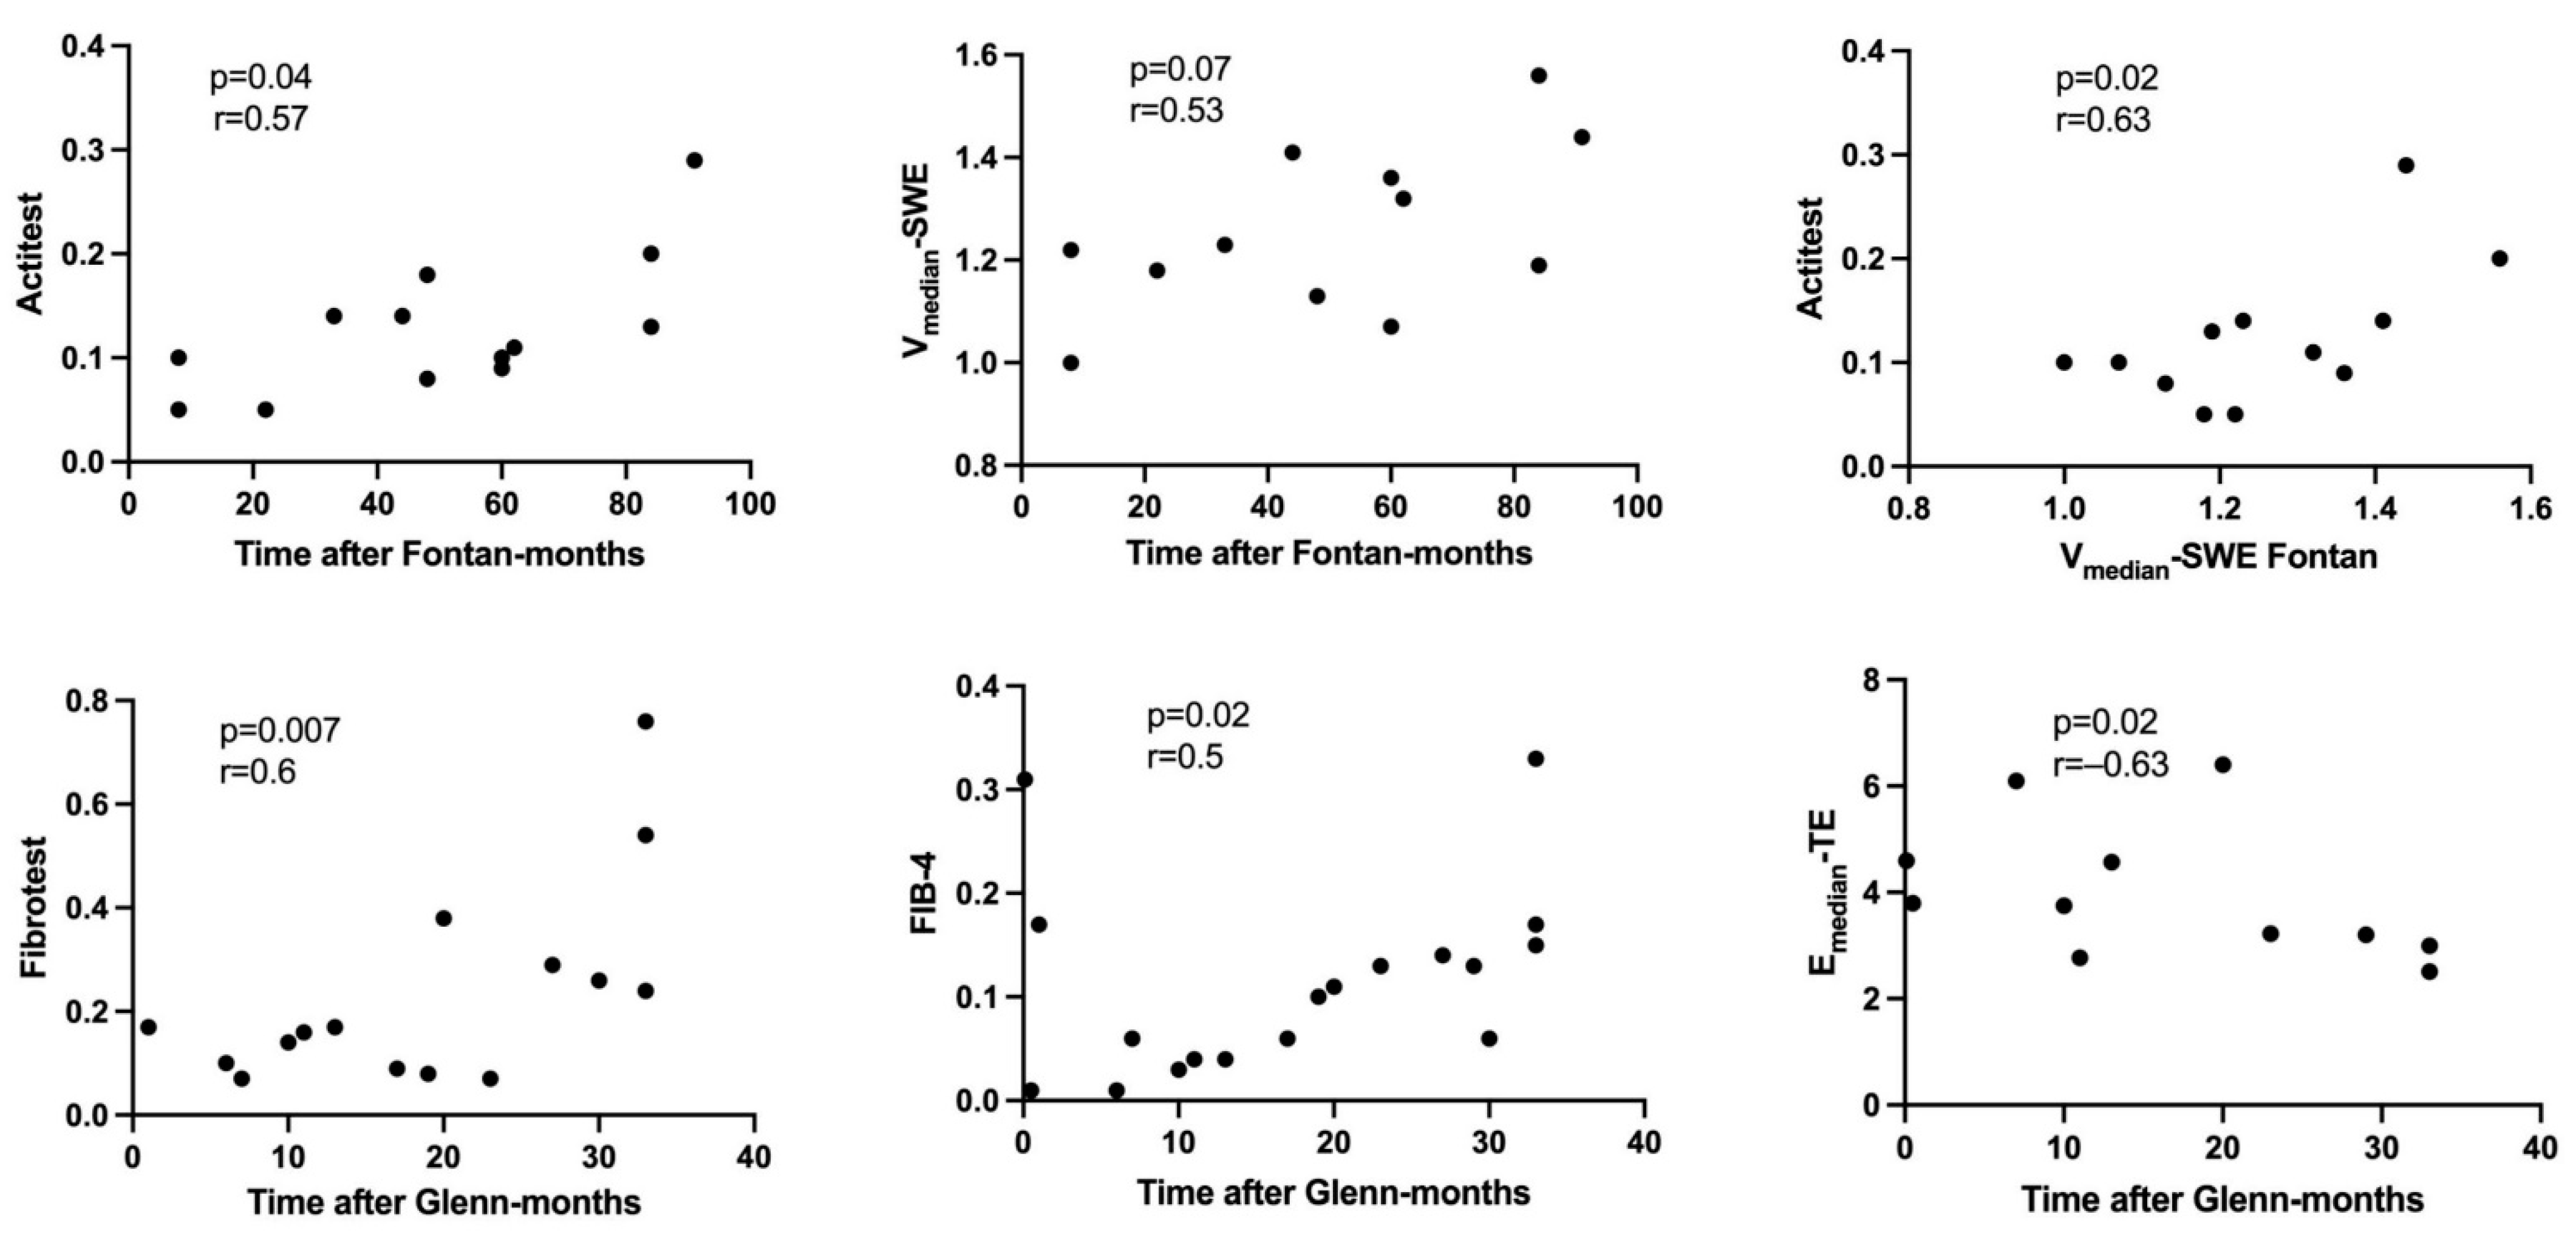
In our study, the gender distribution was similar between the three groups (69% males in the Fontan group, 52% males in the Glenn group and 53% males in the Control group), with no statistical difference between the groups: Fontan vs. Control p = 0.4, Glenn vs. Control p = 0.97. Regarding the age distribution, the Fontan group consisted of older children (mean age 10 years) compared to the Glenn group (mean age 5 years). There was no significant difference in the age of the children included in the Fontan or Glenn group vs. Controls (p = 0.27 and 0.059 respectively). In the Fontan group, 8 patients had a univentricular left heart and 5 patients had a univentricular right heart, whereas in the Glenn group, 9 patients had a univentricular left heart and 12 patients had a univentricular right heart. In total, 9 out of the total patients with the Fontan operation had fenestration and all Fontan patients had an extracardiac tunnel. On abdominal echography, we found that hepatomegaly was present both in the Fontan group (38% of patients) and in the Glenn group (33% of patients), whereas no children included in the control group had hepatomegaly. Regarding Fontan patients, we found three cases (23%) with splenomegaly, whereas only one patient from the Glenn group presented an enlarged spleen (4%). The children included in the Fontan and Glenn groups had a lower mean BMI than the healthy children included in the Control group (15.33 kg/m2 vs. 17.7 kg/m2, p = 0.13 and 15.71 kg/m2 vs. 17.7 kg/m2, p = 0.14). The patients in the Glenn group had a much lower mean oxygen saturation (82.8%) than the Fontan group (93.8%) and the control group (98.7%).
The baseline characteristics of the groups are included in Table 1. Figure 1 highlights the included patients and the main investigations.

3.2. Fontan Group

The Emedian values determined by SWE in the Fontan Group were significantly higher than the values of the control group (4.85 kPa vs. 3.91 kPa, p = 0.0049). Similarly, Vmedian values were higher in the Fontan group compared to controls (1.25 m/s vs. 1.12 m/s, p = 0.01) (Figure 2, Table 2).
In terms of laboratory results, when comparing the Fontan group to the controls, we found statistically significant differences for Fibrotest, Actitest, APRI, ALT, GGT, ApoA1, and the thrombocyte count (Table 2, Figure 3). We used the Mann–Whitney test for nonparametric values, unpaired, two tails.
The Fibrotest investigation revealed a degree of liver fibrosis in 9 patients: F1 fibrosis in 1 patient, F2 fibrosis in 7 patients and F3 fibrosis in 1 patient, whereas 4 patients had F0 fibrosis. The Actitest investigation revealed A1 necro-inflammatory activity in 3 patients and A0 in 9 Fontan patients.
We obtained a positive correlation between the time after the Fontan operation and ALT (r = 0.5, p = 0.04) and Actitest (r = 0.57, p = 0.03)—Figure 4. We also found a positive correlation between Vmedian determined by SWE and ALT (r = 0.7, p = 0.009) and also Actitest (r = 0.63, p = 0.02).
We found no significant correlation between the time after the Fontan operation and Vmedian determined by SWE (r = 0.53, p = 0.07) or Emedian determined by SWE (r = 0.07), respectively. The same results were found when correlating the time after Fontan with Emedian determined by TE (r = 0.69, p = 0.08) or Vmedian determined by TE (r = 0.7 p = 0.13). No significant correlation was obtained between Fibrotest and Vmedian determined by SWE (r = 0.46, p = 0.13 or between Fibrotest and Emedian determined by SWE(r = 0.1). We found no correlation between the time after Fontan operation and Fibrotest (r = 0.1).
When comparing Emedian values determined by SWE in the Fontan group to the cutoffs/age group published previously by our research group [11] (3–5 years: 4.13 kPa, 6–9 years 4.58 kPa, 9–11 years 4.58 kPa, 12–15 years 4.88 kPa, >15 years 4.65 kPa), we found that 8 patients in the Fontan group had elevated Emedian and Vmedian levels compared to cutoffs.
The liver stiffness values determined by TE were elevated in 6 out of 7 patients examined. The results of the Emedian and Vmedian determined by TE were much higher than the results of the SWE (Emedian 11.3 kPa vs. 4.85 kPa p = 0.01, Vmedian 1.86 vs. 1.25 p = 0.04). We found no correlation between Emedian results obtained by TE vs. SWE (r = −0.1, p = 0.7) or between Vmedian results obtained by the two methods (r = −0.08, p = 0.9).

3.3. Glenn Group

The characteristics of the Glenn group are included in Table 1.
The mean Emedian values determined by SWE in the Glenn group were slightly higher than the controls, with no statistical significance (3.99 kPa vs. 3.91, p = 0.96). Similarly, Vmedian values were not significantly higher in the Glenn group compared to controls (1.16 m/s vs. 1.12 m/s, p = 0.53) (Table 2, Figure 2).
When comparing the laboratory results of the Glenn group with the controls, we found statistically significant differences for Fibrotest, Actitest, AST, ALT, ApoA1 and APRI (Table 2, Figure 3).
The Fibrotest investigation showed a degree of fibrosis in 8 out of 18 patients examined: F0 fibrosis in 10 patients, F1 fibrosis in 4 patients, F2 fibrosis in 3 patients and F4 fibrosis in 1 patient. The Actitest showed an A1 necro-inflammatory result in only one patient, and A0 result in 17 patients. We found a significant positive correlation between the time interval since the Glenn operation and Fibrotest (r = 0.6, p = 0.0078) and the FIB-4 score (r = 0.508, p = 0.02), respectively. We obtained a negative correlation between the time interval after the Glenn operation and the thrombocyte count (r = −0.45, p = 0.04)—Figure 4. No significant correlation could be found between the time interval since the Glenn operation and either APRI, Emedian or Vmedian values determined by SWE. We found a negative correlation between the interval after the Glenn operation and Emedian determined by TE (r = −0.63, p = 0.02). Similarly, a negative correlation was obtained between the time after Glenn and Vmedian determined by TE, but with no statistical significance (r = −0.48, p = 0.3).
Comparing Emedian values determined in Glenn patients by SWE with the published cutoffs [11], we found that 5 out of 20 patients had Emedian elevated values, whereas 5 had Vmedian values over the cutoff. We obtained a positive correlation between Emedian determined by SWE and Actitest (r = 0.48, p = 0.05) and between Vmedian and Actitest (r = 0.81, p = 0.0002).
The liver stiffness values determined by TE were elevated in 6 out of 14 Glenn patients examined. The Emedian and Vmedian values determined by TE were similar to those obtained by SWE (Emedian 4.14 kPa vs. 3.99 kPa p = 0.8; Vmedian 1.25 m/s vs. 1.16 m/s, p = 0.25) but we could not obtain a significant correlation between the results determined by the two methods (for Emedian r = 0.1, p = 0.5, Vmedian r = −0.01, p = 0.97).

3.4. Fontan Group vs. Glenn Group

When comparing the Fontan to the Glenn group, we found statistically significant differences for: Emedian measured by SWE (p = 0.01), Fib-4 (p = 0.001) and GGT (p = 0.0004) (Table 2).
Using TE elastography, we found significantly higher values for Emedian and Vmedian in Fontan patients compared to Glenn patients (Emedian: 11.3 ± 5.9 kPa vs. 4.14 ± 1.3 kPa, Vmedian 1.86 ± 0.58 m/s vs. 1.25 ± 0.18 m/s; p = 0.003 and 0.05, respectively).
Comparing the TE elastography results for Fontan and Glenn patients with the age-specific cutoffs [11], we found that for Fontan patients, liver stiffness was significantly increased in 6 out of 7 patients examined and for Glenn patients in 6 out of 14 patients.

3.5. Operated Patients vs. Controls

When comparing the operated patients (Fontan + Glenn) to the control group, we found statistically significant differences for: Fibrotest, Actitest, AST, ALT, GGT, APRI, Haptoglobin, ApoA1 and the thrombocyte count (Table 3).

4. Discussion

4.1. Liver Elastography

Liver disease is a known side-effect of the Fontan operation for functional univentricular hearts. Fibrosis is universally present in patients 10 years after surgery [4]. Hepatic damage seems to precede the operation as shown in the study by Schwartz et al., which showed fibrosis being present in patients who died immediately after surgery [27]. Nevertheless, few studies have been performed documenting the liver alterations in patients with univentricular hearts before the Fontan palliation and the majority lack the validation with liver biopsy. Recently, Evans and co. published a study on 30 Fontan patients and found that liver stiffness values determined by SWE correlated significantly to liver fibrosis scores measured on biopsy specimens [28]. Kutty and co-workers used SWE as well and found significantly higher levels of liver stiffness compared to controls in a study of patients with Fontan surgery (15.6 vs. 5.5 kPa) [29]. For the patients who had liver biopsies, increased hepatic stiffness correlated with greater degrees of hepatic fibrotic changes. Another study of the same team on liver disease in patients with the Glenn procedure, showed that patients had slightly increased liver stiffness compared to healthy subjects (7.2 vs. 5.7 kPa) and that liver stiffness was correlated with increased right atrial pressure before surgery [30]. Interestingly, DiPaola et al. [31] using 2D-SWE obtained normal liver stiffness values in children with Glenn palliation which immediately increased after the Fontan procedure, probably due to the sharp pressure increase in the inferior vena cava [32]. Furthermore, high liver stiffness values immediately after the Fontan procedure might indicate inappropriate circulation. This could explain why liver stiffness determined by TE was found to be much higher after Fontan surgery compared to patients with heart failure due to right ventricle decompensation and secondary liver congestion [33].
In our study, we used SWE to compare the values of liver stiffness in Fontan and Glenn postoperative patients with those obtained in a group of healthy controls. Many reports documented that measurements of liver stiffness using this method can accurately estimate the degree of fibrosis in liver disease of different etiologies [12,34]. Emedian liver stiffness values determined by SWE were statistically significantly higher in patients with Fontan surgery compared to the control group (4.85 kPa vs. 3.91 kPa, p = 0.0049) but also compared to the group of postoperative Glenn patients (4.85 kPa vs. 3.99 kPa, p = 0.01). Similar results were obtained for Vmedian: 1.25 m/s in Fontan patients vs. 1.12 m/sec in controls (p = 0.01) and 1.16 m/s in Glenn patients, respectively (p = 0.08). Contrariwise to our study, Kutty and co. included older Fontan patients [28], thus with longer exposure to the Fontan hemodynamics, and used a different system for SWE evaluation (SuperSonic Imagine Aixplorer). These methodological differences could explain, at least partially, the impact on the values of hepatic stiffness. In addition, we obtained slightly higher values of hepatic stiffness in patients with Glenn surgery compared to the control group, without exceeding the threshold of statistical significance.
Transient elastography is another valuable noninvasive tool used in multiple chronic hepatic pathologies [35], and the liver stiffness values were compared to biopsy-proven fibrosis in Fontan patients. Liver stiffness values overestimated the level of fibrosis by one stage in 7 out of 10 patients, and in 9 out of 10 subjects overestimated the fibrosis level by two stages [36].
We performed transient elastography in a segment of patients who underwent Fontan and Glenn surgeries. The results were compared to the age-specific cut-offs published recently by our research team [11]. In post-Fontan patients, liver stiffness was significantly increased in 6 out of 7 patients suggesting advanced fibrosis, compared with post-Glenn patients where slightly increased liver stiffness was observed in 6 out of 14 patients (Mean Emedian 11.31 kPa in the Fontan group vs. 4.14 kPa in the Glenn group, p = 0.003; mean Vmedian 1.86 m/s in Fontan vs. 1.25 m/s in Glenn, p = 0.05). For Fontan patients, the liver stiffness values determined by TE were significantly higher than those obtained by SWE, but this difference was not obtained for the Glenn group. It is possible that liver stiffness results determined by TE are falsely elevated by congestion secondary to the increase in inferior vena cava pressures. We found only one study in Fontan patients including both elastographic methods which did not document this finding, but a different machine was used for SWE evaluation [37]. Further studies comparing these two methods and validation with biopsy are needed. We found no significant correlations between Emedian and Vmedian results obtained by SWE and TE, respectively. An explanation for the lack of correlation of values between the two types of measurements could be given by the relatively small number of measurements by TE, with the statistical test not having sufficient power. In addition, although the reproducibility of intra- and inter-observer elastographic measurements is considered to be high for both SWE and TE (intra-class correlation coefficient >0.9% [38]), a certain difference between measurements may be present even if they are performed by an experienced user. In the case of increased liver stiffness, a greater variability between the measurements obtained by different elastography systems is described [38]. Biochemical markers of fibrosis do not show such variability, so their determination in parallel with elastography can determine a more accurate diagnosis of liver fibrosis. For patients with Fontan surgery, the values of hepatic stiffness determined by Fibroscan were much higher, possibly due to significant congestion.
The development of hepatic fibrosis and complications after the Fontan palliation appear to be time-dependent [39,40]. Friedrich-Rust and colleagues found that 87% of patients with Fontan surgery had increased liver stiffness by transient elastography, suggesting liver cirrhosis. The study also showed that liver stiffness values positively correlated both with the time interval from Fontan surgery and the Fibrotest scores [16].
In our study, we found no significant correlation between the interval after the Fontan operation and Emedian and Vmedian determined by TE, and also V median determined by SWE. This could be due to the fact that the children included in the Fontan group had a relatively short period of time (average 50 months) after the surgery until the elastography assessment, compared to other studies which included adults as well. Other factors such as the different hemodynamics of each individual that might impact differently on the liver stiffness could be considered.
Interestingly, we found a negative correlation between the interval after the Glenn operation and liver stiffness values determined by TE. This result could be explained by acute liver damage secondary to inflammation, medications or peri-operative hypoxia.

4.2. Biochemical Markers

In several studies, standard hepatic laboratory parameters (liver enzymes, bilirubin, alkaline phosphatase, prothrombin time) showed no correlation to fibrosis detected on biopsy in patients with congestive hepatopathy [4]. AST and ALT are rarely elevated in stable Fontan patients and are not adequate for identifying and determining the severity of Fontan-associated liver disease [4]. Other studies showed that the most frequently altered standard laboratory test in Fontan patients is GGT, as a marker of stasis [41,42]. We found statistically significant differences for Fontan patients compared to controls for GGT and ALT. The GGT levels were also significantly higher in the Fontan group compared to the Glenn group. AST and ALT levels were significantly increased in the Glenn group compared to controls. Further, when comparing the operated patients (Fontan + Glenn groups) to the control group, we found statistically increased levels for AST, ALT and GGT.
Several studies have shown that a decreased platelet count correlates significantly to the degree of liver fibrosis in several hepatic disorders [43], whereas in congestive liver disease, a low platelet count is possibly secondary to splenic sequestration due to portal hypertension [44]. In our study, the platelet count was significantly lower in Fontan patients versus controls as well as in operated patients (Fontan + Glenn) versus controls.
Fibrotest/Actitest was extensively studied and validated with biopsy in Hepatitis B and C patients. However, there is less data on the modifications of this parameter in congestive hepatopathy. In a study on 145 patients with Fontan operation, Fibrotest showed a strong correlation to the period of time after the Fontan surgery and a mild correlation with liver stiffness values [41], whereas other studies failed to obtain a correlation between the duration of the Fontan circuit and Fibrotest [45]. In Fontan patients, we demonstrated statistically significant differences for Fibrotest and Actitest compared to the control group. In addition, Fibrotest, and Actitest levels were significantly increased both in Glenn patients and in the operated patients (Fontan and Glenn) versus controls. We also found a positive correlation between the time after the Glenn operation and Fibrotest scores. The serum fibrosis markers were more elevated in older patients with Glenn surgery who did not undergo the Fontan surgery for different reasons. This indicates that hypoxia and precarious hemodynamics specific to the Glenn patients affect the liver, thus liver damage starts before the Fontan surgery. We have also obtained a positive correlation between Actitest and liver stiffness results, both in the Fontan and the Glenn group. This could infer that necro-inflammatory activity may increase the results of liver stiffness. Elastographic measurements are known to be altered secondary to increased ALT values [44], but it is important to state that although the ALT levels were increased in Fontan and Glenn patients compared to controls, the values were in the normal range for age. In Fontan patients, Actitest and ALT results correlated with the time after the operation, thus the liver inflammation tends to increase over time.
With regards to the components of the Fibrotest, we have found that ApoA1 is significantly decreased in both Fontan and Glenn patients and also the total of operated patients (Fontan + Glenn) compared to controls. A significantly decreased level of haptoglobin was observed in the operated patients compared to controls. We obtained increased levels of A2MG in Fontan and Glenn patients but without statistical significance. These results are in line with the studies showing decreased levels of ApoA1 and haptoglobin and increased A2MG correlating with increased liver fibrosis [46].
APRI and FIB-4 scores have been studied as non-invasive fibrosis markers in several liver diseases [47]. An important study was published recently by Emamaullee and co. on 106 Fontan patients, validating non-invasive fibrosis markers with biopsy results [4]. Bridging fibrosis was associated with higher APRI and FIB-4 scores. The team established cutoffs of 0.6 for APRI and 0.74 for FIB-4 for detecting advanced fibrosis. In our study, APRI levels were significantly increased in Fontan and Glenn patients compared to controls, whereas Fib-4 levels were significantly increased in Fontan patients versus controls and in Fontan patients versus Glenn patients.
As the liver stiffness values in Fontan patients are elevated due to stasis secondary to the increase of pressure in the inferior vena cava, more studies comparing the elastography results to biopsy are required in order to establish cut-offs specific to this category of patients. Changes in the liver stiffness values in a Fontan patient on follow-up controls may be very important to document the progression of liver fibrosis [33,48].
In our study, the patients with Glenn surgery did not have increased liver stiffness on SWE elastography, but they did have increased biomarkers of fibrosis compared to controls. This indicates that the liver damage starts before the Fontan operation and is not only secondary to the stasis due to the Fontan circuit. Thus, children with Glenn surgery, especially those who do not undergo the Fontan palliation, must be monitored for liver fibrosis.

4.3. Study Limitations

The relatively small sample size was a limitation of this study, but it is valuable as it is, to our knowledge, the first study on Fontan- and Glenn- associated liver disease in Romania. Histological assessment to evaluate the degree of liver damage is missing, as we focused on noninvasive diagnostic instruments to detect liver disease. A relative limitation is the short time between the surgeries and evaluations, but it is also a strong point as very few studies were performed on these pediatric patients. Another strength is the evaluation of the two groups by two elastography methods, SWE and TE, which we found only in a single study reported so far, to the best of our knowledge.

5. Conclusions

Elastography and biochemical markers of fibrosis are valuable tools for screening and monitoring liver fibrosis. Using these noninvasive methods, we assessed liver fibrosis in a group of post-Fontan and post-Glenn patients, given the known prevalence of liver fibrosis in this category of patients. We obtained significantly higher liver stiffness values in Fontan patients compared to controls, whereas Glenn patients did not have increased stiffness results. TE liver stiffness results were much higher than those determined by SWE in the Fontan group, which may imply that TE results are more altered by congestion. Fibrotest, Actitest and APRI were significantly increased in both post-Fontan and post-Glenn patients, which implies that liver fibrosis is present before and after the Fontan surgery. We found a negative correlation between liver stiffness and the period of time after the Glenn surgery, suggesting that peri-operative insults increase the liver stiffness. The present study is among few to document the liver damage present in a group of Glenn patients; the evaluation of the patients using two elastography methods is also a novelty. Further studies on larger samples are needed in order to identify precise cutoffs for liver fibrosis for both elastography and serum biomarkers in patients with Fontan and Glenn surgeries. Until then, serial monitoring and documenting the changes in serum fibrosis markers and liver stiffness can be very helpful in the management of these patients.

Author Contributions

Conceptualization, R.-C.M., C.O.M. and R.T.; methodology, C.O.M., R.-C.M. and L.E.M.; validation, C.O.M.; formal analysis, R.-G.M.; investigation, R.-C.M., L.E.M. and C.O.M.; resources, R.T. and C.O.M.; data curation, R.-G.M. and R.-C.M.; writing—original draft preparation, R.-C.M., C.O.M. and R.-G.M.; writing—review and editing, C.O.M., R.T. and L.E.M.; supervision, C.O.M. and R.T.; project administration, C.O.M. and R.-C.M.; funding acquisition, R.-C.M. and C.O.M. All authors have read and agreed to the published version of the manuscript.

Funding

The Fibrotest investigations were funded by the PhD Program of the “George Emil Palade” University of Medicine, Pharmacy, Science and Technology of Târgu-Mureș, Gheorghe Marinescu Street No 38, 540136 Târgu-Mureș, Romania; funding number 45/2019 and 9/2021, financing source 13406/12/7 October 2015.

Institutional Review Board Statement

Our study was approved by the Ethics Committee of the University of Medicine, Pharmacy, Sciences and Technology, Târgu Mureș (No. 26/17 March 2016), the Ethics Committee of the Emergency County Hospital, Târgu Mureș (No. 29921/18 December 2015) and the Ethics Committee of the Emergency Institute for Cardiovascular Diseases and Transplantation, Târgu Mureș (No. 7908/6 November 2018). The study was performed according to the principles of the Helsinki Declaration.

Informed Consent Statement

The study was explained to both children and their parents/caregivers prior to their inclusion. Signed informed consent was obtained from the parent/caregiver for the participation in the study, as well as on behalf of the child.

Data Availability Statement

The data presented in this study are available on request from the corresponding author.

Acknowledgments

The authors thank the doctors from the Pediatric Cardiology clinic for their support.

Conflicts of Interest

The authors declare no conflict of interest.

Abbreviations

Emedianmedian stiffness
Vmedianmedian velocity
TEtransient elastography
ARFIacoustic radiation force impulse
SWEshear wave elastography
APRIAST-to platelet ratio index
PLTplatelet
GGTGamma glutamyl transpeptidase
nnumber
ApoA1apolipoprotein A1
A2MGalpha 2 macroglobulin
TBtotal bilirubin

References

  1. Fontan, F.; Baudet, E. Surgical repair of tricuspid atresia. Thorax 1971, 26, 240–248. [Google Scholar] [CrossRef] [PubMed] [Green Version]
  2. Soufi, A.; Gouton, M.; Metton, O.; Mitchell, J.; Bernard, Y.F.; Bozio, A.; Ninet, J.; Di Filippo, S. Quality of life of adult Fontan patients. Cardiol. Young 2021, 31, 97–104. [Google Scholar] [CrossRef] [PubMed]
  3. Khairy, P.; Fernandes, S.M.; Mayer, J.E., Jr.; Triedman, J.K.; Walsh, E.P.; Lock, J.E.; Landzberg, M.J. Long-term survival, modes of death, and predictors of mortality in patients with Fontan surgery. Circulation 2008, 117, 85–92. [Google Scholar] [CrossRef] [PubMed] [Green Version]
  4. Emamaullee, J.; Khan, S.; Weaver, C.; Goldbeck, C.; Yanni, G.; Kohli, R.; Genyk, Y.; Zhou, S.; Shillingford, N.; Sullivan, P.M.; et al. Non-invasive biomarkers of Fontan-associated liver disease. JHEP Rep. 2021, 3, 100362. [Google Scholar] [CrossRef]
  5. Goldberg, D.J.; Surrey, L.F.; Glatz, A.C.; Dodds, K.; O’Byrne, M.L.; Lin, H.C.; Fogel, M.; Rome, J.J.; Rand, E.B.; Russo, P.; et al. Hepatic Fibrosis Is Universal Following Fontan Operation, and Severity is Associated With Time From Surgery: A Liver Biopsy and Hemodynamic Study. J. Am. Heart Assoc 2017, 6, e004809. [Google Scholar] [CrossRef] [Green Version]
  6. Rodriguez De Santiago, E.; Téllez, L.; Guerrero, A.; Albillos, A. Hepatocellular carcinoma after Fontan surgery: A systematic review. Hepatol. Res. 2021, 51, 116–134. [Google Scholar] [CrossRef]
  7. Ohuchi, H. Adult patients with Fontan circulation: What we know and how to manage adults with Fontan circulation? J. Cardiol. 2016, 68, 181–189. [Google Scholar] [CrossRef] [Green Version]
  8. Mares, R.C.; Marginean, C.O. Noninvasive diagnosis of liver fibrosis in the complex cardiac malformation survivors—A review of the literature. Med. Ultrason 2021, 23, 453–462. [Google Scholar] [CrossRef]
  9. Gordon-Walker, T.T.; Bove, K.; Veldtman, G. Fontan-associated liver disease: A review. J. Cardiol. 2019, 74, 223–232. [Google Scholar] [CrossRef]
  10. Ferraioli, G.; Wong, V.W.; Castera, L.; Berzigotti, A.; Sporea, I.; Dietrich, C.F.; Choi, B.I.; Wilson, S.R.; Kudo, M.; Barr, R.G. Liver Ultrasound Elastography: An Update to the World Federation for Ultrasound in Medicine and Biology Guidelines and Recommendations. Ultrasound Med. Biol. 2018, 44, 2419–2440. [Google Scholar] [CrossRef] [Green Version]
  11. Mărginean, C.O.; Meliţ, L.E.; Ghiga, D.V.; Săsăran, M.O. Reference values of normal liver stiffness in healthy children by two methods: 2D shear wave and transient elastography. Sci. Rep. 2020, 10, 7213. [Google Scholar] [CrossRef] [PubMed]
  12. Mărginean, C.O.; Meliţ, L.E.; Ghiga, D.V.; Săsăran, M.O. The assessment of liver fibrosis in children with obesity on two methods: Transient and two dimensional shear wave elastography. Sci. Rep. 2019, 9, 19800. [Google Scholar] [CrossRef] [PubMed]
  13. Srinivasa Babu, A.; Wells, M.L.; Teytelboym, O.M.; Mackey, J.E.; Miller, F.H.; Yeh, B.M.; Ehman, R.L.; Venkatesh, S.K. Elastography in Chronic Liver Disease: Modalities, Techniques, Limitations, and Future Directions. Radiographics 2016, 36, 1987–2006. [Google Scholar] [CrossRef] [PubMed]
  14. Barr, R.G. Shear wave liver elastography. Abdom. Radiol. 2018, 43, 800–807. [Google Scholar] [CrossRef] [PubMed]
  15. Yao, T.T.; Pan, J.; Qian, J.D.; Cheng, H.; Wang, Y.; Wang, G.Q. Shear wave elastography may be sensitive and more precise than transient elastography in predicting significant fibrosis. World J. Clin. Cases 2020, 8, 3730–3742. [Google Scholar] [CrossRef]
  16. Fang, C.; Sidhu, P.S. Ultrasound-based liver elastography: Current results and future perspectives. Abdom. Radiol. 2020, 45, 3463–3472. [Google Scholar] [CrossRef]
  17. Friedrich-Rust, M.; Koch, C.; Rentzsch, A.; Sarrazin, C.; Schwarz, P.; Herrmann, E.; Lindinger, A.; Sarrazin, U.; Poynard, T.; Schäfers, H.J.; et al. Noninvasive assessment of liver fibrosis in patients with Fontan circulation using transient elastography and biochemical fibrosis markers. J. Thorac. Cardiovasc. Surg. 2008, 135, 60–567. [Google Scholar] [CrossRef] [PubMed] [Green Version]
  18. Poynard, T.; Munteanu, M.; Deckmyn, O.; Ngo, Y.; Drane, F.; Castille, J.M.; Housset, C.; Ratziu, V.; Imbert-Bismut, F. Validation of liver fibrosis biomarker (FibroTest) for assessing liver fibrosis progression: Proof of concept and first application in a large population. J. Hepatol. 2012, 57, 541. [Google Scholar] [CrossRef] [PubMed]
  19. Grigorescu, M.; Rusu, M.; Neculoiu, D.; Radu, C.; Serban, A.; Catanas, M.; Grigorescu, M.D. The FibroTest value in discriminating between insiginificant and significant fibrosis in chronic hepatitis C patients. The Romanian experience. J. Gastrointestin Liver Dis. 2007, 16, 31–37. [Google Scholar]
  20. Halfon, P.; Munteanu, M.; Poynard, T. FibroTest-ActiTest as a non-invasive marker of liver fibrosis. Gastroenterol. Clin. Biol. 2008, 32, 22–39. [Google Scholar] [CrossRef]
  21. Poynard, T.; Ngo, Y.; Munteanu, M.; Thabut, D.; Ratziu, V. Noninvasive markers of hepatic fibrosis in chronic hepatitis B. Curr. Hepat. Rep. 2011, 10, 87–97. [Google Scholar] [CrossRef] [Green Version]
  22. Lassailly, G.; Caiazzo, R.; Hollebecque, A.; Buob, D.; Leteurtre, E.; Arnalsteen, L.; Louvet, A.; Pigeyre, M.; Raverdy, V.; Verkindt, H.; et al. Validation of non-invasive biomarkers (FibroTest, SteatoTest and NashTest) for prediction of liver injury in patients with morbid obesity. Eur. J. Gastroenterol. Hepatol. 2011, 23, 499–506. [Google Scholar] [CrossRef] [PubMed]
  23. Wai, C.T.; Greenson, J.K.; Fontana, R.J.; Kalbfleisch, J.D.; Marrero, J.A.; Conjeevaram, H.S.; Lok, A.S. A simple noninvasive index can predict both significant fibrosis and cirrhosis in patients with chronic hepatitis C. Hepatology 2003, 38, 518–526. [Google Scholar] [CrossRef] [PubMed] [Green Version]
  24. Sterling, R.K.; Lissen, E.; Clumeck, N.; Sola, R.; Correa, M.C.; Montaner, J.; SSulkowski, M.; Torriani, F.J.; Dieterich, D.T.; Thomas, D.L.; et al. Development of a simple noninvasive index to predict significant fibrosis patients with HIV/HCV coinfection. Hepatology 2006, 43, 1317–1325. [Google Scholar] [CrossRef]
  25. Safak, A.A.; Simsek, E.; Bahcebasi, T. Sonographic assessment of the normal limits and percentile curves of liver, spleen, and kidney dimensions in healthy school-aged children. J. Ultrasound Med. 2005, 24, 1359–1364. [Google Scholar] [CrossRef]
  26. Lin, Z.H.; Xin, Y.N.; Dong, Q.J.; Wang, Q.; Jiang, X.J.; Zhan, S.H.; Sun, Y.; Xuan, S.Y. Performance of the aspartate aminotransferase-to-platelet ratio index for the staging of hepatitis C-related fibrosis: An updated meta-analysis. Hepatology 2011, 53, 726–736. [Google Scholar] [CrossRef]
  27. Schwartz, M.C.; Glatz, A.C.; Daniels, K.; Goldberg, D.J.; Rand, E.; Epelman, M.S.; Cohen, M.S. Hepatic Abnormalities Are Present Before and Early After the Fontan Operation. Ann. Thorac. Surg. 2015, 100, 2298–2304. [Google Scholar] [CrossRef]
  28. Evans, W.N.; Acherman, R.J.; Ciccolo, M.L.; Carrillo, S.A.; Galindo, A.; Rothman, A.; Mayman, G.A.; Adams, E.A.; Reardon, L.C.; Winn, B.J.; et al. A composite noninvasive index correlates with liver fibrosis scores in post-Fontan patients: Preliminary findings. Congenit Heart Dis. 2018, 13, 38–45. [Google Scholar] [CrossRef] [Green Version]
  29. Kutty, S.S.; Peng, Q.; Danford, D.A.; Fletcher, S.E.; Perry, D.; Talmon, G.A.; Scott, C.; Kugler, J.D.; Duncan, K.F.; Quiros-Tejeira, R.E.; et al. Increased hepatic stiffness as consequence of high hepatic afterload in the Fontan circulation: A vascular Doppler and elastography study. Hepatology 2014, 59, 251–260. [Google Scholar] [CrossRef]
  30. Kutty, S.S.; Zhang, M.; Danford, D.A.; Hasan, R.; Duncan, K.F.; Kugler, J.D.; Quiros-Tejeira, R.E.; Kutty, S. Hepatic stiffness in the bidirectional cavopulmonary circulation: The Liver Adult-Pediatric-Congenital-Heart-Disease Dysfunction Study group. J. Thorac. Cardiovasc. Surg. 2016, 151, 678–684. [Google Scholar] [CrossRef] [Green Version]
  31. DiPaola, F.W.; Schumacher, K.R.; Goldberg, C.S.; Friedland- Little, J.; Parameswaran, A.; Dillman, J.R. Effect of Fontan operation on liver stiffness in children with single ventricle physiology. Eur. Radiol. 2017, 27, 2434–2442. [Google Scholar] [CrossRef] [PubMed]
  32. Deorsola, L.; Aidala, E.; Cascarano, M.T.; Valori, A.; Agnoletti, G.; Pace Napoleone, C. Liver stiffness modifications shortly after total cavopulmonary connection. Interact. Cardiovasc. Thorac. Surg. 2016, 23, 513–518. [Google Scholar] [CrossRef] [PubMed] [Green Version]
  33. Yoo, B.W.; Choi, J.Y.; Eun, L.Y.; Park, H.K.; Park, Y.H.; Kim, S.U. Congestive hepatopathy after Fontan operation and related factors assessed by transient elastography. J. Thorac. Cardiovasc. Surg. 2014, 148, 1498–1505. [Google Scholar] [CrossRef] [PubMed] [Green Version]
  34. Samir, A.E.; Dhyani, M.; Vij, A.; Bhan, A.K.; Halpern, E.F.; Méndez-Navarro, J.; Corey, K.E.; Chung, R.T. Shear-wave elastography for the estimation of liver fibrosis in chronic liver disease: Determining accuracy and ideal site for measurement. Radiology 2015, 274, 888–896. [Google Scholar] [CrossRef] [Green Version]
  35. Fraquelli, M.; Rigamonti, C.; Casazza, G.; Conte, D.; Donato, M.F.; Ronchi, G.; Colombo, M. Reproducibility of transient elastography in the evaluation of liver fibrosis in patients with chronic liver disease. Gut 2007, 56, 968–973. [Google Scholar] [CrossRef] [Green Version]
  36. Wu, F.M.; Opotowsky, A.R.; Raza, R.; Harney, S.; Ukomadu, C.; Landzberg, M.J.; Valente, A.M.; Breitbart, R.E.; Singh, M.N.; Gauvreau, K.; et al. Transient elastography may identify Fontan patients with unfavorable hemodynamics and advanced hepatic fibrosis. Congenit. Heart Dis. 2014, 9, 438–447. [Google Scholar] [CrossRef]
  37. Talwar, S.; Gudala, V.; Joshi, R.; Shalimar, D.M.; Madhusudhan, K.S.; Kalaivani, M.; Choudhary, S.K. Noninvasive Assessment of Liver Stiffness in Patients Undergoing the Fontan Procedure. World J. Pediatr. Congenit. Heart Surg. 2020, 11, 572–577. [Google Scholar] [CrossRef]
  38. Ferraioli, G.; De Silvestri, A.; Lissandrin, R.; Maiocchi, L.; Tinelli, C.; Filice, C.; Barr, R.G. Evaluation of inter system variability in liver stiffness measurements. Ultraschall Med. 2019, 40, 64–75. [Google Scholar] [CrossRef] [Green Version]
  39. Baek, J.S.; Bae, E.J.; Ko, J.S.; Kim, G.B.; Kwon, B.S.; Lee, S.Y.; Noh, C.I.; Park, E.A.; Lee, W. Late hepatic complications after Fontan operation; non-invasive markers of hepatic fibrosis and risk factors. Heart 2010, 96, 1750–1755. [Google Scholar] [CrossRef]
  40. Kiesewetter, C.H.; Sheron, N.; Vettukattill, J.J.; Hacking, N.; Stedman, B.; Millward-Sadler, H.; Haw, M.; Cope, R.; Salmon, A.P.; Sivaprakasam, M.C.; et al. Hepatic changes in the failing Fontan circulation. Heart 2007, 93, 579–584. [Google Scholar] [CrossRef] [Green Version]
  41. Schleiger, A.; Salzmann, M.; Kramer, P.; Danne, F.; Schubert, S.; Bassir, C.; Müller, T.; Müller, H.P.; Berger, F.; Ovroutski, S. Severity of Fontan-Associated Liver Disease Correlates with Fontan Hemodynamics. Pediatr. Cardiol. 2020, 41, 736–746. [Google Scholar] [CrossRef] [PubMed] [Green Version]
  42. Lindsay, I.; Johnson, J.; Everitt, M.D.; Hoffman, J.; Yetman, A.T. Impact of liver disease after the Fontan operation. Am. J. Cardiol. 2015, 115, 249–252. [Google Scholar] [CrossRef] [PubMed]
  43. Ahmed, L.; Salama, H.; Ahmed, R.; Hamdy, S.; Al-Akel, W.; Shafi, S.A.; Mahgoub, A.; Hareedy, A.; Fathy, W. Non-invasive fibrosis seromarkers as a predictor of liver fibrosis in chronic hepatitis C and/or non-alcoholic steatohepatitis. Arab J. Gastroenterol. 2009, 10, 14–20. [Google Scholar] [CrossRef] [PubMed]
  44. Fidai, A.; Dallaire, F.; Alvarez, N.; Balon, Y.; Clegg, R.; Connelly, M.; Dicke, F.; Fruitman, D.; Harder, J.; Myers, K.; et al. Non-invasive Investigations for the Diagnosis of Fontan-Associated Liver Disease in Pediatric and Adult Fontan Patients. Front. Cardiovasc. Med. 2017, 4, 15. [Google Scholar] [CrossRef]
  45. Raizner, A.; Shillingford, N.; Mitchell, P.D.; Harney, S.; Raza, R.; Serino, J.; Jonas, M.M.; Lee, C.K. Hepatic Inflammation May Influence Liver Stiffness Measurements by Transient Elastography in Children and Young Adults. J. Pediatr. Gastroenterol. Nutr. 2017, 64, 512–517. [Google Scholar] [CrossRef] [Green Version]
  46. Ho, A.S.; Cheng, C.C.; Lee, S.C.; Liu, M.L.; Lee, J.Y.; Wang, W.M.; Wang, C.C. Novel biomarkers predict liver fibrosis in hepatitis C patients: Alpha 2 macroglobulin, vitamin D binding protein and apolipoprotein AI. J. Biomed. Sci 2010, 17, 58. [Google Scholar] [CrossRef] [Green Version]
  47. Sebastiani, G.; Castera, L.; Halfon, P.; Pol, S.; Mangia, A.; Di Marco, V.; Pirisi, M.; Voiculescu, M.; Bourliere, M.; Alberti, A. The impact of liver disease etiology and the stages of hepatic fibrosis on the performance of non-invasive fibrosis biomarkers: An international study of 2411 cases. Aliment. Pharmacol. Ther. 2011, 34, 1202–1216. [Google Scholar] [CrossRef]
  48. Egbe, A.; Miranda, W.R.; Connolly, H.M.; Khan, A.R.; Al-Otaibi, M.; Venkatesh, S.K.; Simonetto, D.; Kamath, P.; Warnes, C. Temporal changes in liver stiffness after Fontan operation: Results of serial magnetic resonance elastography. Int. J. Cardiol. 2018, 258, 299–304. [Google Scholar] [CrossRef]
Figure 1. Flowchart of included patients and main investigations.
Applsci 12 07481 g001
Figure 2. Mean Emedian Values determined by TE and SWE.
Applsci 12 07481 g002
Figure 3. Mean Serum Fibrosis Scores.
Applsci 12 07481 g003
Figure 4. Scatterplot showing correlations between various parameters for Fontan and Glenn patients.
Applsci 12 07481 g004
Table 1. Clinical characteristics of the groups.
Patient CharacteristicsFontan
N/Mean ± SD
Glenn
N/Mean ± SD
Control
N/Mean ± SD
Demographicsn = 13n = 21n = 32
Male/Female9/411/1017/15
Age (years)10 ± 3.835.24 ± 4.78.39 ± 5.48
Time interval since operation (months)50 ± 2725.2 ± 36-
Ultrasound evaluation
Univentricular left heart89-
Univentricular right heart512-
Extracardiac tunnel13 -
Fenestration9 -
Hepatomegaly570
Splenomegaly310
Clinical characteristics
BMI (kg/m2)15.33 ± 2.6715.71 ± 3.5917.70 ± 4.01
SO2 (%)93.8 ± 2.3982.8 ± 5.698.7 ± 0.2
Table 2. Comparison between the three groups—elastography and biomarker results.
InvestigationMean—FontannMean—GlennnMean—Controlnp
Fontan vs. Control
p
Glenn vs. Control
p
Fontan vs. Glenn
Emedian-SWE (kPa)4.85 ± 0.99133.99 ± 0.74203.91 ± 0.39320.00490.960.01
Vmedian-SWE (m/s)1.25 ± 0.16121.16 ± 0.16121.12 ± 0.16320.010.530.08
Fibrotest0.35 ± 0.19130.24 ± 0.18170.14 ± 0.07300.00150.0370.1
Actitest0.12 ± 0.06130.08 ± 0.03170.05 ± 0.03300.00010.00130.1
AST (U/L)34.1 ± 14.61333.2 ± 10.51826.6 ± 11.9280.050.040.61
ALT (U/L)25.8 ± 91321.34 ± 8.72117.1 ± 7.7280.0030.010.09
Fib-40.28 ± 0.1120.14 ± 0.13210.19 ± 0.1260.030.180.001
GGT (U/L)35.8 ± 161216.57 ± 102116 ± 18.630<0.00010.250.0004
TB (mg/dL)0.58 ± 0.36100.44 ± 0.24180.93 ± 2.4300.60.640.3
A2MG (g/L)3.27 ± 0.53133.34 ± 0.74173.14 ± 0.58300.50.340.8
Haptoglobin (g/L)0.76 ± 0.38130.77 ± 0.65171.03 ± 0.658300.220.060.6
ApoA1 (g/L)1.22 ± 0.1131.2 ± 0.25171.4 ± 0.27300.040.010.24
Right liver lobe (mm)112.39 ± 29.31291.51 ± 29.312101.84 ± 20.3310.390.080.15
Left liver lobe (mm)44.7 ± 10.11237.85 ± 11.343142.84 ± 9.5310.40.140.06
APRI0.39 ± 0.29120.39 ± 0.12200.21 ± 0.13280.00160.00170.86
Thrombocyte count (×103/uL)241.6 ± 5912271.38 ± 87.5621290.72 ± 64.4320.030.210.59
Legend: n = number, p = p value, E: elasticity, V: velocity, SWE: Shearwave elastography, GGT: Gamma glutamyltranspeptidase, TB: total bilirubin, A2MG: alpha 2 macroglobulin, ApoA1: Apolipoprotein A1, APRI: AST-to-Platelet ratio index. In bold- values with statistical significance (p < 0.05).
Table 3. Operated patients (Fontan + Glenn) vs. controls—elastography and biomarker results.
InvestigationMean—Fontan + GlennnMean—Controlnp
Emedian-SWE (kPa)4.33 ± 0.93333.91 ± 0.39320.12
Vmedian-SWE (m/s)1.2 ± 0.1301.12 ± 0.16320.08
Fibrotest0.29 ± 0.19300.14 ± 0.07300.0018
Actitest0.1 ± 0.05300.05 ± 0.0330<0.0001
AST (U/L)33.62 ± 12.13326.68 ± 11.9280.0076
ALT (U/L)23.06 ± 93417.35 ± 7.54300.0049
Fib-40.19 ± 0.13330.19 ± 0.13260.92
GGT (U/L)23.57 ± 15.753316 ± 18300.0045
TB (mg/dL)0.49 ± 0.29280.9 ± 2.48300.98
A2MG (g/L)3.31 ± 0.65303.14 ± 0.58300.32
Haptoglobin (g/L)0.77 ± 0.54301.03 ± 0.58300.05
ApoA1 (g/L)1.21 ± 0.2301.41 ± 0.27300.0053
Right liver lobe (mm)102.06 ± 25.432101.83 ± 20.3310.57
Left liver lobe (mm)41.6 ± 8.83142.8 ± 9.5310.68
APRI0.35 ± 0.2320.21 ± 0.13320.0001
Thrombocyte count (×103/uL)260.5 ± 6533290.72 ± 64.4340.02
Legend: n = number, p = p value, E: elasticity, V: velocity, SWE: Shearwave elastography, TE: transient elastography, GGT: Gamma glutamyltranspeptidase, TB: total bilirubin, A2MG: alpha 2 macroglobulin, ApoA1: Apolipoprotein A1, APRI: AST-to-Platelet ratio index. In bold- values with statistical significance (p < 0.05).
Publisher’s Note: MDPI stays neutral with regard to jurisdictional claims in published maps and institutional affiliations.

