Abstract
Technical debt is a well understood and used concept in IT development. The metaphor, rooted in the financial world, captures the amount of work that development teams owe to a product. Every time developers take a shortcut within development, the technical debt accumulates. Technical debt identification can be accomplished via manual reporting on the technical debt items, which is called self-admitted technical debt. Several specialised methods and tools have also emerged that promise to measure the technical debt. Based on experience in the community, the impression emerged that the measured technical debt is of a significantly different amount than the self-admitted debt. In this context, we decided to perform empirical research on the possible gap between the two. We investigated 14 production-grade software products while determining the amount of accumulated technical debt via (a) a self-admitting procedure and (b) measuring the debt. The outcomes show clearly the significant difference in the technical debt reported by the two methods. We urge development and quality-assurance teams not to rely on technical debt measurement alone. The tools demonstrated their strength in identifying low-level code technical debt items that violate a set of predefined rules. However, developers should have additional insight into violations, based on the interconnected source code and its relation to the domain and higher-level design decisions.
1. Introduction
During the software development cycle, teams are confronted with changing requirements, short deadlines, and high quality requirements. Combined, these lead to higher costs. Cost cuts are a common practice in all industries, and software development is no exception. Consequently, development teams are often forced to prioritise new functionalities over the internal product quality. However, managed carefully, the negative effects of cost and time pressure can even be used to boost long-term product success. In this context, the technical debt metaphor, rooted in the financial world, describes a crucial challenge in the software development industry.
The term “technical debt” was coined in 1992 by Ward Cunningham. He described the problem of introducing long-term problems into software products, caused by the failure to address existing quality problems in the software development life cycle [1]. The modern perception of the metaphor is that it describes technical trade-offs that can bring short-term benefits while possibly causing damage to the information solution in the long run. The technical debt metaphor initially focused on software implementation, at the source code level, and expanded gradually to software architecture, design and documentation, requirements, and testing. Like financial debt, technical debt also generates interest in the form of increased future costs as a result of quick and sometimes reckless planning and implementation decisions.
The well-defined and proven area of technical debt management consists of several steps and practices. The technical debt management process can be facilitated using manual approaches or even a dedicated tool. Their purpose is to support the proper decisions in situations where development teams are in doubt whether it is sensible to introduce some more debt to a project. One of the essential activities is the constant monitoring of the technical debt quantity.
While determining the technical debt amount, the development teams are faced with the two major approaches. One is known as “self-admitting technical debt”, where the developers are required to report and assess the technical debt themselves. They must keep records, called technical debt items, for every shortcut, a quality-compromising trade-off, or something they know that should have been done but was omitted deliberately [2]. A technical debt item consists of several attributes, among them also assessed effort (expressed in man-hours, man-days, and similar) to mediate the technical debt item. Typically, developers admit their technical debt via source code comments, issue tracking systems, pull requests, and commit messages [3]. Potdar et al. [2] define the self-admitted technical debt (SATD) as a deliberate quick or temporary fix that was introduced into the source code intentionally by the developers. The intention is usually driven by a feature demanding short deadlines. Sometimes, developers do not label their SATD with comments in their source code. The reasons may be because the source code should be anomaly-free, but it can also be a consequence of company-accepted practices. As a common reason for not labelling SATD in the code, Zampetti et al. [4] also state a lack of time. Reporting SATD has spread to several different sources dedicated to technical debt management [4].
In opposition, one could also use the second approach for determining the amount of technical debt: technical debt measurement. Several tools promise that the technical debt can be measured by employing a static code analysis, a code smell detection, and other rule-based approaches, to determine bad design decisions or bad source code. This approach is promising, especially, when (a) the team does not keep track of technical debt accumulation, when (b) the team is confronted with existing software, or when (c) the quality assurance team just want to have an additional insight via an automatic indicator on their software’s internal quality.
The landscape of specialised technical debt management and measuring tools is expanding. Teams can choose between several types of tools that offer functionalities from assessing current debt quantity via measuring quality attributes to manual debt management tools. However, our several years of experience with managing technical debt in production environments systematically suggests that the assessed technical debt amount might be significantly different when developers would admit it themselves compared to the automatically measured technical debt amount. We also experienced the impression several times that different tools report significantly different amounts of measured technical debt.
Based on the presented context, our aim was to investigate if and why there is a gap between admitting and measuring technical debt. We are not, however, advocating the correctness of any method, whether it be admitting or measuring technical debt. Our aim is not to validate if technical debt measurement works well, nor to measure developers’ performance in self-admitting technical debt. Our aim is to investigate the possible gap between the two without a prejudice regarding one approach being correct. This is why we formed the research questions that we address in this paper:
- RQ1—Is there a difference in detecting the technical debt amount between its manual identification and measuring it with specialised tools?
- –
- RQ1a—What is the difference between the admitted and the measured technical debt amount?
- –
- RQ1b—Is the amount of measured technical debt dependent on the tool that is used to measure it?
- RQ2—What are the causes for possible deviations in the identified technical debt amount?
The rest of the paper is structured as follows. A literature review is presented in the next section. We conducted a systematic literature review to capture the essence of the current state-of-the-art in the area. The process and the results are presented. The research method that we used to address the presented research questions is described in Section 3. The empirical data acquired via our research are presented in Section 4. This is followed by a section in which we examine the experiment data. The paper is concluded with the discussion, where we defend our answers by interpreting the empirical data. We close the paper with our final remarks.
2. The State-of-the-Art While Measuring Technical Debt
Technical debt is a well-known term that is used widely in current research. In our systematic literature review (SLR), implemented in early 2022, we investigated the state-of-the art and novelties in the field of technical debt measurement, supplemented by identifying existing research gaps within the domain. The goal was to gain an overview of the different aspects of measuring technical debt, investigating existing approaches, defined methods, used techniques, and available tools for measuring technical debt. The SLR was implemented using six different digital libraries: ScienceDirect, IEEE, Scopus, ACM, SpringerLink, and arXiv. The purpose was to detect any existing research on the following topics:
- Possible ways to measure, identify, estimate, assess, calculate, evaluate, or quantify technical debt;
- Available tools used for measuring technical debt; and
- Investigating accuracy in the area of technical debt measurement.
Based on the research focus, the search strings were formed, addressing different views of the implemented review. The search was conducted using the following aggregated search string:
(“technical debt”) AND (“estimat*” OR “calculat*” OR “assess*” OR “identif*” OR “measur*” OR “quantif*” OR “evaluat*”) AND (“method*” OR “approach*” OR “technique*”).
The results of the SLR were as follows:
- The first phase, initial search, while implementing the inclusion and exclusion criteria, resulted in a set of 1282 studies;
- The second review phase included removing possible duplicates, performing title, summary, and keyword-based screening. It resulted in 28 studies appropriate for inclusion in the next phase of the review;
- The full-text review was the third phase of the SLR. Directly, it provided a set of 11 primary studies;
- Finally, in the last phase, additional studies were included by employing a related work review. This is how we finished the review with 14 primary studies in the field.
Different technical debt domains were identified based on the presented search strings. A variety of research directions within the technical debt domain were also confirmed by Khomyakov et al. [5]. A precise estimation of technical debt is still under severe empirical and experimental inquiry [5]. According to the research by Pfeiffer and Lungu [6], there are difficulties in assessing technical debt or the maintainability of a system. As the authors claim, these two concepts are not easy to understand and are not directly measurable. Papapetrou [7] proposed that technical debt is presented as a ratio instead of using an abstract value. Using the ratio, considering complete project effort, increases understanding and the possibility to compare technical debt values. Therefore, we also use it in this paper.
Fernández-Sánchez et al. [8,9] conducted a systematic mapping study, identifying techniques and approaches that can be used in technical debt management. According to Fernández-Sánchez et al. [9], among the identified steps of technical debt management is quantity debt estimation using methods or dedicated tools. On the other hand, Fernández-Sánchez et al. [8] stated that the central artefacts of technical debt management are technical debt items, an estimate of the amount of principal, an estimate of the amount of interest, the probability of interest repayment, and the impact of technical debt.
The authors also studied technical debt measurement. Yu et al. [10] presented the Jitterbug tool. The tool first identifies easy-to-find debts, which is followed by intelligent help for developers while discovering the remaining debt items manually. This work motivation was an insufficient precision and recall in identifying self-admitted technical debt (SATD) in the current automated solutions, preventing thorough process automation. Kosti et al. [11] mention different ways for estimating the technical debt principal using structural proxies and monetised proxies. Based on a comparison of the metrics and SonarQube, Kosti et al. [11] found that, by using seven metrics, the technical debt amount can be determined with sufficient accuracy.
Kontsevoi et al. [12] describe a tool for estimating the amount of technical debt. The Technical DebT Reduction plAtform, or TETRA, uses metrics within the SQALE method. The authors [12] present individual aspects of the tool and the advantages and innovations in this field. Another tool was presented by Ludwig et al. [13]. The CBRI tool assesses architectural debt, the complexity of code or code debt, and the lack of documentation. The tool is based on the SQALE and the SIG methods, which is why it cannot offer a numerical amount of accumulated technical debt. Wiese [14] evaluates a framework focusing on technical debt prevention and repayment. The different tasks are recorded as tickets in a comprehensive project backlog and tagged and handled depending on their management category. The research by Tsoukalas et al. [15] divides the technical debt management approach into financial and software engineering approaches (methods and tools for estimating amounts). The authors have identified different approaches, with the SQALE, the CAST, and the SIG being paid the most attention. In conclusion, the researchers claim the need for a single tool that combines software metrics and TD estimation techniques implemented by different approaches.
Lenarduzzi et al. [16] also claim a more precise and fine-grained analysis of technical debt. The research compares the gap between the rule-based approach of SonarQube with the timings evident from the history of software projects in their dataset. Khomyakov et al. [5] also focus on the possibility of improving current methods (the SQALE) of estimating the amount of technical debt using simple regression models. Strečanský et al. [17] compare the Maintainability Index, the SIG Method, and the SQALE method, paying special attention to TD measurements of time series and trends in different sets of releases (major, minor, micro).
Jie et al. [18] stated that the developers who cause technical debt eliminate more than two-thirds of that debt. Aversano et al. [19] researched the relationship between the SATD and the measured technical debt values. They determined if the removal of the SATD resulted in lower objective measures of technical debt. According to the results, only in a few cases did the removal of SATD correspond to an effective reduction of technical debt values, while, in other cases, the indicated classes were removed [19]. However, we did not detect any research comparing the values of the SATD and the measured technical debt, which is the main research topic of this paper.
The overview of the implemented SLR is presented in Table 1, focusing on the leading methods for measuring technical debt. Although the literature review reveals the use of a large number of methods, only a small portion of them are mature for practical use. Therefore, only three methods are highlighted: the SQALE, the CAST, and the SIG. The SQALE method was used in 10 studies [5,6,8,11,12,13,15,16,17,19], CAST in 3 studies [5,6,15], and SIG in 6 studies [5,6,10,13,15,17]. Each of the methods in Table 1 uses a different quality model. While the CAST method uses a custom, ISO 9126-based quality model, the SIG is based completely on the outdated ISO 9126 quality model, and SQALE uses the currently valid and accepted ISO 25010. The source code being used as an input for a technical debt measurement is not the case only with the SIG method. It accepts specially prepared and reviewed data, which makes it less practical.

Table 1.
Leading methods and tools for measuring technical debt.
The aim of the literature review was also to identify available tools for measuring technical debt. Table 1 captures the tool support for each of the leading methods. While the proprietary methods CAST and SIG are used in only one proprietary tool, the open SQALE method can be detected in three different tools, namely SonarQube, Vector Squore, and NDepend, demonstrating the greater prevalence of the SQALE method in practical use. Consequently, the mentioned method was used in the present paper.
2.1. The SQALE Method and Related Tools
The SQALE (Software Quality Assessment based on Life-Cycle Expectations) method is used to estimate the quality and technical debt within software quality assessment [20]. The method is based on nine principles, which are presented in the SQALE Definition Document [21]. The SQALE uses the standard ISO 25010 quality model, resulting in nine characteristics to measure [21]:
- Reusability,
- Portability,
- Maintainability,
- Security,
- Usability,
- Efficiency,
- Changeability,
- Reliability, and
- Testability.
The method links sub-characteristics to a set of non-functional requirements [21]. Since the input to the SQALE method is a software source code, all of the included requirements have to be considered via the programming language’s specific set of rules [21]. The method defines the SQALE Quality Index (SQI), the remediation index connected to the quality model’s characteristics [20]. When analysing each element using the SQALE method, different characteristic indices are used: SQALE Testability, Reliability, Changeability, Efficiency, Usability, Security, Maintainability, Portability, and Reusability Indices [20]. Their aggregation into the SQI uses simple summarising, since all indices are normalised to an effort-based measure. This is how SQALE indices represents costs [21].
The SQALE method also defines different indicators to represent technical debt visually; e.g, “Rating indicator” uses five or more values (“A”–“E”) to visualise product quality level [21]. This is the basis for the product ratings in SonarQube [22]:
- Rating A—technical debt is less than 5%,
- Rating B—technical debt is between 6% and 10%,
- Rating C—technical debt is between 11% and 20%,
- Rating D—technical debt is between 21% and 50%,
- Rating E—technical debt is more than 50%.
In contrast, the technical debt ratio is expressed as a remediation effort/development effort [22].
As demonstrated in Table 1, various tools implement the SQALE method. Among the most advanced and frequently used platforms are SonarQube [23] and Vector Squore [24]. SonarQube [23] is an automatic code review platform, developed by SonarSource. It is designed to perform automated checks continuously. Static code analysis is supported by rules for detecting bugs, code smells, and security vulnerabilities in more than 20 programming languages. In addition, the technical debt measurement is also supported, showing the technical debt type, its severity, and its status. A detailed view of an individual debt also displays critical files and suggests improvements, offering help in technical debt remediation. Vector Squore [24] supports augmented analytics in several programming languages. It can be used for quality management support with functionalities for bugs and vulnerability overview, technical debt measurement, and exposing files with a high vulnerability. Since it also relies on the SQALE method, the technical debt is also shown visually and in the form of elimination effort and depicting critical categories.
The literature review shows that the SQALE method is the most prevalent and at the same time is used very frequently in existing quality management tools. As can be seen in Table 1, the method is supported within three of the identified tools. However, the NDepend is not a stand-alone tool but an extension for an existing IDE. Therefore, in the presented research, we employed the SQALE method within the two tools SonarQube [23] and Vector Squore [24].
3. Research Method
The empirical research method, used to answer the research questions (see Section 1), consists of seven steps, grouped in five stages (see Figure 1). They include a systematic literature review (SLR) to check the novelty and state-of-the-art in the field, gathering software products, admitting and measuring technical debt, and interpreting the results. A birds-eye view of the research method is presented in Figure 1. Our research method consisted of several activities and steps.
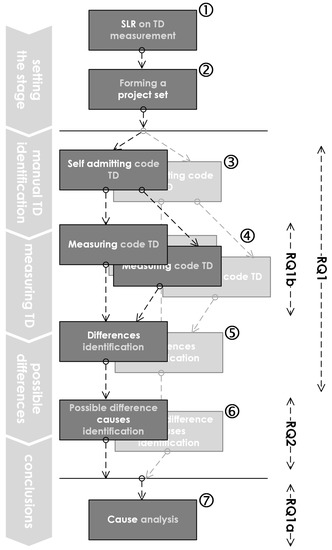
Figure 1.
Research Method Highlight.
- (1)
- The Systematic Literature Review (SLR) on the technical debt measurement was the first step. In addition to the well-established self-admitting technical debt management activities, the SLR approach was employed to give a complete and clear overview on the field of measuring technical debt. The aim of the SLR was to investigate the best approaches, the established models, and appropriate tools for measuring technical debt. The details on the current state-of-the-art in the area, extracted from the SLR activity, were already presented in Section 2.
- (2)
- Forming a Project Set was the next step, aimed at gathering a set of production-grade software products. It is of the utmost importance that we managed to include 14 information solutions, 8 of which are already deployed in a production environment. Their sizes vary from several thousand to several tens of thousands lines of code, with a pure development effort ranging from 1 to 11 person-months of a full-time-job in professional development. The projects’ titles and development companies are hidden at their request. However, the metadata (solution type, programming languages, year of first production, etc.) are presented in Section 4. We also managed to include six projects that were not in public production at the moment of conducting the research. However, their source code reflects the current state of the product, which covers all the initial requirements and is ready for initial production deployment (but had not been exposed to real production so far). These products are of similar sizes compared to the first eight products. Their development efforts average at three person-months. The selected projects were gathered by different companies and different development teams. Our requirement was to include production-ready software, where development teams agreed to invest their valuable time into the self-admitting procedure. The details can be found in Section 4.
- (3)
- Self-admitting code technical debt was the next step, where the development personnel who wrote the source code of the previously mentioned projects were included. We prepared an online-hosted backlog for technical debt items. Afterwards, we kindly asked the developers to review their code carefully while reporting technical debt via the prepared form. Please note that we prepared a short workshop for the developers in order to present the technical debt metaphor and demonstrated the self-assessment process. We rely on the research findings, which state a connection between the identified technical debt items and the ownership of the source code [25]. The developers were asked to report the title, description, technical debt type and sub-type (closed selection), and assessed effort to mediate for every technical debt item. This is how we were able get a complete assessment of the SATD (self-admitted technical debt) for every project. Please take into account that, in terms of the SATD, we did not focus on technical debt types that are not directly source-code related (e.g., requirements debt, documentation debt, architecture debt, etc.). Therefore, we excluded non-relevant technical debt items. This is how aggregated source code debt was collected (inclusive of unit-test debt).
- (4)
- Measuring code technical debt was a step that was deliberately put after the collection of the SATD. This is how we controlled the threat that the developers could be influenced by the technical debt reported by the tools. As explained in Section 2, we used the two highest ranked tools, namely SonarQube and Vector Squore. They both implement the SQALE method for measuring technical debt. We used two tools since we were curious if and what would be the difference between them (see research question RQ1b). During this step, every project was measured twice, and the results were collected (summarised technical debt as well as reported technical debt items).
- (5)
- The differences identification was conducted after we finished measuring the technical debt in the projects. We put the results side-by-side. Please note that we calculated the relative measure of the technical debt (assessed effort size is divided by the complete project development effort) for all three reported debts: SATD, SonarQube-measured, and Vector Squore-measured. Thus, the results are comparable, regardless of the project size. Based on relative measures, we calculated the mismatch between the two. We also calculated the difference between the measurements from different tools.
- (6)
- Searching for possible causes for differences of identification was a joint activity with the developers. After comparing the differences between the reported technical debt items, we kindly asked the developers if they could take a look at the automatically reported technical debt items and give concrete example differences and their opinion of why the difference had emerged in first place. We also took a detailed look at the differences reported by the different tools to see what the origin of the differences was.
- (7)
- Cause analysis was the last step of the research summarised in this paper. The causes were aggregated and confronted with the research questions.
4. The Experiment
The empirical data that support our findings were collected using an experiment, which is presented in detail in Section 3. The selected software products were exposed to the manual admission of the technical debt and automatic measurement with two different tools. The data were collected and prepared for interpretation.
4.1. The Projects under Examination
Our research was based on software developed by professional developers and intended for production use. During the development, the products were exposed to a real-life scenario, including weighting trade-offs between new functionalities, a high internal quality, and delivering on-time. We were given full access to the source code and were supported by the development personnel of 14 information solution development projects (please see Table 2). In this paper, we report on all of them as they were. We do not have permission to expose company or product names; this is why we use product codes in this paper to represent individual projects.
Table 2.
The projects under examination—profiles.
We would like to remind readers that an added value of the presented research lies in the fact that the projects that we managed to examine are real projects from industry, done for real clients, by real professional developers. Our requirements were that we had access to the development teams and that the project metadata (effort) were trustworthy and not a guess. The presented projects came from different sources and were collected by several different companies and several different development teams. They included development projects that were small-sized (1.7–2.7 person-month development: projects #1, #2, #5, #6, #9, #10 and #14), mid-sized (3.2–3.3 person month development: projects #8, #11 and #13), and larger (4–11.3 person month development: projects #3, #4, #7 and #12). Technologically, the investigated projects include several industry-leading languages, frameworks, and environments.
- HTML, CSS, JavaScript, TypeScript;
- Java, Kotlin, Java/Jakarta EE, Spring, SpringBoot, JSF;
- C#, ASP.NET MVC;
- Node.JS, React, Wildfy;
- PHP;
- Several database systems: MongoDB, MySql, PostgreSQL, MS SQL Server;
- Cloud services: Firebase, Auth0; and
- Integration with third party components.
The information solution types also vary.
- Stand-alone web applications;
- Web applications as a part of a larger system;
- Mobile applications with a cloud-based back-end;
- Intelligent (AI-enabled) solution, and
- information solution with a mobile- and web-based user interface.
The size of the finished products was measured with the SonarQube. The products sizes varied from relatively small products (project #14) to relatively large products (projects #5, #7 and #11).
Additionally, the diversity is also demonstrated when we talk about the maturity of the products: eight of them (projects #1–#8) are already deployed in a production environment, while six (projects #9–#14) were not in public production at the moment of conducting the research. The research was done during 2021 and in early 2022. The “Initial deployment” column for projects #9–#14 stands for deployment to a test environment rather than production.
Please see Table 2 for a complete record of the 14 projects that we were allowed to investigate in detail.
4.2. Results
As explained earlier in Section 3, the projects were investigated three-times for the accumulated technical debt.
Firstly, the developers who originally created the source code were asked to report on the self-admitted technical debt (SATD). To do so, an online form was created for them to track the technical debt items. Regarding the research focus, we did not ask them to insert a comprehensive record of the technical debt (such as collected by specialised platforms). Instead, we asked them to insert several focused technical debt items (TDI) for their project:
- TDI Title (e.g., Authorisation verification on front-end);
- TDI Short description (e.g., The authorisation is verified on every web page instead of having a central authorisation scheme validation);
- TDI Location (e.g., /src/components/UI.js);
- TDI Type (Design, Core);
- TDI Subtype (Code smell, Complex classes or methods, Grime, Incomplete design specification, Low-quality code, Duplicate code, Coding violations, Complex code);
- TDI Estimated mediation cost (e.g., 4 h 30 min).
The TDIs for every project were reviewed, and only code-related TDIs were summarised (e.g., incomplete specifications were not included). This is how we were given the total self-admitted code technical debt per project.
Secondly, every project’s source code was measured with two platforms: the SonarQube and the Vector Squore. Both were deliberately not fine-tuned for a special purpose (e.g., setting a custom code-smell or coding standard rules) but were used “as-is”: settings were left in an “out-of-the-box” manner.
We translated the reported technical debt amount from an absolute, time-based measure to a relative one. The time-based measure was normalised according to a particular project total effort. This step was crucial in terms of the ability to compare the technical debt amount between different projects (e.g., a 1 h technical debt in a 100 h project is of equal importance as 10 h in a 1000 h project—1% in both cases).
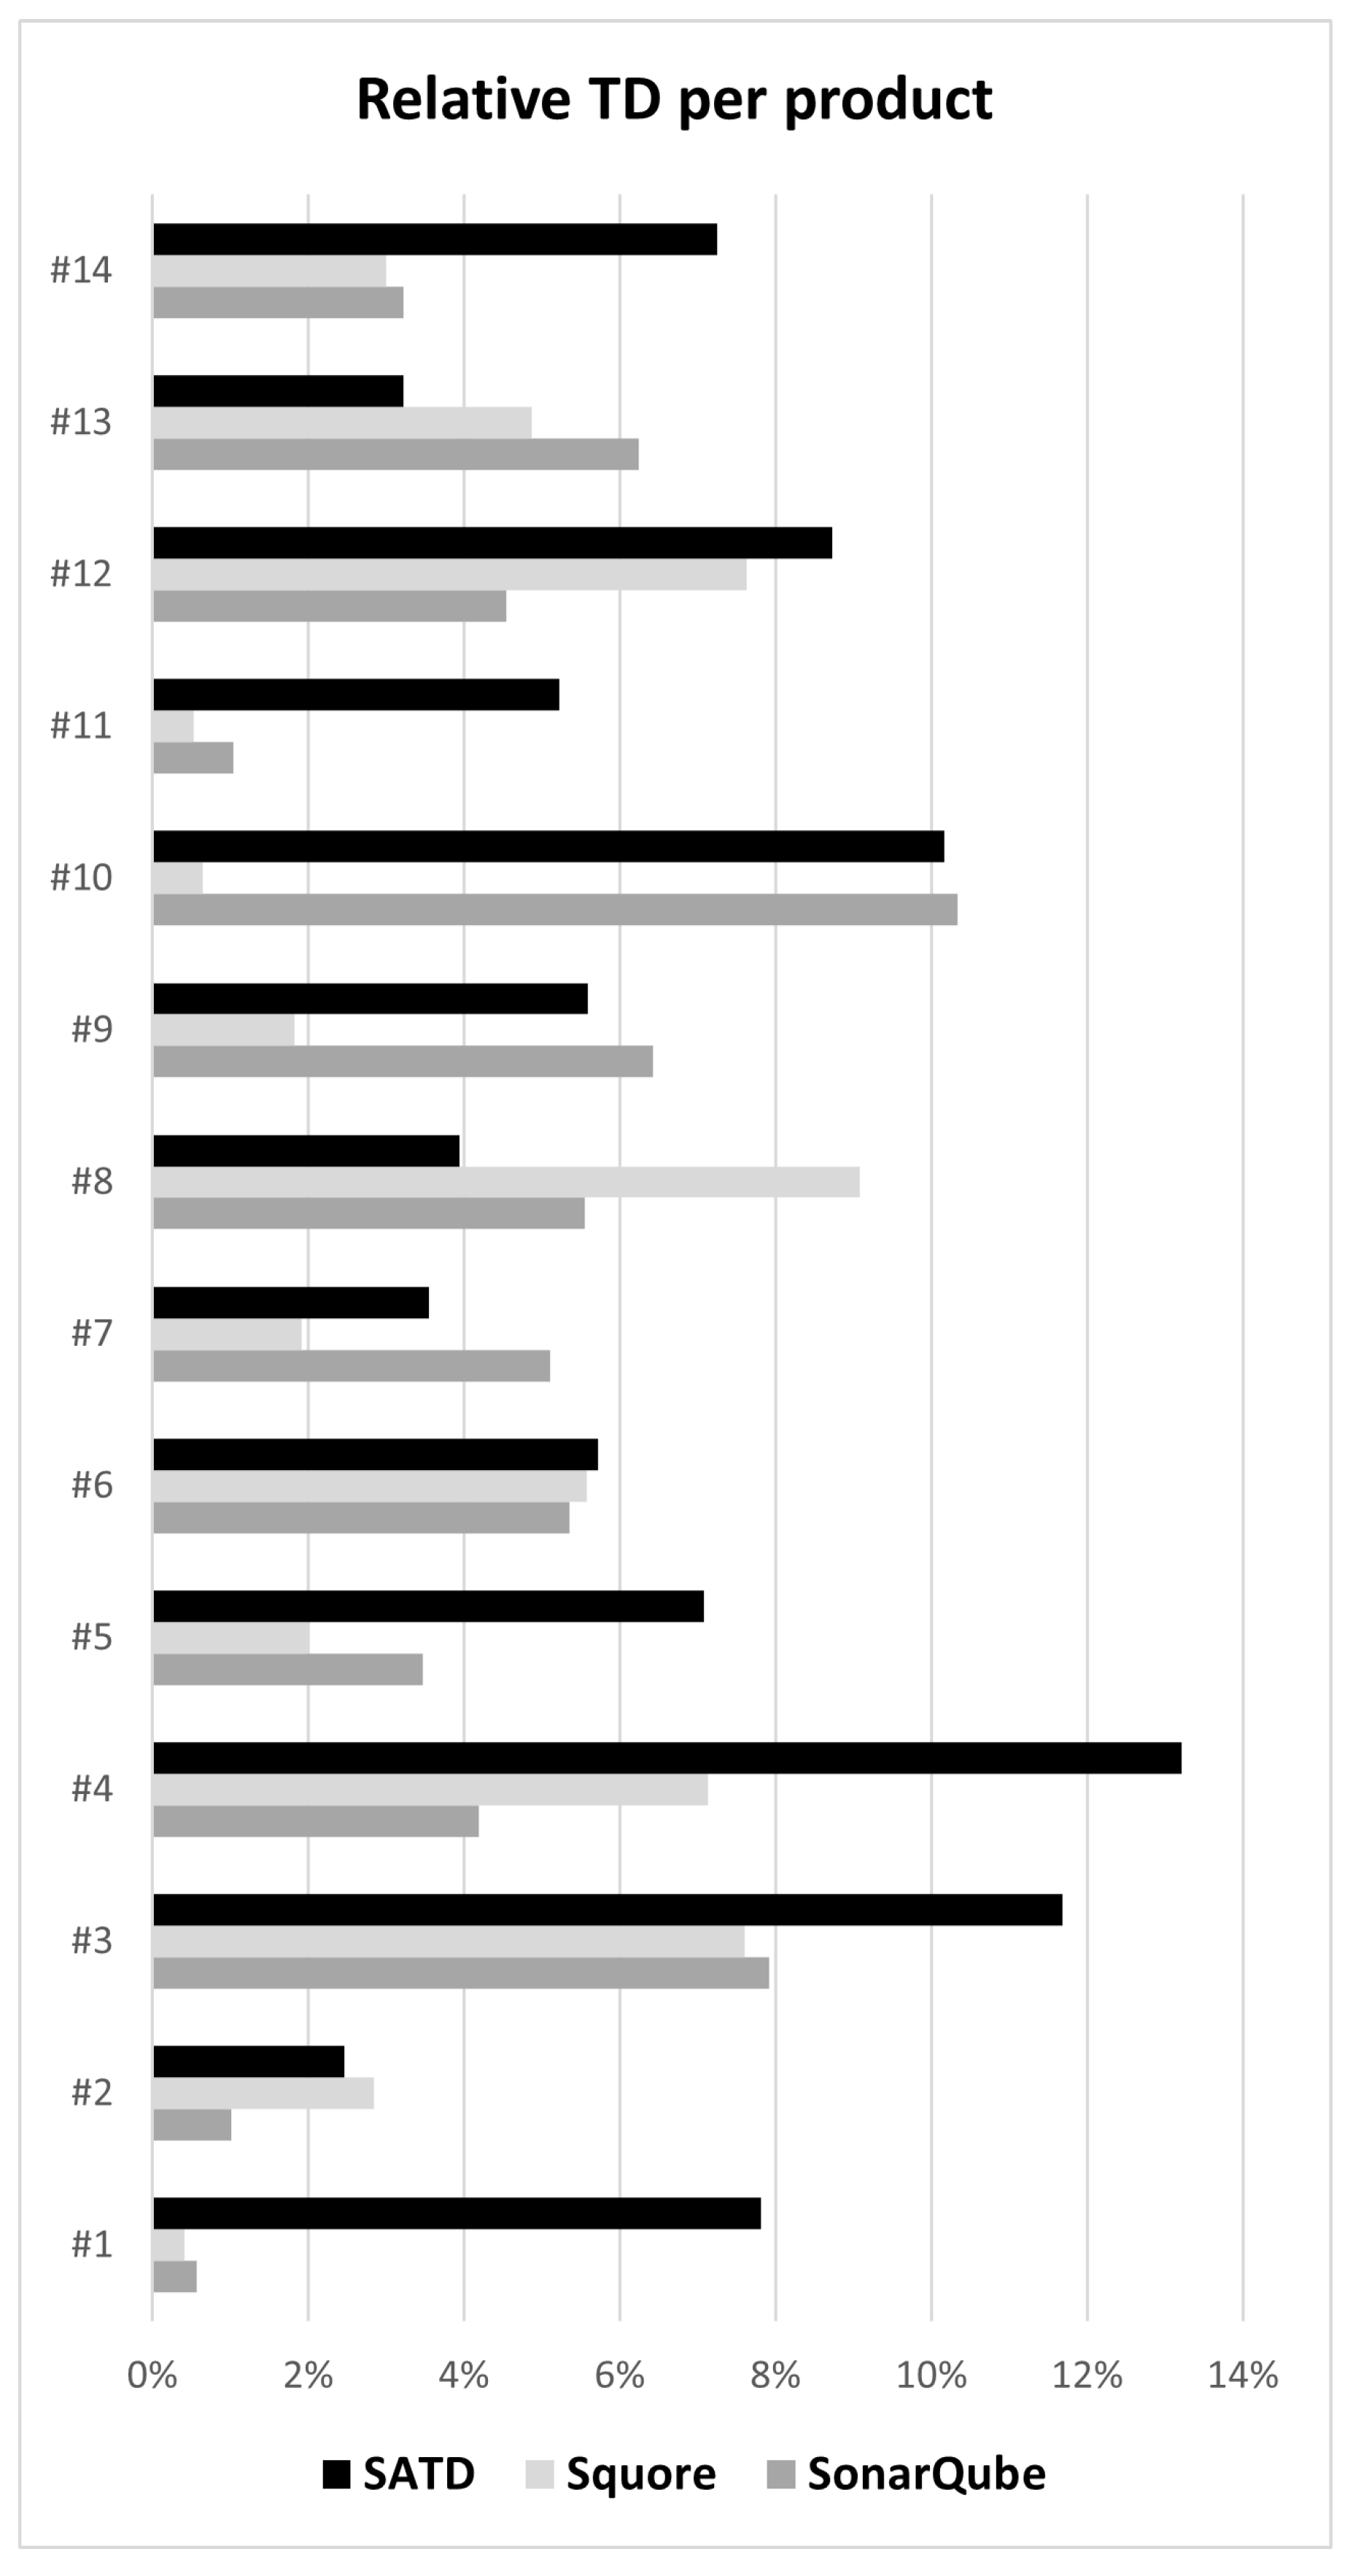
The admitted and the measured technical debt are shown clearly in Figure 2, where the admitted and twice-measured technical debt are shown for every project. The SATD abbreviation in the figure is used for “self-admitted technical debt”.

Figure 2.
Measured and self-admitted technical debt values per product.
Figure 2 also demonstrates the diversity of the investigated projects in terms of the internal quality trade-off amount, recognised as a technical debt. However, the claimed (admitted and measured) accumulated technical debt amount for every project is below or at the border of 10%, which is commonly understood as a margin below which the accumulated technical debt is of a reasonable amount, without the need to panic. This was also expected, since our research was dealing with production or almost production-ready software. The mild exceptions are projects #3 and #4, where developers admitted to having slightly more technical debt than would be reasonable (11.7% in project #3 and 13.2% in project #4).
In addition to the relative accumulated reported and admitted technical debt amounts, we are also reporting the technical debt ratings, according to the SQALE method, as explained in Section 2.1. Please see Table 3 for details.
Table 3.
Technical debt SQALE rating per product.
5. Mismatch Identification
Here, we present our findings based on the implemented research method and the empirical results. To answer the research questions, let us present our investigation on the mismatches, the differences between measured and admitted technical debt, and the possible causes that lay behind them.
The results (see Figure 2) imply deviations not only when we compare the self-admitted technical debt (SATD) to the measured one but also when we consider the measured technical debt with two different tools. The pattern is hard to spot, since in some cases (#1, #3, #6, #13, #14), the measurements are aligned, while in others (#6, #9, #10), the SonarQube measurement is aligned well with SATD, but only in 1 case (#6) are both measurements and the SATD aligned well. Since the differences are shown clearly in the results, we prepared their analysis.
- Firstly, the sizes of the technical debts were compared in a relative manner. Please note that, although the mismatch in Figure 2 seems substantial, their absolute values, normalised to project effort, are not. For example, in the case of project #3, the reported SATD is 11.7%, while the measured values are 7.6% and 7.9%. This is why the difference is 4.1% and 3.8%, which represents approximately 2 working days difference in the reported technical debt amount for a project with a 4 person-month development effort.
- Secondly, the absolute technical debt values were compared in terms of the differences between them; e.g., for project #2, SonarQube reported 1.6 h (1%) and Vector Squore reported 4.5 h (2.8%)—a factor of 2.8 higher than the SonarQube measurement.
The complete analysis of all combinations is shown in Table 4, including the following:
Table 4.
Measured and admitted technical debt mismatch.
- The relative difference between SonarQube and Vector Squore per project;
- The relative difference between SonarQube and the SATD per project;
- The relative difference between Vector Squore and the SATD per project;
- The difference factor between SonarQube and Vector Squore per project;
- The difference factor between SonarQube and the SATD per project;
- The difference factor between Vector Squore and the SATD per project.
In Table 4 the first three columns focus on the relative difference, while the second three columns show the difference factor between the technical debt amounts for the particular project. Please note that a value of “0” is the best (i.e., “no difference”) for the relative difference, and the value “1.0” is the best (i.e., “no difference”) for the difference factor. The table demonstrates a low number of “no difference” or “close-to-no difference” values, and it does, surprisingly, demonstrate some high deviations. Let us discuss the statistics.
As the analysis shows clearly, the mismatch between the technical debt amount, measured with the SonarQube, is significantly different (p = 0.037) to the SATD. This is extremely well demonstrated in the case of project #1, where we can observe that the SATD is 13.9 times higher than the debt measured by the SonarQube. Project #11 also shows the SATD having an amount five times that of the SonarQube measurement.
The significant difference between the SATD and the measurement is also demonstrated clearly in the case of Vector Squore (p = 0.015). The SATD is over 10 times higher than the Squore measurement in the case of projects #1, #10, and #11.
When we compare the results for the measurements of the two major measurement platforms (SonarQube and Vector Squore), the two-tailed student T-test cannot reject a significant equality (p = 0.457). However, the results clearly demonstrate the inconsistency between the measurements performed by SonarQube and Vector Squore. This fact is intriguing, since both tools implement the same technical debt measurement method, which is SQALE. The most extreme measurement difference is in the case of project #10, where SonarQube measured 15.9 times higher technical debt than Vector Squore.
Our data show that, on average, the difference between the SATD and the measured technical debt is 3%, compared to SonarQube, and 4% in the case of Vector Squore. We also demonstrate, in the case of investigated projects, the average difference between SonarQube and Vector Squore measurements to be as high as 2% of the projects’ effort, which equals a factor of 2.8 in terms of the absolute technical debt amount.
When we ignore the exact technical debt amounts and compare their ratings (please see Table 3), the mismatch remains: Vector Squore would rate only four projects (#2, #7, #12, and #13) the same as the SATD, while there would be only three projects (#2, #9, and #10) where SonarQube would rate the projects consistently with the SATD. Additionally, the deviation is also demonstrated by observing the consistency in rating the projects by both tools: they rated only half of the projects the same. In the case of project #10, the demonstrated difference is not only two but two classes (Vector Squore resulting “C” and SonarQube resulting “A”).
Based on the investigated projects and the results, we cannot identify a coherent subset of the projects (e.g., the largest projects, the most mature projects, projects with the similar technological portfolio, etc.), where one could find a sound, statistically proven comparable technical debt amount—whether it be the SATD or the measured technical debt. An example of an obvious candidate for possible technical debt amount influence were small versus large projects. As demonstrated by results (see Table 4 and Figure 2), our empirical data does not demonstrate any size-based impact. Which is surprising observation, since one would expect a relatively higher technical debt in smaller projects, since in larger ones, the technical debt would be repaid by a natural development flow, which is usually not the case in smaller projects.
5.1. The Causes for the Mismatch
The demonstrated mismatch led us to review the specific differences in a case-by-case manner. In the engineering and quality management, one would naturally use a rigorous formal method, such as RCA (Root Cause Analysis), for identifying the root causes of issues. However, in our case, where we dealt with a set of well described technical debt items that can be compared easily in an ad-hoc manner, we did not employ this method. The technique that we used to analyse causes was similar to a semi-format method ACA (Apparent Cause Analysis). It is a straightforward analytical approach used to identify obvious causes based on the gathered data. Our method included several activities, spanning between steps 6 and 7 in our research method.
- 1.
- We put the resulting technical debt items side-by-side for all three detailed debt reports: SATD, SonarQube, and Vector Squore;
- 2.
- We performed an initial grouping of similar technical debt items (by domain and reported issue);
- 3.
- We iteratively regrouped and marked the technical debt items in terms of items that were repeatedly reported in all three reports and items that were unique to a certain report;
- 4.
- With the help of the developers, we examined the differences in technical debt item sets, technical debt item groups, and certain technical debt items to identify causes that led to a finally different technical debt assessment;
- 5.
- With the help of the developers, we summarised the causes and cause families by iteratively capturing the differences and similarities of the technical debt items. The summary is reported in the paragraph below.
Summarising the SATD records, we can see that more than half of the reported technical debt items are related to either “low-quality code” or “code smell”. The developers based their assessments mainly on source code that spreads over several classes and files and is also related to the use of the configuration files. On the other hand, the tools performed best while reporting the rule-based debt items that are usually isolated to a single file, class, or method. In addition, interrelated technical debt items are assessed higher by the developers, while rule-based assessments by tools of smaller, isolated items are generally smaller.
A significant factor, when we compare the debt items, that was reported by both the tools and the developers is assessing the estimated mediation. The tools relied on predefined rules, which are tool-specific (not specific to the SQALE method). The developers, on the other hand, relied on their judgement, based on experience.
An important difference when we compare items that were identified only by the tools or only by the developers is that the tendency of tools is towards large numbers of non-critical items with a small estimated mediation cost per item. The developers, on the other hand, tended to focus on larger items, which are typically more critical.
Technically speaking, the tools weighted inappropriate naming conventions for technical debt heavily (in the case of the SonarQube, every naming convention violation adds 5 min to the accumulated technical debt). On the other hand, we hardly spotted any naming convention-related technical debt item while reviewing the developers’ SATD.
Additionally, the tools had a great deal of focus on the test-case coverage, which is reasonable. The SQALE method suggests that, to mediate technical debt, the “testability” category is the first one to address.
We found several families of technical debt items that are unique to the tools or to the developers:
- Items unique to the automatic tool-based identification:
- –
- Naming convention violations;
- –
- Source code structure violations/coding standards violations (e.g., the use of new lines, blanks etc.);
- –
- Strict requirements for commenting the code;
- –
- Usage of the latest best practices (e.g., in the case of project #3, half of the automatically identified technical debt items are related to an inappropriate text manipulation; in the case of the JS code, the tools have a strict rule that every component should be defined in a separate file etc.);
- –
- Detailed requirements for the unit tests (e.g., in the case of project #1, more than 80% of the automatically measured technical debt is related to the missing unit tests);
- –
- False-positive technical debt items (code that was not accepted by the developers to represent a technical debt item; in the case of project #2, the developers claim that half of the automatically reported debt items are false-positives);
- –
- Strict rules on code duplication (developers, in some cases, do it deliberately and do not want to remove the duplication due to better readability, etc.).
- Items unique to the SATD:
- –
- Conceptual violations in the code, which are related to the domain of the information solution and/or to the selected architectural style (e.g., in the case of project #1, the developers decided to make a player selection on the client to accelerate the development, but they know it should really be done on the server);
- –
- Security vulnerabilities in terms of not or badly secured parts; tools find this to be close-to-perfect code (e.g., in project #5, the user interface is well coded, including the re-captcha method, etc.; however, it is completely unsecured and CORS is completely opened on the server side);
- –
- Code that was commented on deliberately but was left in the code.
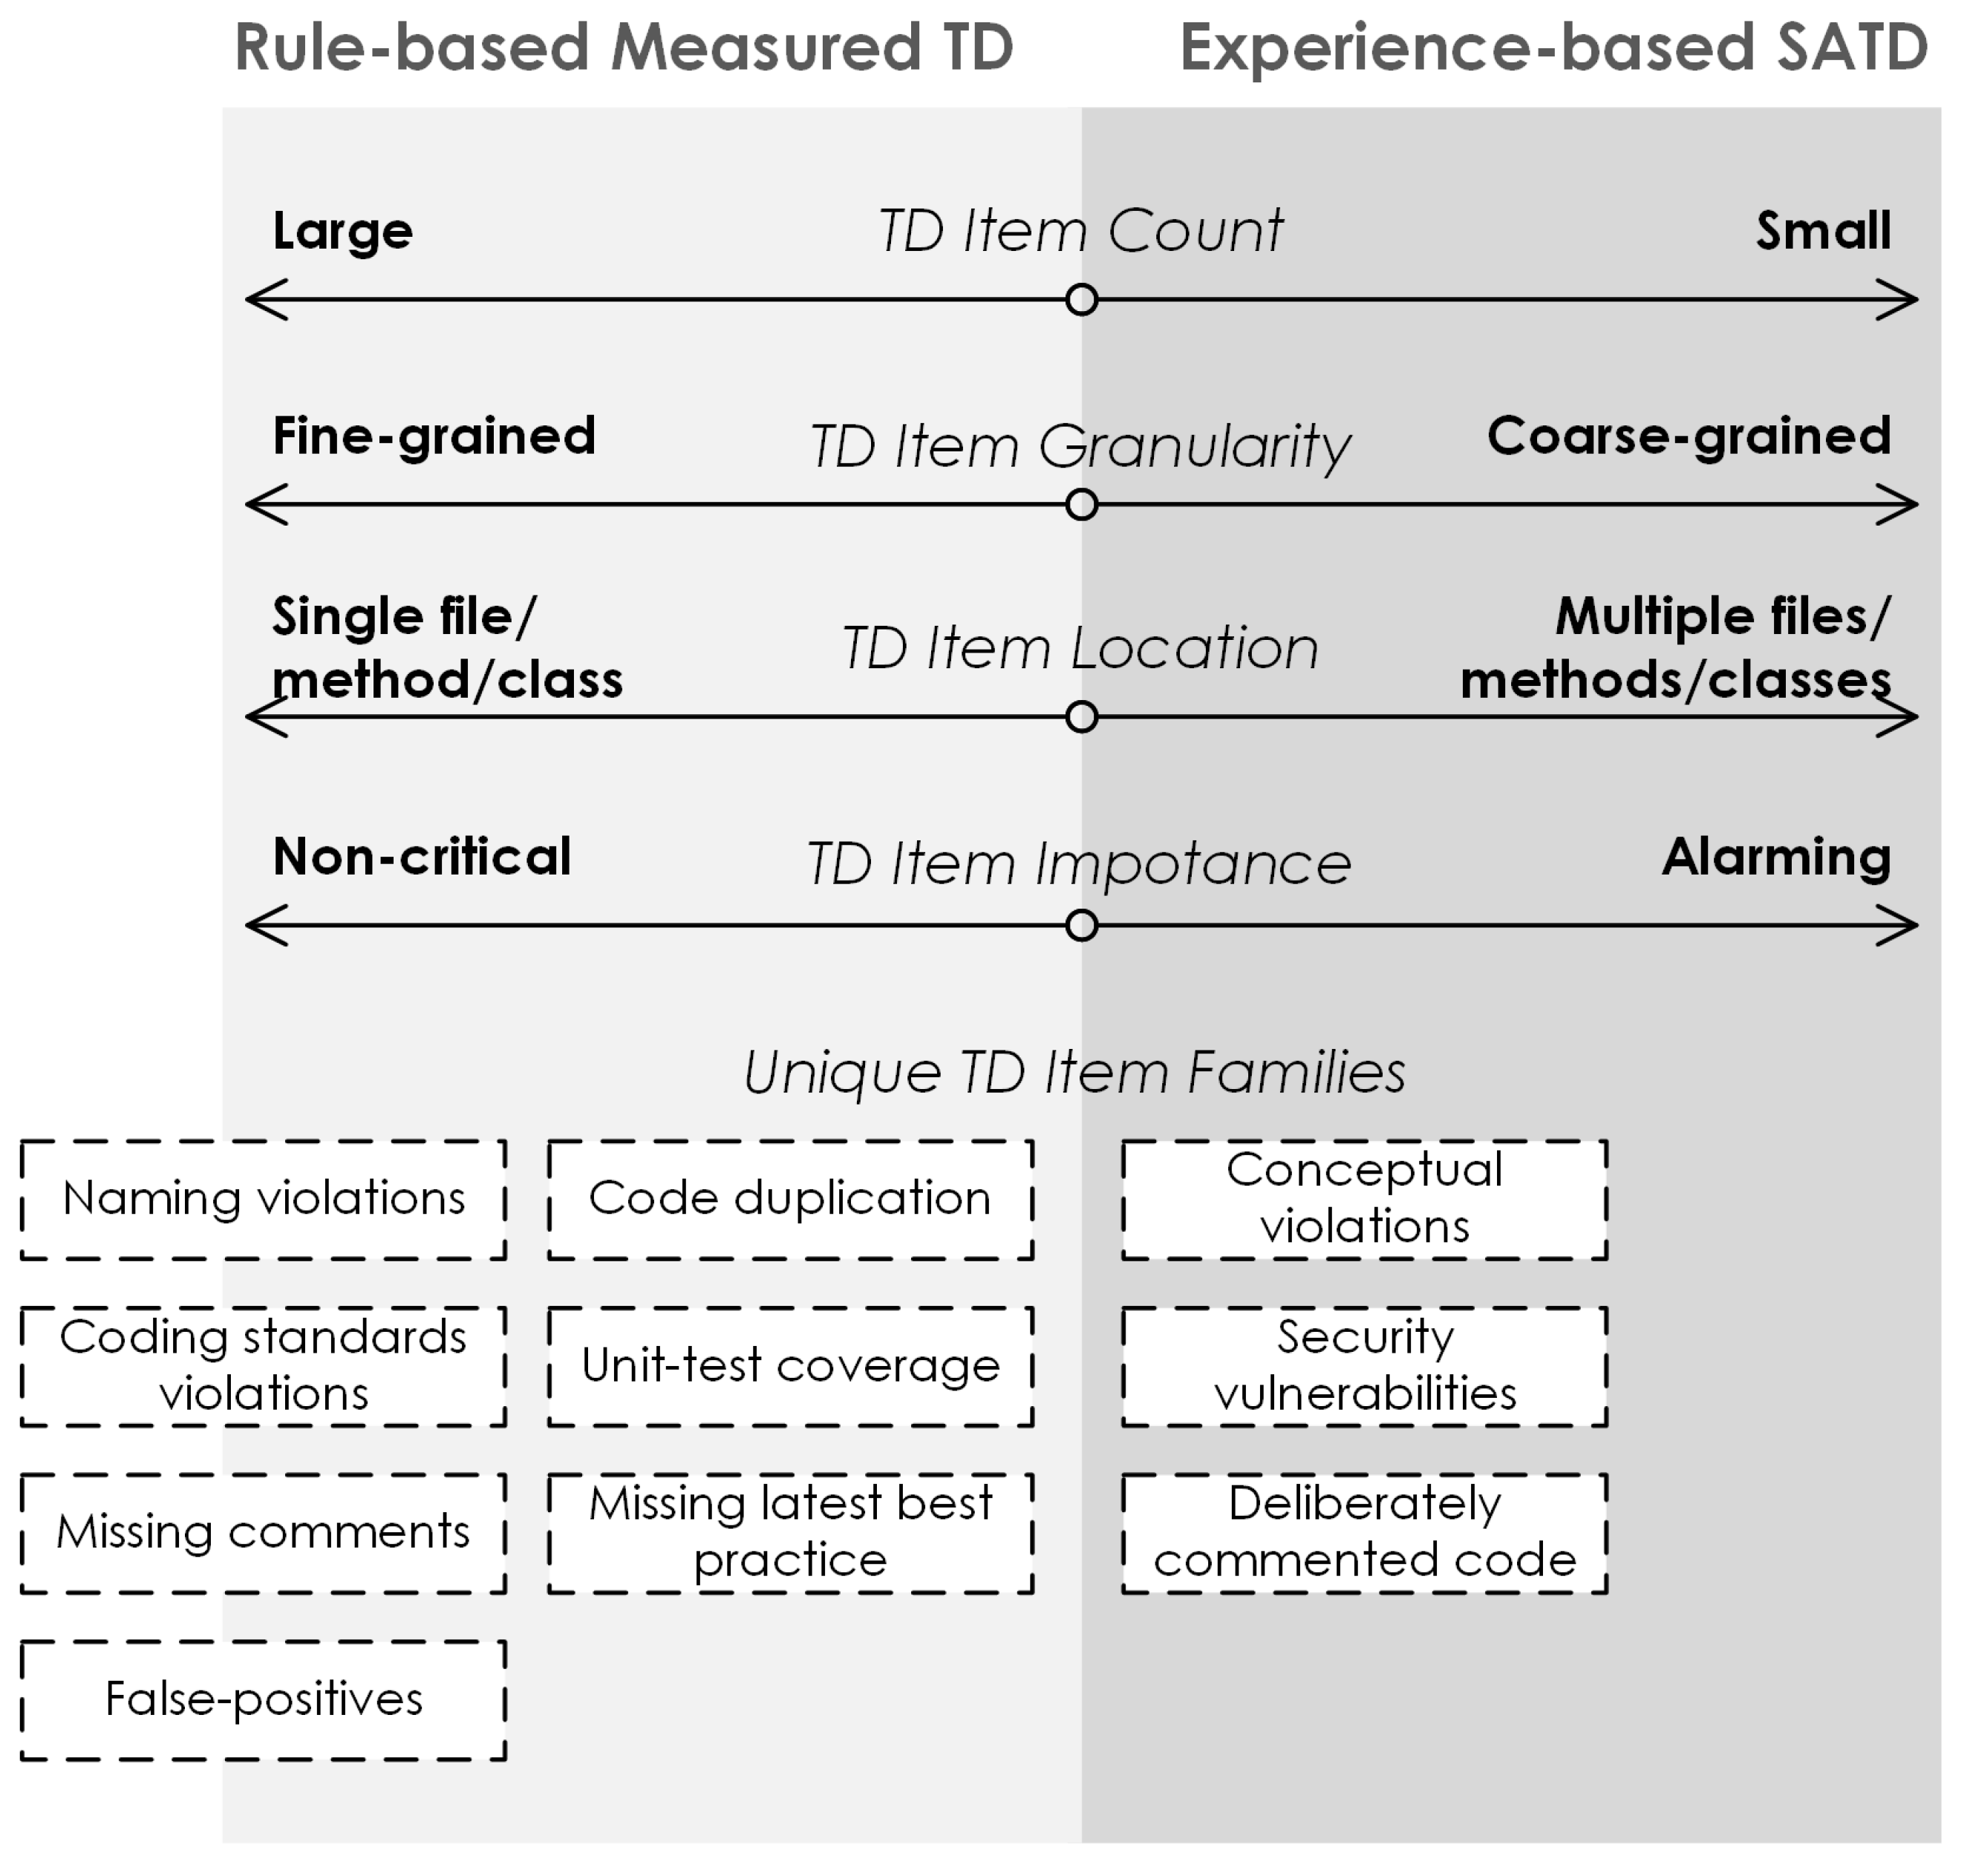
In order to capture the results of the cause analysis, based on the projects’ technical debt items, the graphical summary is presented in Figure 3. When we compare the technical debt items between the tools, we can spot several repeating cases as a reason for the deviations. Let us, as a showcase, focus on products #7 and #9, where the gap between Vector Squore and SonarQube is among the highest. Some examples of the technical debt items and their differences are as follows:
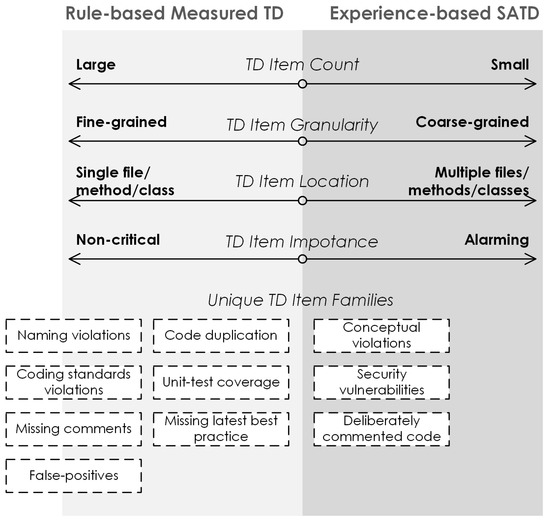
Figure 3.
Identified causes for mismatch—a graphical summary.
- Product #9:
- –
- SonarQube measurement: 18 h/22 TD items;
- –
- Vector Squore measurement: 5.1 h/25 TD items;
- –
- Only 9 TD items target the same assets by both tools;
- –
- Example: SQLCarsDatabase.java—SonarQube: 28 min; Vector Squore 7:30 min; they both report missing a unit test, and SonarQube adds three code smells—naming convention violations;
- –
- Example: Drive.java (a value object with two attributes, getters, setters)—SonarQube: 30 min for providing a unit test and removing duplicate code; Vector Squore: 10 min for improving changeability;
- Product #7:
- –
- SonarQube measurement: 69 h/66 TD items;
- –
- Vector Squore measurement: 25.9 h/79 TD items—75% are Testability-related;
- –
- Only 24 TD items target the same assets by both tools;
- –
- The most problematic file according to the SonarQube is RouteCard.js (React Component; 340 LOC, total cyclomatic complexity: 17)—measurement = 50 min (unit-tests + reliability);
- –
- RouteCard.js is hardly mentioned by Vector Squore—a missing unit test would be measured as a 5 min mediation cost.
Similar examples are common to all the projects that were measured: a relatively small subset of common violations and several tool-specific violations that add to the final technical debt amount. One could be surprised that this is possible, since both tools implement the SQALE method.
The rule set, which is the third level in the SQALE model, and how it is implemented in both tools is the answer. For example, for product #9, the source code of which is in Java, is exposed to 620 rules in SonarQube and 1968 rules in Vector Squore. Product #7, the JavaScript-based React web application, is checked by 275 rules in SonarQube and 882 rules in Vector Squore. Both platforms can extend their rule-base. In the case of SonarQube, this can be done manually, while Vector Squore offers an out-of-the-box rule-providing system. This is how one can find all the rules from SonarQube also in Vector Squore, since SonarQube is one among many rule providers there.
The assessed mediation costs are, in addition, another cause of the differences. Some rules are evaluated the same in both platforms (e.g., “try-with-resource should be used” is evaluated at 15 min by both platforms). On the other hand, some rules are evaluated differently (e.g., string-literal related conversion in the SonarQube would be evaluated as a 2 min debt, while Vector Squore would evaluate a similar rule, addressing the same violation, as a 5 min debt).
6. The Rationale
Based on the presented research questions, our research method, and the presented and interpreted results from our empirical study, we present our findings below. Let us discuss the individual research questions.
RQ1—Is there a difference in detecting the technical debt amount between its manual identification and measuring it with specialised tools?
Steps (3), (4), and (5) in our methodology (see Figure 1) were taken in support of this research question. Products’ technical debt was measured twice with the two leading platforms and admitted by the developers. The results are shown in Figure 2, and the aggregated technical debt values in the SQALE ratings are presented in Table 3. The absolute and relative mismatches between the technical debt amounts were calculated, presented (see Table 4), and interpreted. Our findings, which are described in detail in Section 5, show that there is a significant difference in the assessed technical debt amount between its manual identification and automatic measurement. The finding holds for both platforms, SonarQube and Vector Squore, that were used in the experiment.
RQ1a—What is the difference between the admitted and the measured technical debt amount?
In addition to confirming the significant difference between manual technical debt identification and its automatic measurement, our research also reports on the difference from the absolute and relative technical debt perspective. As detailed in Table 4, the average difference between the measured technical and admitted debt is 3% in the case of SonarQube and 4% in the case of Vector Squore relative to project effort. The standard deviation was 3% in both cases. However, our 14 production software products demonstrate the gap between measured and admitted debt in the range from the same value to a multiplier of 10 and more between technical debts. In addition, technical debt ratings (see Table 3) can be even two classes apart (among our cases, one can find measured “A”, admitted “C”, and vice versa).
RQ1b—Is the amount of measured technical debt dependent on the tool that is used to measure it?
The collecting, processing, and interpreting of the data in this research was done carefully, separately for the two leading platforms that enable technical debt measurement based on state-of-the-art methodology SQALE. Initial data suggested significant deviations between the measurements, since the average factor between measurements was as high as 2.8, which equals 2% on average, compared to the development project effort. However, due to the deviant results and resulting higher standard deviation in the data, statistical tests could not prove or disprove the significance in the different measurements. This is why the answer to research question RQ1b is that this research cannot answer it. However, we would urge users to be careful while comparing technical debt values gained from different tools; this is, in addition to our experimental data, demonstrated clearly in Section 5.1. Based on the empirical data, we would suggest development and quality assurance teams to rely on the same measurement platform throughout the project.
RQ2—What are the causes for possible deviations in the identified technical debt amount?
In Section 5.1, we presented several cases and situations that led to the different amounts of the identified technical debt. In the paper, we presented them using three categories: (a) technical debt items that appear only in the self-admitted technical debt, (b) technical debt items that appear only in the measured technical debt, and (c) differences in the rules implemented in the measurement platforms.
To summarise, the identified causes for different technical debt amounts are as follows:
- Items unique to the admitting technical debt:
- –
- Conceptual violations in the code;
- –
- Security vulnerabilities in terms of not or badly secured parts;
- Items unique to the automatic tool-based identification:
- –
- Naming convention violations;
- –
- Source code structure violations;
- –
- Strict requirements for commenting the code;
- –
- Usage of the latest best practices;
- –
- Detailed requirements for the unit tests;
- –
- False-positive technical debt items;
- –
- Strict rules on the code duplication;
- Items dependent on the tool, used in the process of the automatic identification:
- –
- A tool-specific rule set;
- –
- A tool-specific estimate of the rule violations.
7. Limitations and Threats to Validity
For the research that is presented in this paper and its outcomes, we can report some limitations and threats to validity. We suggest readers consider them before generalising our findings.
First of all, during our research, we were limited with the projects that we were allowed to investigate in detail. The 14 cases presented and studied in this paper are, based on our opinion, adequate, especially when we consider that the projects were developed professionally, were meant for production development, and were investigated side-by-side with the developers. However, we cannot exclude the possibility of rather different results when our research may be repeated with different or larger source code.
Further, our findings are connected strongly to what current measurement platforms have to offer. During their process of becoming even more mature in versions to come, their results might become different. In addition, both tools that we used rely on the SQALE measurement method. The outcomes might be different if the CAST or the SIG methods were employed. Please also take into account that, in terms of self-admitted technical debt, we do not focus on technical debt types that are not directly source-code related (e.g., requirements debt, documentation debt, architecture debt, etc.).
Our findings are also dependent on the rules enforced by the presented measurement platforms. In the case that a development or quality assurance team would fine-tune the rules so that they would suite their particular product, we believe the results would be better in terms of converging the measured and admitted technical debt amounts. During our study, we left the rule settings as they were set by the platform providers. This was also done in order to minimise a possible threat of bias measurement results.
It might not be possible to use our findings directly when measuring source code that is not supported well by the measurement platforms. It is true that our project portfolio covers leading development languages and platforms well. However, the presented projects also have a technological portfolio, that is based mainly on the Java, C# and HTML/CSS/JavaScript-based languages. This might also explain why project #6’s technical debt amounts are so well aligned—Java/SpringBoot is well supported in the tools, and it is also a highly opinionated framework, where the developers cannot experiment much with their own ways of development.
In addition, please note that our project portfolio includes projects with wide-ranging project efforts. Although we believe that our empirical data clearly show the lack of consistency between the tools as well between the approaches, it is also possible that in a larger project portfolio sample, project size could show a greater impact on the technical debt gaps.
A careful reader will notice that in our research methodology, one of the most important variables—project effort—was reported by the development teams. Since this variable plays an important role throughout our research and we had to trust the development teams to report honest effort sizes, we report this as a threat to validity. In the case that development teams would report a significantly different effort, this might have an important impact on the whole research. However, as a precaution, we also checked the ratio between the effort and the development output (lines of code), and we believe that the data are trustworthy. In addition, projects originated form different companies and development teams, minimising this threat. In addition, the same developers that originally created the code also self-admitted their debts, which, in combination with expressing technical debt relatively, minimises the threat as well.
8. Conclusions
In this paper, we presented the technical debt metaphor. It can be used as an important tool while weighing trade-offs between high product quality and rapid delivery of valuable functionalities carefully. One of the most important activities in the technical debt management process is technical debt identification. This can be accomplished via regular, manual reporting on the technical debt items, which is called self-admitted technical debt. On the other hand, several specialised methods and tools emerged, with a promise to measure the technical debt as well.
Following our carefully designed research method, the state-of-the-art review was the first step. This was performed using a systematic literature review on the technical debt measurement and its possible accuracy and relation to self-admitted technical debt. The methods for measuring technical debt are presented, including the SQALE method. For the technical debt measurement activities, we selected two platforms: SonarQube and Vector Squore.
During our research, we investigated 14 production-grade software products, while determining the amount of the accumulated technical debt via a developer-supported self-admitting procedure and measuring the debt. The results are presented in detail and show substantial divergence. Our research on mismatch was based on employing statistical methods to see if the gap was significant. In addition, the reported technical debt items were reviewed on one-by-one basis to see not only the reported technical debt amount but also the possible differences in the particular technical debt items. We analysed the causes for differences using a semi-formal method, which showed important families of technical debt items that are unique to a certain technical debt identification method. The approach was adequate to answer our research question. However, we see a more formal, rigorous method of cause analysis as a possible future work.
The interpretation of the result shows clearly the significant differences while self-admitting technical debt and measuring it. We can conclude that both approaches (measuring and self-admitting) to identify technical debt should be employed; e.g., while technical debt measurement is a great and useful tool, it obviously cannot be the only insight into accumulated debt. This is why we also urge development and quality-assurance teams not to rely only on one approach. The self-admitted technical debt should also be reviewed regularly, since it would report different technical debt amounts, and it would also show some different technical debt items.
To conclude the paper, let us summarise our main contributions to the technical debt identification. This research is, based on our field review, pioneering technical debt empirical research by comparing a values of a SATD and a measured technical debt. Moreover, the available methodological and tool support was also examined, leading us to use and compare industry-leading measurement platforms during the research. In our work, our sample includes professional, production grade source code, which was examined in terms of technical debt identification with the development teams on-side. In addition, as a side-deliverable, the paper also reports several guidelines to development teams on when and how to rely on technical debt measurement or technical debt self-admission.
Although our manuscript and the presented research did not aim to identify when and in which circumstances development teams can rely on technical debt measurement and when on self-admission, the manuscript revealed this as a possible future work. Since we showed throughout the research that there is a clear gap between the tools and self-admission, additional research could collect a set of recommendations on when to rely on measuring and when on self-admission while identifying technical debt. However, if we summarise possible actions that the development teams can employ in order to gain a better insight into technical debt amount based on this research’s empirical data, they would include the following: (a) while measuring technical debt, developers should be consistent throughout the project in terms of the tool used; (b) when possible, developers should employ both approaches (measurement and self-admitting), since they report some different technical debt items with a different effort assessments; (c) conceptual, inter-related code and security violations are better identified by the self-admitting process; (d) naming conventions, code duplication, structural, standard, pattern, and test-related violations are better identified by technical debt measurement platforms.
Author Contributions
Conceptualisation, L.P., T.H., M.H. and T.B.; methodology, L.P., M.H. and T.B.; data curation, L.P. and T.H.; validation, L.P., T.H., M.H. and T.B.; formal analysis, L.P. and T.H.; investigation, L.P., T.H. and T.B.; resources, L.P., T.H., M.H. and T.B.; writing—original draft preparation, L.P., T.H., M.H. and T.B.; writing—review and editing, L.P., T.H., M.H. and T.B.; visualisation, L.P. and T.B.; supervision, L.P. and M.H. All authors have read and agreed to the published version of the manuscript.
Funding
The authors acknowledge financial support from the Slovenian Research Agency (Research Core Funding No. P2-0057).
Conflicts of Interest
The authors declare no conflict of interest.
References
- Cunningham, W. The WyCash Portfolio Management System. In Proceedings of the OOPSLA ’92—Experience Report, Vancouver, BC, Canada, 5–10 October 1992. [Google Scholar]
- Potdar, A.; Shihab, E. An Exploratory Study on Self-Admitted Technical Debt. In Proceedings of the 30th International Conference on Software Maintenance and Evolution, ICSME 2014, Victoria, BC, Canada, 29 September–3 October 2014; pp. 91–100. [Google Scholar] [CrossRef]
- Li, Y.; Soliman, M.; Avgeriou, P. Automatic Identification of Self-Admitted Technical Debt from Different Sources. arXiv 2022, arXiv:2202.02387. [Google Scholar]
- Zampetti, F.; Fucci, G.; Serebrenik, A.; Di Penta, M. Self-Admitted Technical Debt Practices: A Comparison Between Industry and Open-Source. Empir. Softw. Eng. 2021, 26, 131. [Google Scholar] [CrossRef]
- Khomyakov, I.; Makhmutov, Z.; Mirgalimova, R.; Sillitti, A. An Analysis of Automated Technical Debt Measurement. In Proceedings of the Enterprise Information Systems, online, 5–7 May 2020; pp. 250–273. [Google Scholar]
- Pfeiffer, R.H.; Lungu, M. Technical Debt and Maintainability: How do tools measure it? arXiv 2022, arXiv:2202.13464. [Google Scholar]
- Papapetrou, P. How to Calculate Technical Debt and Express It Clearly. Available online: http://thinkapps.com/blog/development/technical-debt-calculation/ (accessed on 20 May 2022).
- Fernández-Sánchez, C.; Garbajosa, J.; Vidal, C.; Yagüe, A. An Analysis of Techniques and Methods for Technical Debt Management: A Reflection from the Architecture Perspective. In Proceedings of the 2015 IEEE/ACM 2nd International Workshop on Software Architecture and Metrics, Florence, Italy, 16 May 2015; pp. 22–28. [Google Scholar] [CrossRef] [Green Version]
- Fernández-Sánchez, C.; Garbajosa, J.; Yagüe, A.; Perez, J. Identification and analysis of the elements required to manage technical debt by means of a systematic mapping study. J. Syst. Softw. 2017, 124, 22–38. [Google Scholar] [CrossRef]
- Yu, Z.; Fahid, F.M.; Tu, H.; Menzies, T. Identifying Self-Admitted Technical Debts with Jitterbug: A Two-Step Approach. IEEE Trans. Softw. Eng. 2020, 48, 1. [Google Scholar] [CrossRef]
- Kosti, M.V.; Ampatzoglou, A.; Chatzigeorgiou, A.; Pallas, G.; Stamelos, I.; Angelis, L. Technical Debt Principal Assessment Through Structural Metrics. In Proceedings of the 2017 43rd Euromicro Conference on Software Engineering and Advanced Applications (SEAA), Vienna, Austria, 30 August–1 September 2017; pp. 329–333. [Google Scholar] [CrossRef]
- Kontsevoi, B.; Soroka, E.; Terekhov, S. TETRA, as a set of Techniques and Tools for Calculating Technical Debt Principal and Interest. In Proceedings of the 2019 IEEE/ACM International Conference on Technical Debt (TechDebt), Montreal, QC, Canada, 26 May 2019; pp. 64–65. [Google Scholar] [CrossRef]
- Ludwig, J.; Cline, D.; Novstrup, A. A Case Study Using CBR-Insight to Visualize Source Code Quality. In Proceedings of the 2020 IEEE Aerospace Conference, Big Sky, MT, USA, 7–14 March 2020; pp. 1–12. [Google Scholar] [CrossRef]
- Wiese, M.; Riebisch, M.; Schwarze, J. Preventing Technical Debt by Technical Debt Aware Project Management. In Proceedings of the 2021 IEEE/ACM International Conference on Technical Debt (TechDebt), Madrid, Spain, 19–21 May 2021; pp. 84–93. [Google Scholar] [CrossRef]
- Tsoukalas, D.; Siavvas, M.; Jankovic, M.; Kehagias, D.; Chatzigeorgiou, A.; Tzovaras, D. Methods and Tools for TD Estimation and Forecasting: A State-of-the-art Survey. In Proceedings of the 2018 International Conference on Intelligent Systems (IS), Funchal, Portugal, 25–27 September 2018; pp. 698–705. [Google Scholar] [CrossRef] [Green Version]
- Lenarduzzi, V.; Martini, A.; Taibi, D.; Tamburri, D.A. Towards Surgically-Precise Technical Debt Estimation: Early Results and Research Roadmap. In Proceedings of the 3rd ACM SIGSOFT International Workshop on Machine Learning Techniques for Software Quality Evaluation, Tallinn, Estonia, 27 August 2019; pp. 37–42. [Google Scholar] [CrossRef] [Green Version]
- Strečanský, P.; Chren, S.; Rossi, B. Comparing Maintainability Index, SIG Method, and SQALE for Technical Debt Identification. In Proceedings of the 35th Annual ACM Symposium on Applied Computing, Brno, Czech Republic, 30 March—3 April 2020; pp. 121–124. [Google Scholar] [CrossRef] [Green Version]
- Tan, J.; Feitosa, D.; Avgeriou, P. An Empirical Study on Self-Fixed Technical Debt. In Proceedings of the 3rd International Conference on Technical Debt, Seoul, Korea, 28–30 June 2020; pp. 11–20. [Google Scholar] [CrossRef]
- Aversano, L.; Iammarino, M.; Carapella, M.; Del Vecchio, A.; Nardi, L. On the Relationship between Self-Admitted Technical Debt Removals and Technical Debt Measures. Algorithms 2020, 13, 168. [Google Scholar] [CrossRef]
- Letouzey, J.L. The SQALE method for evaluating Technical Debt. In Proceedings of the 2012 Third International Workshop on Managing Technical Debt (MTD), Zurich, Switzerland, 5 June 2012; pp. 31–36. [Google Scholar] [CrossRef]
- Letouzey, J.-L. The SQALE Method for Managing Technical Debt—Definition Document. 2016. Available online: http://www.sqale.org/wp-content/uploads/2016/08/SQALE-Method-EN-V1-1.pdf (accessed on 20 May 2022).
- SonarSource. SonarQube Docs 9.3. 2022. Available online: https://docs.sonarqube.org/ (accessed on 20 May 2022).
- SonarSource. SonarQube. 2022. Available online: https://www.sonarqube.org/ (accessed on 20 May 2022).
- Vector. Squore. 2022. Available online: https://www.vector.com/int/en/products/products-a-z/software/squore/ (accessed on 20 May 2022).
- Spínola, R.; Zazworka, N.; Vetro, A.; Shull, F.; Seaman, C. Understanding automated and human-based technical debt identification approaches-a two-phase study. J. Braz. Comput. Soc. 2019, 25, 5. [Google Scholar] [CrossRef] [Green Version]

Publisher’s Note: MDPI stays neutral with regard to jurisdictional claims in published maps and institutional affiliations. |
© 2022 by the authors. Licensee MDPI, Basel, Switzerland. This article is an open access article distributed under the terms and conditions of the Creative Commons Attribution (CC BY) license (https://creativecommons.org/licenses/by/4.0/).