
Numerical Modelling of Droplets and Beads Behavior over Super-Hydrophobic and Hydrophilic Coatings under in-Flight Icing Conditions


Abstract
:Featured Application
Abstract
1. Introduction
2. Phenomenological Model
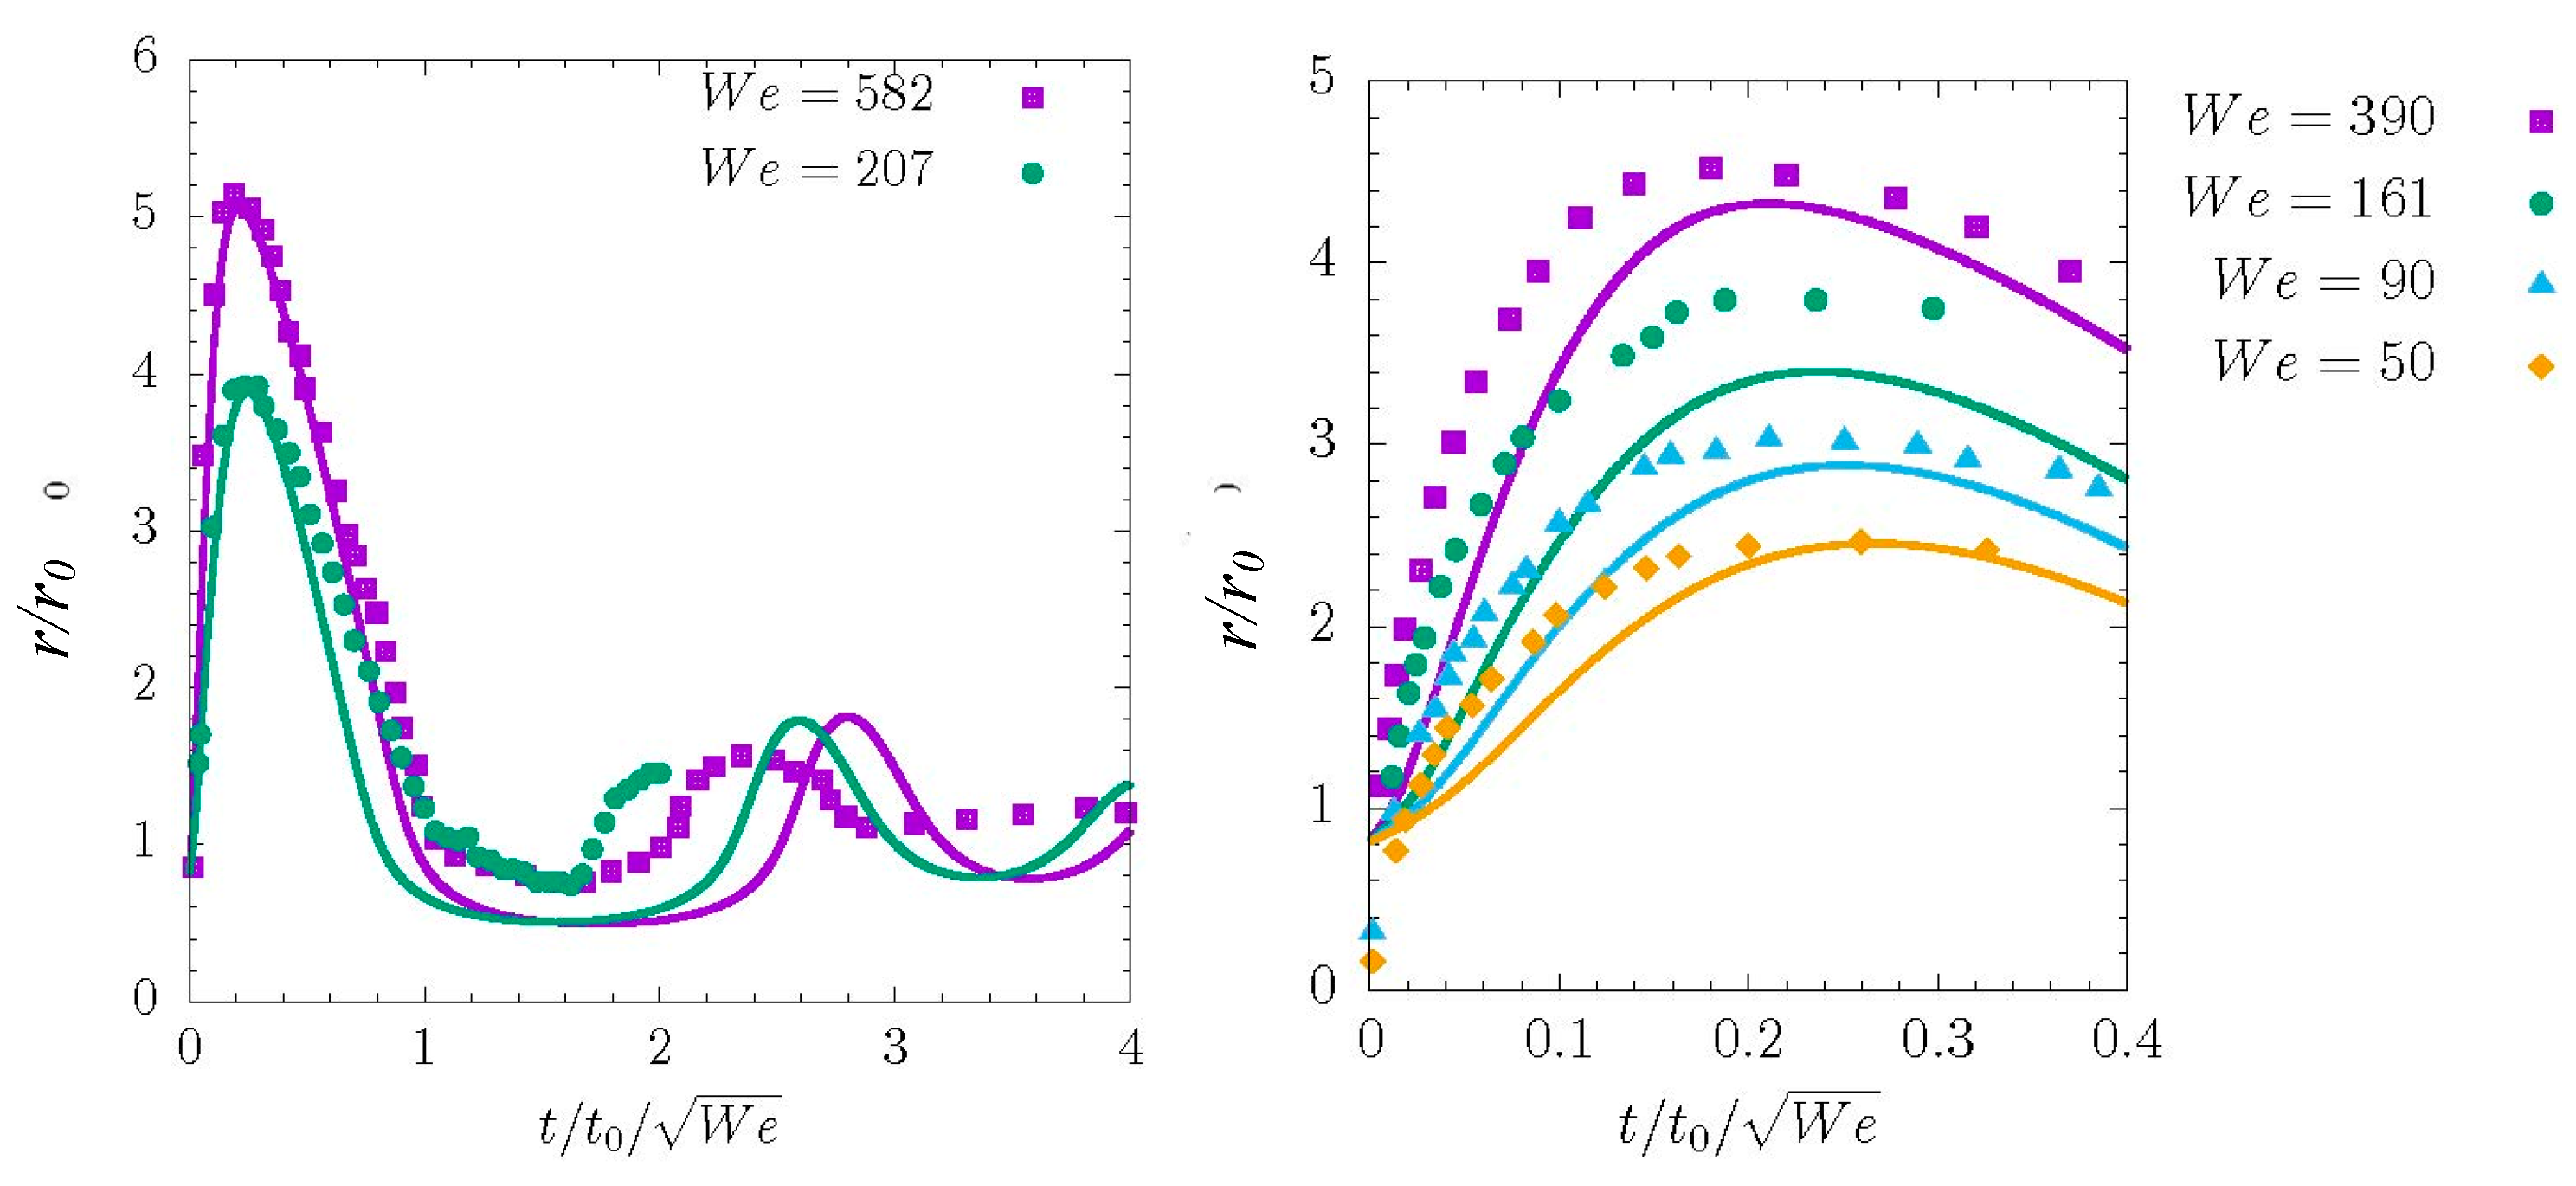
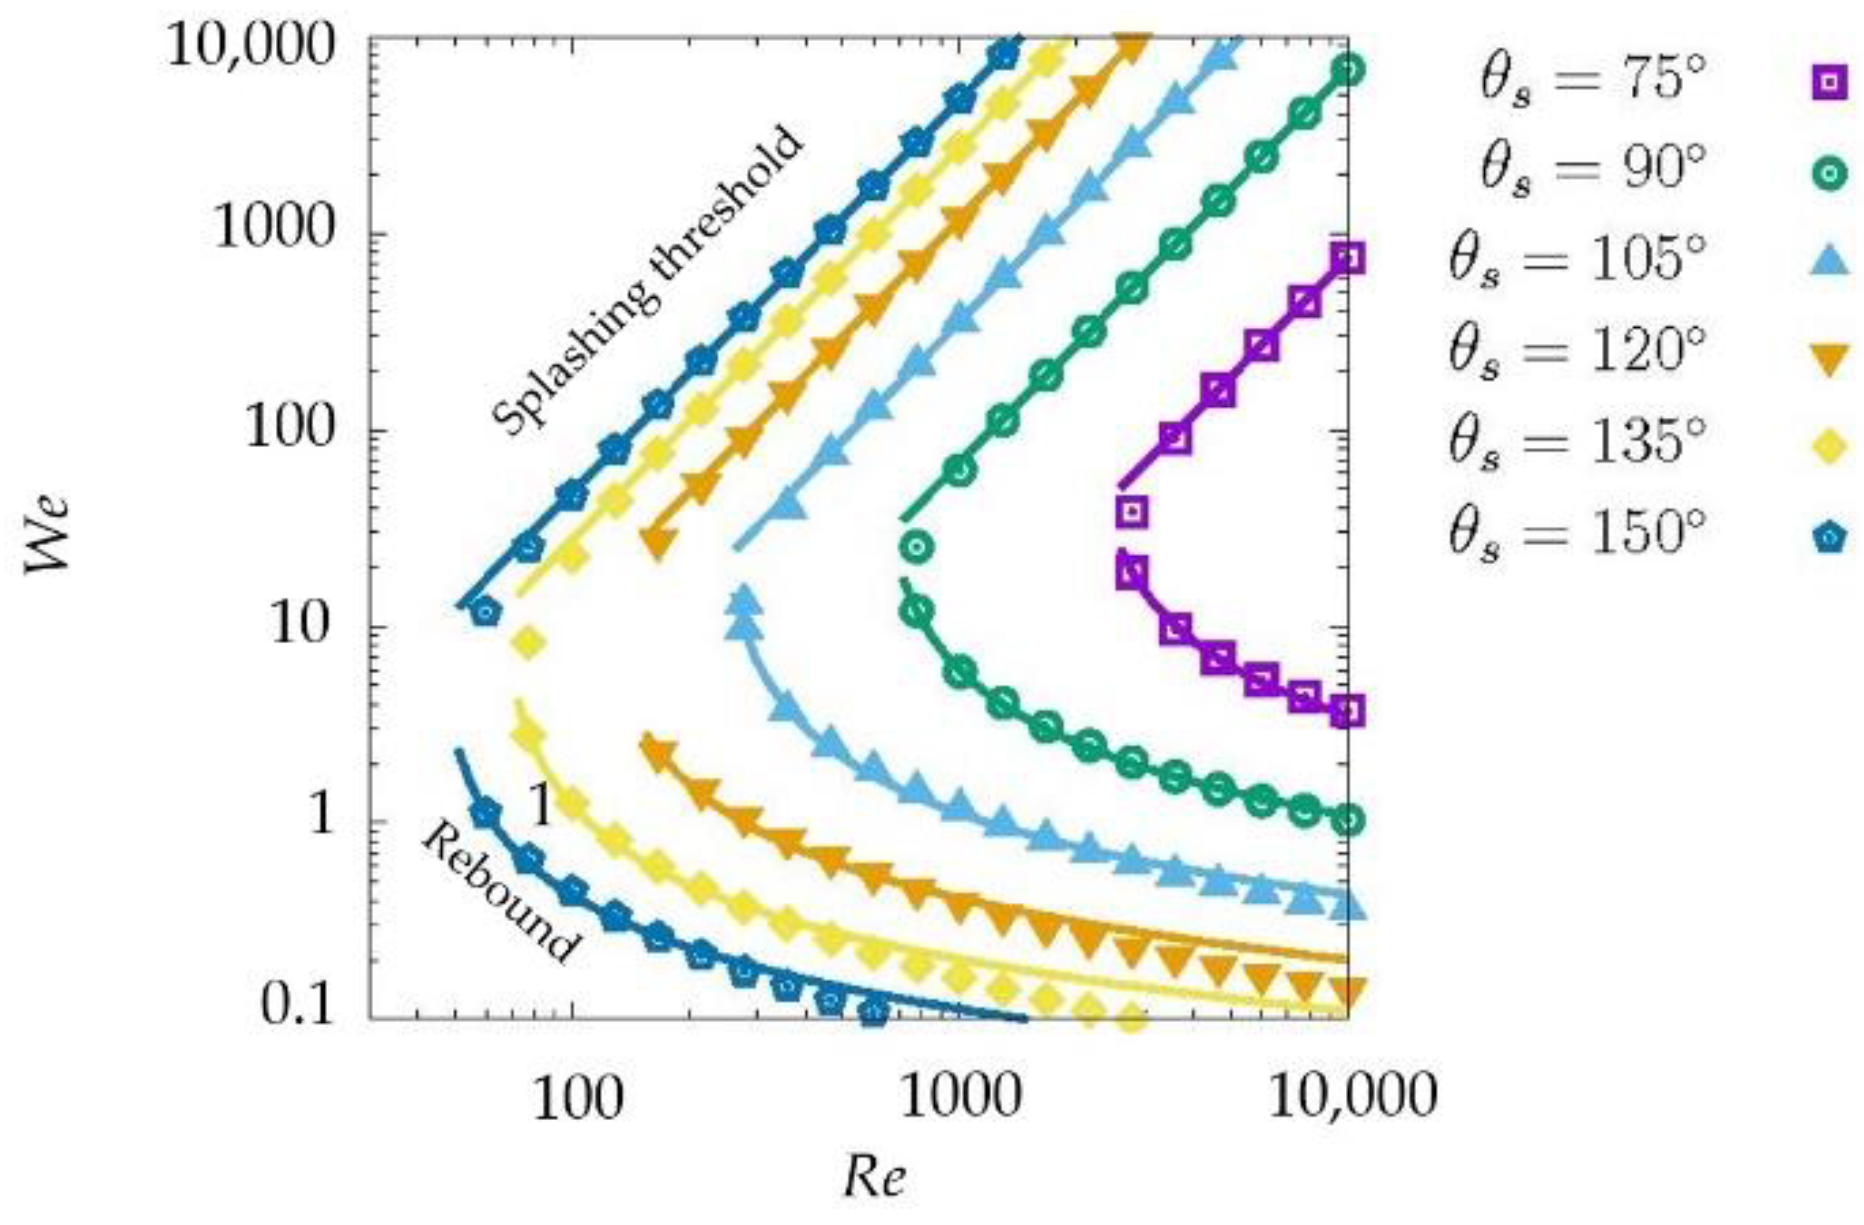
2.1. Droplet Impact Modeling
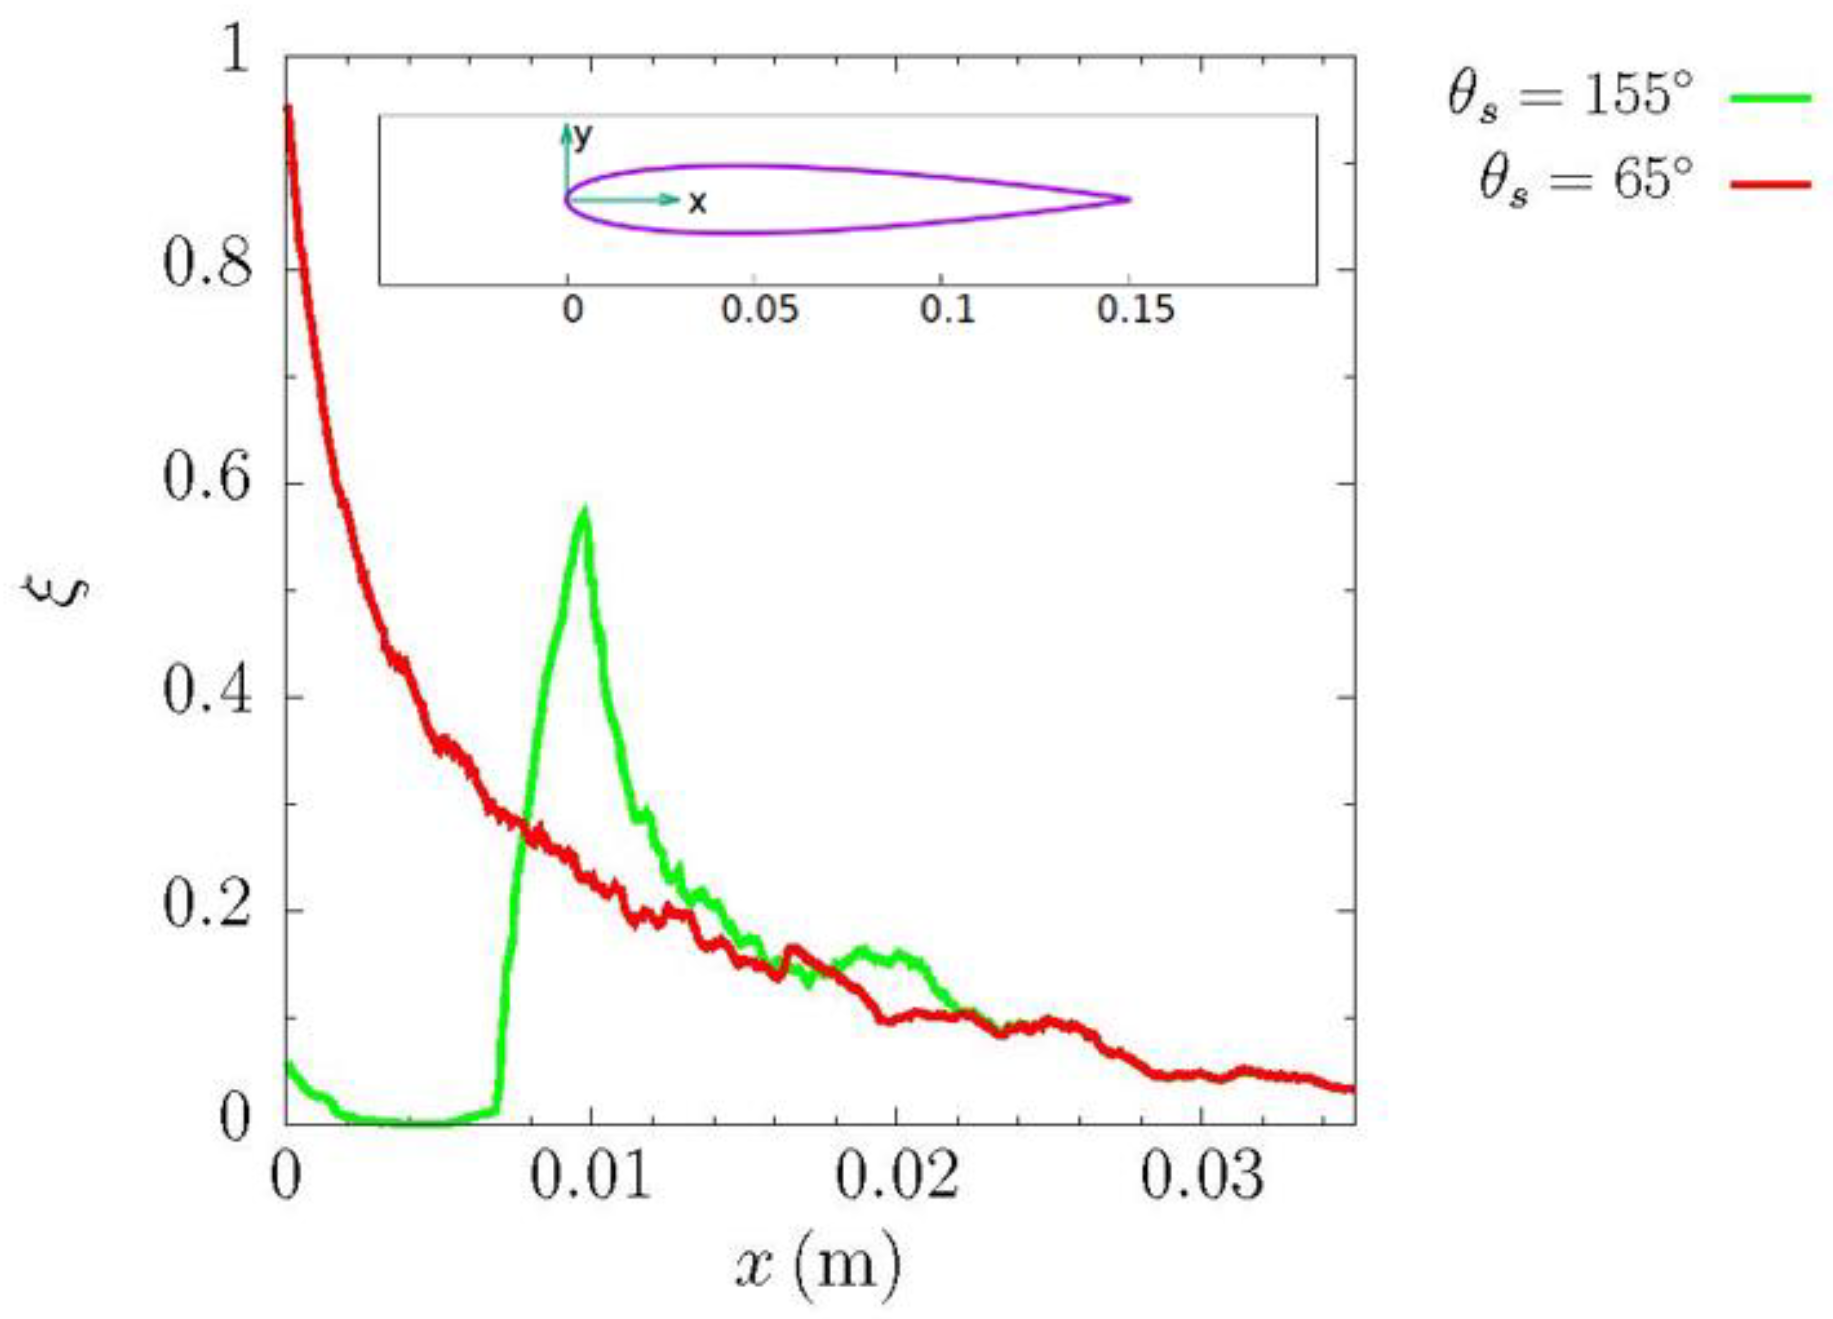
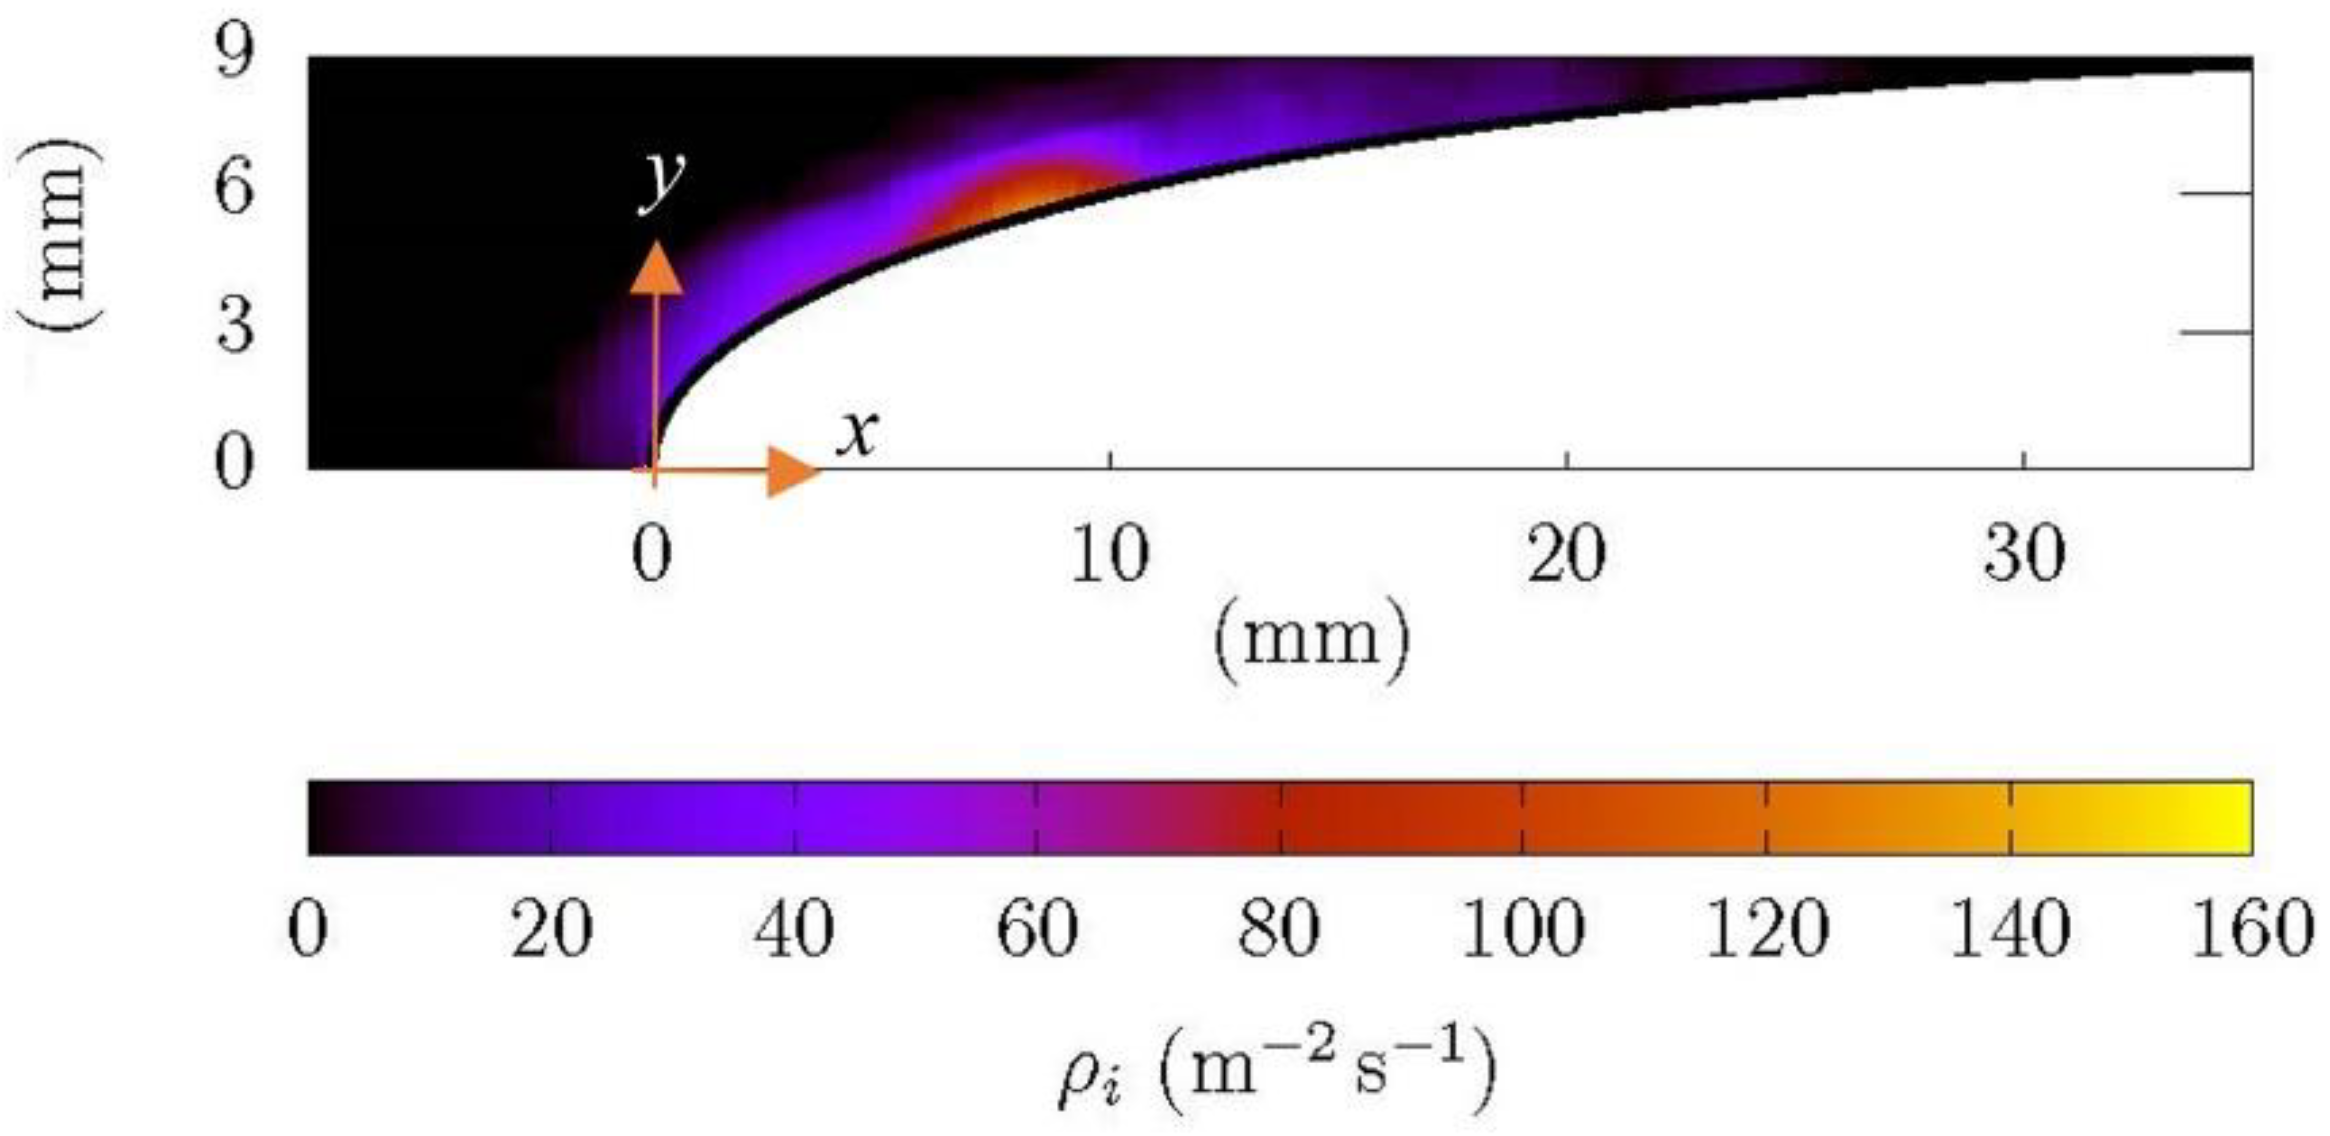
2.2. Collection Efficiency
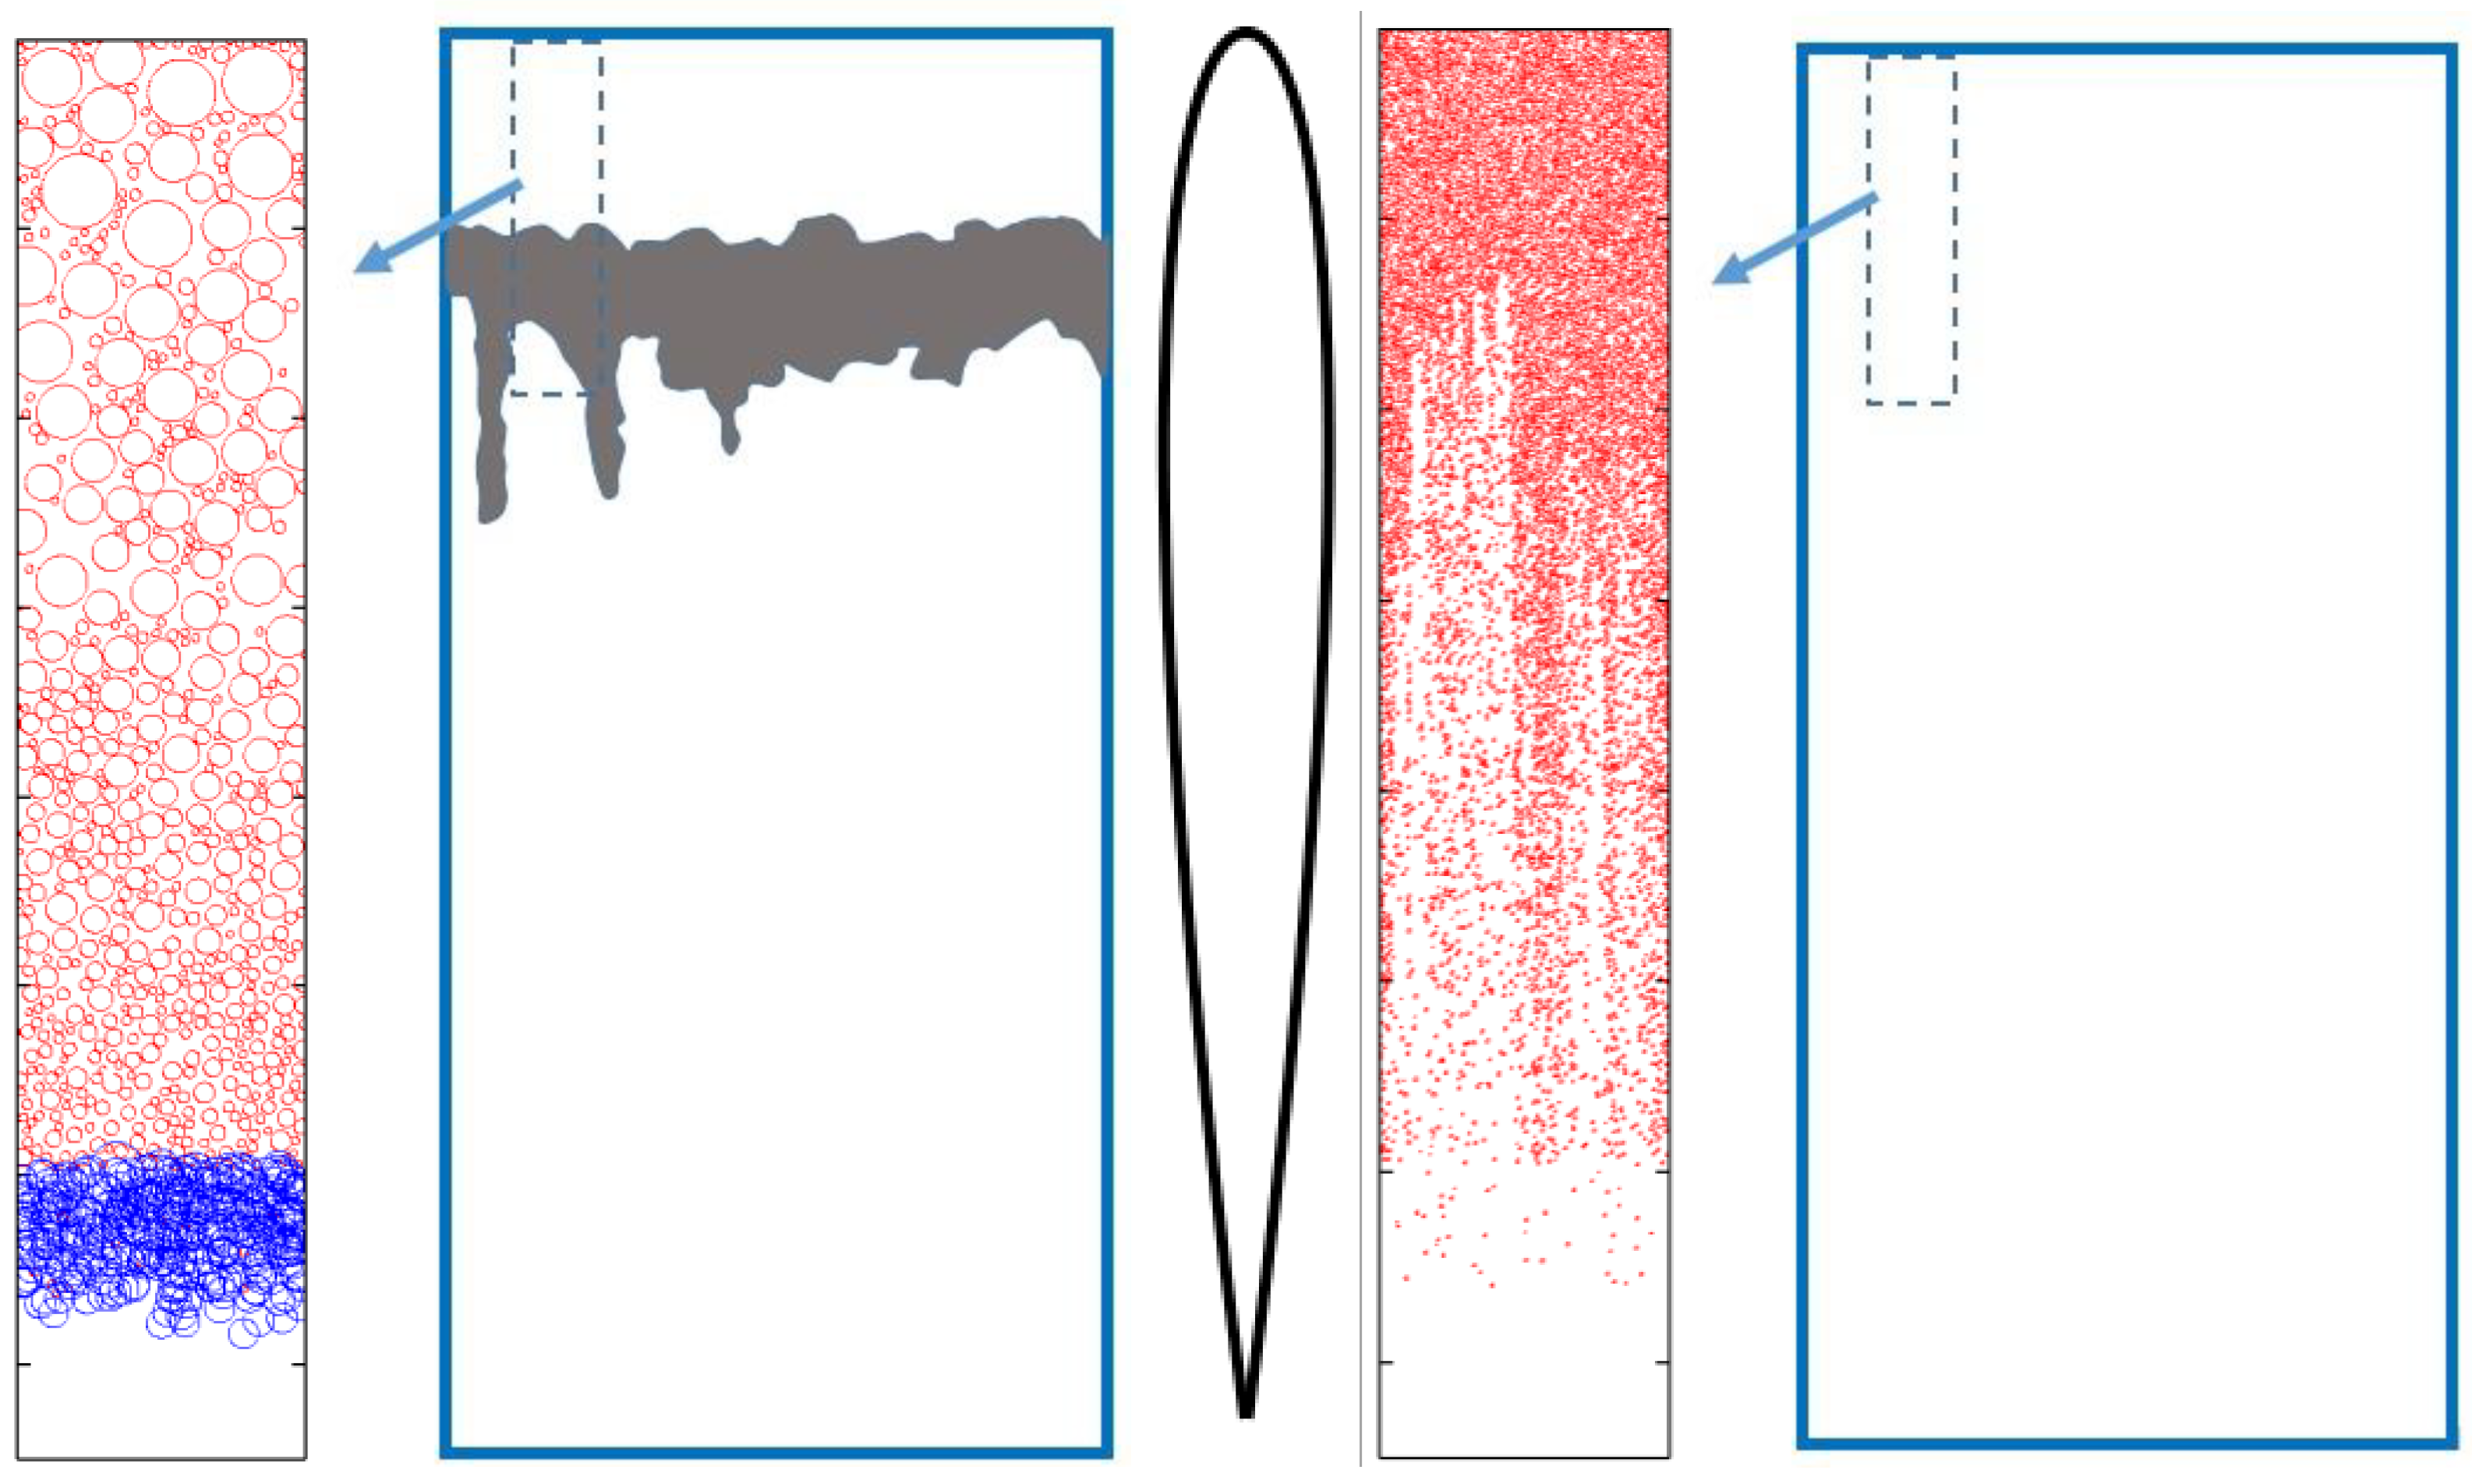
2.3. Droplet Behavior and Runback Water Modeling
- Generation of N impinging sites at random locations, depending on local collection efficiency.
- Coalescence check between new impinging droplets and existing ones.
- Heat transfer balance for any single droplet.
- Evaluation of freezing or evaporating mass flow.
- Frozen mass will either contribute to the growth of an existing ice bead or create a new one at the freezing bead location.
- Droplet stretching limit check, detecting possible rivulet onset.
- Droplet and rivulet movement check, including coalescences along the moving path.
- Next time step.
2.4. Phase Change
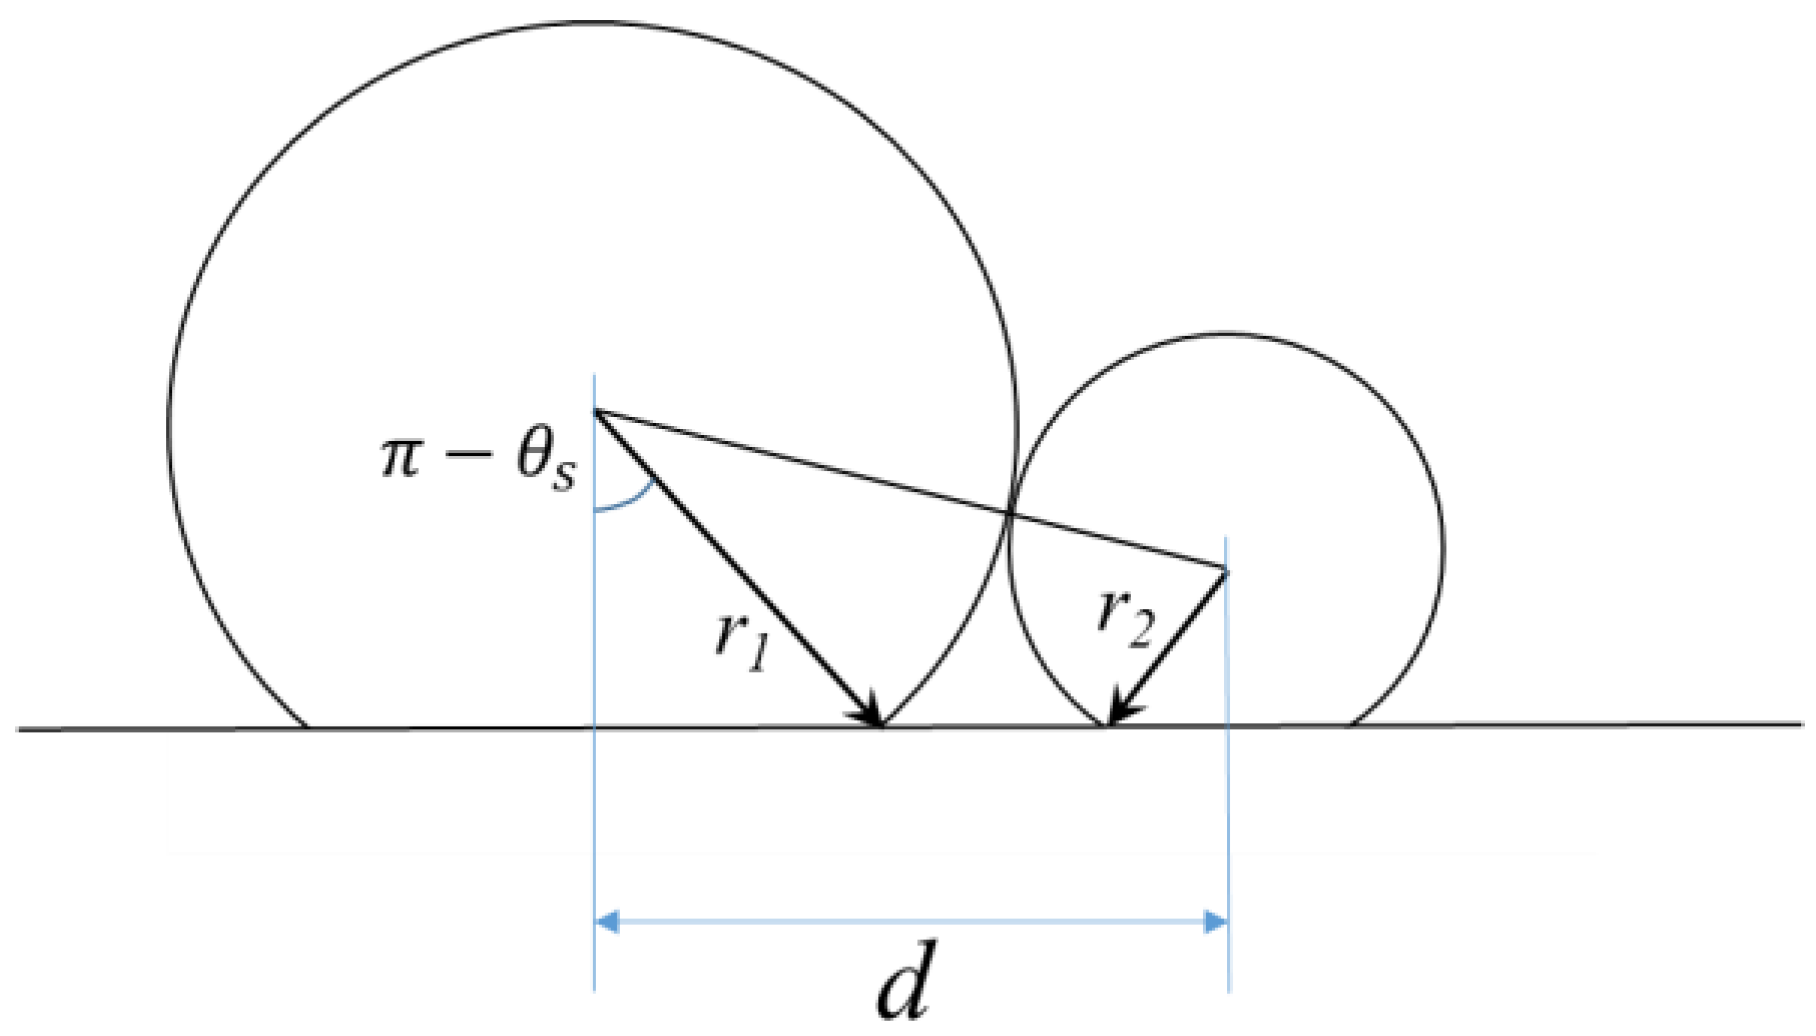
2.5. Rivulet Onset
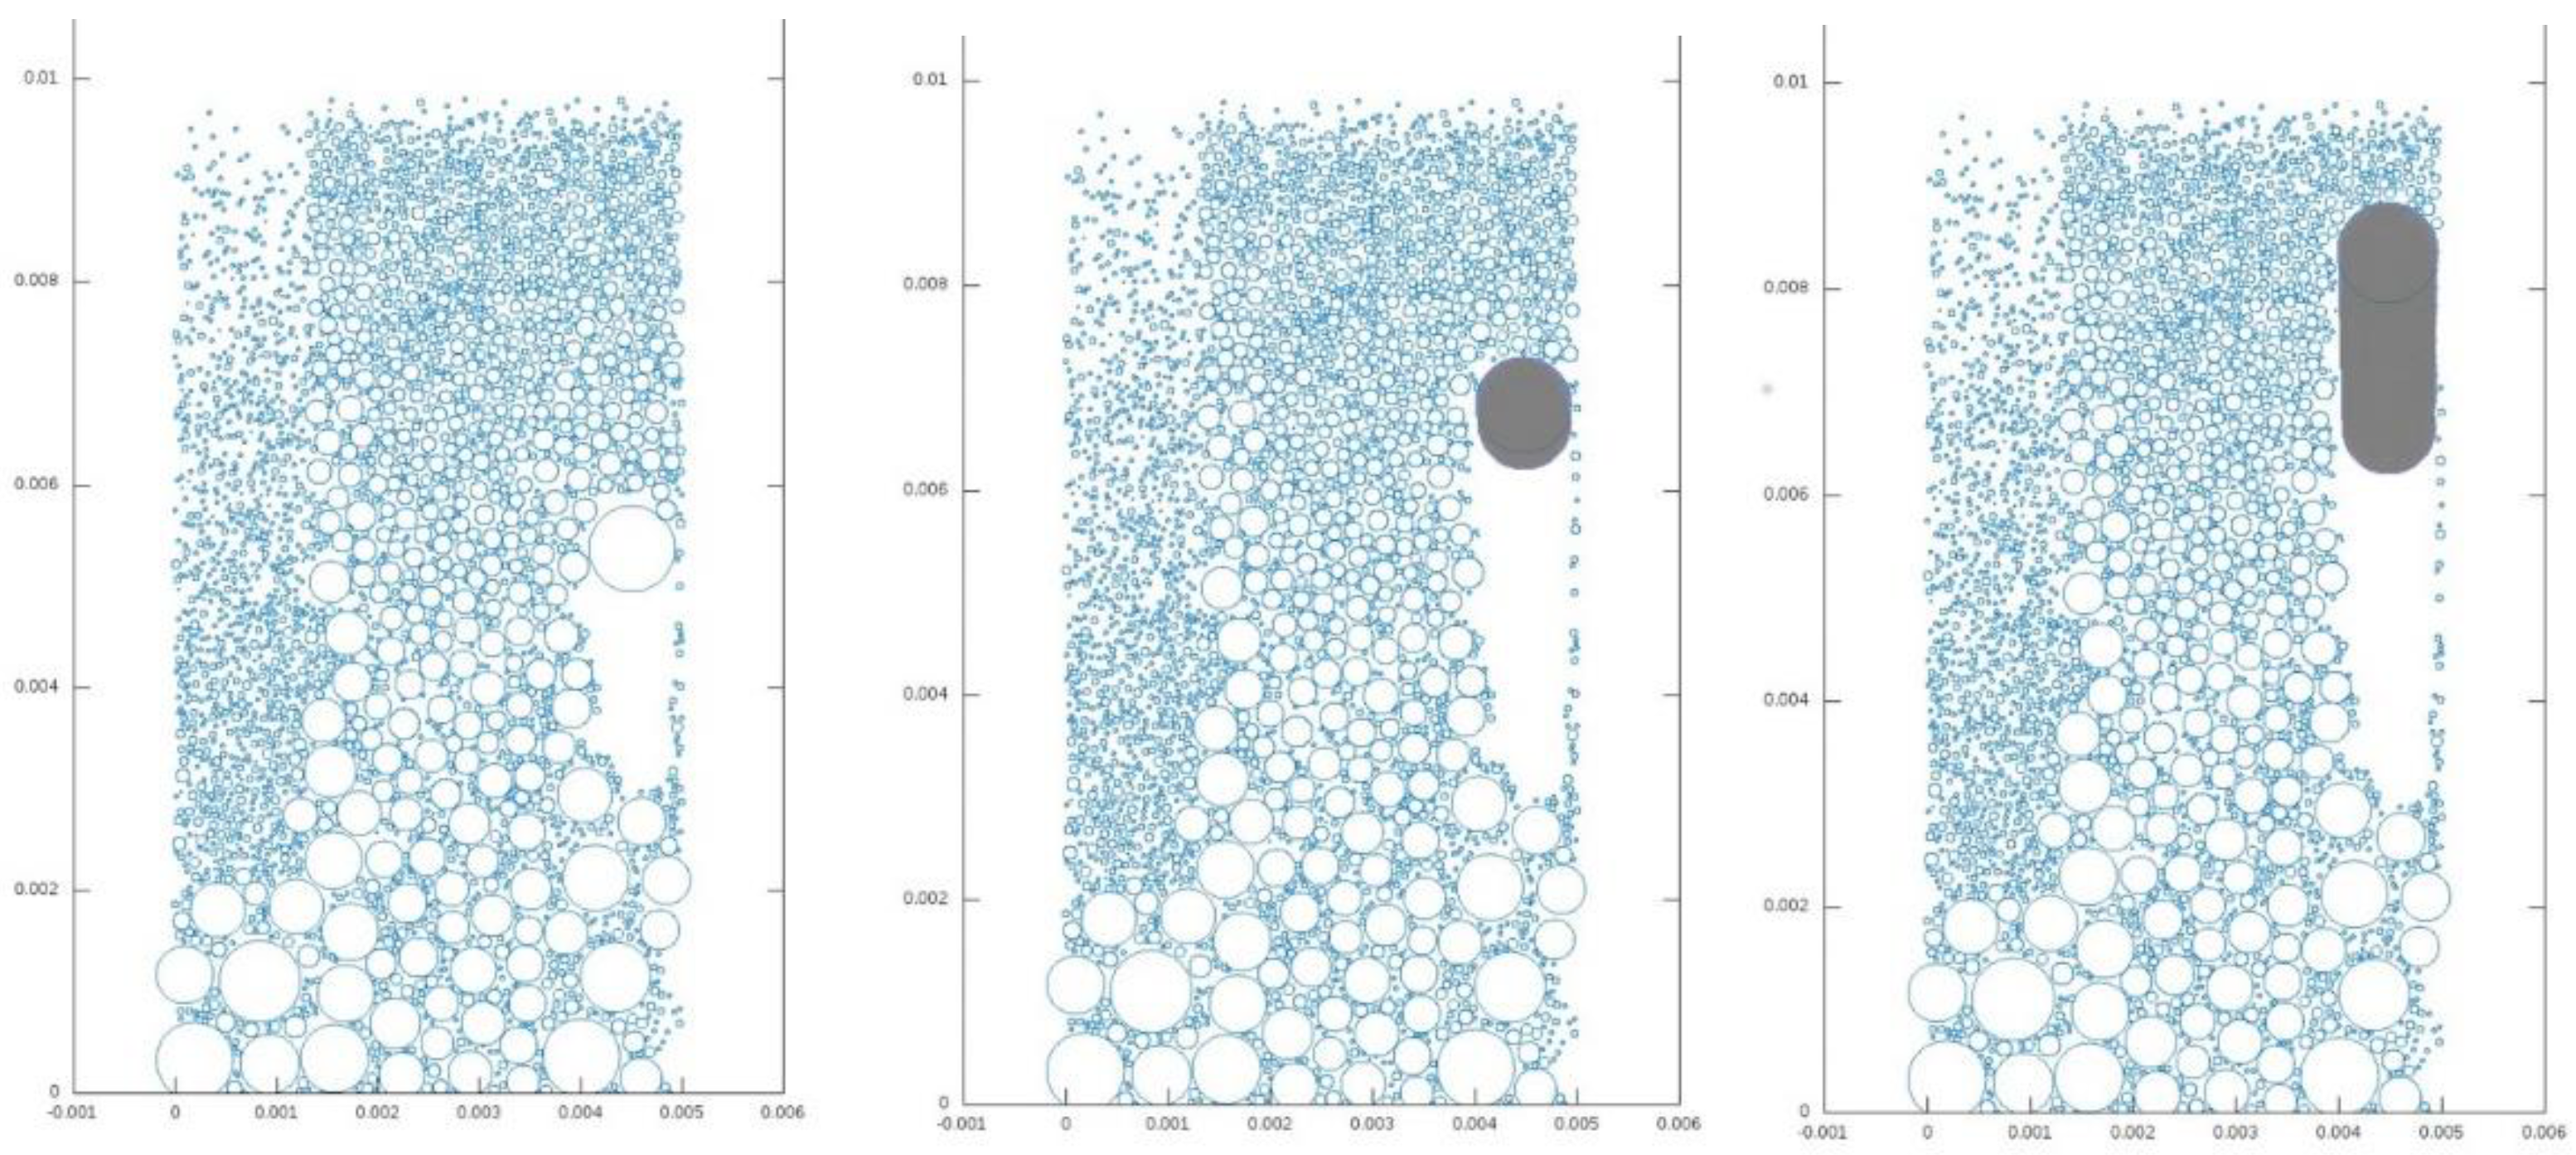
3. Results
4. Conclusions
Author Contributions
Funding
Data Availability Statement
Conflicts of Interest
Nomenclature
| droplet height | |
| surface energy | |
| kinetic energy | |
| viscous dissipation | |
| rim dissipation | |
| drag force | |
| gravity force | |
| rigidity force | |
| gravity acceleration | |
| evaporating mass flow rate | |
| freezing mass flow rate | |
| number of impinging sites | |
| heat flux | |
| droplet radius | |
| droplet Reynolds number, | |
| liquid–air interface area | |
| solid–liquid interface area | |
| time | |
| air velocity | |
| droplet velocity | |
| droplet volume | |
| droplet Weber number, | |
| Cartesian coordinates | |
| collection efficiency | |
| static contact angle | |
| evaporation latent heat | |
| fusion latent heat | |
| dynamic viscosity | |
| Density | |
| surface tension | |
| drag force work | |
| gravity force work | |
| surface tension work | |
| viscous dissipation |
References
- Messinger, B.L. Equilibrium Temperature of an Unheated Icing Surface as a Function of Air Speed. J. Aeronaut. Sci. 1953, 20, 29–42. [Google Scholar] [CrossRef]
- Bourgault, Y.; Beaugendre, H.; Habashi, W. Development of a shallow-water icing model in FENSAP-ICE. J. Aircr. 2000, 37, 640–646. [Google Scholar] [CrossRef]
- Bourgault, Y.; Boutanios, Z.; Habashi, W.G. Three-dimensional Eulerian approach to droplet impingement simulation using FENSAP-ICE, Part 1: Model, algorithm, and validation. J. Aircr. 2000, 37, 95–103. [Google Scholar] [CrossRef]
- Croce, G.; De Candido, E.; Habashi, W.G.; Munzar, J.; Aubé, M.S.; Baruzzi, G.S.; Aliaga, C. FENSAP-ICE: Analytical model for spatial and temporal evolution of in-flight icing roughness. J. Aircr. 2010, 47, 1283–1289. [Google Scholar] [CrossRef]
- Villeneuve, E.; Brassard, J.-D.; Volat, C. Effect of various surface coatings on de-icing/anti-icing fluids aerodynamic and endurance time performances. Aerospace 2019, 6, 114. [Google Scholar] [CrossRef] [Green Version]
- Rose, J.B.R.; Hamilton, J.A.J.L. Experimental investigation on the alternate coating method for aircraft anti-icing applications. IMechE J. Aerosp. Eng. 2017, 231, 407–418. [Google Scholar] [CrossRef]
- Zheng, S.; Li, C.; Fu, Q.; Hu, W.; Xiang, T.; Wang, Q.; Du, M.; Liu, X.; Chen, Z. Development of stable superhydrophobic coatings on aluminum surface for corrosion-resistant, self-cleaning, and anti-icing applications. Mater. Des. 2016, 93, 261–270. [Google Scholar] [CrossRef]
- Tarquini, S.; Antonini, C.; Amirfazli, A.; Marengo, M.; Palacios, J. Investigation of ice shedding properties of superhydrophobic coatings on helicopter blades. Cold Reg. Sci. Technol. 2014, 100, 50–58. [Google Scholar] [CrossRef]
- Esmeryan, K.D. From Extremely Water-Repellent Coatings to Passive Icing Protection-Principles, Limitations and Innovative Application Aspects. Coatings 2020, 10, 66. [Google Scholar] [CrossRef] [Green Version]
- He, Z.; Zhuo, Y.; Zhang, Z.; He, J. Design of Icephobic Surfaces by Lowering Ice Adhesion Strength: A Mini Review. Coatings 2021, 11, 1343. [Google Scholar] [CrossRef]
- Rioboo, R.; Voué, M.; Vaillant, A.; De Coninck, J. Drop Impact on Porous Superhydrophobic Polymer Surfaces. Langmuir 2008, 24, 14074–14077. [Google Scholar] [CrossRef] [PubMed]
- Mao, T.; Kuhn, D.C.S.; Tran, H. Spread and Rebound of Liquid Droplets upon Impact on Flat Surfaces. AIChE J. 1997, 43, 2169–2179. [Google Scholar] [CrossRef]
- Attané, P.; Girard, F.; Morin, V. An energy balance approach of the dynamics of drop impact on a solid surface. Phys. Fluids 2007, 19, 012101. [Google Scholar] [CrossRef]
- Esmeryan, K.D.; Bressler, A.S.; Castano, C.E.; Fergusson, C.P.; Mohammadi, R. Rational strategy for the atmospheric icing prevention based on chemically functionalized carbon soot coatings. Appl. Surf. Sci. 2016, 390, 452–460. [Google Scholar] [CrossRef]
- Marengo, M.; Antonini, C.; Roisman, I.V.; Trope, C. Drop collisions with simple and complex surfaces. Curr. Opin. Colloid Interface Sci. 2011, 16, 292–302. [Google Scholar] [CrossRef]
- Bird, J.C.; Dhiman, R.; Kwon, H.; Varanasi, K.K. Reducing the contact time of a bouncing drop. Nature 2013, 503, 385–388. [Google Scholar] [CrossRef] [PubMed]
- Qi, W.; Weisensee, P.B. Dynamic wetting and heat transfer during droplet impact on bi-phobic wettability patterned surfaces. Phys. Fluids 2020, 32, 067110. [Google Scholar] [CrossRef]
- Croce, G.; Suzzi, N.; D’Agaro, P. Numerical prediction of dropwise condensation performances on hybrid hydrophobic-hydrophilic surfaces. J. Phys. Conf. Ser. 2020, 1599, 012006. [Google Scholar] [CrossRef]
- De Candido, E.; Croce, G.; D’Agaro, P. Droplet Buildup and Water Retention Prediction in Condensation Processes. Heat Transf. Eng. 2012, 33, 1130–1137. [Google Scholar] [CrossRef]
- Wang, F.; Cheng, X. Modeling approach of flowing condensate coverage rate on inclined wall for aerosol wash down. Nucl. Eng. Des. 2019, 355, 110349. [Google Scholar] [CrossRef]
- Caviezel, D.; Narayanan, C.; Lakehal, D. Adherence and bouncing of liquid droplets impacting on dry surfaces. Microfluid. Nanofluidics 2008, 5, 469–478. [Google Scholar] [CrossRef]
- Burzynski, D.A.; Roisman, I.V.; Bansmer, S.E. On the splashing of high-speed drops impacting a dry surface. J. Fluid Mech. 2020, 892, A2. [Google Scholar] [CrossRef] [Green Version]
- Sikalo, S.; Trope, C.; Ganic, E.N. Impact of droplets onto inclined surfaces. J. Colloid Interface Sci. 2005, 286, 661–669. [Google Scholar] [CrossRef]
- Croce, G.; D’Agaro, P.; Suzzi, N. Optimization of Hybrid Hydrophilic-Hydrophobic Surfaces for Dropwise Condensation Enhancement; ASME Paper ICNMM2019-4291; ASME: New York, NY, USA, 2019. [Google Scholar]
- El Sherbini, A.I.; Jacobi, A.M. Liquid Drops on Vertical and Inclined Surfaces I. An Experimental Study of Drop Geometry. J. Colloid Interface Sci. 2004, 273, 556–565. [Google Scholar] [CrossRef]
- El Sherbini, A.I.; Jacobi, A.M. Liquid Drops on Vertical and Inclined Surfaces II. A Method for Approximating Drop Shapes. J. Colloid Interface Sci. 2004, 273, 566–575. [Google Scholar] [CrossRef]
- Tancon, M.; Parin, R.; Martucci, A.; Bortolin, S.; Del Col, D. Effect of steam velocity during dropwise condensation. Int. J. Heat Mass Transf. 2021, 165, 120624. [Google Scholar] [CrossRef]
- Croce, G.; D’Agaro, P.; Della Mora, F. Numerical simulation of glass fogging and defogging. Int. J. Comput. Fluid Dyn. 2007, 19, 437–445. [Google Scholar] [CrossRef]
- Hu, H.; Hu, H.; Liu, Y. An Explorative Study to Use Super-Hydrophilic/Super-Hydrophobic Hybrid Surfaces for Aircraft Icing Mitigation; SAE Technical Paper 2019-01-1995; SAE International: Warrendale, PA, USA, 2019. [Google Scholar] [CrossRef]


Publisher’s Note: MDPI stays neutral with regard to jurisdictional claims in published maps and institutional affiliations. |
© 2022 by the authors. Licensee MDPI, Basel, Switzerland. This article is an open access article distributed under the terms and conditions of the Creative Commons Attribution (CC BY) license (https://creativecommons.org/licenses/by/4.0/).
Share and Cite
Croce, G.; Suzzi, N.; Pretto, M.; Giannattasio, P. Numerical Modelling of Droplets and Beads Behavior over Super-Hydrophobic and Hydrophilic Coatings under in-Flight Icing Conditions. Appl. Sci. 2022, 12, 7654. https://doi.org/10.3390/app12157654
Croce G, Suzzi N, Pretto M, Giannattasio P. Numerical Modelling of Droplets and Beads Behavior over Super-Hydrophobic and Hydrophilic Coatings under in-Flight Icing Conditions. Applied Sciences. 2022; 12(15):7654. https://doi.org/10.3390/app12157654
Chicago/Turabian StyleCroce, Giulio, Nicola Suzzi, Marco Pretto, and Pietro Giannattasio. 2022. "Numerical Modelling of Droplets and Beads Behavior over Super-Hydrophobic and Hydrophilic Coatings under in-Flight Icing Conditions" Applied Sciences 12, no. 15: 7654. https://doi.org/10.3390/app12157654