Article

Evaluating the Influence of Fracture Roughness and Tortuosity on Fluid Seepage Based on Fluid Seepage Experiments

1
School of Mining Engineering, North China University of Science and Technology, Tangshan 063210, China
2
Hebei Key Laboratory of Mining Development and Safety Technology, North China University of Science and Technology, Tangshan 063210, China
3
Center for Rock Instability and Seismicity Research, Northeastern University, Shenyang 110819, China
*
Author to whom correspondence should be addressed.
Appl. Sci. 2022, 12(15), 7661; https://doi.org/10.3390/app12157661
Submission received: 29 June 2022 / Revised: 21 July 2022 / Accepted: 24 July 2022 / Published: 29 July 2022
(This article belongs to the Special Issue Fracture and Failure of Jointed Rock Mass)

Abstract

:
The roughness and tortuosity of fractures are essential parameters affecting the fluid flow in a jointed rock mass. This paper investigates the influence of fracture roughness and tortuosity on fluid seepage behavior. A rough fracture surface was characterized by means of three-dimensional scanning and three-reconstruction technology, and the roughness and tortuosity of rock fractures were calculated. Hydraulic tests were conducted on deformed sandstone fractures with a self-made fracture seepage device, and the variation in the seepage flow was analyzed in rough fractures. The experimental results showed that the seepage flow of fluid decreased non-linearly with the increase in fracture roughness. Under different normal pressures, the friction resistance coefficient and tortuous resistance coefficient decreased with the increase in the Reynolds number. The friction resistance coefficient model and tortuous resistance coefficient model were used to quantitatively analyze the influence of fracture tortuosity and roughness on fluid flow, respectively. A modified model of the frictional resistance coefficient, considering fracture tortuosity and roughness, was established, which clearly expresses the law that with the increase in fracture tortuosity and roughness, the seepage flow of fluid decreases, and the head loss increases. The results of this research can provide a theoretical and experimental basis for studying fluid seepage behavior in deformed sandstone fractures.

1. Introduction

As the main seepage channels of fluids, fracture spaces of rock masses are found widely in rock mass engineering, such as dam foundations, slopes, underground caverns, etc. In the process of underground engineering, many rock hydraulics problems are related to the rock fracture pathway. Under the interaction of artificial engineering disturbance stress, in situ stress, and groundwater seepage pressure, the seepage behavior of groundwater in rock mass fractures affects the stability of fractured rock masses in engineering activities [1,2]. The safety of human engineering activities and the adverse effects of the geological environment on engineering activities are also often affected by the seepage behavior of fluids in rock fractures [3]. Therefore, evaluating and predicting the impact of fluid seepage behavior in rock fractures on the stability and safety of human engineering activities is a crucial new topic in hydrogeology and engineering geology at present and will be in the future.
In the seepage of a fractured rock mass, the famous cubic law has been widely used in theoretical research and engineering practice. When the fracture surface is parallel and smooth, the cubic law describes the cubic relationship between the seepage flow and the fracture aperture. However, in practical engineering, natural rock fractures are rough, making it difficult for the fluid seepage to correspond to the assumptions of the cubic law. Therefore, many scholars have conducted seepage tests on artificial rough fractures and found that the parallel plate model hypothesis is no longer applicable in describing the seepage behavior of fluids due to the rough and uneven surface of fractures [4]. In the literature about fluid seepage behavior, the roughness of fractures represents the rough and uneven surface of fractures. Many experimental and numerical studies have confirmed the influence of roughness on fluid seepage behavior [5,6]. Zhang et al. proposed a seepage model considering the roughness of fractures and found that the roughness of fractures is a vital cause of fluid seepage flow reduction and nonlinear seepage [7]. Wang et al. revised the cubic law by introducing relative roughness to accurately determine the seepage behavior of a fluid in rough fractures. Based on the modified cubic law, many experimental studies were carried out in fractured channels. The results showed that the seepage behavior of fluids in fracture channels with different roughness differs from that described by the cubic law because of the influence of fracture roughness [8]. Zimmermann et al. found that the roughness of the fracture causes the weak inertia effect, causing the fluid seepage flow to decrease with the increase in fracture roughness [9]. It can be observed in the above mentioned studies that the roughness of the fracture is one of the most significant factors affecting the fluid seepage behavior and seepage flow reduction in rough fractures.
In rough fractures, the fluid seepage path is usually tortuous, which easily affects the seepage behavior of the fluid [10]. The tortuous fluid seepage path is generally expressed by the tortuosity of the fracture [11,12,13]. The tortuosity of the fracture can cause additional seepage flow loss, which causes the fluid seepage behavior to deviate from the linear Darcy law [14]. Duda et al. studied the effect of fracture tortuosity on the seepage flow in the seepage channel. They believed that the actual seepage flow corresponds to the ratio of the seepage flow calculated by means of the linear Darcy law to the tortuosity [15]. S. Murata and T. Saito suggested that the increase in fracture tortuosity is the reason for the decrease in fluid seepage flow. The results showed that the fluid flowing into the fracture is divided into several seepage channels according to the differing tortuosity of the fracture [16]. These seepage channels dispersed the fluid flowing into the fracture and resulted in a decrease in seepage flow. Tsang quantitatively studied the influence of tortuosity on fluid seepage behavior according to the size of the fracture contact area. The test results showed that the larger the contact area between the fluid and the fracture, the more significant the effect of the fracture tortuosity on the fluid seepage flow [17]. The tortuosity of rough fractures complicates the fluid flow path and the contact area between the fluid and the fracture surface, resulting in additional energy losses and seepage flow losses [18,19,20]. The tortuosity of rough fractures is a vital factor affecting fluid seepage behavior. The tortuosity of rough fractures should be considered when studying the seepage characteristics of the fluid in rough fractures. Understanding the influence of the rough fracture tortuosity on fluid flow behavior requires further analysis and research.
It can be seen from the above analysis that the roughness and tortuosity of rough fractures lead to a decrease in fluid seepage flow. Researchers have shown that the actual reason for decreasing seepage flow is the friction resistance between the fluid and the rough fracture surface [21]. The friction resistance coefficient is often used to represent the size of the friction resistance [22,23]. Chen et al. studied the relationship between the frictional resistance coefficient and groundwater seepage flow in fracture channels through laboratory experiments. The results showed that the seepage flow of the fluid decreased non-linearly with the increase in the frictional resistance coefficient [24]. Kunihide Ohashi et al. deduced the relationship between the frictional resistance coefficient and seepage flow using numerical simulation experiments. They analyzed the reasons for decreasing seepage flow in rough fractures [25]. Sajjad-Foroughi et al. established a model of the relationship between seepage flow and the frictional resistance coefficient and studied the influence of frictional resistance on the fluid seepage state and seepage behavior [26]. The frictional resistance changes the seepage flow of the fluid, which significantly affects the seepage behavior of the fluid. However, due to the rough surface and complex geometry of natural rock fractures, the friction resistance cannot be deduced strictly theoretically. Many scholars have put forward calculation models for the frictional resistance coefficient of fluids, developed through many laboratory tests and numerical simulation experiments [27]. These friction resistance coefficient models are shown in Table 1. In the models, f is the friction resistance coefficient. R e is the Reynolds number. e is the rough fracture aperture. ξ is the height of the unevenness of the rough fracture (Appendix A).
It can be observed in Table 1 that it is not possible to comprehensively analyze the seepage behavior of a fluid using these friction coefficient models, and the following problems require further discussion. Firstly, the friction resistance coefficient model in Table 1 is established considering the Reynolds number, the peak asperity height, and the fracture aperture, but the specific causes of fluid flow reduction in rough fractures cannot be clearly described. Secondly, many studies show that the tortuosity of the fracture affects the flow behavior of the fluid, but the friction resistance coefficient models presented in Table 1 do not take the tortuosity of fractures into account. In addition, these friction resistance coefficient models do not consider the effects of water pressure and normal pressure on fractures in the derivation process.
The studies mentioned above show that the roughness and tortuosity of the fracture affect the seepage behavior of the fluid in rough fractures. The frictional resistance between the fluid and the rough fracture surface causes a decrease in the seepage flow. However, from the perspective of fluid seepage resistance, considering the roughness and tortuosity of fractures, it is still necessary to further explore the seepage behavior of rough fractures under water pressure and normal pressure. Therefore, the primary purpose of this paper was to study the effects of fracture roughness and tortuosity on fluid seepage behavior based on fluid seepage experiments. Firstly, the rough fracture surface of a sandstone sample was characterized using a high-precision three- dimensional scanner. The roughness and tortuosity of each sandstone specimen were calculated. Secondly, eight fractured sandstone samples with different roughness and tortuosity measurements were selected to conduct seepage tests with a self-made fracture seepage test device. Thirdly, the Reynolds number, the frictional resistance coefficient, and the tortuous resistance coefficient were calculated based on the seepage flow and hydraulic gradient. The relationship between the frictional resistance coefficient, the tortuous resistance coefficient, and the Reynolds number was studied. In addition, considering the fracture roughness and tortuosity, a new friction coefficient model was established based on the Darcy–Weisbach equation and Darcy’s law. Finally, the rationality of the modified model was verified. The reasons for the decrease in seepage flow and the increase in head loss were analyzed. The results of this research have a great reference value and engineering significance in solving the problems related to rock mass hydraulics.

2. Theoretical Background

The Navier–Stokes (NS) equation [28,29,30] is commonly used to describe fluid flow in rock fractures. In the case of actual applications, however, the NS equation is generally homogenized to Darcy’s well-known law by assuming that the rock fracture is a smooth parallel-plate model. Based on Darcy’s law, the head loss ( Δ P ) can be calculated as follows [31,32]:
Δ P = 12 μ Q L w e 3
where L [ L ] is the fracture length; e [ L ] is the fracture aperture; w [ L ] is the fracture width; μ [ M L 1 T 2 ] is the viscosity of the fluid; Q [ L 3 T 1 ] is the flow rate of the fluid; and Δ P [ M L 1 T 2 ] is the pressure difference between the inlet and outlet of the fracture, also known as the head loss of the fluid. Due to the complexity of the surface geometry of natural rock fractures, the roughness and tortuosity of the fractures cause the relationship between seepage flow and head loss to deviate from Darcy’s law [33,34].
When the fluid flows through the rock fracture, there are many reasons for the increase in head loss and the decrease in seepage flow. On the one hand, the friction resistance prevents the fluid flow in the rock fracture, causing the fluid seepage to produce a frictional head loss. The magnitude of the frictional head loss can be expressed by the well-known Darcy–Weisbach equation [35]:
Δ P f = f L D h ρ ν 2 2
where D h [ M ] is the hydraulic diameter, equal to two times that of the fracture aperture e ; ρ [ M L 3 ] is the fluid density; ν [ L T 1 ] is the average velocity of the fluid; f is the frictional resistance coefficient; and Δ P f [ M L 1 T 2 ] is the frictional head loss.
On the other hand, when fluid flows through obstacles or bending positions in rock fractures, it easily forms a vortex flow, resulting in additional resistance and local head loss. In a rough rock fracture, the reasons for the local head loss are different. In engineering practice, the regional head loss is usually converted into the frictional head loss, equivalent to the fracture length of L 0 . The regional head loss is written as follows:
Δ P j = f L 0 D h ρ ν 2 2
where Δ P j [ M L 1 T 2 ] is regional head loss and L 0 [ L ] is equivalent length. When the fluid flows in a rough fracture channel, the fluid will produce frictional head loss and local head loss. The total head loss is the sum of the frictional head loss and regional head loss, that is:
Δ P = Δ P f + Δ P j
The friction coefficient is a crucial parameter in describing the head loss in the process of fluid seepage, which has been widely used in geological engineering activities such as groundwater and petroleum engineering. As we all know, the frictional resistance coefficient is usually not constant. Its magnitude is mainly related to two key factors; one is the Reynolds number, which represents the seepage state of the fluid, and the other is the fracture roughness, which indicates the complexity of the geometric shape of the fractured channel [36,37]. The frictional resistance coefficient can be determined by evaluating the Reynolds number of the fluid and the roughness of the fracture.
In the laminar flow state, the fluid moves smoothly and linearly along the fracture channel without prominent irregular movement. As for the head loss, the only head loss is the frictional head loss. Therefore, according to Equations (1) and (2), the frictional resistance coefficient of the fluid is obtained as follows [38]:
f = 96 Re
where Re is the Reynolds number, representing the flow state of the fluid. The Reynolds number comprehensively reflects the changes in flow resistance, seepage path geometry, and fluid velocity, and its magnitude is the ratio of inertia force and viscous force in the process of fluid flow [39,40]:
Re = 4 ρ v 2 e 2 μ v e = 2 ρ ν e μ = 2 ρ Q μ w
where ρ [ M L 3 ] is the fluid density; ν [ L T 1 ] is the average velocity of the fluid; e [ L ] is the aperture of the fracture; w [ L ] is the width of the fracture; μ [ M L 1 T 1 ] is the viscosity of the fluid; 4 ρ v 2 e 2 is the inertial force of the fluid; and μ v e is the viscous force of the fluid.
In rough fractures, the fluid moves along the fracture channel in a complex and irregular way. The fluid flow is affected by the roughness of the fracture, and the flow path is uneven. The effective length of the path in which the fluid actually flows through the fracture is L a , not L . Therefore, by introducing the effective length of the path into the Darcy–Weisbach equation, the frictional resistance coefficient considering the fracture roughness can be obtained as follows:
f = 4 Δ P w 2 e 3 L a ρ Q 2
where f is the frictional resistance coefficient and L a is the effective length of the rough fracture seepage path.
In rough fractures, the seepage behavior of a fluid is not only related to the roughness of fractures but also to the tortuosity of fracture seepage paths. In the local scope of the seepage path, the seepage behavior of a fluid is mainly related to the tortuosity of the seepage path. The tortuous resistance coefficient reflects the influence of the tortuosity of the rough fracture on the flow rate and the regional head loss. According to Equation (3), the regional head loss is converted into the frictional head loss equivalent to the fracture length of L 0 . L a L is regarded as the equivalent length when calculating the tortuous resistance coefficient of the fluid. The tortuous resistance coefficient, considering the fracture tortuosity, can be obtained as follows:
λ = 4 Δ P w 2 e 3 ( L a L ) ρ Q 2
where λ is the tortuous resistance coefficient and L a L [ L ] is the equivalent length of the rough fracture, L 0 = L a L .

3. Materials and Methods

3.1. Sample Preparation

Figure 1a shows the prepared sandstone sample, which had uniform particles that were dense and hard, and a low permeability of the sandstone matrix. The sandstone samples were obtained from a large quarry processing plant in Shenyang, Liaoning province, China. The sandstone samples with a size of 200 × 100 × 150 mm were fractured and divided into two halves with upper and lower anastomosis by means of the indirect tensile method, which was similar to Brazilian splitting tests. The split rough fracture surface is shown in Figure 1b. The rough surface homogeneity indicates that the fracture represented the characteristics of rough fractures and thus facilitated our focus on the effects of fractures’ geometrical characteristics on fluid flow. In addition, uniaxial compression tests were carried out on sandstone samples, and the basic physical and mechanical parameters of this sandstone are shown in Table 2.

3.2. Basic Parameters and Characterization of Rough Fractures

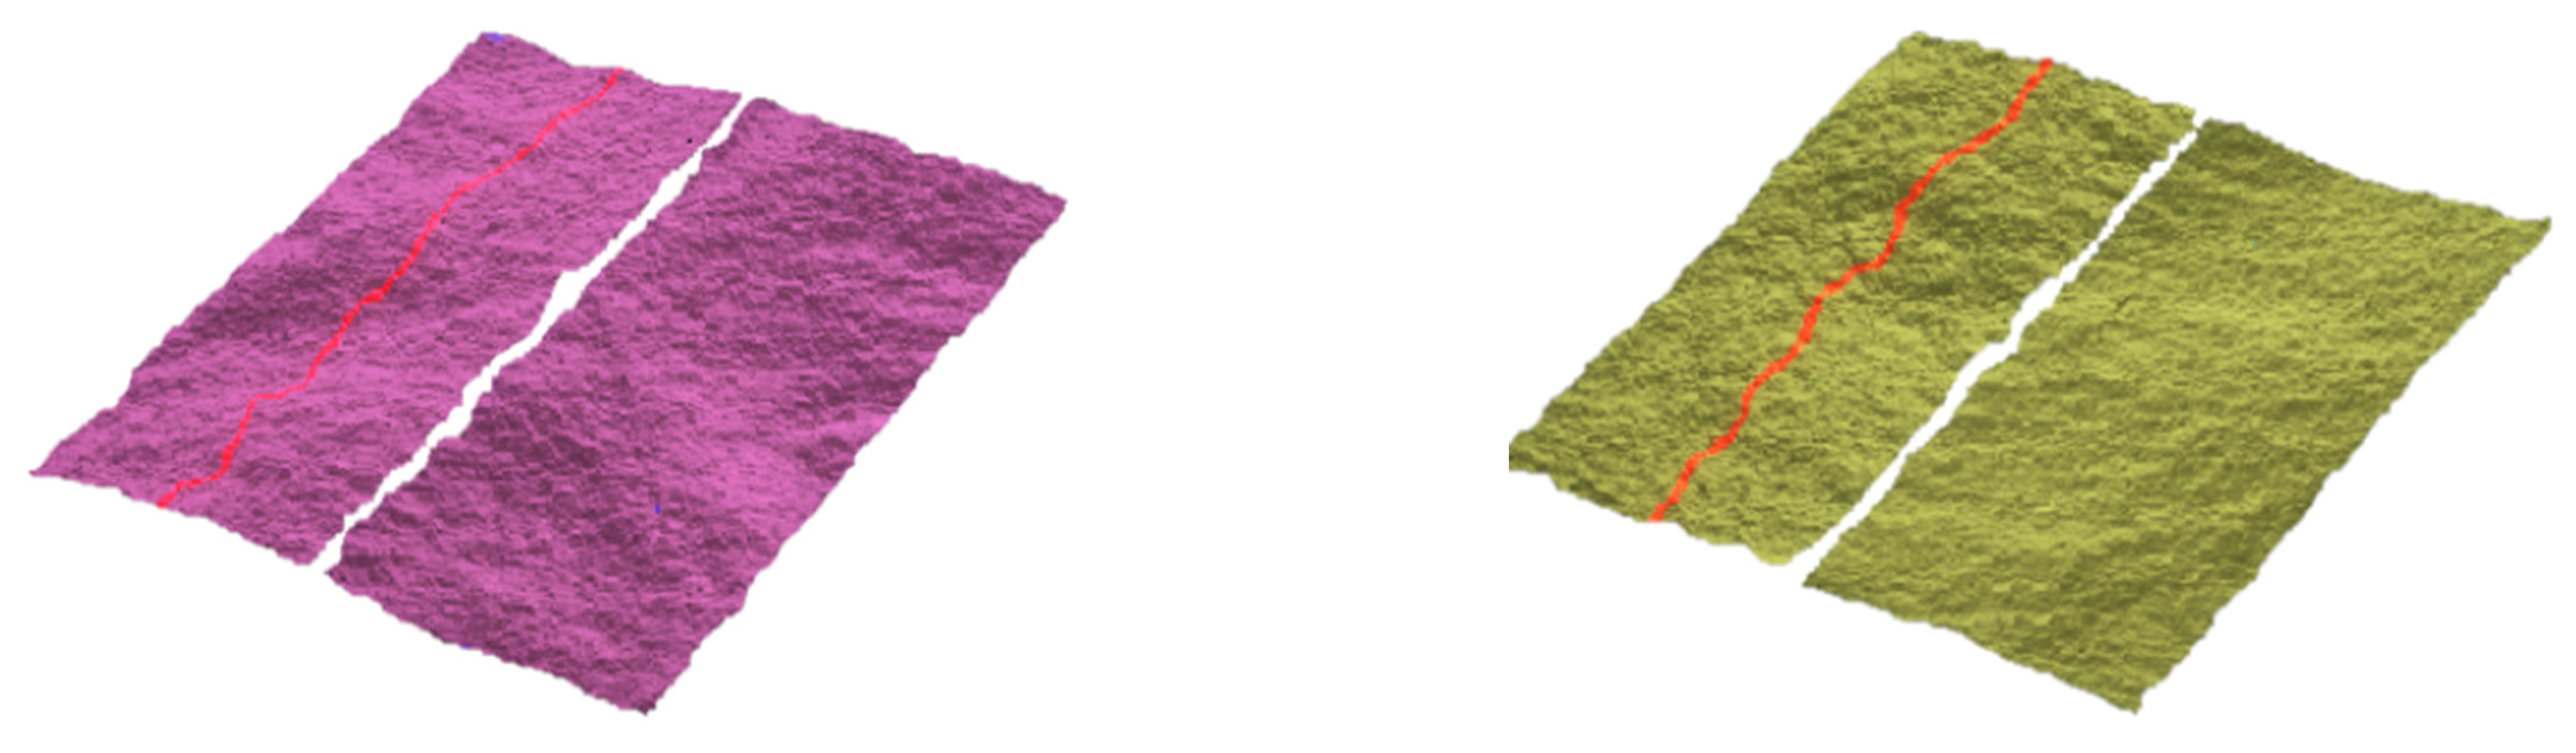
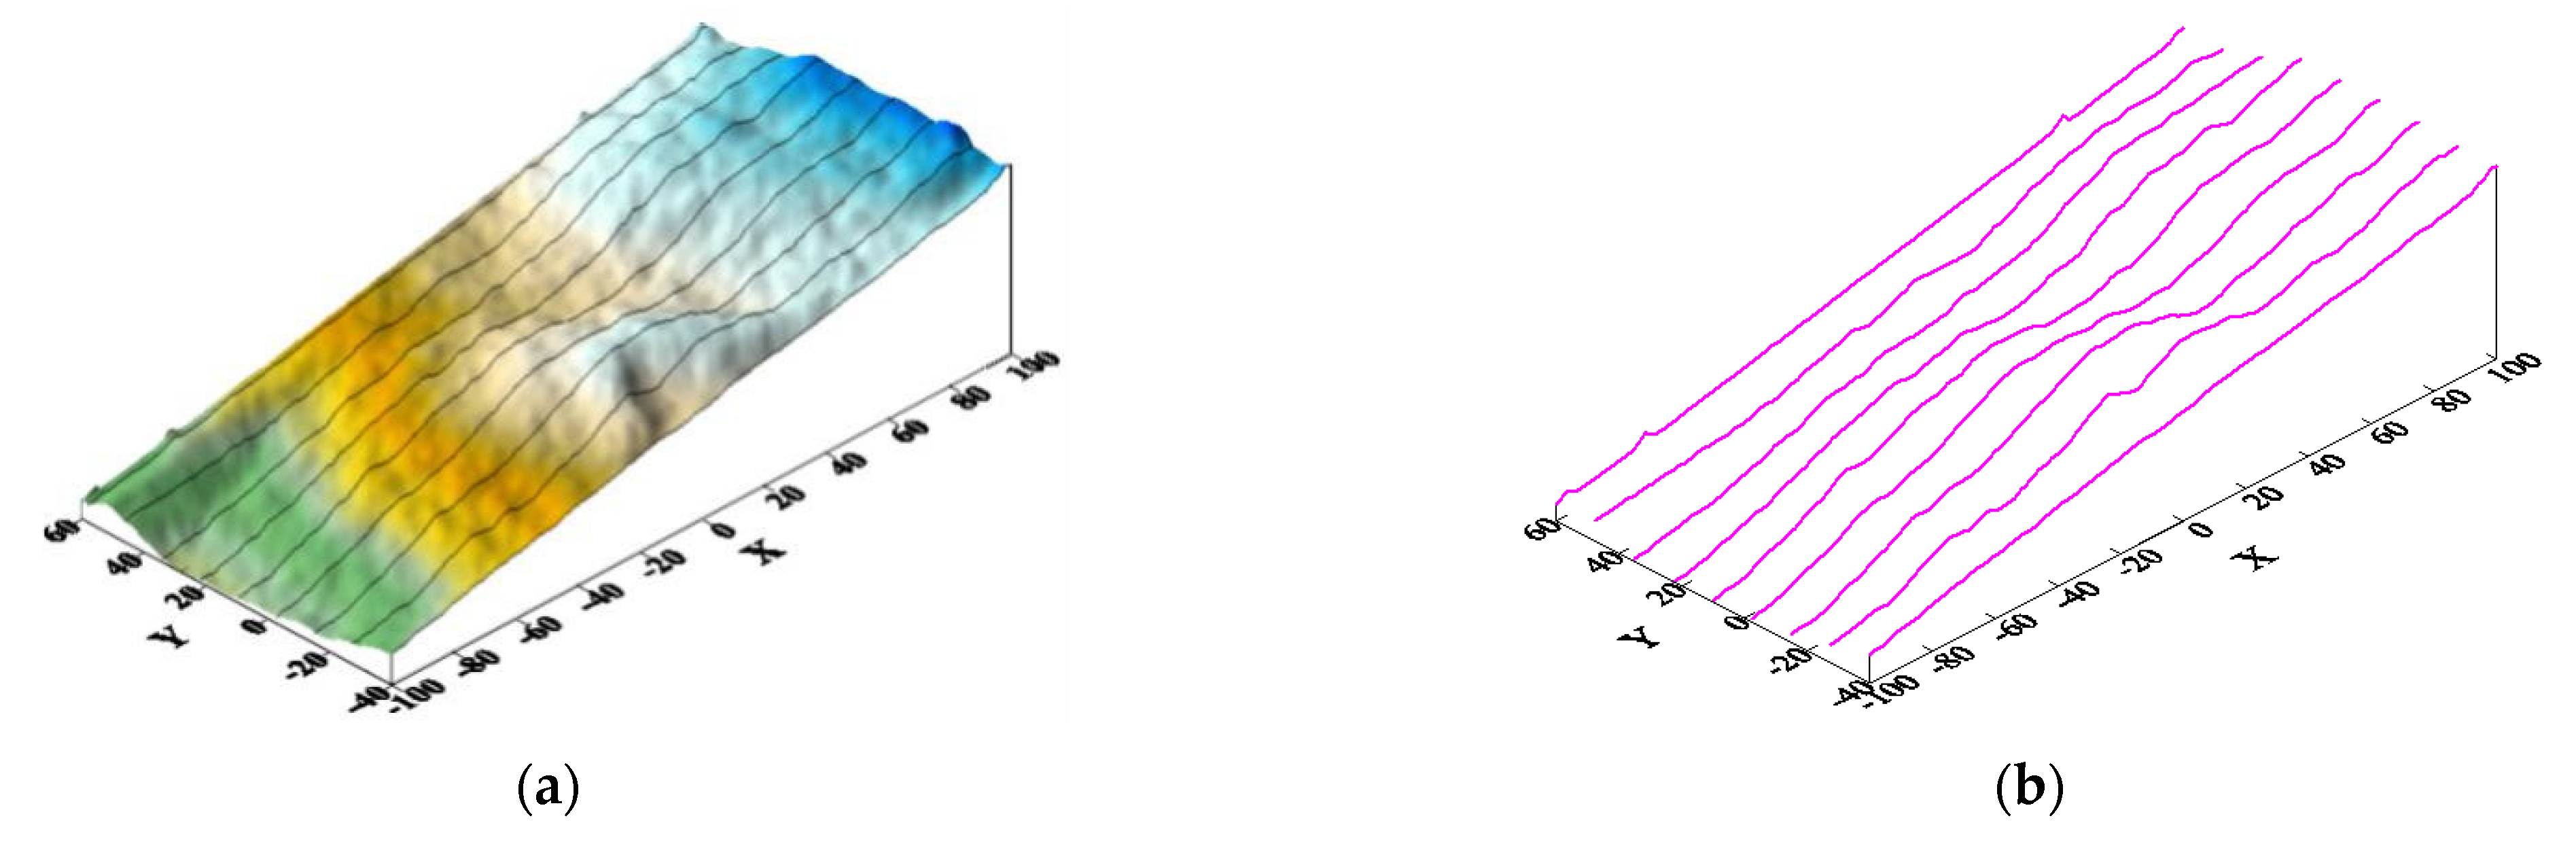
3.2.1. Roughness of the Specimens with Rough Fractures

The unevenness of the fracture surface is usually characterized by fracture roughness. It is necessary to use high-precision equipment to measure the roughness of each rock fracture sample accurately. As shown in Figure 2, the fracture surface data of rough sandstone were obtained using a high-resolution multi-functional handheld three-dimensional scanner with a scanning accuracy of 0.05 mm and a scanning distance of 0.24 mm. The 3D scanner was used to scan and visualize the fracture surface of the rough sandstone. The morphology of the fracture surface of the rough sandstone was obtained, and the morphology of the sandstone fracture surface is shown in Figure 3.
The joint roughness coefficient (JRC) proposed by Barton and Choubey [41] is a dimensionless factor ranging from 0 to 20, which represents the roughness of a rough fracture surface [42]. The fracture surface should be first divided into equally-spaced profiles with 5 mm spacing parallel to the direction of fluid seepage, as shown in Figure 4. The fracture surface was divided into nine equally spaced two-dimensional profiles. Secondly, Equation (9a,b) was used to calculate the JRC values of the nine two-dimensional profiles. Finally, the JRC values were obtained by taking the average JRC values of the nine profiles. The JRC values of each two-dimensional profile was calculated according to the following empirical equation [43]:
JRC = 32.2 + 32.47 lgz 2
Z 2 = [ 1 M ( z i 1 z i x i 1 x i ) 2 ] 1 / 2
where z 2 is a dimensionless parameter, which is defined as the root mean square deviation of the two-dimensional profile. x i and z i denote the coordinates of a profile. M represents the number of sample points along the fracture length. The estimated JRC values of eight sandstone specimens were calculated using Equation (9a), and their sizes were 11.70, 13.20, 14.35, 14.86, 17.12, 17.23, 18.97, and 19.65, respectively. The fracture samples with JRC values greater than 10 were closer to the fractures in natural rock mass [44].

3.2.2. Tortuosity of the Specimens with Rough Fractures

The fluid seepage path is tortuous in rough rock fractures. In hydromechanics, the tortuous fluid seepage path is usually characterized by tortuosity. The expression of tortuosity is as follows [45,46]:
τ = L a L
where L a [ L ] is the effective length of the actual fracture path. L [ L ] is the fracture length. In the experiment, the effective size of the actual fracture path L a [ L ] is calculated according to the following expression [47,48]:
L a = i = 1 N 1 ( x i + 1 x i ) 2 + ( y i + 1 y i ) 2 + ( z i + 1 z i ) 2
where ( x i , y i , z i ) and ( x i + 1 , y i + 1 , z i + 1 ) are the three-dimensional coordinate points of the fracture in the seepage path, and N is the number of selected points on the seepage path.
According to Equation (10), the tortuosity values of eight rough fractures were calculated, and their sizes were 1.068, 1.077, 1.096, 1.131, 1.143, 1.168, and 1.182, respectively. When the tortuosity of the fracture was 1, the fracture was smooth and parallel.

3.3. Procedure and Scheme of Hydraulic Experiment

3.3.1. Testing Equipment and Process

To test the seepage behavior of the fluid in the fracture channel, a set of fracture seepage testing equipment was designed under the action of hydraulic pressure and normal pressure. The testing equipment comprised five units—the hydraulic pressure supply unit, the normal stress loading unit, the sample seepage box unit, the collection and measurement unit, and the data acquisition unit. The hydraulic pressure supply unit mainly pumped water to the sample seepage box unit through a pressure pump, which prevented back pumping and supplied a stable hydraulic pressure to ensure that the experiment operated continuously. The normal stress loading unit mainly imposed normal pressure perpendicular to the direction of fracture seepage on the fracture sample. The sample seepage box unit was used to place and seal the fracture sample to ensure that water could only flow through the rough fracture channel. The collection and measurement unit was primarily used to collect and measure the seepage flow from the fracture. The data acquisition unit was used to manage the changes in fracture aperture, seepage flow, normal pressure, hydraulic pressure, and differential water pressure in fluid seepage.
Figure 5 shows a working principle diagram of the fracture seepage testing system. Before the fluid seepage experiment, the sealed rough fracture samples were put into the seepage box. The normal stress loading unit and the hydraulic supply unit provided hydraulic pressure and normal pressure to the rough fracture samples. In the fracture seepage tests with different roughness, the fluid seepage flow and the change in differential hydraulic pressure were measured by means of the measuring unit and the data acquisition unit. The displacement detector installed on the loading unit monitored the change in the fracture aperture under the joint action of normal pressure and hydraulic pressure in real time.

3.3.2. Test Scheme

The specific scheme of the fluid seepage test in rough fractures is shown in Table 3. Six groups of seepage tests were carried out in each rough fracture. In each group of tests, the seepage flow and hydraulic pressure were measured. The influence of the roughness and tortuosity on the seepage behavior was studied through the change in the seepage flow. The flow tests were conducted at room temperature at 25 °C, and the injected purified water was assumed to be incompressible. The density and the dynamic viscosity of water were ρ = 0.997 × 10 3 kg / m 3 and μ = 0.891 × 10 3   Pa s , respectively.

4. Results

4.1. Relationship between JRC and Seepage Flow Q

Figure 6 shows the relationship between the JRC and the seepage flow Q under different hydraulic pressure and normal pressure values. The normal pressure, the hydraulic pressure, and the roughness of the fractures affected the change in the seepage flow in the rough fractures. According to the changes of the curve, it was found that:
(I)
Under the same hydraulic pressure and normal pressure, the fluid seepage flow decreased with the increase in the JRC. The larger the JRC was, the more uneven the rough fracture was. When the fluid passed through the fracture channels, more energy was needed to overcome the seepage resistance caused by the fracture roughness, which led to a decrease in fluid seepage flow.
(II)
Under the condition of constant normal pressure and JRC, the seepage flow of the fluid increased with the increase in hydraulic pressure. The greater the hydraulic pressure, the greater the energy of the fluid in the fracture channel. More fluid flowed through the fracture channel.
(III)
In the case of constant hydraulic pressure and JRC, the seepage flow of the fluid decreased with the increase in normal stress. As shown in Figure 6, when the JRC was 11.70, and the hydraulic pressure was 0.6 MPa, the seepage flow of the fracture decreased from 2.6 × 10⁻⁶ to 8 × 10⁻⁶ m 3 / s with the increase in normal pressure.
Figure 6. Relationship between joint roughness coefficient and seepage flow under different normal pressure and water pressure values. (a) Normal stress = 0.10 MPa, (b) Normal stress = 0.15 MPa, (c) Normal stress = 0.20 MPa, (d) Normal stress = 0.25 MPa, (e) Normal stress = 0.30 MPa, (f) Normal stress = 0.40 MPa.
Applsci 12 07661 g006
Based on the above analysis, the nonlinear relationship between the JRC value and the seepage flow was affected by hydraulic pressure and normal pressure. With the increase in JRC, fluid seepage flow decreased under the different normal pressure and hydraulic pressure, and the amplitude of the decrease was different. Table 4 shows the rate of the decline in fluid seepage flow under different hydraulic pressures and normal pressures. The rate of decline in fluid seepage flow decreased with the increase in hydraulic pressure, whereas the rate of decline in fluid seepage flow increased with the increase in normal pressure. The greater the normal pressure on the rough fracture, the greater the rate decrease in the fluid seepage flow, indicating that the greater the rate of decrease in the fluid seepage flow, the more pronounced was the influence of normal pressure on fluid seepage flow.

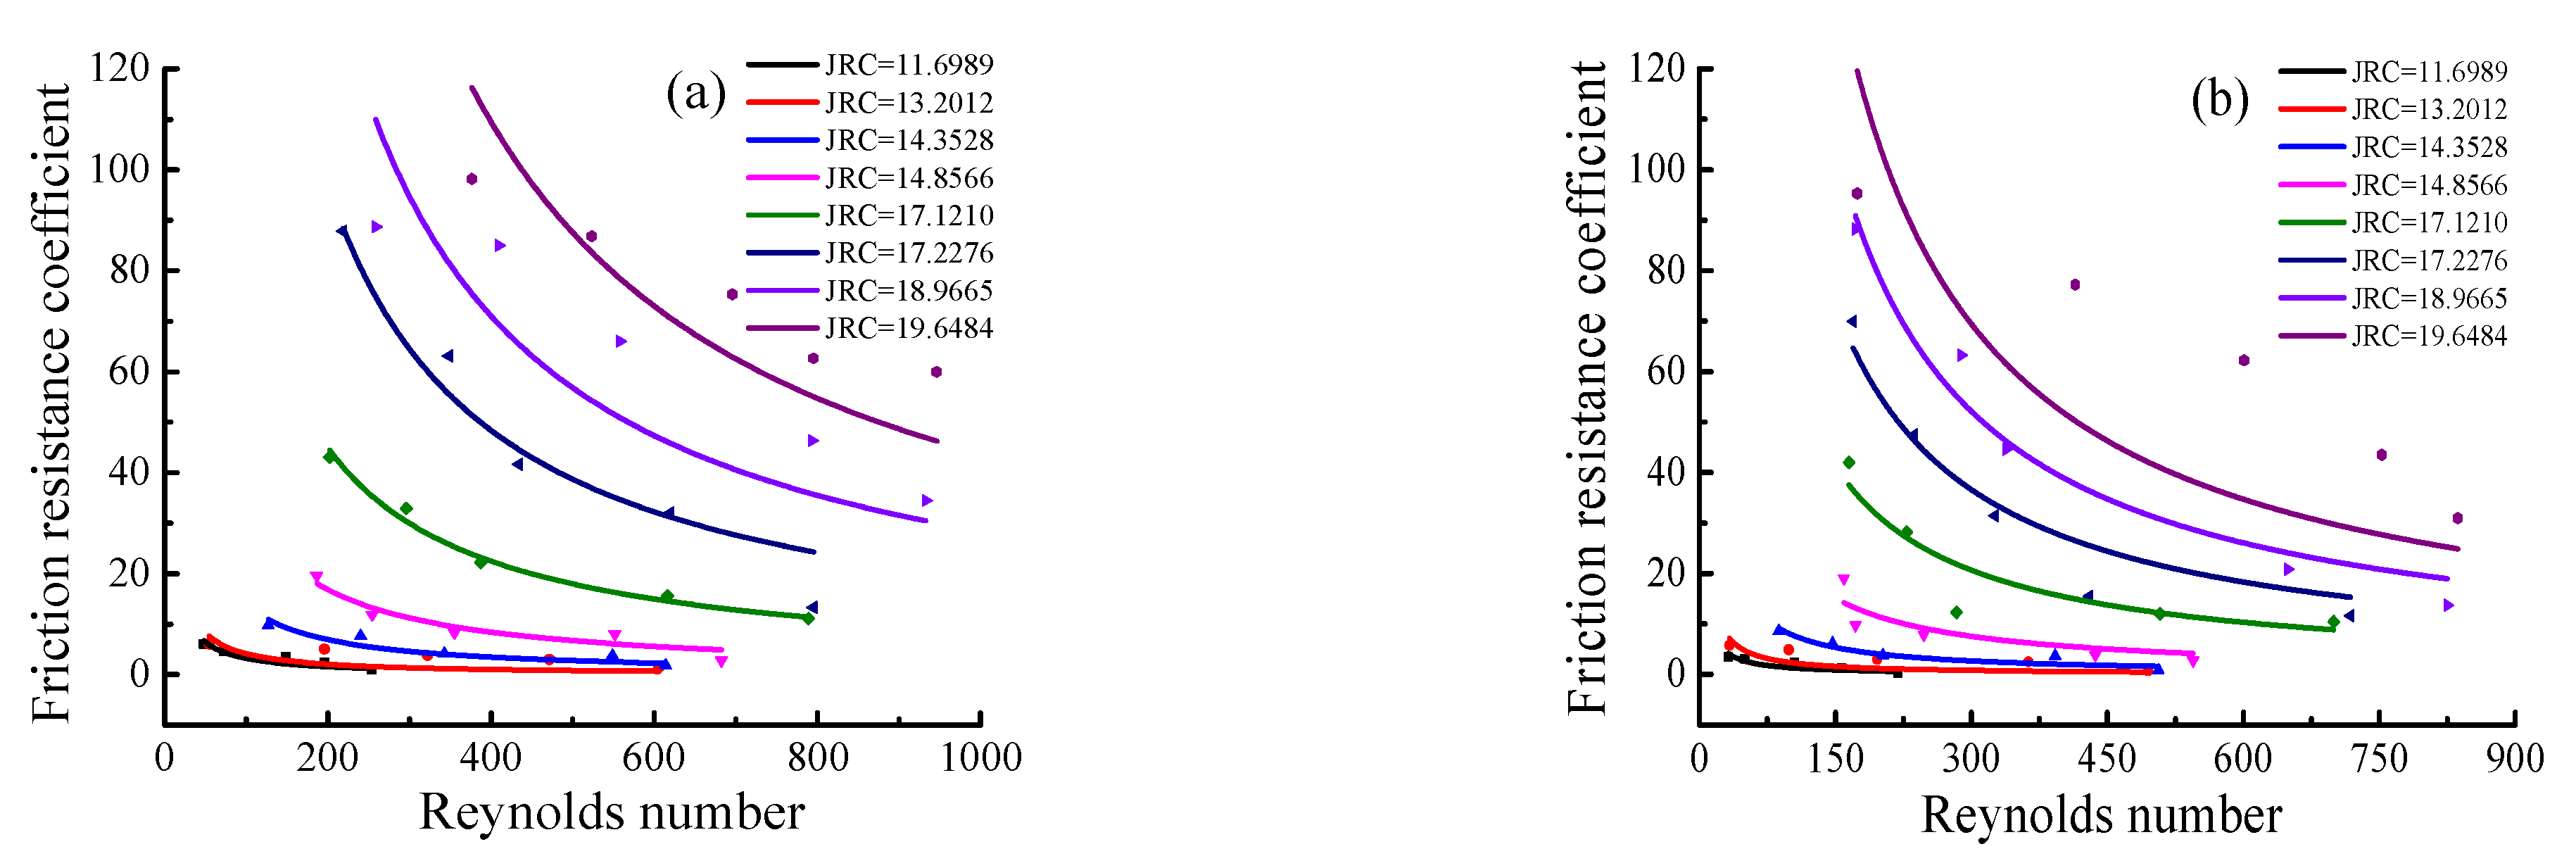
4.2. Relation between Friction Resistance Coefficient and Reynolds Number

Figure 7 shows the relationship between the friction resistance coefficient and the Reynolds number. It can be seen from the scattered points in the figure that the friction resistance coefficient decreased with the increase in the Reynolds number under the normal pressure of 0.1 to 0.4 MPa. In this study, according to the frictional resistance coefficient model shown in Table 1 and Equation (5), the frictional resistance coefficient was inversely proportional to the Reynolds number. The scattered data were fitted with the inverse proportional function.
It can be seen from the fitted curve in Figure 7 that the Reynolds number and frictional coefficient of the fluid were different under conditions with the same hydraulic pressure and normal pressure. The fracture roughness affected the relationship between the frictional resistance coefficient and the Reynolds number. When the JRC of the fracture was 11.69, the roughness of the fracture was relatively tiny. The Reynolds number changed in a small range, between 10 and 300, and the frictional resistance coefficient of the fluid was also slight, between 0 and 10. When the JRC was 19.64, the roughness of the fracture was relatively large. The Reynolds number varied widely between 200 and 1000, and the frictional resistance coefficient of the fluid also varied significantly between 10 and 100.
To quantitatively analyze the influence of fracture roughness on the relationship between the Reynolds number and the friction resistance coefficient, the relationship curve between the friction resistance coefficient, the Reynolds number, and roughness was established. Figure 8 shows the fitting curve between the JRC and Re f / 96 under the normal pressure of 0.1 to 0.4 MPa. The relationship between Re f / 96 and JRC is demonstrated in Attachment 1. Re f / 96 increased non-linearly with the increase in JRC. When the JRC was less than 14.86, the range of Re f / 96 values varied slightly between 0 and 30. The fitted curve was parallel to the abscissa and formed an approximately straight line. When the JRC was greater than 14.86, Re f / 96 was affected by normal pressure, and the fitting curve deviated from the straight line with the increase in JRC. The smaller the normal pressure, the greater the degree of deviation of the fitting curve.
According to the fitting curve in Figure 8, the frictional resistance coefficient model of the fluid considering the fracture roughness is obtained as follows:
f = 96 Re [ 1 + a ( JRC ) b ]
where f is the friction resistance coefficient. Re is the Reynolds number. JRC is the joint roughness coefficient. The coefficients a and b are fitting parameters, respectively, which are related to the normal pressure on the rough fracture. Table 5 shows the variation of the fitting parameters and fitting coefficients of the fitting curve. Based on the analysis of the fitting coefficients and fitting parameters presented in Table 5, Equation (12) displays a good fit with the relationship between Re f / 96 and JRC. The fitting coefficient R2 was between 0.96 and 0.97. The fitting parameter a decreased with the increase in normal pressure, whereas the fitting parameter b increased with the increase in normal pressure.
For the above analysis, we took the JRC as a parameter. The variation curve of the friction resistance coefficient with the Reynolds number was studied to reveal the fluid seepage characteristics in rough fractures. The calculation of friction resistance coefficient based on the roughness coefficient and the Reynolds number provided a reliable experimental basis for analyzing the decrease in the fluid flow rate and the increase in head loss in rough rock fractures.

4.3. Relation between Tortuous Resistance Coefficient and Reynolds Number

Figure 9 shows the relationship between the tortuous resistance coefficient and the Reynolds number with different tortuosity. The tortuous resistance coefficient decreases with the increase in the Reynolds number under normal pressures of 0.10 MPa to 0.40 MPa. The relationship between the Reynolds number and the tortuous resistance coefficient varied with the change in the tortuosity. The tortuosity affected the relationship between the tortuous resistance coefficient and the Reynolds number. When the tortuosity of the rough fracture was less than 1.109, the Reynolds number varied from 10 to 700. In the range of 10–700, the tortuous resistance coefficient decreased first and became stable with the increase in the Reynolds number. The tortuous resistance coefficient fell on a straight line parallel to the abscissa. When the tortuosity of the rough fracture was greater than 1.109, the Reynolds number changed within the range of 100–1000. In this range, the tortuous resistance coefficient decreased with the increase in the Reynolds number. The tortuous resistance coefficient of the fluid decreased with the increase of in Reynolds number and was generally reduced significantly.
The relationship between the tortuous resistance coefficient and the Reynolds number indicated that the influence of the tortuosity of seepage path on the fluid seepage process cannot be ignored. The tortuosity was introduced into Equation (8) to show the effect of the tortuosity of the rough fracture on fluid seepage behavior. The expression was obtained as follows:
λ = τ τ 1 f
where τ is the tortuosity of the rough fracture and f is the friction resistance coefficient. Equation (13) establishes the relationship among the tortuosity, the frictional resistance coefficient, and the tortuous resistance coefficient. The tortuous resistance coefficient can be calculated based on the frictional resistance coefficient and the tortuosity. The tortuous resistance coefficient model of the fluid considering fracture tortuosity was also obtained:
λ = τ τ 1 96 Re [ 1 + a ( JRC ) b ]
For the rough fractured channel, when the fluid encounters protrusions and obstacles on its seepage path, or when the contact area of the seepage path changes sharply, a vortex form and tortuous resistance are generated. According to the Bernoulli equation [49,50,51], fluid in the vortex region causes a decrease in seepage flow and an increase in head loss. In the above analysis, the variation curve of the tortuous resistance coefficient and the Reynolds number reveals the influence of tortuosity on the fluid seepage. The tortuous resistance coefficient model provides a reliable experimental basis for analyzing the loss of fluid seepage flow in the local scope of the seepage path. The tortuous resistance coefficient model can reflect the influence of the tortuosity of a rough fracture on the seepage flow and the local head loss.

4.4. Modification of Friction Resistance Coefficient

The Reynolds number, the friction resistance coefficient, and the tortuous resistance coefficient of the fluid varied in the fractures with different roughness and tortuosity values. Table 6 shows the changes in the Reynolds number, friction resistance coefficient, and tortuous resistance coefficient with different roughness and tortuosity under different normal pressures. With the increase of fracture roughness and tortuosity, the frictional resistance coefficient and tortuous resistance coefficient increased. With the increase in normal pressure, the friction resistance coefficient and tortuous resistance coefficient of the fluid decreased. Under different normal pressures, with the increase in the Reynolds number, the frictional resistance coefficient and tortuous resistance coefficient of the fluid increased.
With a change in normal pressure and the Reynolds number, the changes in the fracture roughness coefficient and tortuous resistance coefficient were consistent. There is no essential difference in the physical action inside the fluid. Considering the different external factors of head loss, the frictional resistance coefficient and the tortuous resistance coefficient were considered, respectively. The frictional resistance coefficient considering the roughness and the tortuous resistance coefficient considering the tortuosity can be superimposed. Therefore, the modified frictional resistance coefficient model is proposed in combination with Equations (12) and (14). The modified equation is:
f 0 = f + λ = 96 Re 2 τ 1 τ 1 [ 1 + a ( JRC ) b ]
where f 0 is the modified frictional resistance coefficient. f is the frictional resistance coefficient. λ is the tortuous resistance coefficient. Re is the Reynolds number. JRC is the joint roughness coefficient. τ is the fracture tortuosity.
The modified equation shows that the frictional resistance coefficient is related to the Reynolds number, the tortuosity, and the roughness. Compared with the model of the frictional resistance coefficient shown in Table 1, in regard to the frictional resistance coefficient of the correction model, we have introduced the tortuosity and roughness coefficients into the frictional resistance coefficient equation. Considering the frictional head loss and the regional head loss of the fluid, the modified model clearly shows a decrease in fluid seepage and an increase in head loss. In addition, the modified model was obtained under the action of normal pressure and water pressure on the fracture, which is closer to the actual environment of fractures.

5. Discussion

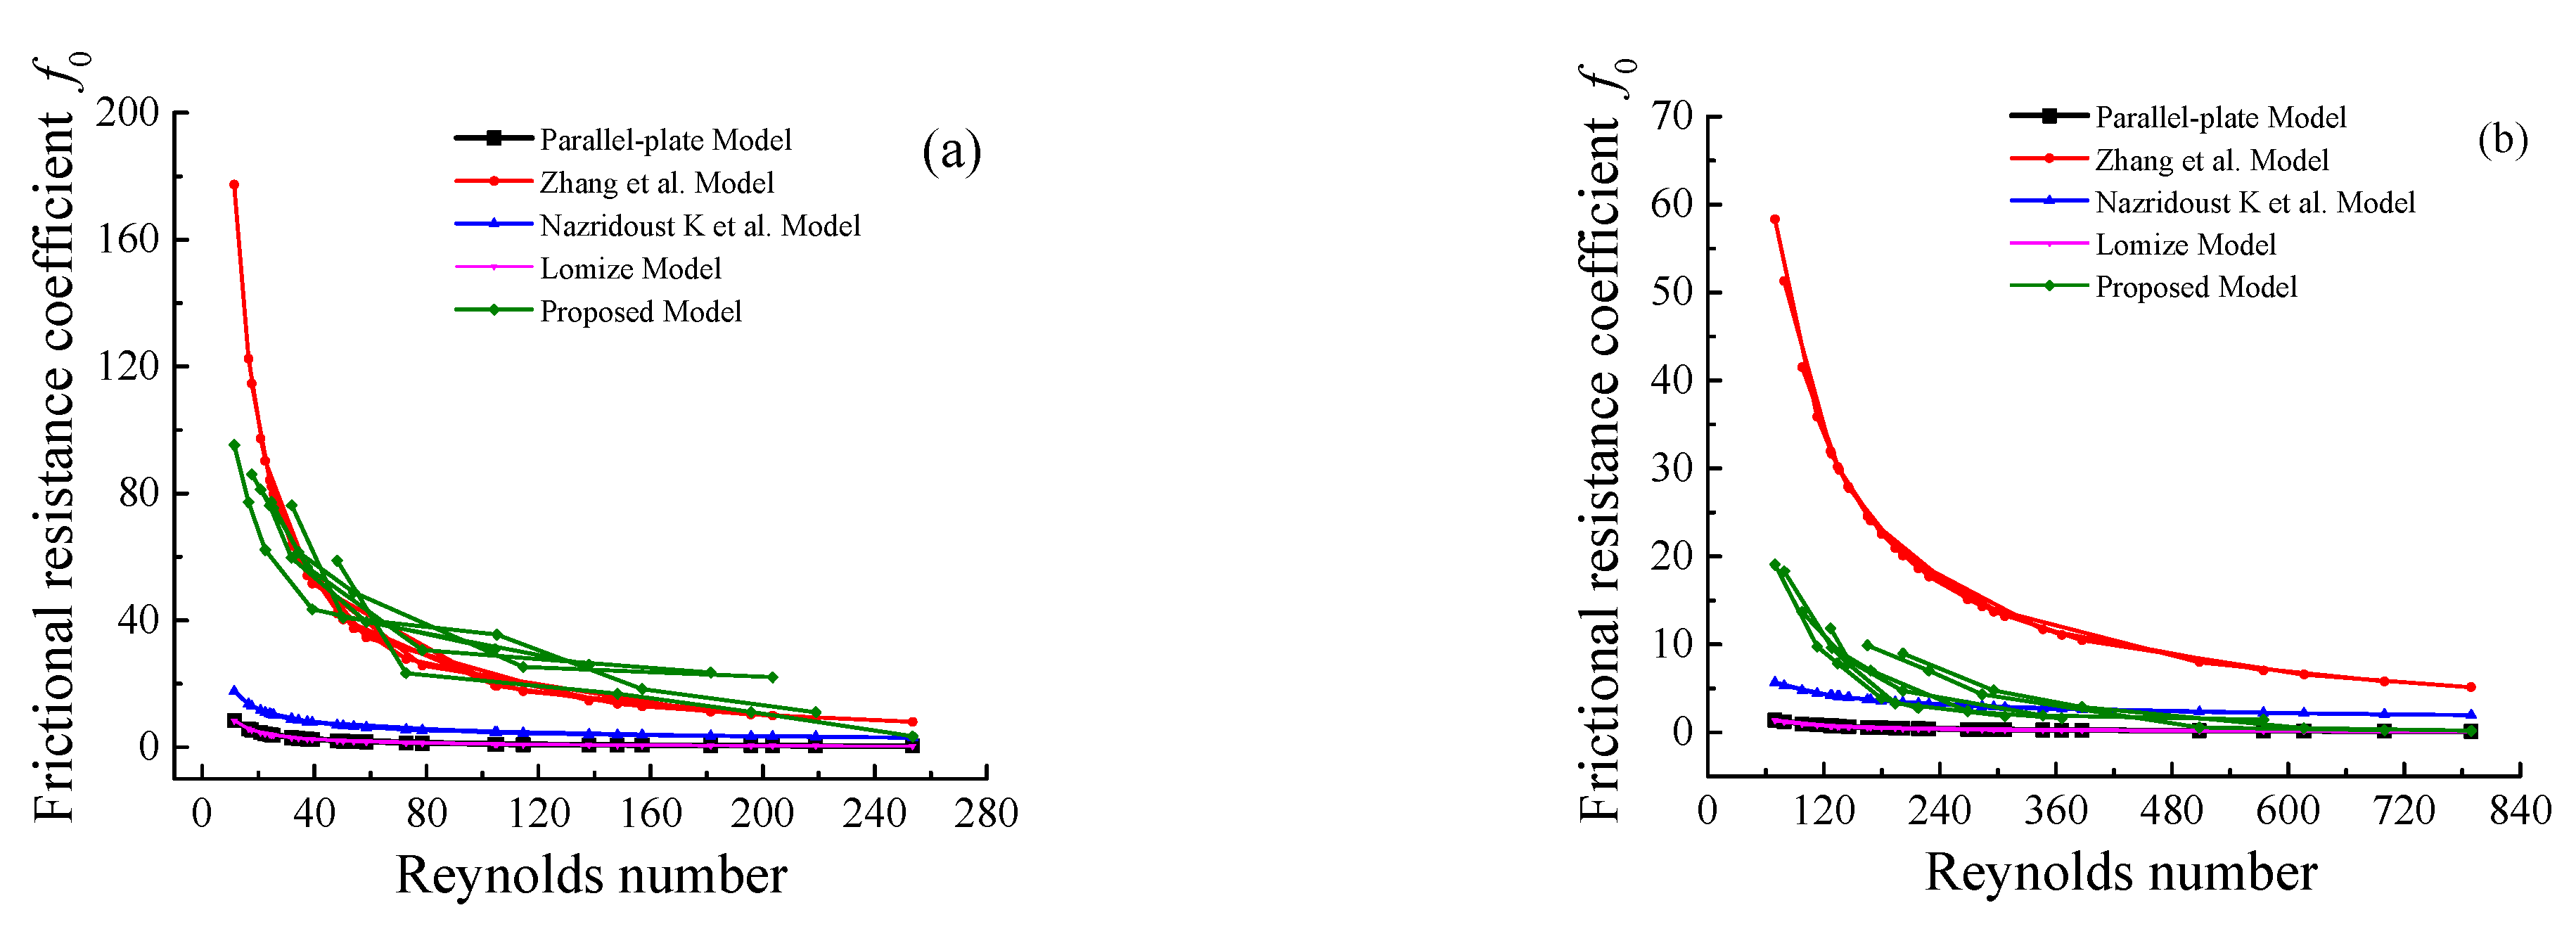
5.1. Frictional Resistance Coefficient Model of Validation

In the process of a fluid flowing along a rough fracture, on the one hand, the roughness of the fracture affects the relationship between the frictional resistance coefficient and the Reynolds number. On the other hand, the tortuosity of the fracture affects the relationship between the tortuous resistance coefficient and the Reynolds number. When the fluid flows through the rough fracture, the frictional resistance between the fluid and the rough fracture wall prevent the flow of the fluid, which reduce the seepage flow and increase the head loss [52]. Therefore, to further explore the specific reasons for the decrease in fluid flow and the increase in head loss, the relationship among the frictional resistance coefficient, the Reynolds number, and fracture roughness and tortuosity was established in relation to a fluid flowing through rough fractures.
To verify the rationality of the revised frictional resistance coefficient model, the revised model was compared with the different frictional resistance coefficient models presented in Table 1. The frictional resistance coefficient and the Reynolds number were calculated using experimental data. The modified frictional resistance coefficient model and the frictional resistance coefficient models in Table 1 were compared and analyzed. The results are shown in Figure 10.
Figure 10 indicates that the modified frictional resistance coefficient model showed the same variation trend as the frictional resistance coefficient model in Table 1. The calculated modified friction resistance coefficient was consistent with the size of the friction resistance coefficient and matched well with the friction resistance coefficient model in Table 1. However, for different normal pressures, there were differences between the modified frictional resistance coefficient model and the model in Table 1. When the normal stress was 0.10 MPa, the modified frictional resistance coefficient model matched the model proposed by Zhang. When the normal pressure was 0.40 MPa, the modified frictional resistance coefficient model corresponded to the model proposed by Nazridoust K. The modified frictional resistance coefficient model was affected by normal stress. Normal stress affected the change in the aperture of the roughness fracture, and mainly affected the change of parameters a , b , which corresponds to the modified friction coefficient model. The curves of the parallel-plate model and the Lomize model were flat with little variation in their trends and were not affected by the normal stress. With the increase in the Reynolds number, the frictional resistance coefficient hardly changed, and the frictional resistance coefficient was also small, close to 0.
Compared with the frictional resistance coefficient models presented in Table 1, the modified frictional resistance coefficient was clearly able to express the influence of the roughness and tortuosity of the fracture on the fluid seepage resistance. The modified model can accurately show the effect of fracture roughness and tortuosity on fluid flow behavior, and reasonably reveal the reasons for a decrease in seepage flow. The seepage behavior was comprehensively analyzed by thoroughly considering on-way resistance and local resistance. The modified model was obtained under the action of water pressure and normal pressure, and can thus be applied to analyze the seepage behavior of fractured rock under normal pressure. The modified model was closer to practical applications and more in line with the external environment of the fracture.

5.2. Analysis of Head Loss

The greater the roughness and tortuosity of the rough fracture, the more complicated the flow path. The increase in seepage resistance led to a significant increase in head loss. The head loss, as a function of seepage flow, can fully show the influence of fracture roughness and tortuosity on fluid seepage behavior. According to the Darcy–Weisbach equation and Darcy’s law, Equation (15) can be substituted into the Darcy–Weisbach equation to obtain the total head loss of the fluid in the seepage process based on the modified frictional resistance coefficient model:
Δ P = f 0 L 2 e ρ ν 2 2 = 2 τ 1 τ 1 f L 2 e ρ ν 2 2
where f is the frictional resistance coefficient. τ is the fracture tortuosity. L [ L ] is the fracture length. e [ L ] is the fracture aperture. Δ P [ M L 1 T 2 ] is the head loss of the fluid. ρ [ M L 3 ] is the fluid density. ν [ L T 1 ] is the average velocity of the fluid.
Equation (16) shows that the main factors that cause the total head loss of a fluid in rough fractures are as follows: 2 τ 1 / τ 1 represents the local head loss caused by the tortuousness of the seepage path, f represents the frictional head loss caused by the roughness of the fracture, L / 2 e represents the ratio of the length of the fracture channel to the aperture of the fracture, and ρ v 2 / 2 represents the kinetic energy of the fluid.
Equation (16) was used to calculate the total head loss of the fluid in the rough fracture based on the modified frictional resistance coefficient model. Using Equation (16), the total head loss caused by fracture roughness and tortuosity was clarified, and the reason for the decrease in the fluid’s flow rate in the process of fluid seepage was explained more accurately. The fluid seepage behavior in the rough fracture can thus be analyzed more comprehensively.
The model of Equation (16) enables us to fully understand the reasons for the decrease in the fluid flow rate and the increase in head loss from the perspective of roughness and tortuosity, which provides a reference for the numerical simulation of nonlinear seepage of compressed rock under different flow conditions.

6. Conclusions

The roughness and tortuosity of rough fractures affect the seepage behavior of fluids in the rock mass. In this study, the influence of fracture roughness and tortuosity on seepage flow was studied through fluid seepage tests under load conditions. By analyzing the relationship between the friction resistance coefficient, the tortuous resistance coefficient, and the Reynolds number, a frictional resistance coefficient model considering fracture roughness and tortuosity was established, which can be used to more accurately analyze the head loss in the fluid seepage process. The conclusions were as follows.
(I)
Normal pressure, hydraulic pressure, and fracture roughness affected the seepage behavior of the fluid in the rough fracture. The seepage flow of the fluid decreased with the increase in normal pressure, while increasing with the increase in hydraulic pressure. Under constant hydraulic pressure and normal pressure, the seepage flow of a fluid decreased with the increase in fracture roughness, and showed a trend of a nonlinear decrease. The greater the decreased range of fluid seepage flow, the more pronounced was the influence of normal pressure on the fluid seepage flow.
(II)
For rough fractures under normal pressure, the frictional resistance coefficient decreased with the increase in the Reynolds number. The roughness of the fracture affected the relationship between the frictional resistance coefficient and the Reynolds number. The relationship among the friction resistance coefficient, the Reynolds number, and the roughness was established. The calculation of the friction resistance coefficient based on the roughness coefficient and the Reynolds number provided a reliable experimental basis for analyzing the decrease in seepage flow.
(III)
The influence of the tortuosity of the rough fracture seepage path on fluid seepage behavior cannot be ignored. Under normal pressure conditions, the tortuous resistance coefficient of a rough fracture decreased with the increase in the Reynolds number. The tortuosity of rough fractures affected the relationship between the tortuous resistance coefficient and the Reynolds number. The relationship among the tortuosity, the frictional resistance coefficient, and the tortuous resistance coefficient was thus established. The tortuous resistance coefficient model considering fracture tortuosity can be used to analyze seepage flow loss in the local range of the seepage paths.
(IV)
The existing frictional resistance coefficient model was modified, considering the frictional resistance and local resistance of fluid seepage. The modified frictional resistance coefficient model, considering the tortuosity and roughness, was thus established. Experimental data were applied to the modified model and the existing model to verify its rationality. The modified model was closer to the results of the practical application and more in line with the external environment of the fracture. The total head loss of the fluid was obtained based on the modified friction coefficient model. The influence of fracture roughness and tortuosity on fluid seepage behavior can be researched in more detail and more accurately by analyzing the changes in fluid seepage flow and head loss.

Author Contributions

Conceptualization, Y.X. and Y.Z.; methodology, Q.Y.; software, L.W.; writing—original draft preparation, S.W. All authors have read and agreed to the published version of the manuscript.

Funding

This work was financially supported by the National Natural Science Foundation of China, grant number (51574060 and 51774138), and the Fundamental Scientific Research Business Expenses of the Colleges and Universities in Hebei Province, grant number (JQN2020039), and the Tangshan Science and Technology Project (19130216g). The authors are grateful to all study participants.

Institutional Review Board Statement

Not applicable.

Informed Consent Statement

Informed consent was obtained from all subjects involved in the study.

Data Availability Statement

Not applicable.

Conflicts of Interest

The authors declare no conflict of interest.

Abbreviations

f the friction resistance coefficient
Re the Reynolds number
e the rough fracture aperture
ξ the height of the unevenness of rough fracture
λ the tortuous resistance coefficient
f 0 the modified frictional resistance coefficient
w the fracture width
μ the viscosity of the fluid
Q the seepage flow of the fluid
Δ P the pressure difference between the inlet and outlet of the fracture
D h the hydraulic diameter, equal to two times that of the fracture aperture e
ρ the fluid density
ν the average velocity of the fluid
Δ P f the frictional head loss
Δ P j the regional head loss
L the fracture length
L a the effective length of the rough fracture seepage path
L 0 the equivalent length of the rough fracture, L 0 = L a L
JRC the joint roughness coefficient
τ the fracture tortuosity

Appendix A

The frictional resistance coefficient has been widely used to describe the head losses of fluid in pipes or fractures. In this study, according to the frictional resistance coefficient models proposed by researchers (shown in Table 1), it can be observed that the frictional resistance coefficient is inversely proportional to the Reynolds number. Therefore, the product of the frictional resistance coefficient and the Reynolds number can be assumed to be a constant C:
Re f = C
In a smooth fracture, the frictional resistance coefficient is only related to the Reynolds number and has nothing to do with the roughness of the fracture. The product of the frictional resistance coefficient and the Reynolds number Re is a constant [49]. According to Equation (5), the constant C is 96. In rough fractures, the frictional resistance coefficient is related to the roughness of the fracture and the Reynolds number. The product of the friction resistance coefficient and the Reynolds number is not a constant value. As shown by the relation curve between the friction resistance coefficient and the Reynolds number in Figure 7, the product of the friction resistance coefficient and the Reynolds number increases with the increase in JRC. The roughness of the fracture affects the size of the constant C. Therefore, to clarify the influence of fracture roughness on the constant C, the constant C was divided by the constant 96. According to the model of the friction resistance coefficient shown in Table 1, there is a power function relationship between C/96 and roughness. That is to say, there is a power relationship between Re f / 96 and roughness.

References

  1. Wu, Z.; Fan, L.; Zhao, S. Effects of Hydraulic Gradient, Intersecting Angle, Aperture, and Fracture Length on the Nonlinearity of Fluid Flow in Smooth Intersecting Fractures: An Experimental Investigation. Geofluids 2018, 2018, 9352608. [Google Scholar] [CrossRef]
  2. Chen, B.P.; Gong, B.; Wang, S.Y.; Tang, C.A. Research on zonal disintegration characteristics and failure mechanisms of deep tun-nel in jointed rock mass with strength reduction method. Mathematics 2022, 10, 922. [Google Scholar] [CrossRef]
  3. Wang, Y.Y.; Gong, B.; Tang, C.A.; Zhao, T. Numerical study on size effect and anisotropy of columnar jointed basalts under uni-axial compression. Bull. Eng. Geol. Environ. 2022, 81, 41. [Google Scholar] [CrossRef]
  4. Louis, C. A Study of groundwater flow in jointed rock and its influence on stability of rock mass. In Imperial College Rock Mechanics Report; Imperial College of Science and Technology: London, UK, 1969. [Google Scholar]
  5. Qian, J.; Chen, Z.; Zhan, H.; Guan, H. Experimental study of the effect of roughness and Reynolds number on fluid flow in rough-walled single fractures: A check of local cubic law. Hydrol. Process. 2011, 25, 614–622. [Google Scholar] [CrossRef]
  6. Gong, B.; Wang, Y.Y.; Zhao, T.; Tang, C.A.; Yang, X.Y.; Chen, T.T. AE energy evolution during CJB fracture affected by rock hetero-geneity and column irregularity under lateral pressure. Geomat. Nat. Hazards Risk 2022, 13, 877–907. [Google Scholar] [CrossRef]
  7. Zhang, Z.; Nemcik, J. Friction Factor of Water Flow Through Rough Rock Fractures. Rock Mech. Rock Eng. 2012, 46, 1125–1134. [Google Scholar] [CrossRef]
  8. Wang, M.; Chen, Y.-F.; Ma, G.-W.; Zhou, J.-Q.; Zhou, C.-B. Influence of surface roughness on nonlinear flow behaviors in 3D self-affine rough fractures: Lattice Boltzmann simulations. Adv. Water Resour. 2016, 96, 373–388. [Google Scholar] [CrossRef]
  9. Zimmerman, R.W.; Al-Yaarubi, A.; Pain, C.C.; Grattoni, C.A. Non-linear regimes of fluid flow in rock fractures. Int. J. Rock Mech. Min. Sci. 2004, 41, 163–169. [Google Scholar]
  10. Lee, S.H.; Lee, K.K.; Yeo, I.W. Assessment of the validity of Stokes and Reynolds equations for fluid flow through a rough-walled fracture with flow imaging. Geophys. Res. Lett. 2014, 41, 4578–4585. [Google Scholar] [CrossRef]
  11. Tatone, B.S.; Grasselli, G. A new 2D discontinuity roughness parameter and its correlation with JRC. Int. J. Rock Mech. Min. Sci. 2010, 47, 1391–1400. [Google Scholar] [CrossRef]
  12. Espinoza-Andaluz, M.; Velasco-Galarza, V.; Romero-Vera, A. On hydraulic tortuosity variations due to morphological considerations in 2D porous media by using the Lattice Boltzmann method. Math. Comput. Simul. 2020, 169, 74–87. [Google Scholar] [CrossRef]
  13. Wang, F.; Cheng, H. Effect of tortuosity on the stress-dependent permeability of tight sandstones: Analytical modelling and experimentation. Mar. Pet. Geol. 2020, 120, 104524. [Google Scholar] [CrossRef]
  14. Qian, J.; Zhan, H.; Chen, Z.; Ye, H. Experimental study of solute transport under non-Darcian flow in a single fracture. J. Hydrol. 2011, 399, 246–254. [Google Scholar] [CrossRef]
  15. Duda, A.; Koza, Z.; Matyka, M. Hydraulic tortuosity in arbitrary porous media flow. Phys. Rev. E 2011, 84, 36319. [Google Scholar] [CrossRef] [PubMed] [Green Version]
  16. Murata, S.; Saito, T. Estimation of Tortuosity of Fluid Flow Through a Single Fracture. J. Can. Pet. Technol. 2003, 42, 39–45. [Google Scholar] [CrossRef]
  17. Tsang, Y.W. The Effect of Tortuosity on Fluid Flow Through a Single Fracture. Water Resour. Res. 1984, 20, 1209–1215. [Google Scholar] [CrossRef]
  18. Zhou, J.Q.; Hu, S.H.; Fang, S.; Chen, Y.F.; Zhou, C.B. Nonlinear flow behavior at low Reynolds numbers through rough-walled fractures subjected to normal compressive loading. Int. J. Rock Mech. Min. Sci. 2015, 80, 202–218. [Google Scholar] [CrossRef]
  19. Ge, S. A governing equation for fluid flow in rough fractures. Water Resour. Res. 1997, 33, 53–61. [Google Scholar] [CrossRef]
  20. Zimmerman, R.; Bodvarsson, G.S. Hydraulic conductivity of rock fractures. Transp. Porous Media 1996, 23, 1–30. [Google Scholar] [CrossRef] [Green Version]
  21. Nazridoust, K.; Ahmadi, G.; Smith, D.H. A new friction factor correlation for laminar, single-phase flows through rock fractures. J. Hydrol. 2006, 329, 315–328. [Google Scholar] [CrossRef]
  22. Amiri, L.; Ghoreishi-Madise, S.A.; Hassani, F.P.; Sasmito, A.P. Friction factor correlation for airflow through broken rocks and its applications in mine ventilation. Int. J. Min. Sci. Technol. 2020, 30, 455–462. [Google Scholar] [CrossRef]
  23. Zhang, Z.; Nemcik, J.; Qiao, Q.; Geng, X. A Model for Water Flow Through Rock Fractures Based on Friction Factor. Rock Mech. Rock Eng. 2014, 48, 559–571. [Google Scholar] [CrossRef]
  24. Chen, Z.; Qian, J.Z.; Luo, S.H.; Zhan, H.B. Experimental Study of Friction Factor for Groundwater Flow in a Single Rough Fracture. J. Hydrodyn. 2009, 21, 820–825. [Google Scholar] [CrossRef]
  25. Ohashi, K. Numerical study of roughness model effect including low-Reynolds number model and wall function method at actual ship scale. J. Mar. Sci. Technol. 2020, 26, 24–36. [Google Scholar] [CrossRef]
  26. Foroughi, S.; Jamshidi, S.; Pishvaie, M.R. New Correlative Models to Improve Prediction of Fracture Permeability and Inertial Resistance Coefficient. Transp. Porous Media 2018, 121, 557–584. [Google Scholar] [CrossRef]
  27. Liu, J.; Wang, Z.; Qiao, L.; Li, W.; Yang, J. Transition from linear to nonlinear flow in single rough fractures: Effect of fracture roughness. Appl. Hydrogeol. 2021, 29, 1343–1353. [Google Scholar] [CrossRef]
  28. Fourar, M.; Radilla, G.; Lenormand, R.; Moyne, C. On the non-linear behavior of a laminar single-phase flow through two and three-dimensional porous media. Adv. Water Resour. 2004, 27, 669–677. [Google Scholar] [CrossRef]
  29. Yeo, I.; de Freitas, M.; Zimmerman, R. Effect of shear displacement on the aperture and permeability of a rock fracture. Int. J. Rock Mech. Min. Sci. 1998, 35, 1051–1070. [Google Scholar] [CrossRef]
  30. Zou, L.; Jing, L.; Cvetkovic, V. Modeling of flow and mixing in 3D rough-walled rock fracture intersections. Adv. Water Resour. 2017, 107, 1–9. [Google Scholar] [CrossRef]
  31. Javadi, M.; Sharifzadeh, M.; Shahriar, K.; Mitani, Y. Critical Reynolds number for nonlinear flow through rough-walled fractures: The role of shear processes. Water Resour. Res. 2014, 50, 1789–1804. [Google Scholar] [CrossRef] [Green Version]
  32. Zhang, Z.; Nemcik, J. Fluid flow regimes and nonlinear flow characteristics in deformable rock fractures. J. Hydrol. 2013, 477, 139–151. [Google Scholar] [CrossRef]
  33. Zimmerman, R.W.; Yeo, I.W. Fluid Flow in Rock Fractures: From the Navier-Stokes Equations to the Cubic Law. Geophys. Monogr. Am. Geophys. Union 2000, 122, 213–224. [Google Scholar]
  34. Dippenaar, M.A.; Rooy, J.V. On the cubic law and variably saturated flow through discrete open rough-walled discontinuities. Int. J. Rock Mech. Min. Sci. 2016, 89, 200–211. [Google Scholar] [CrossRef] [Green Version]
  35. Brown, G.O. The History of the Darcy-Weisbach Equation for Pipe Flow Resistance. Environ. Water Resour. Hist. 2002, 38, 34–43. [Google Scholar] [CrossRef] [Green Version]
  36. Chen, L.; Wang, Y.; Niu, Y. Influence of Roughness and Fracture Width on the Transition from Darcy to Non-Darcy Behavior for Flow Through Rough Single Fracture. Henan Sci. 2017, 35, 1988–1994. [Google Scholar]
  37. Zhou, J.Q.; Hu, S.H.; Chen, Y.F.; Wang, M.; Zhou, C.B. The Friction Factor in the Forchheimer Equation for Rock Fractures. Rock Mech. Rock Eng. 2016, 49, 3055–3068. [Google Scholar] [CrossRef]
  38. Chen, Z.; Qian, J.; Zhan, H.; Zhou, Z.; Wang, J.; Tan, Y. Effect of roughness on water flow through a synthetic single rough frac-ture. Environ. Earth Sci. 2017, 76, 186. [Google Scholar] [CrossRef]
  39. Yu, L.; Liu, R.; Jiang, Y. A Review of Critical Conditions for the Onset of Nonlinear Fluid Flow in Rock Fracture. Geofluids 2017, 2017, 2176932. [Google Scholar] [CrossRef] [Green Version]
  40. Huang, Y.; Zhang, Y.; Yu, Z.; Ma, Y.; Zhang, C. Experimental investigation of seepage and heat transfer in rough fractures for enhanced geothermal systems. Renew. Energy 2019, 135, 846–855. [Google Scholar] [CrossRef]
  41. Barton, N.R.; Choubey, V. The shear strength of rock joints in theory and practice. Rock Mech. 1977, 10, 1–54. [Google Scholar] [CrossRef]
  42. Huan, J.Y.; He, M.M.; Zhang, Z.Q.; Li, N. A New Method to Estimate the Joint Roughness Coefficient by Back Calculation of Shear Strength. Adv. Civ. Eng. 2019, 2019, 7897529. [Google Scholar] [CrossRef] [Green Version]
  43. Tse, R. Estimating joint roughness coefficients. Int. J. Rock Mech. Min. Sci. Geomech. Abstr. 1979, 16, 303–307. [Google Scholar] [CrossRef]
  44. Ji, S.-H.; Park, B.-H.; Park, K.-W. Distortion of the Estimated Hydraulic Conductivity from a Hydraulic Test in Fractured Rock Due to Excessive Injection or Extraction. Water 2020, 12, 2712. [Google Scholar] [CrossRef]
  45. Brown, S.; Caprihan, A.; Hardy, R. Experimental observation of fluid flow channels in a single fracture. J. Geophys. Res. B 1998, 103, 5125–5132. [Google Scholar] [CrossRef]
  46. Crandall, D.; Bromhal, G.; Karpyn, Z.T. Numerical simulations examining the relationship between wall-roughness and fluid flow in rock fractures. Int. J. Rock Mech. Min. Sci. 2010, 47, 784–796. [Google Scholar] [CrossRef]
  47. Moldrup, P.; Olesen, T.; Komatsu, T.; Schjønning, P.; Rolston, D. Tortuosity, Diffusivity, and Permeability in the Soil Liquid and Gaseous Phases. Soil Sci. Soc. Am. J. 2001, 65, 613–623. [Google Scholar] [CrossRef]
  48. Shan, Q.L.; Zhang, R.X.; Jiang, Y.J. Complexity and tortuosity hydraulic fracture morphology due to near-wellbore non-planar propagation from perforated horizontal wells. J. Nat. Gas Sci. Eng. 2021, 89, 103884. [Google Scholar] [CrossRef]
  49. Wang, L.; Cardenas, M.B.; Slottke, D.T.; Ketcham, R.A.; Sharp, J.M., Jr. Modification of the Local Cubic Law of fracture flow for weak inertia, tortuosity, and roughness. Water Resour. Res. 2015, 51, 2064–2080. [Google Scholar] [CrossRef]
  50. Phillips, T.; Bultreys, T.; Bisdom, K.; Kampman, N.; Van Offenwert, S.; Mascini, A.; Cnudde, V.; Busch, A. A Systematic Investigation into the Control of Roughness on the Flow Properties of 3D-Printed Fractures. Water Resour. Res. 2021, 57, ewrcr-25233. [Google Scholar] [CrossRef]
  51. Maranzoni, A. Galilean-Invariant Expression for Bernoulli’s Equatio. J. Hydraul. Eng. 2020, 146, 04019061. [Google Scholar] [CrossRef]
  52. Barton, N.; Quadros, E. Joint aperture and roughness in the prediction of flow and groutability of rock masses. Int. J. Rock Mech. Min. Sci. 1997, 34, 252.e1–252.e14. [Google Scholar] [CrossRef]
Figure 1. Sandstone specimen (a) and rough fracture surface (b).
Applsci 12 07661 g001
Figure 2. Scanner.
Figure 2. Scanner.
Applsci 12 07661 g002
Figure 3. Visualized fracture surface of sandstone sample.
Applsci 12 07661 g003
Figure 4. Profile extraction (a) and calculation of JRC values (b).
Applsci 12 07661 g004
Figure 5. Fracture seepage testing system.
Applsci 12 07661 g005
Figure 7. Relationship between the Reynolds number and the frictional resistance coefficient under different normal stresses and different JRC values. (a) Normal stress = 0.10 MPa, (b) Normal stress = 0.15 MPa, (c) Normal stress = 0.20 MPa, (d) Normal stress = 0.25 MPa, (e) Normal stress = 0.30 MPa, (f) Normal stress = 0.40 MPa.
Applsci 12 07661 g007aApplsci 12 07661 g007b
Figure 8. Relationship between JRC and Re f / 96 under different normal stresses.
Applsci 12 07661 g008
Figure 9. Relation between Reynolds number and tortuous resistance coefficient at different tortuosity under different normal pressures. (a) Normal stress = 0.10 MPa, (b) Normal stress = 0.15 MPa, (c) Normal stress = 0.20 MPa, (d) Normal stress = 0.25 MPa, (e) Normal stress = 0.30 MPa, (f) Normal stress = 0.40 MPa.
Applsci 12 07661 g009
Figure 10. Comparison of the parallel-plate model, Lomize model, Nazridoust model, Zhang model, and the proposed model under different JRC values. (a) Normal pressure = 0.10 MPa, (b) Normal pressure = 0.40 MPa.
Applsci 12 07661 g010
Table 1. Different frictional resistance coefficient models.
NumberModelExpressionSeepage State
1Parallel-plate [18] f = 96 R e Laminar flow
2Zhang and Nemcik [6] f = 96 R e [ 1 + 9.57115 × 10 4 ( ξ / e ) 1.1172 ] R e < 10
3Nazridoust K, Ahmadi G, Smith DH [21] f = 123 R e ( 1 + 0.12 R e 0.687 ) R e 10
4Lomize [23] f = 96 R e [ 1 + 6 ( ξ / e ) 1.5 ] Laminar flow
Table 2. Physical and mechanical parameters of sandstone specimens.
Density (kg/cm3)Compressive Strength (MPa)Tensile Strength (MPa)Elasticity Modulus (MPa)Poisson’s Ratio
2.3232.122.858.90.31
Table 3. Test scheme of fluid seepage in rough fractures under different normal pressures and water pressures.
Normal Pressure
(MPa)
Hydraulic Pressure
(MPa)
Normal Pressure
(MPa)
Hydraulic Pressure
(MPa)
Normal Pressure
(MPa)
Hydraulic Pressure
(MPa)
0.10.20.150.20.20.2
0.30.30.3
0.40.40.4
0.50.50.5
0.60.60.6
0.250.20.30.20.40.2
0.30.30.3
0.40.40.4
0.50.50.5
0.60.60.6
Table 4. Rate of decline in seepage flow under different water pressure and normal pressure conditions.
Hydraulic Pressure (MPa)Normal Pressure (MPa)
0.100.150.200.250.300.40
0.200.880.890.900.910.940.95
0.300.780.810.860.900.930.95
0.400.760.800.840.900.930.94
0.500.760.770.820.880.930.93
0.600.730.770.810.850.910.92
Table 5. Fitting parameters a , b and fitting coefficient R2 of the JRC and Re f / 96 curve.
Normal Stress (MPa) Parameter   a   ( × 10 13 ) Parameter   b Fitting Coefficient R2
0.10450,0007.490.96
0.1516,9008.830.96
0.2033909.030.96
0.2554810.360.96
0.301410.770.97
0.401.4311.410.96
Table 6. Changes in the Reynolds number, friction resistance coefficient, and tortuous resistance coefficient in rough fracture.
Joint Roughness Coefficient JRC Tortuosity   τ Normal Stress = 0.10 MPaNormal Stress = 0.20 MPaNormal Stress = 0.30 MPa
Re f λ Re f λ Re f λ
11.691.06148.163.500.1354.041.100.0731.870.280.02
13.201.07322.183.790.1775.631.950.1438.920.360.03
14.351.09342.734.110.39138.263.540.3486.942.130.18
14.851.10355.148.350.88191.327.820.6393.274.740.60
17.121.13387.1522.222.39201.6911.111.90145.2110.020.98
17.221.14434.2541.644.55249.7528.082.97171.1916.992.15
18.961.16557.5666.046.56251.9838.874.40233.7726.262.97
19.641.18695.9475.289.02483.5459.764.65254.1348.896.16
Publisher’s Note: MDPI stays neutral with regard to jurisdictional claims in published maps and institutional affiliations.

