
Simulation of the Fracturing Process of Inclusions Embedded in Rock Matrix under Compression


Abstract
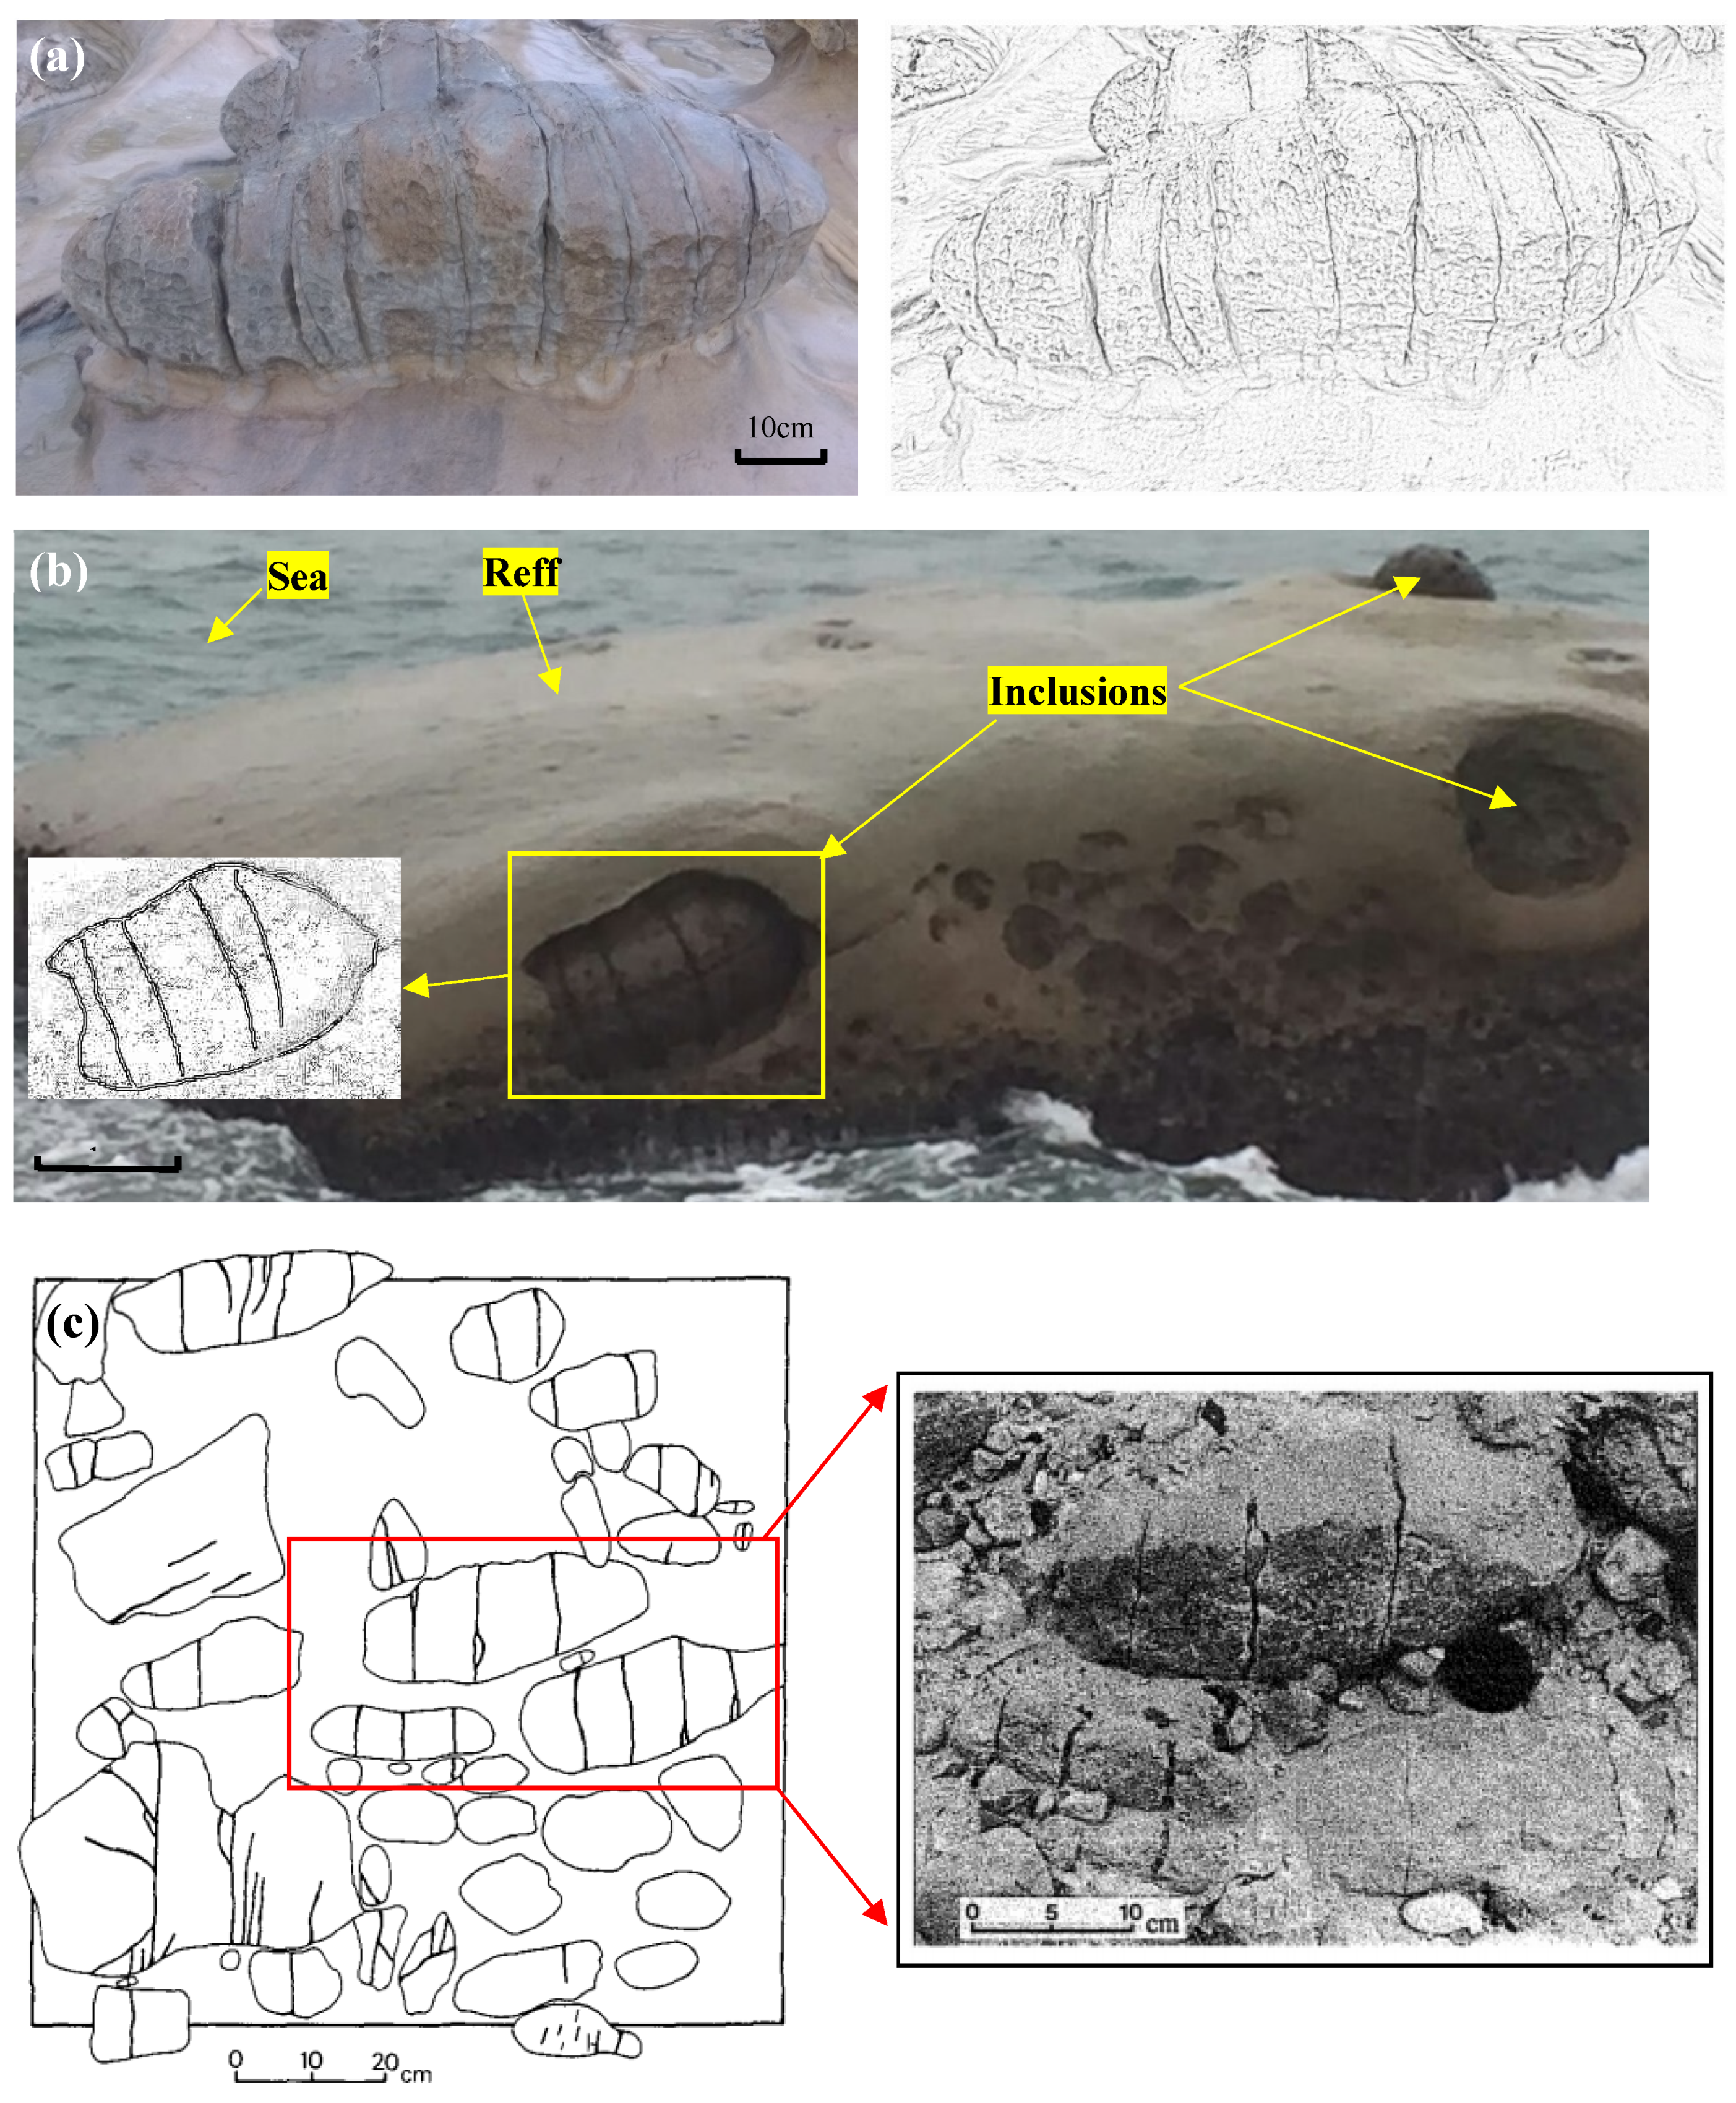
:1. Introduction
2. Fracturing Behaviors of Single Inclusion Embedded in Rock Matrix
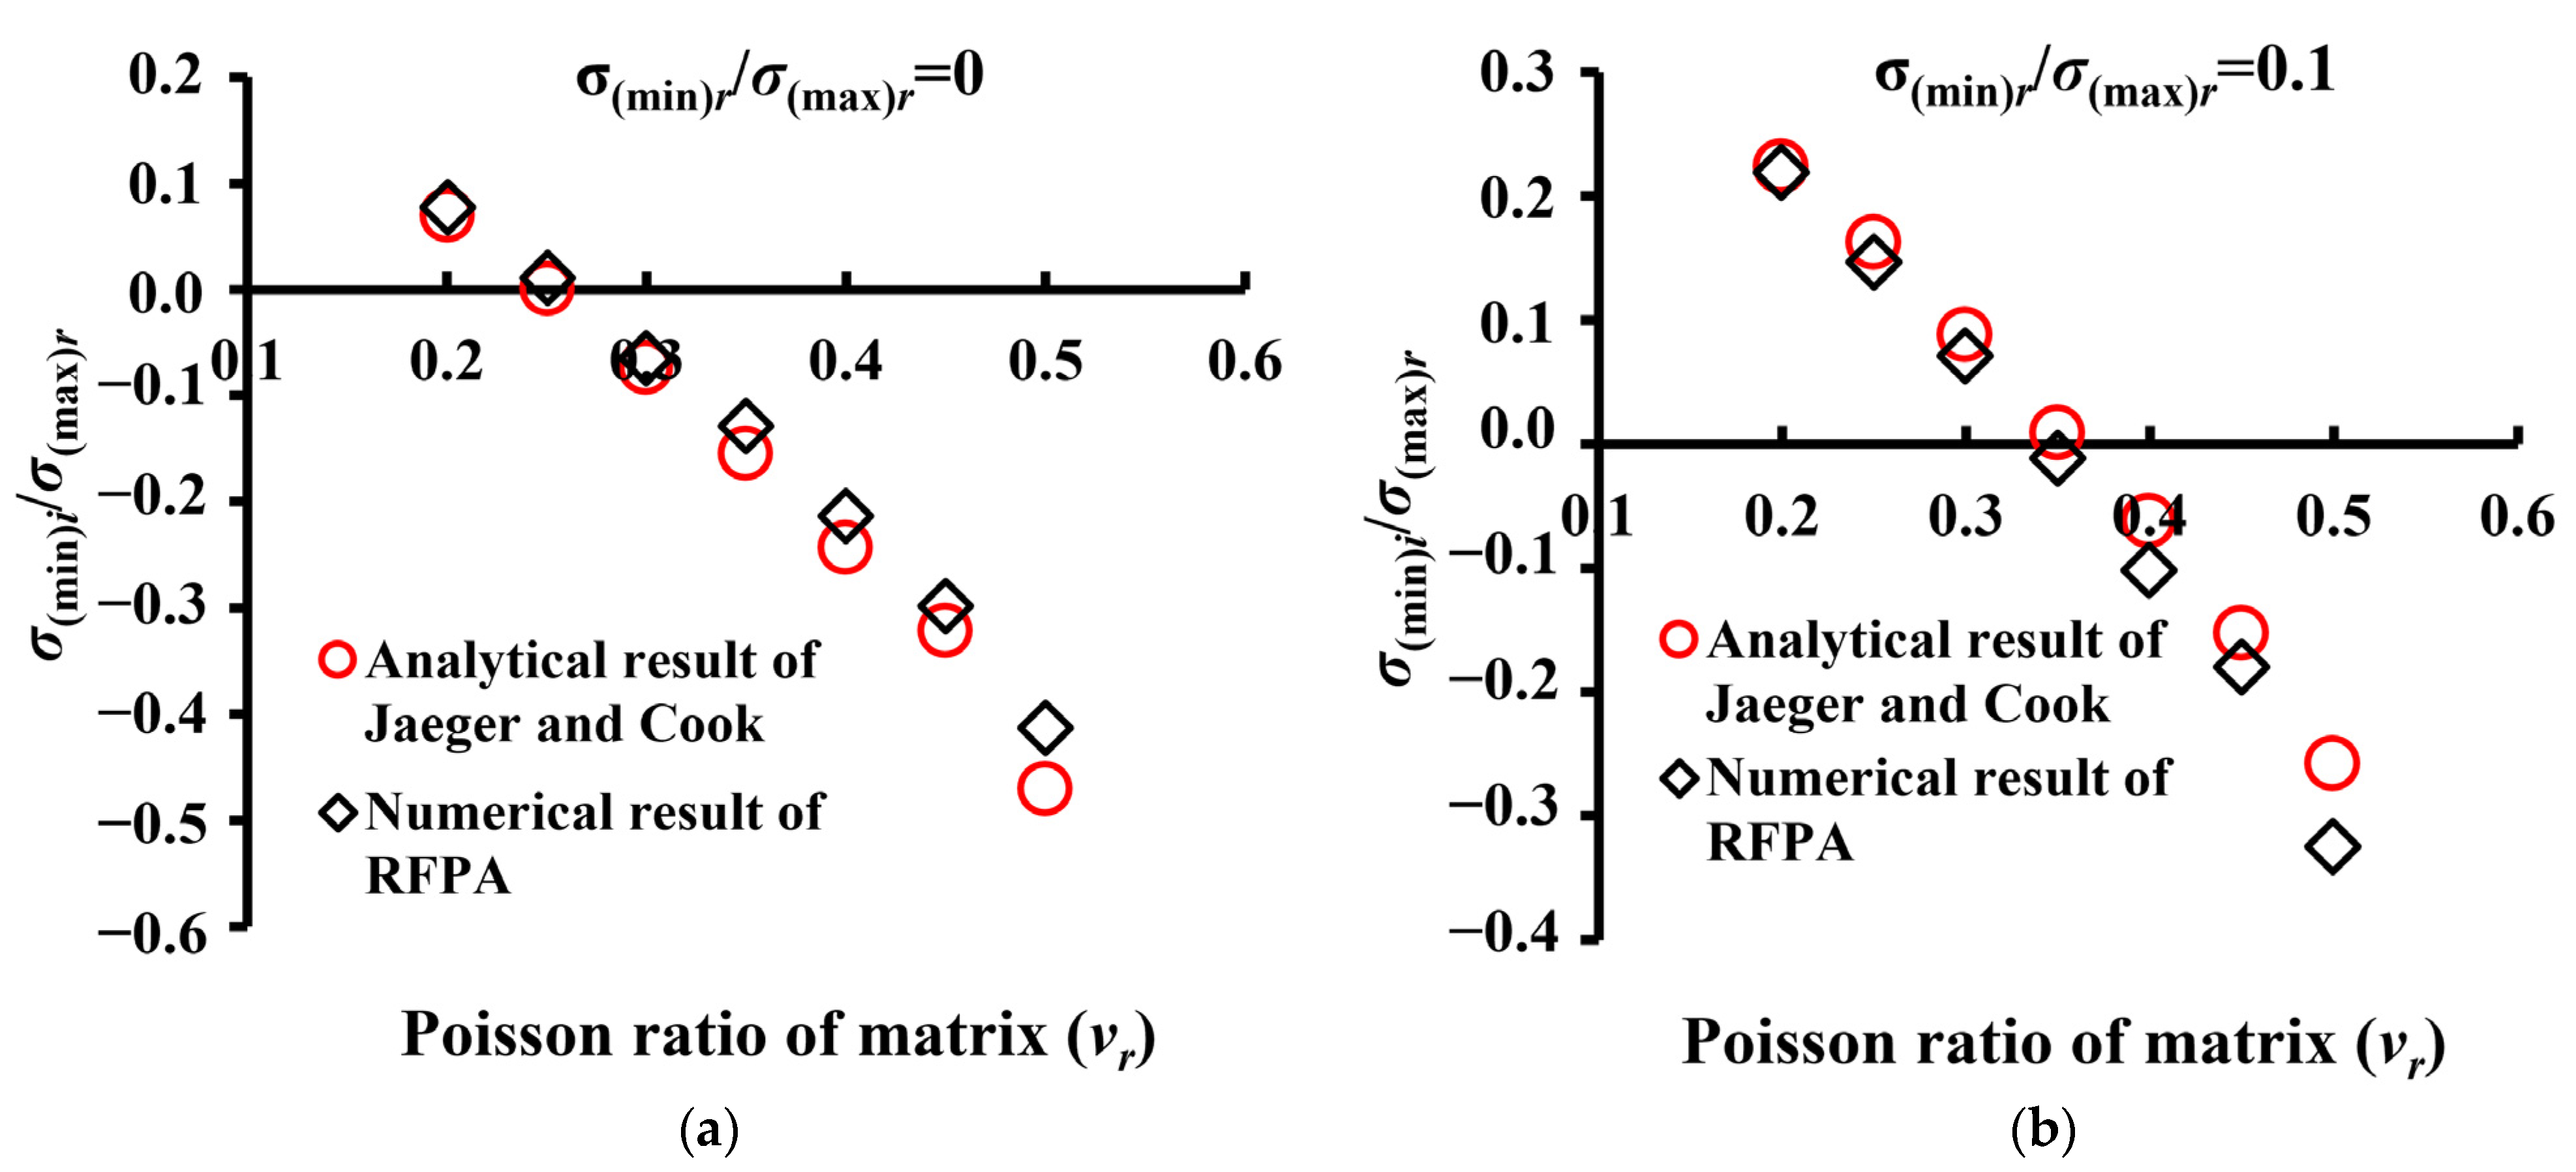
2.1. Stress Distribution Inside an Inclusion
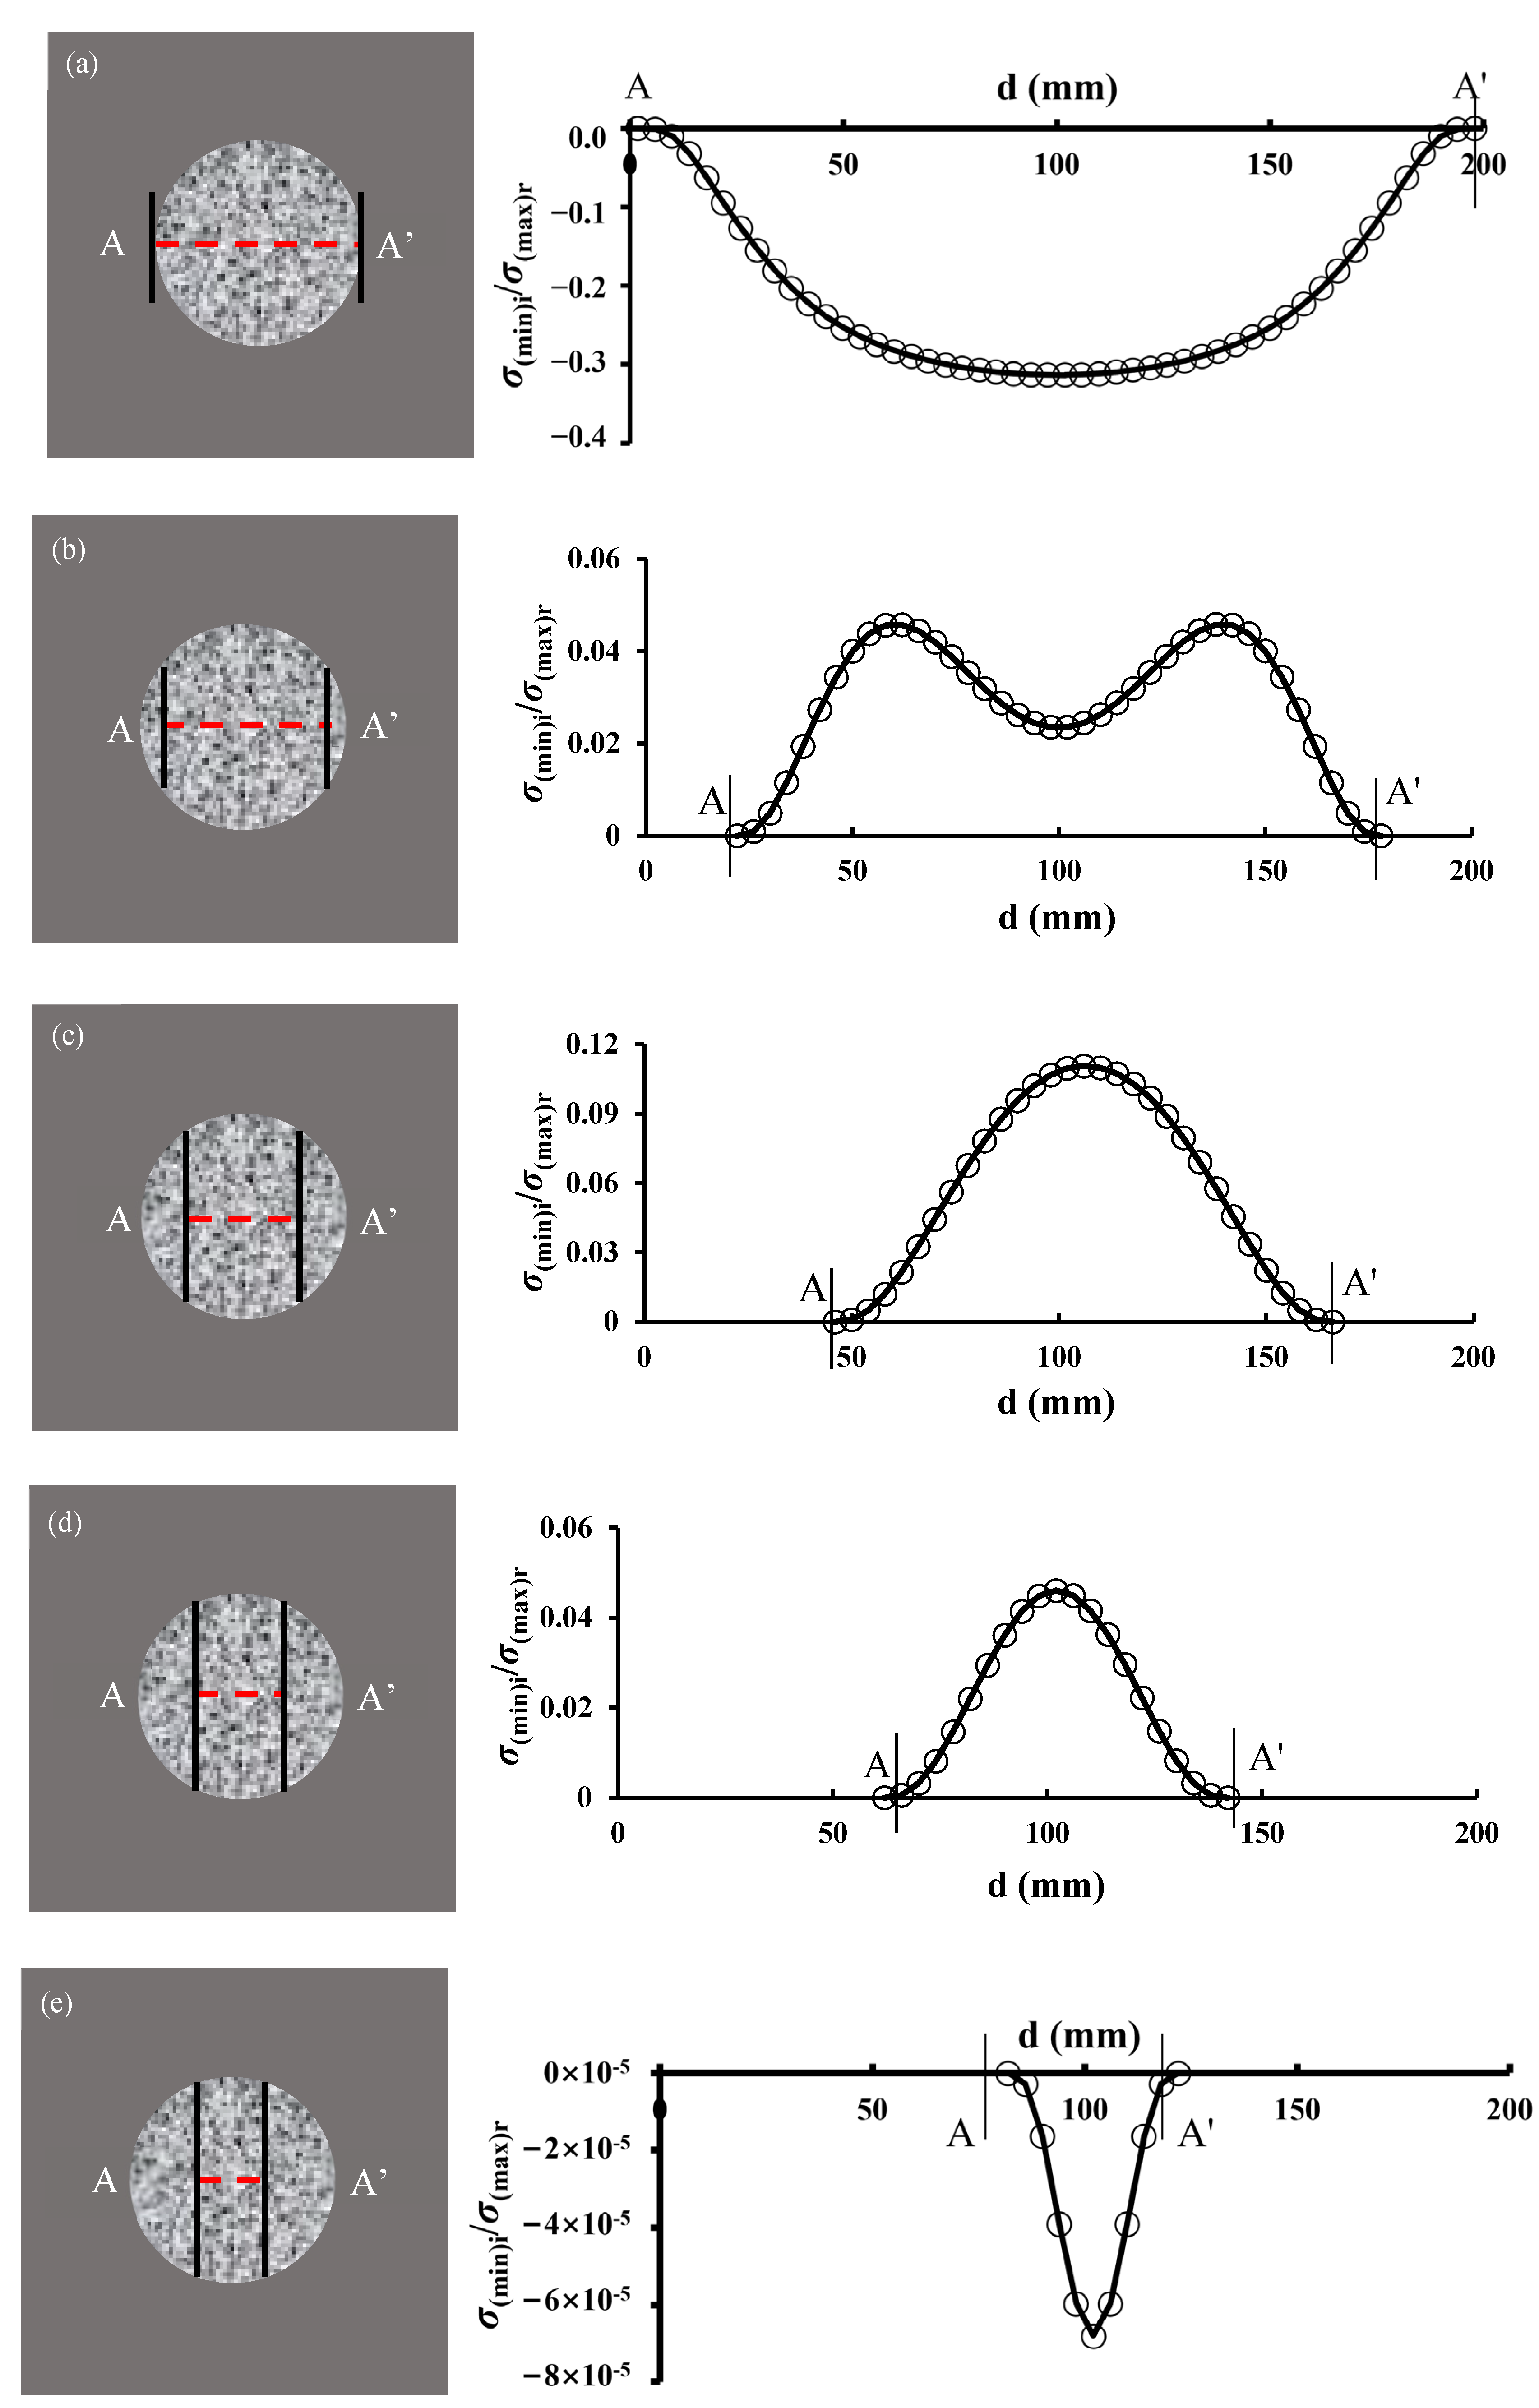
2.2. Stress Field between Two Adjacent Fractures
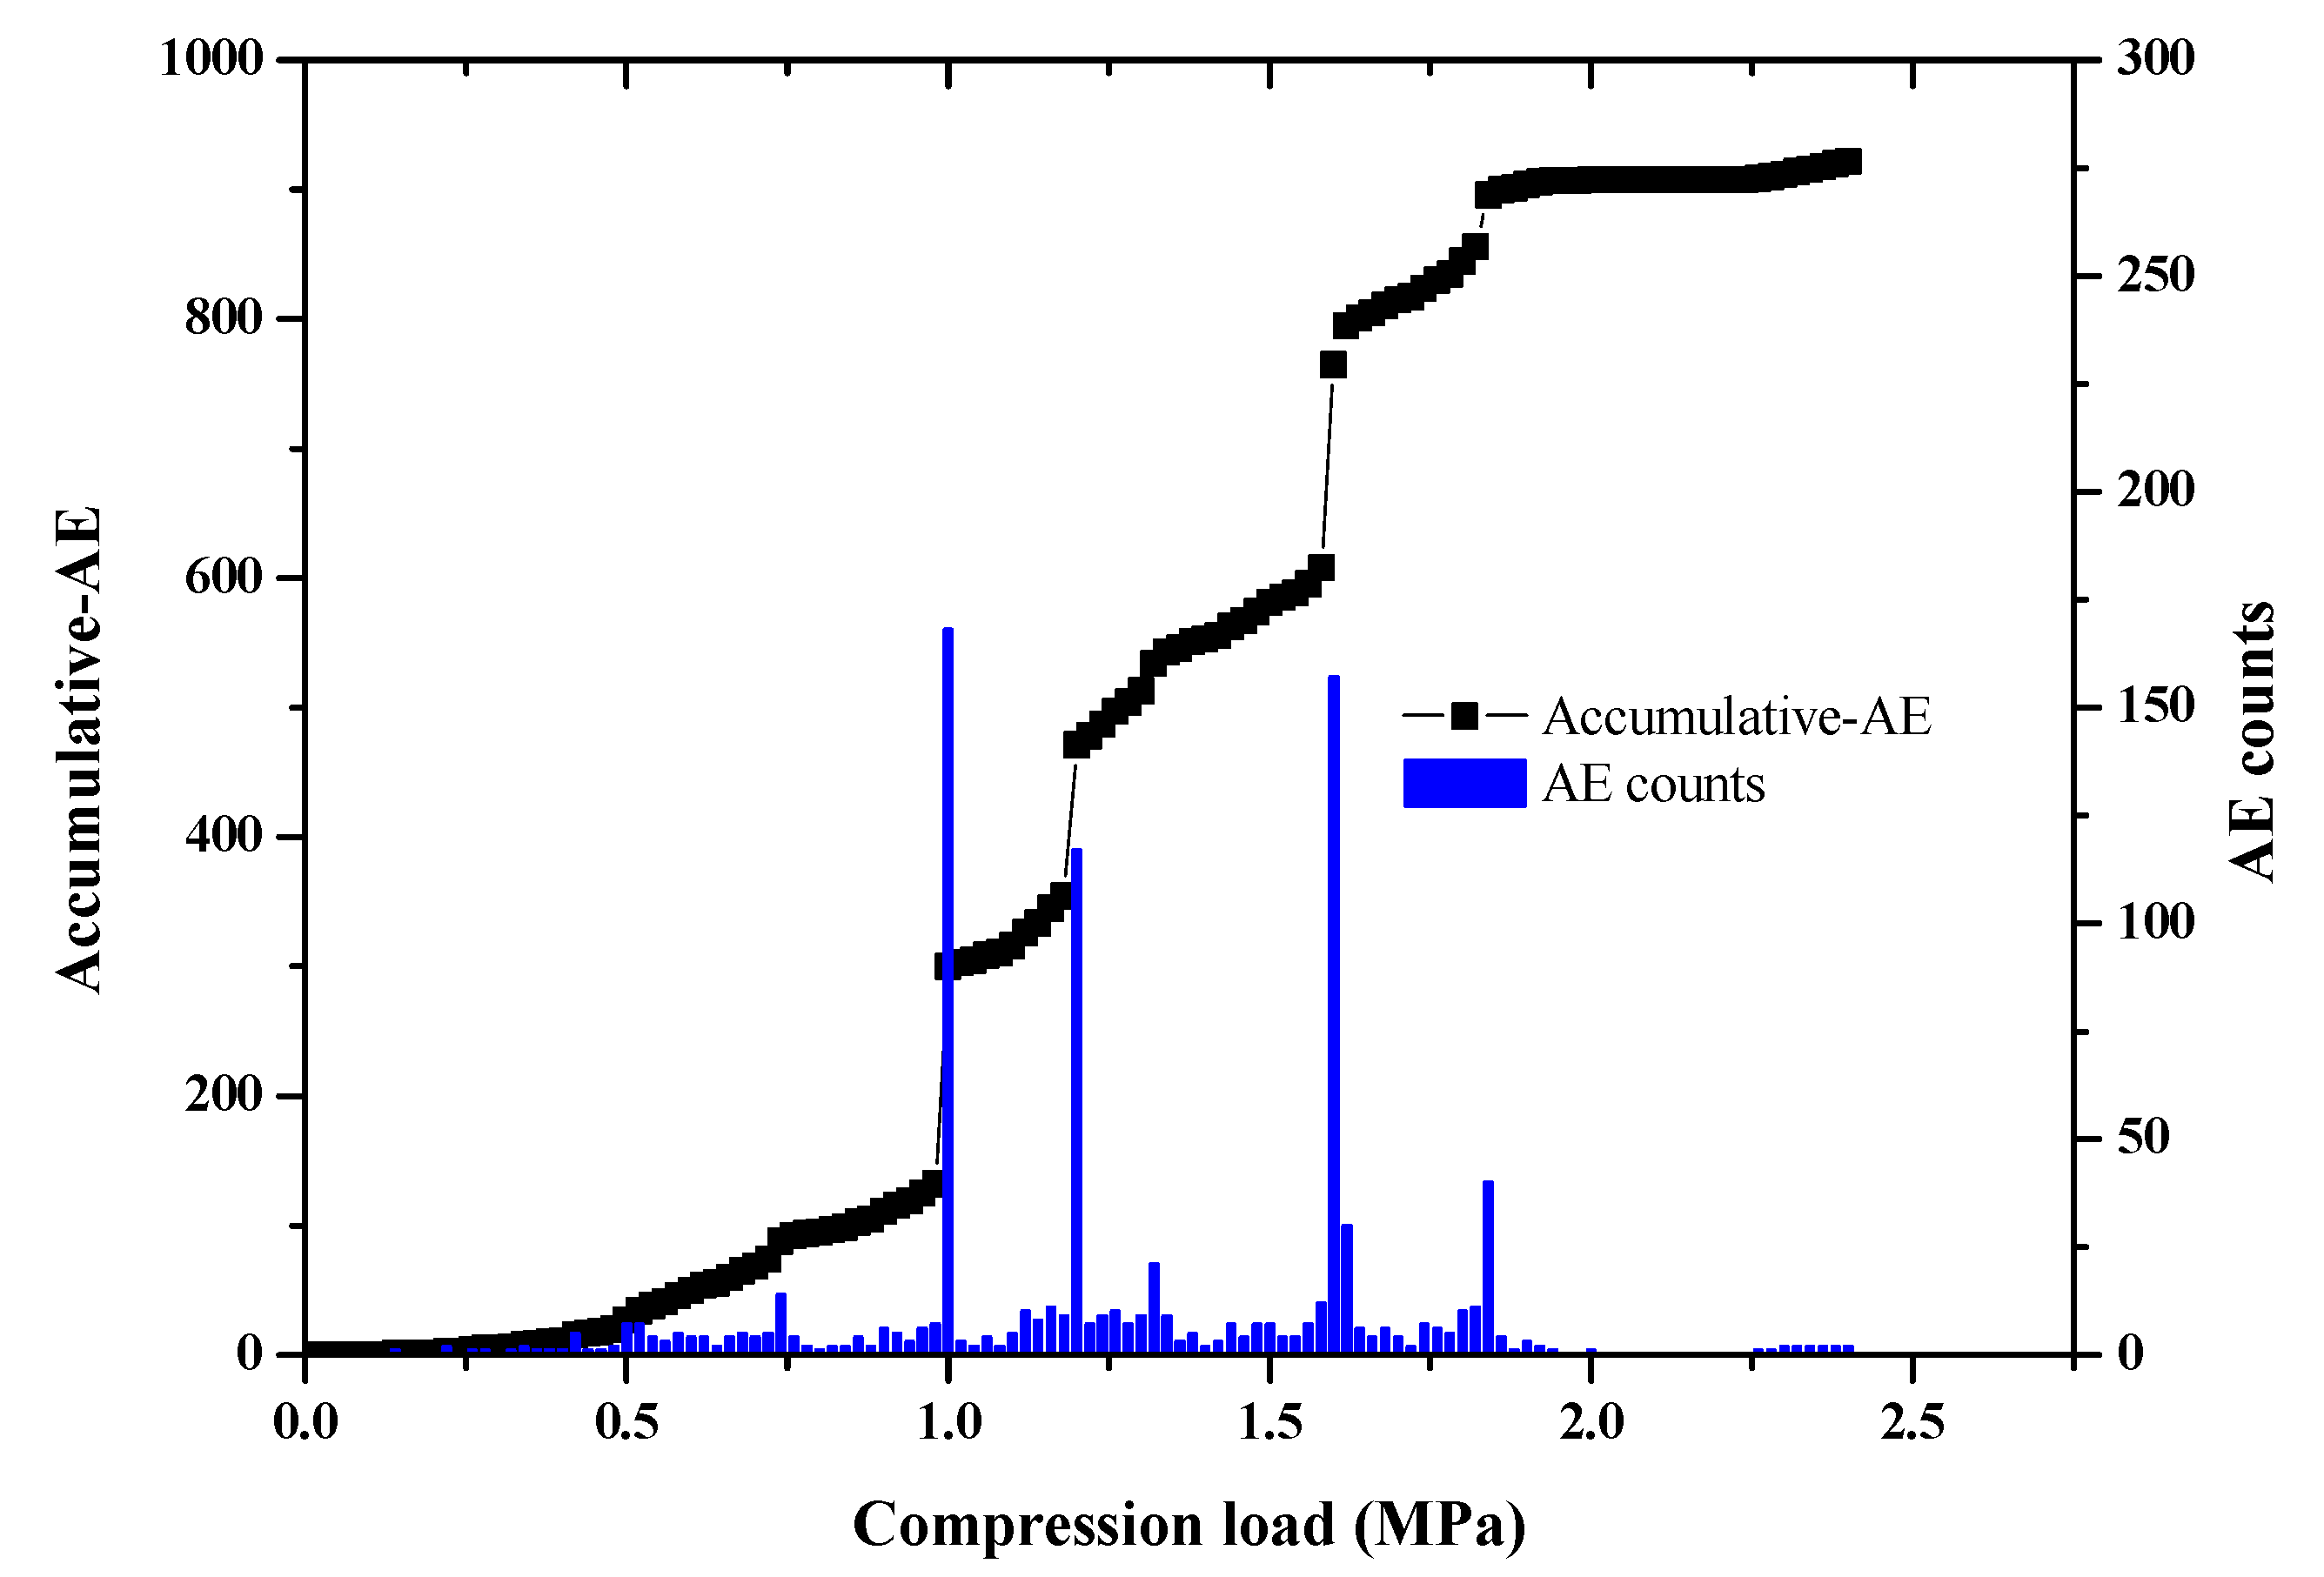
2.3. Failure Analysis of Single Inclusion under Uniaxial Compression
2.4. Effect of Material Properties on the Fracturing Behaviors of Inclusion
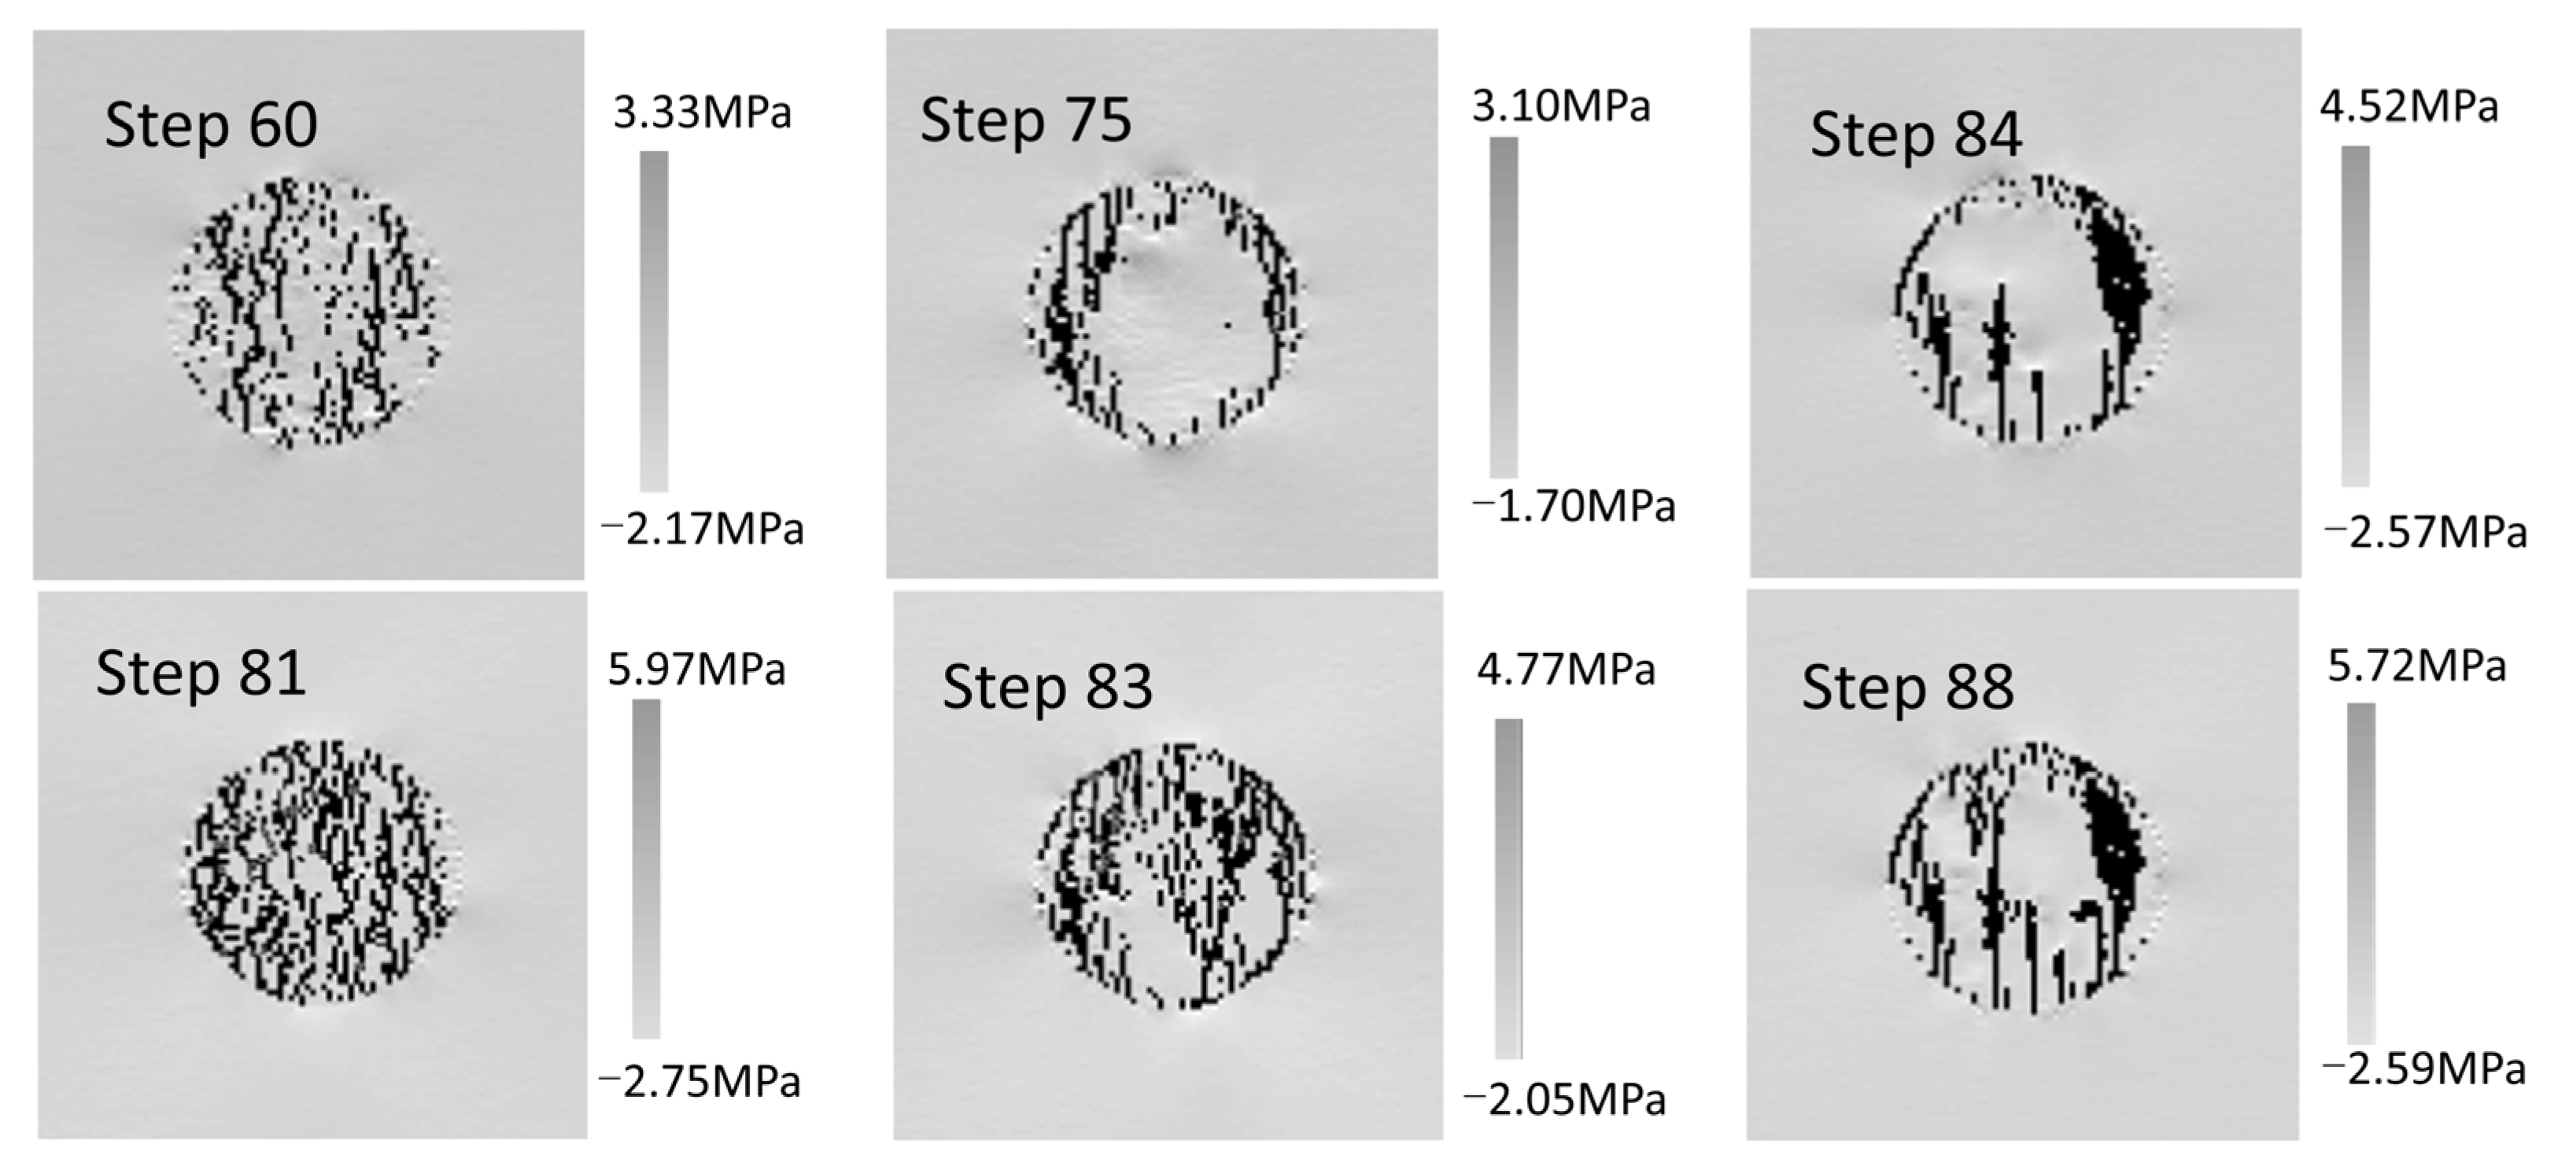
2.4.1. Effect of the Material Heterogeneity on Fracturing Behavior
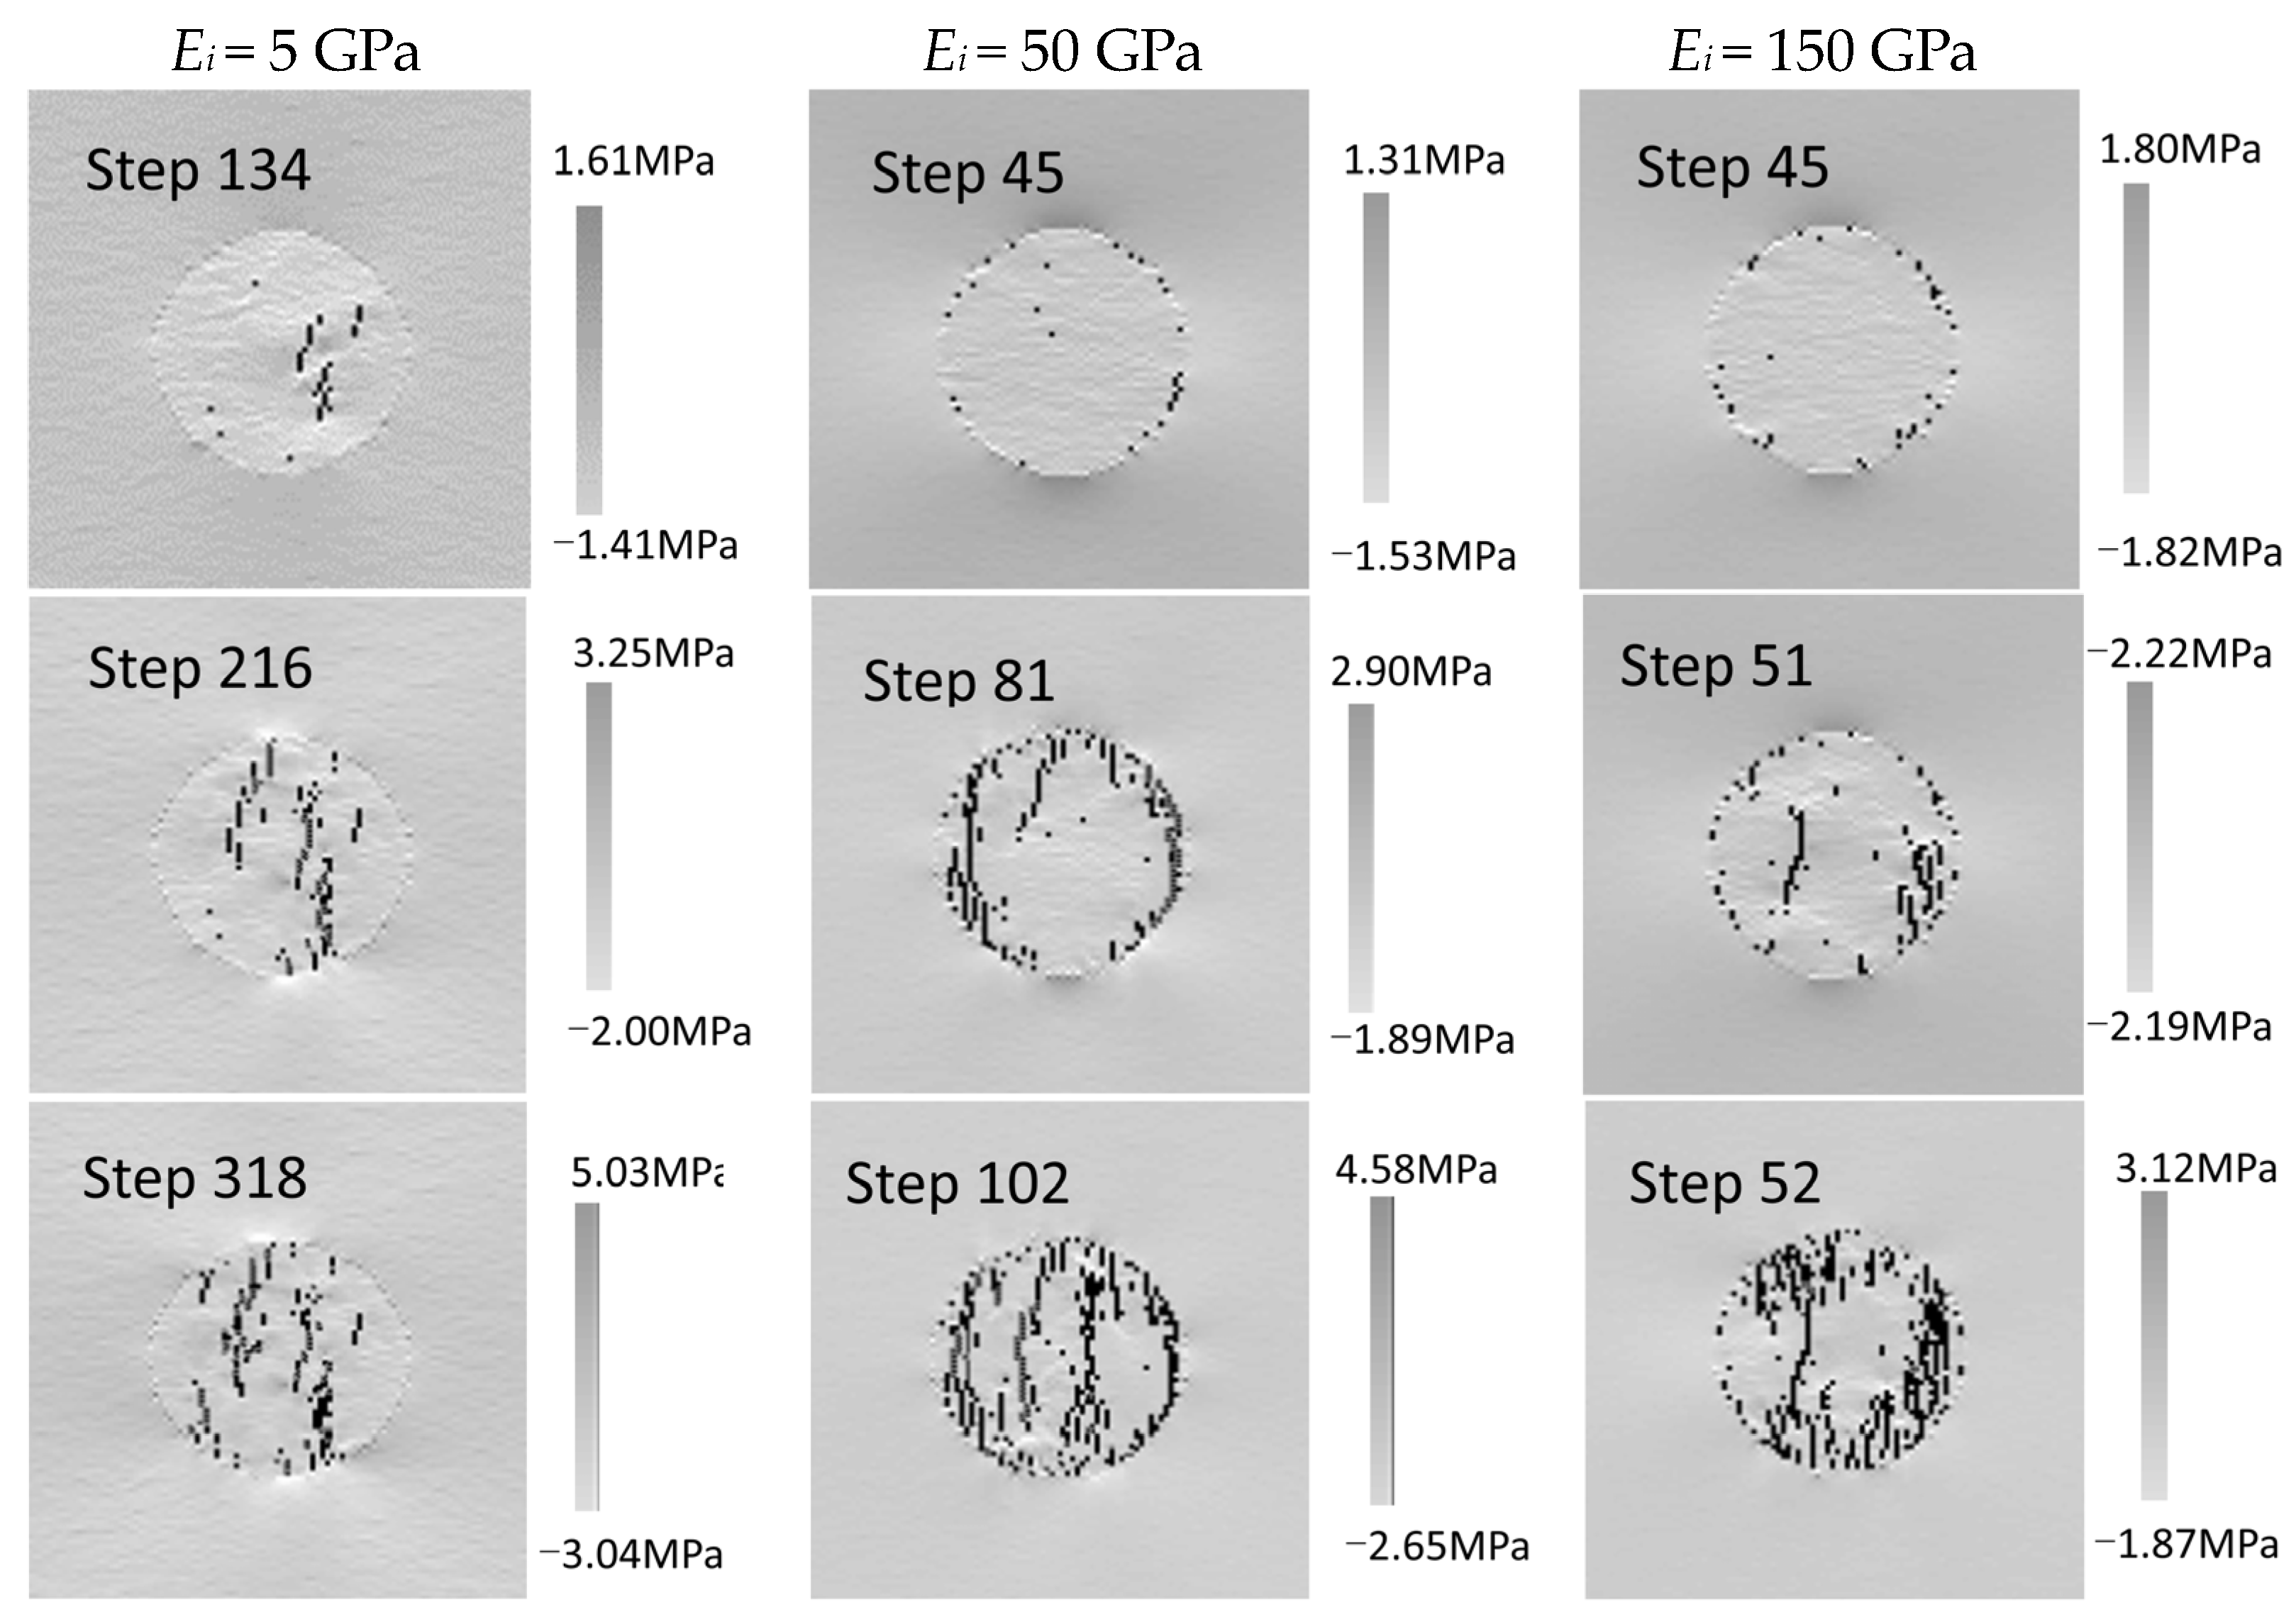
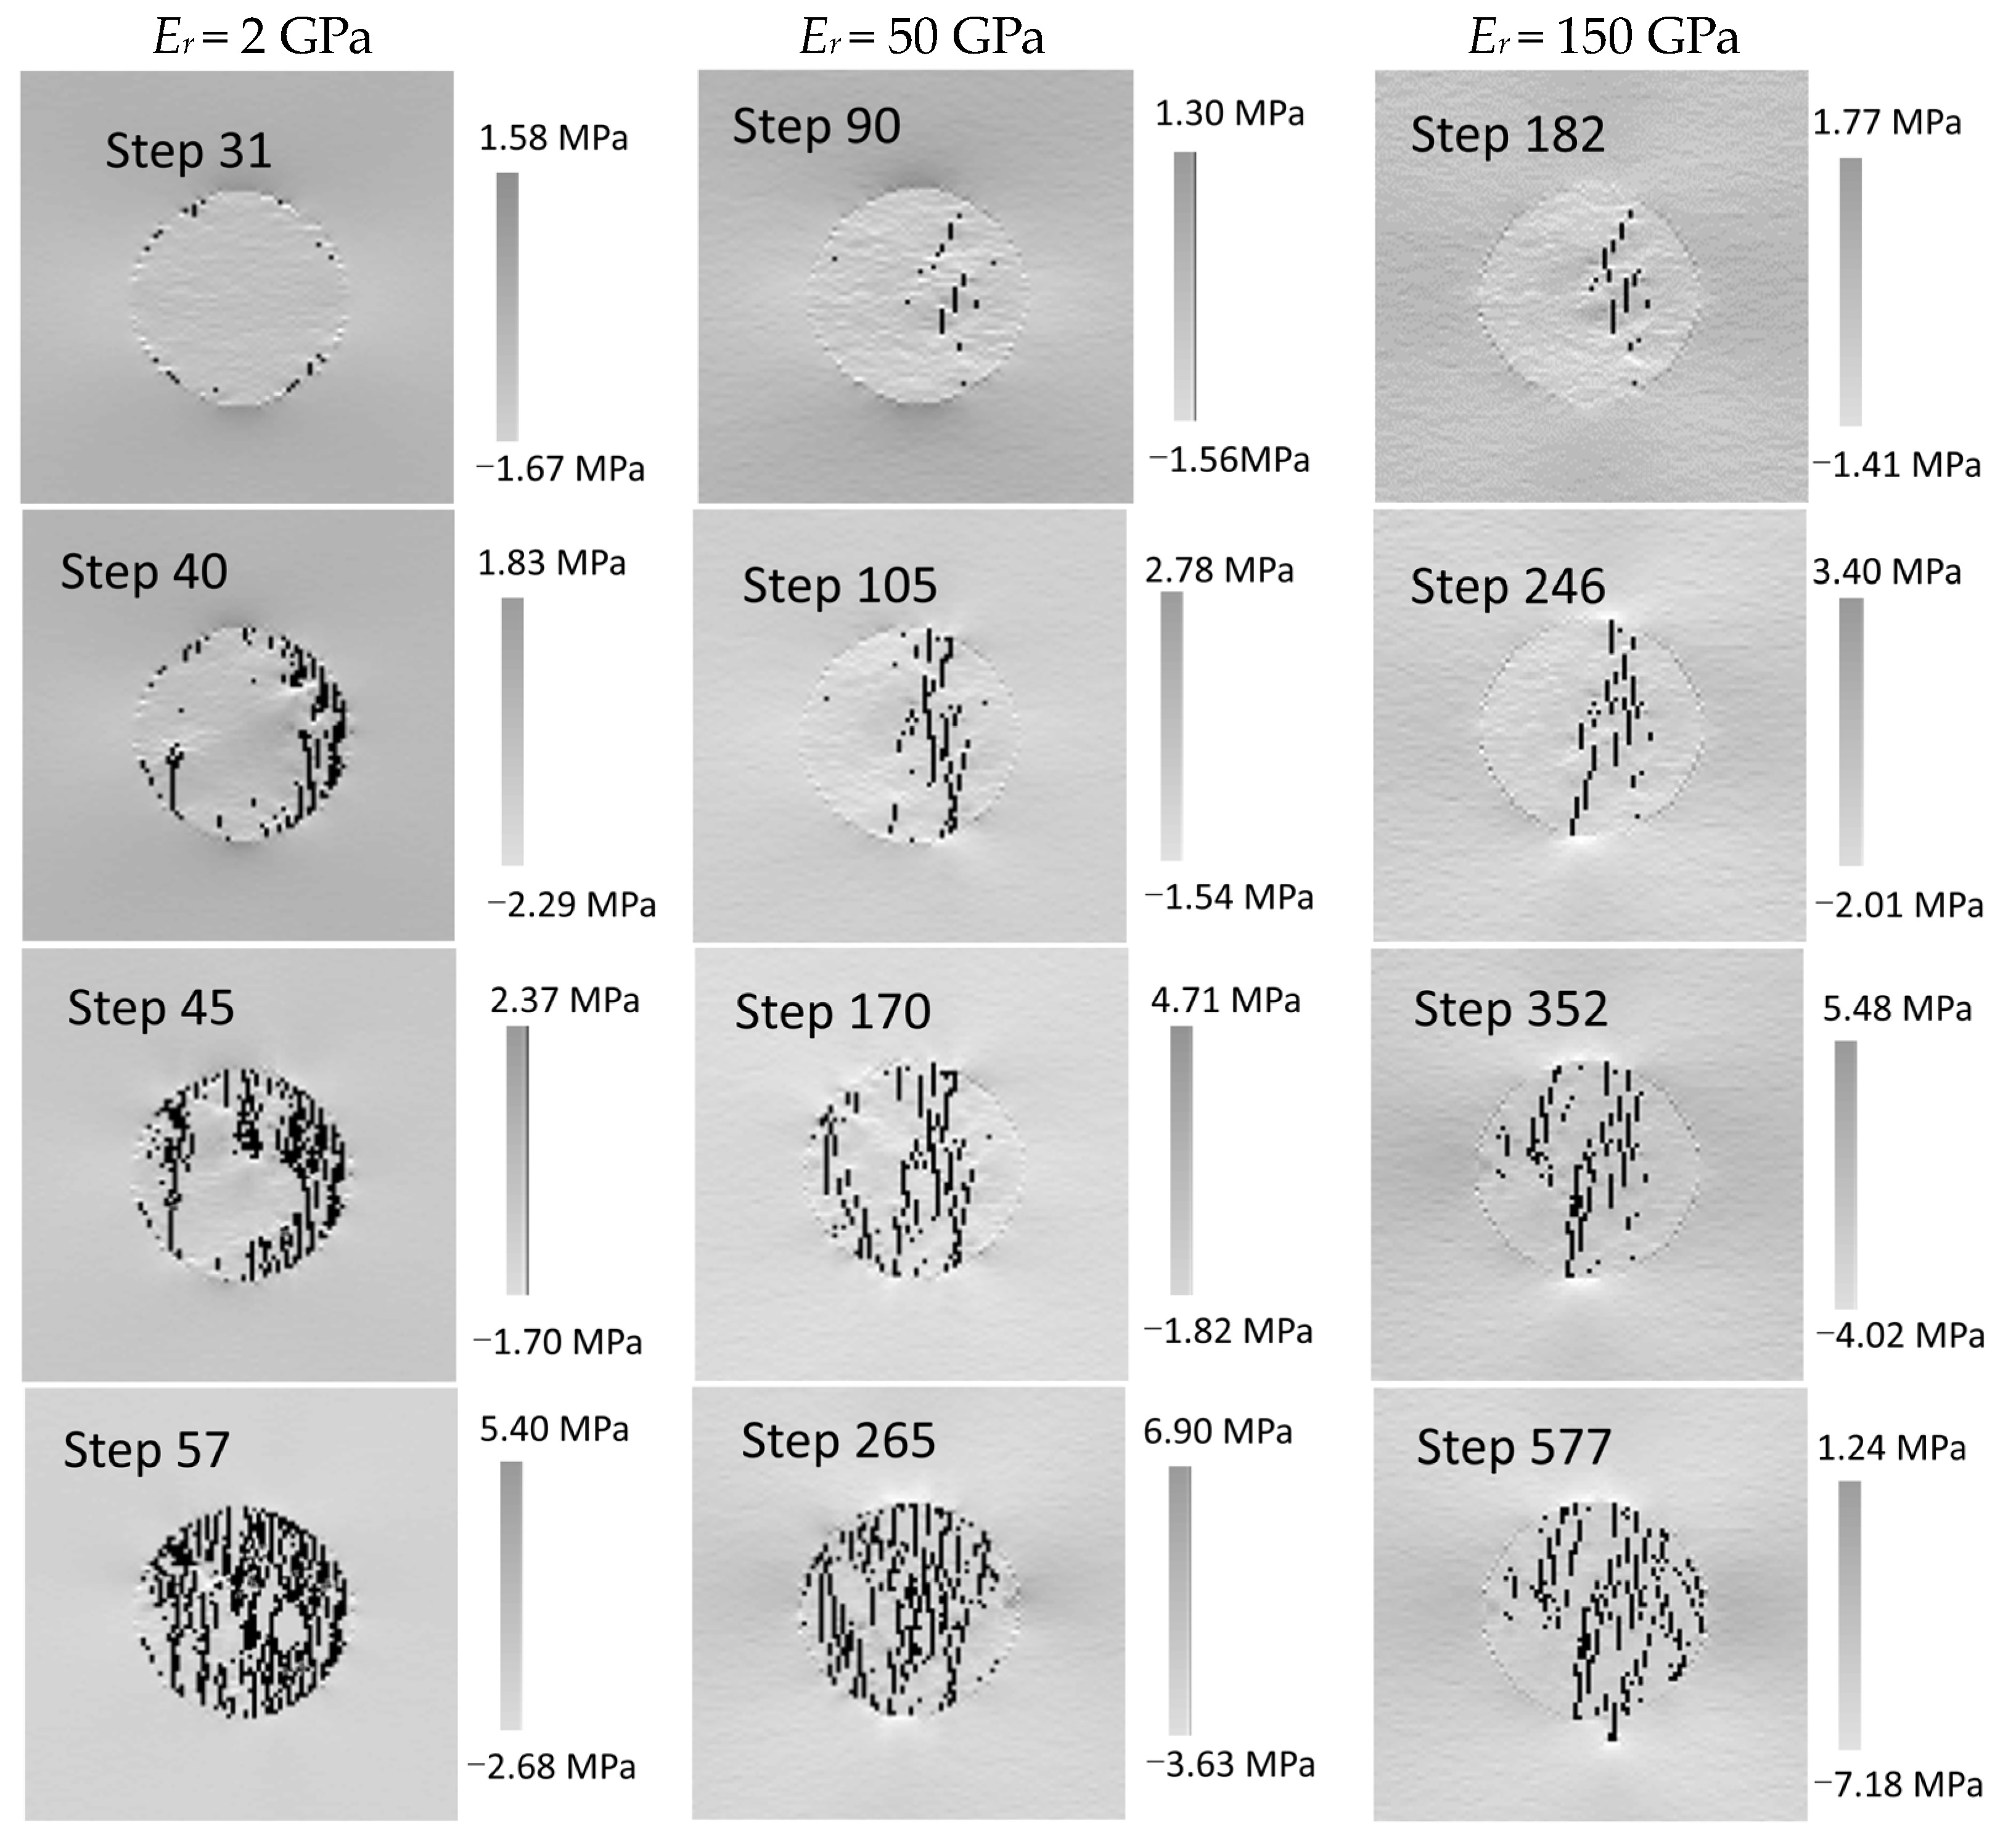
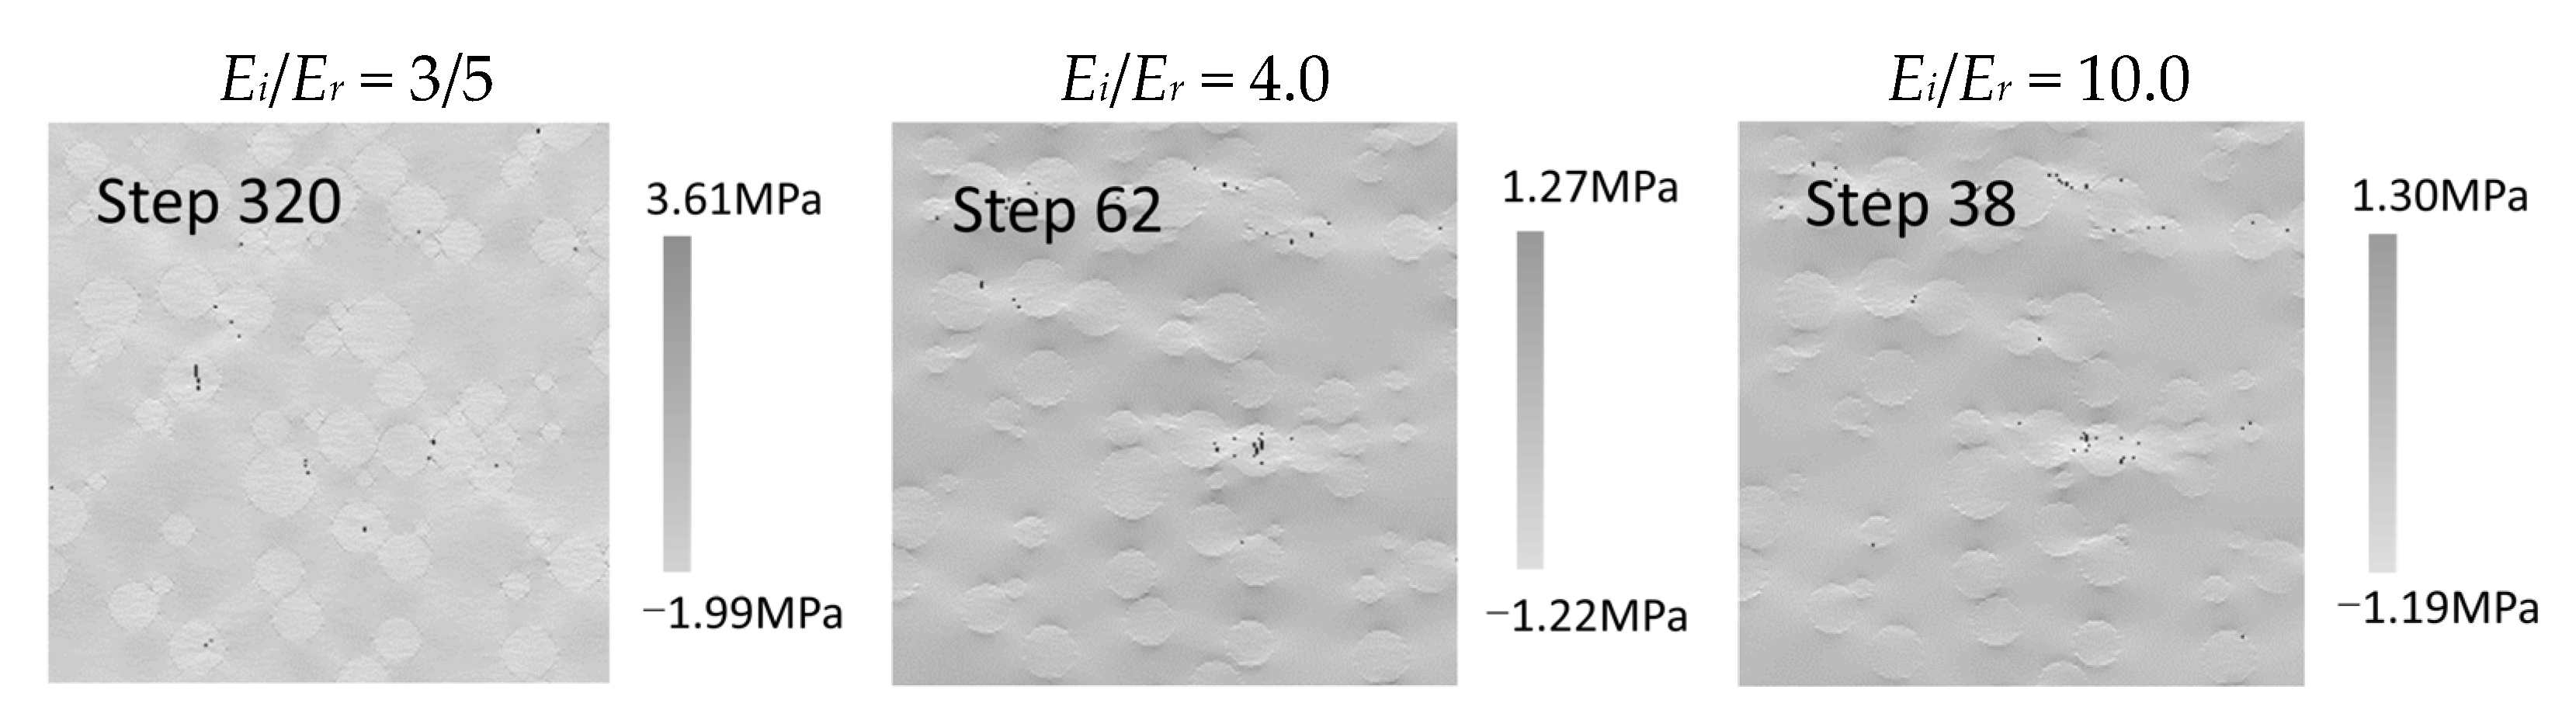
2.4.2. Effect of Stiffness on Fracturing Behavior
3. Fracturing Behavior of Multiple Inclusions
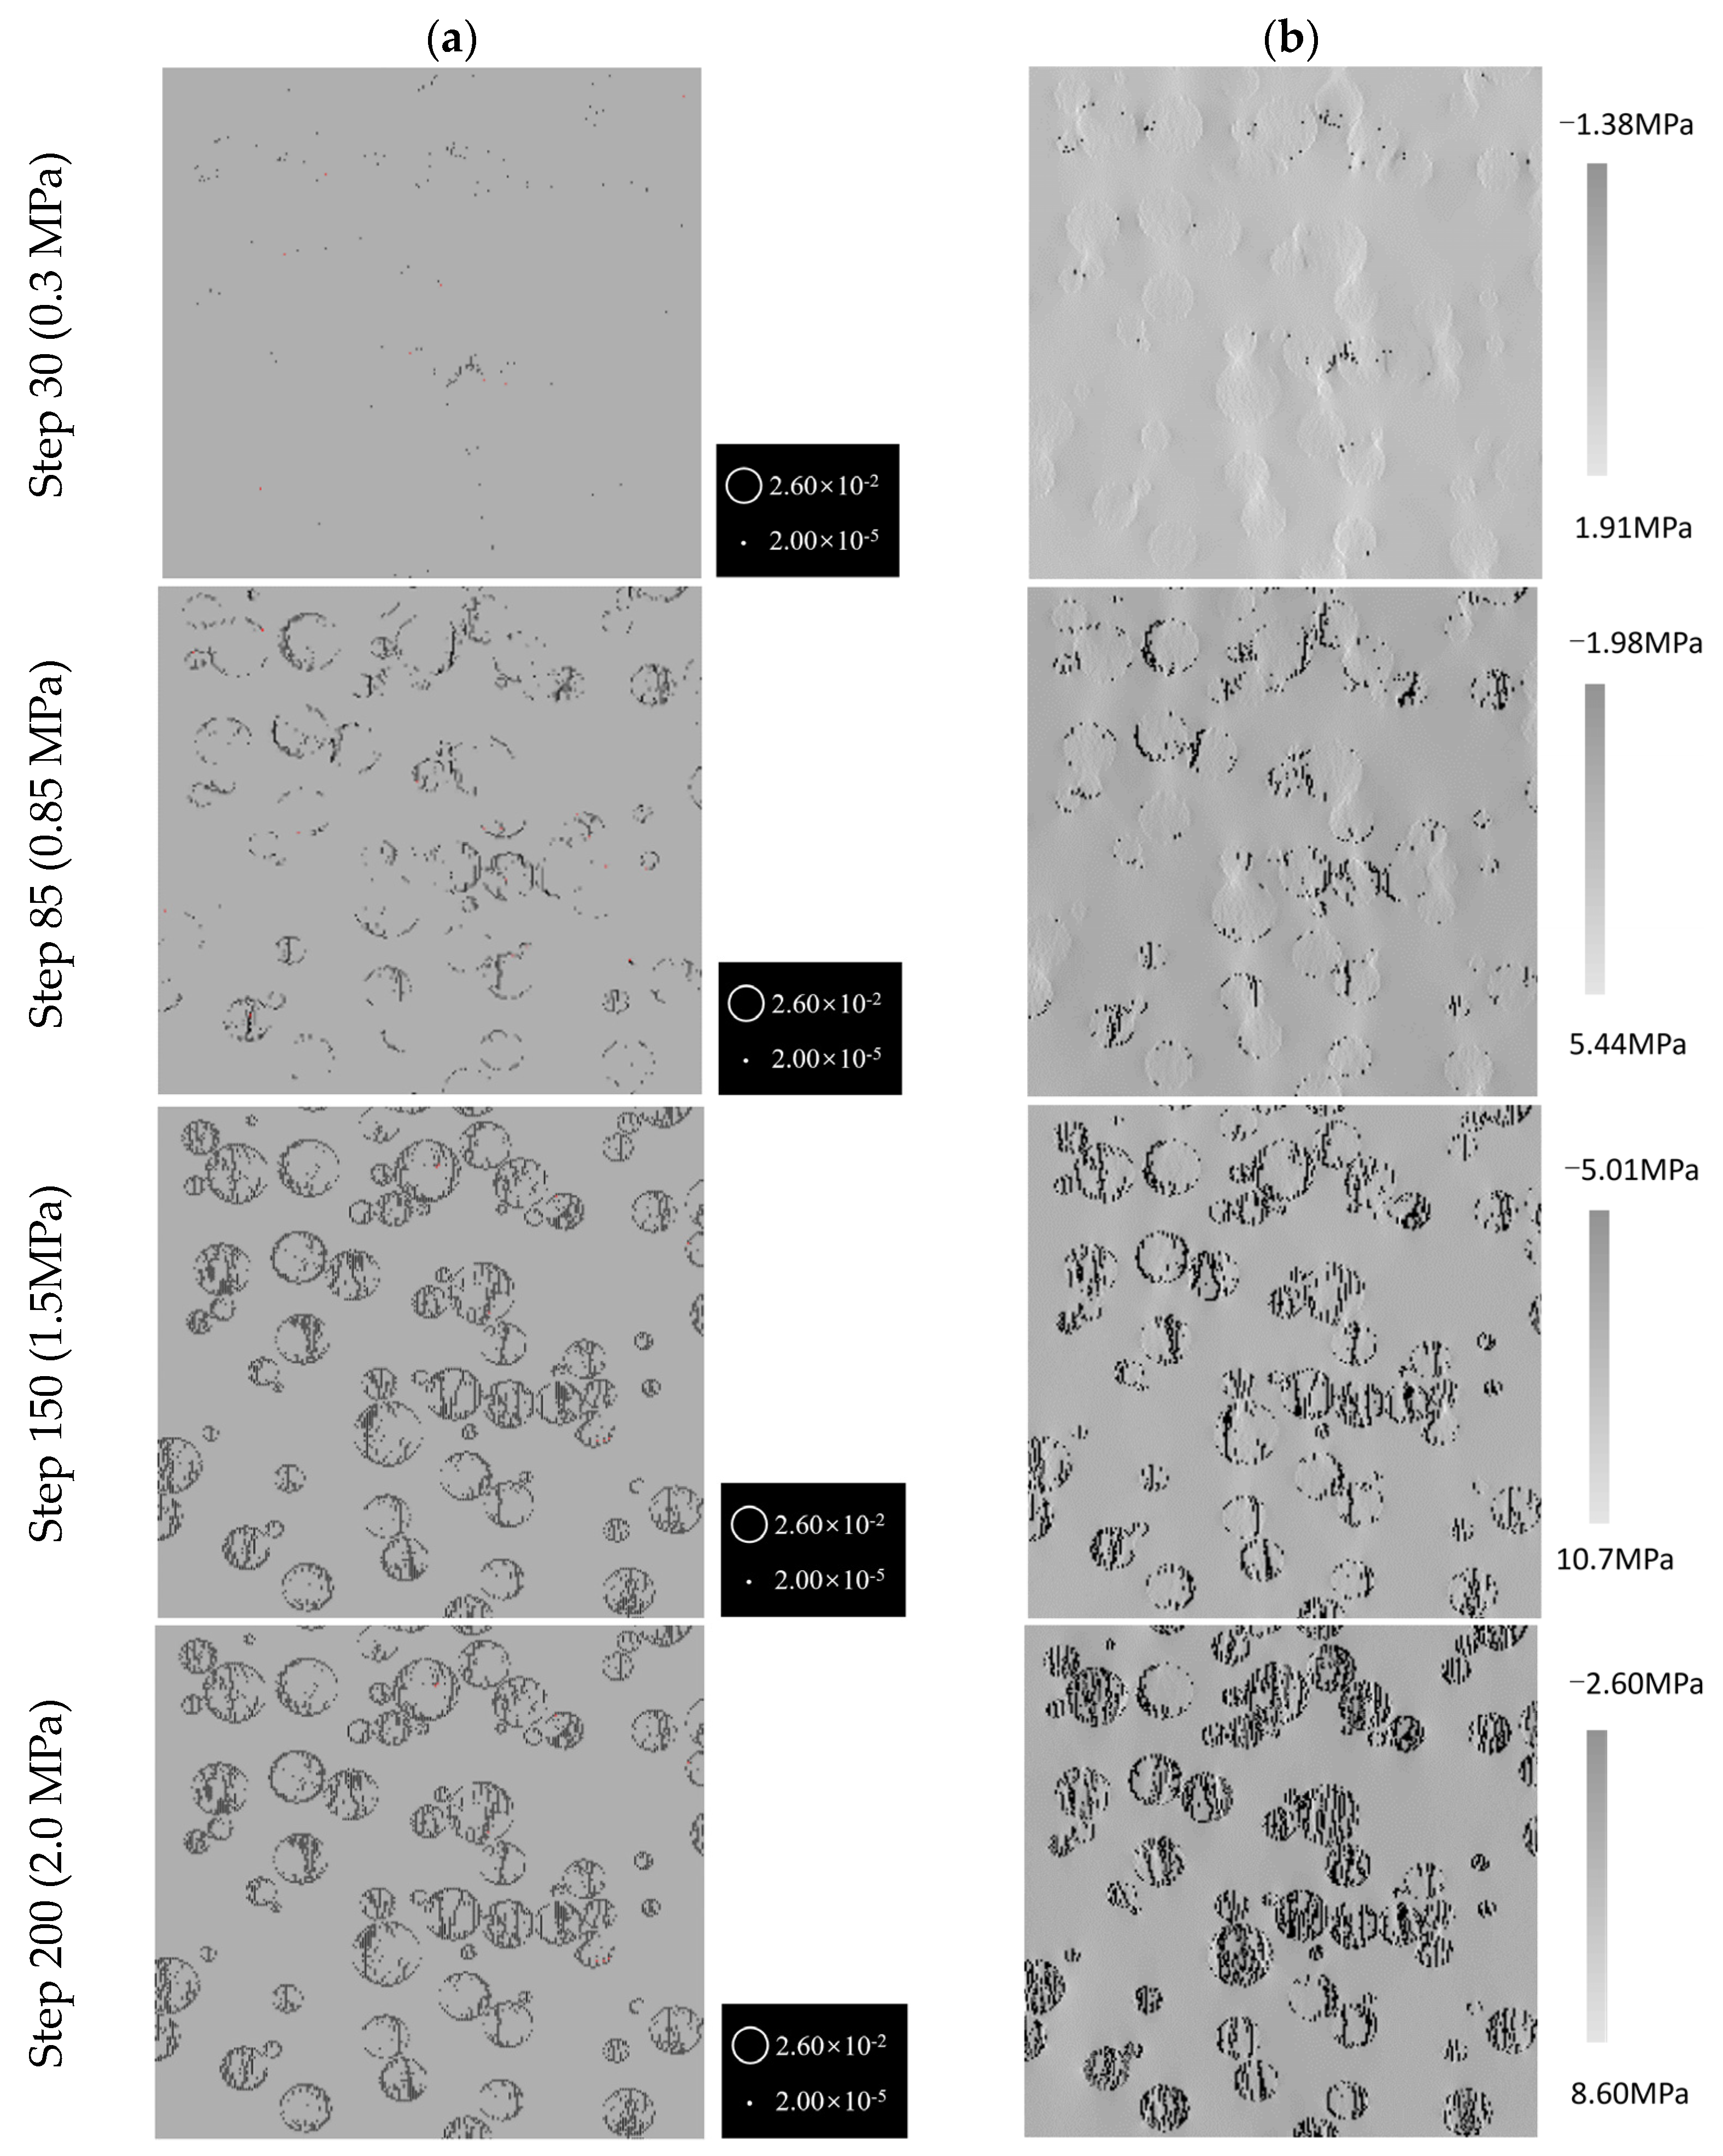
3.1. Failure Process of Multiple Inclusions
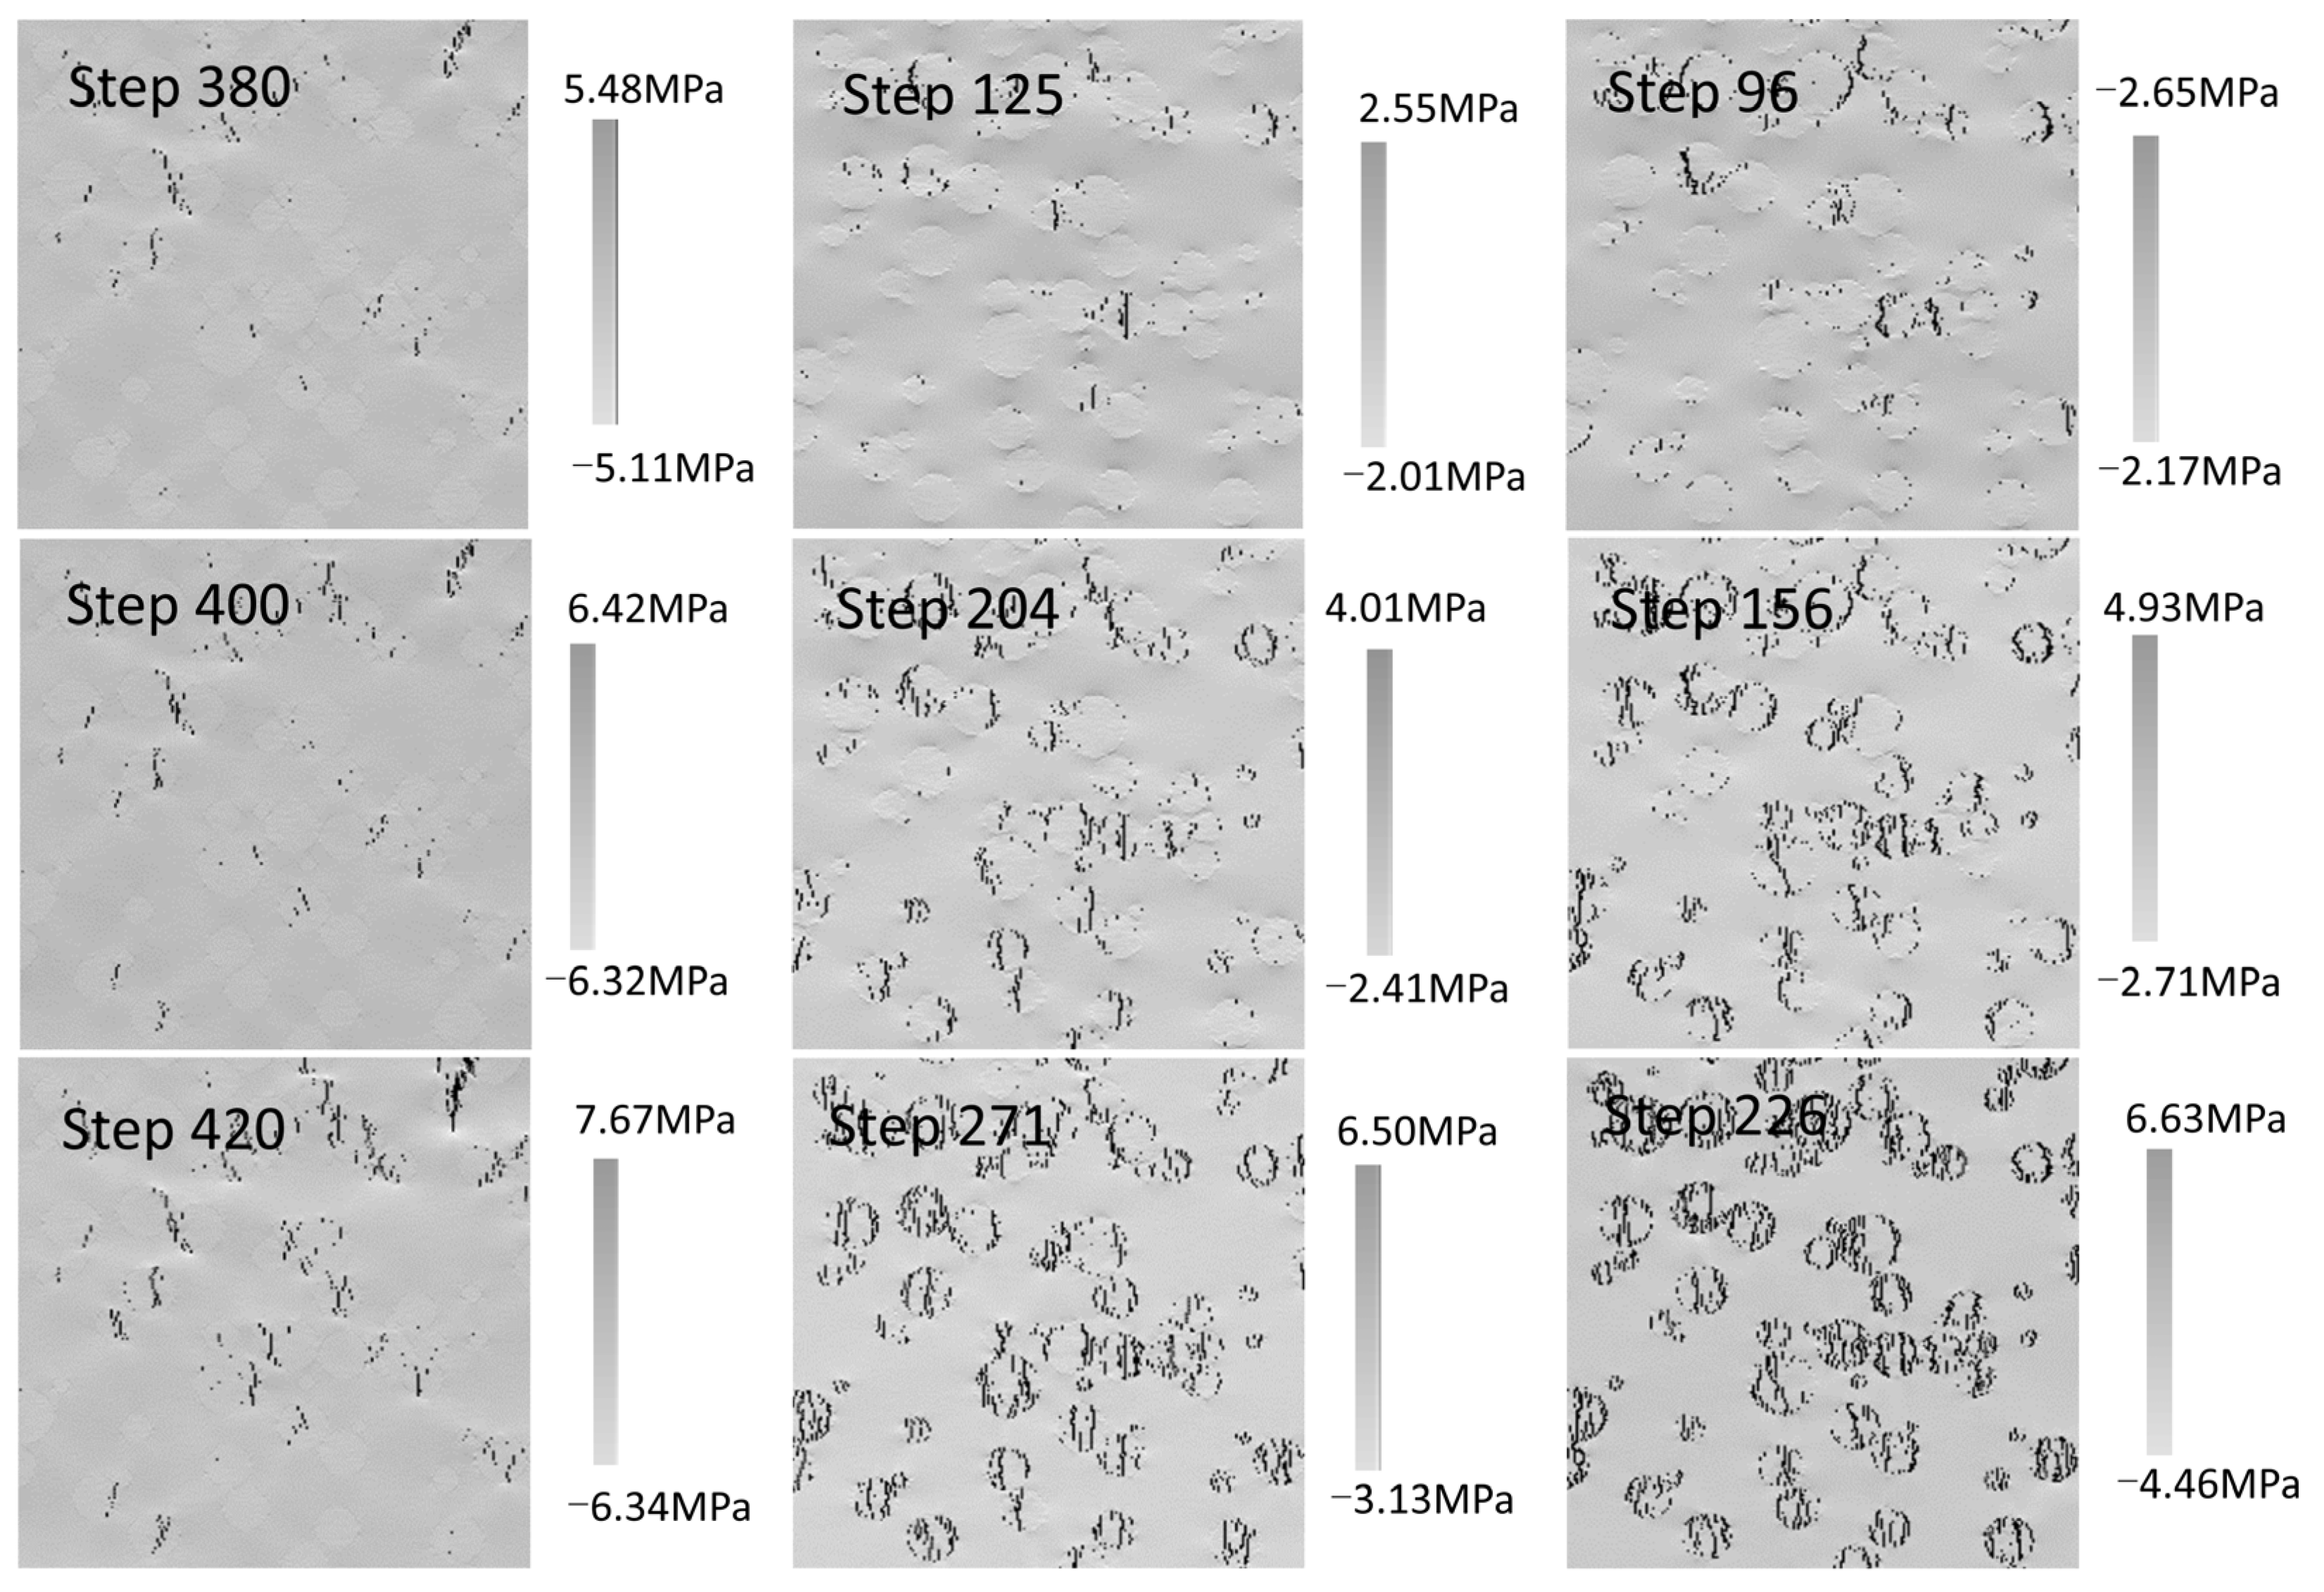
3.2. Effect of Stiffness on the Fracturing Behavior
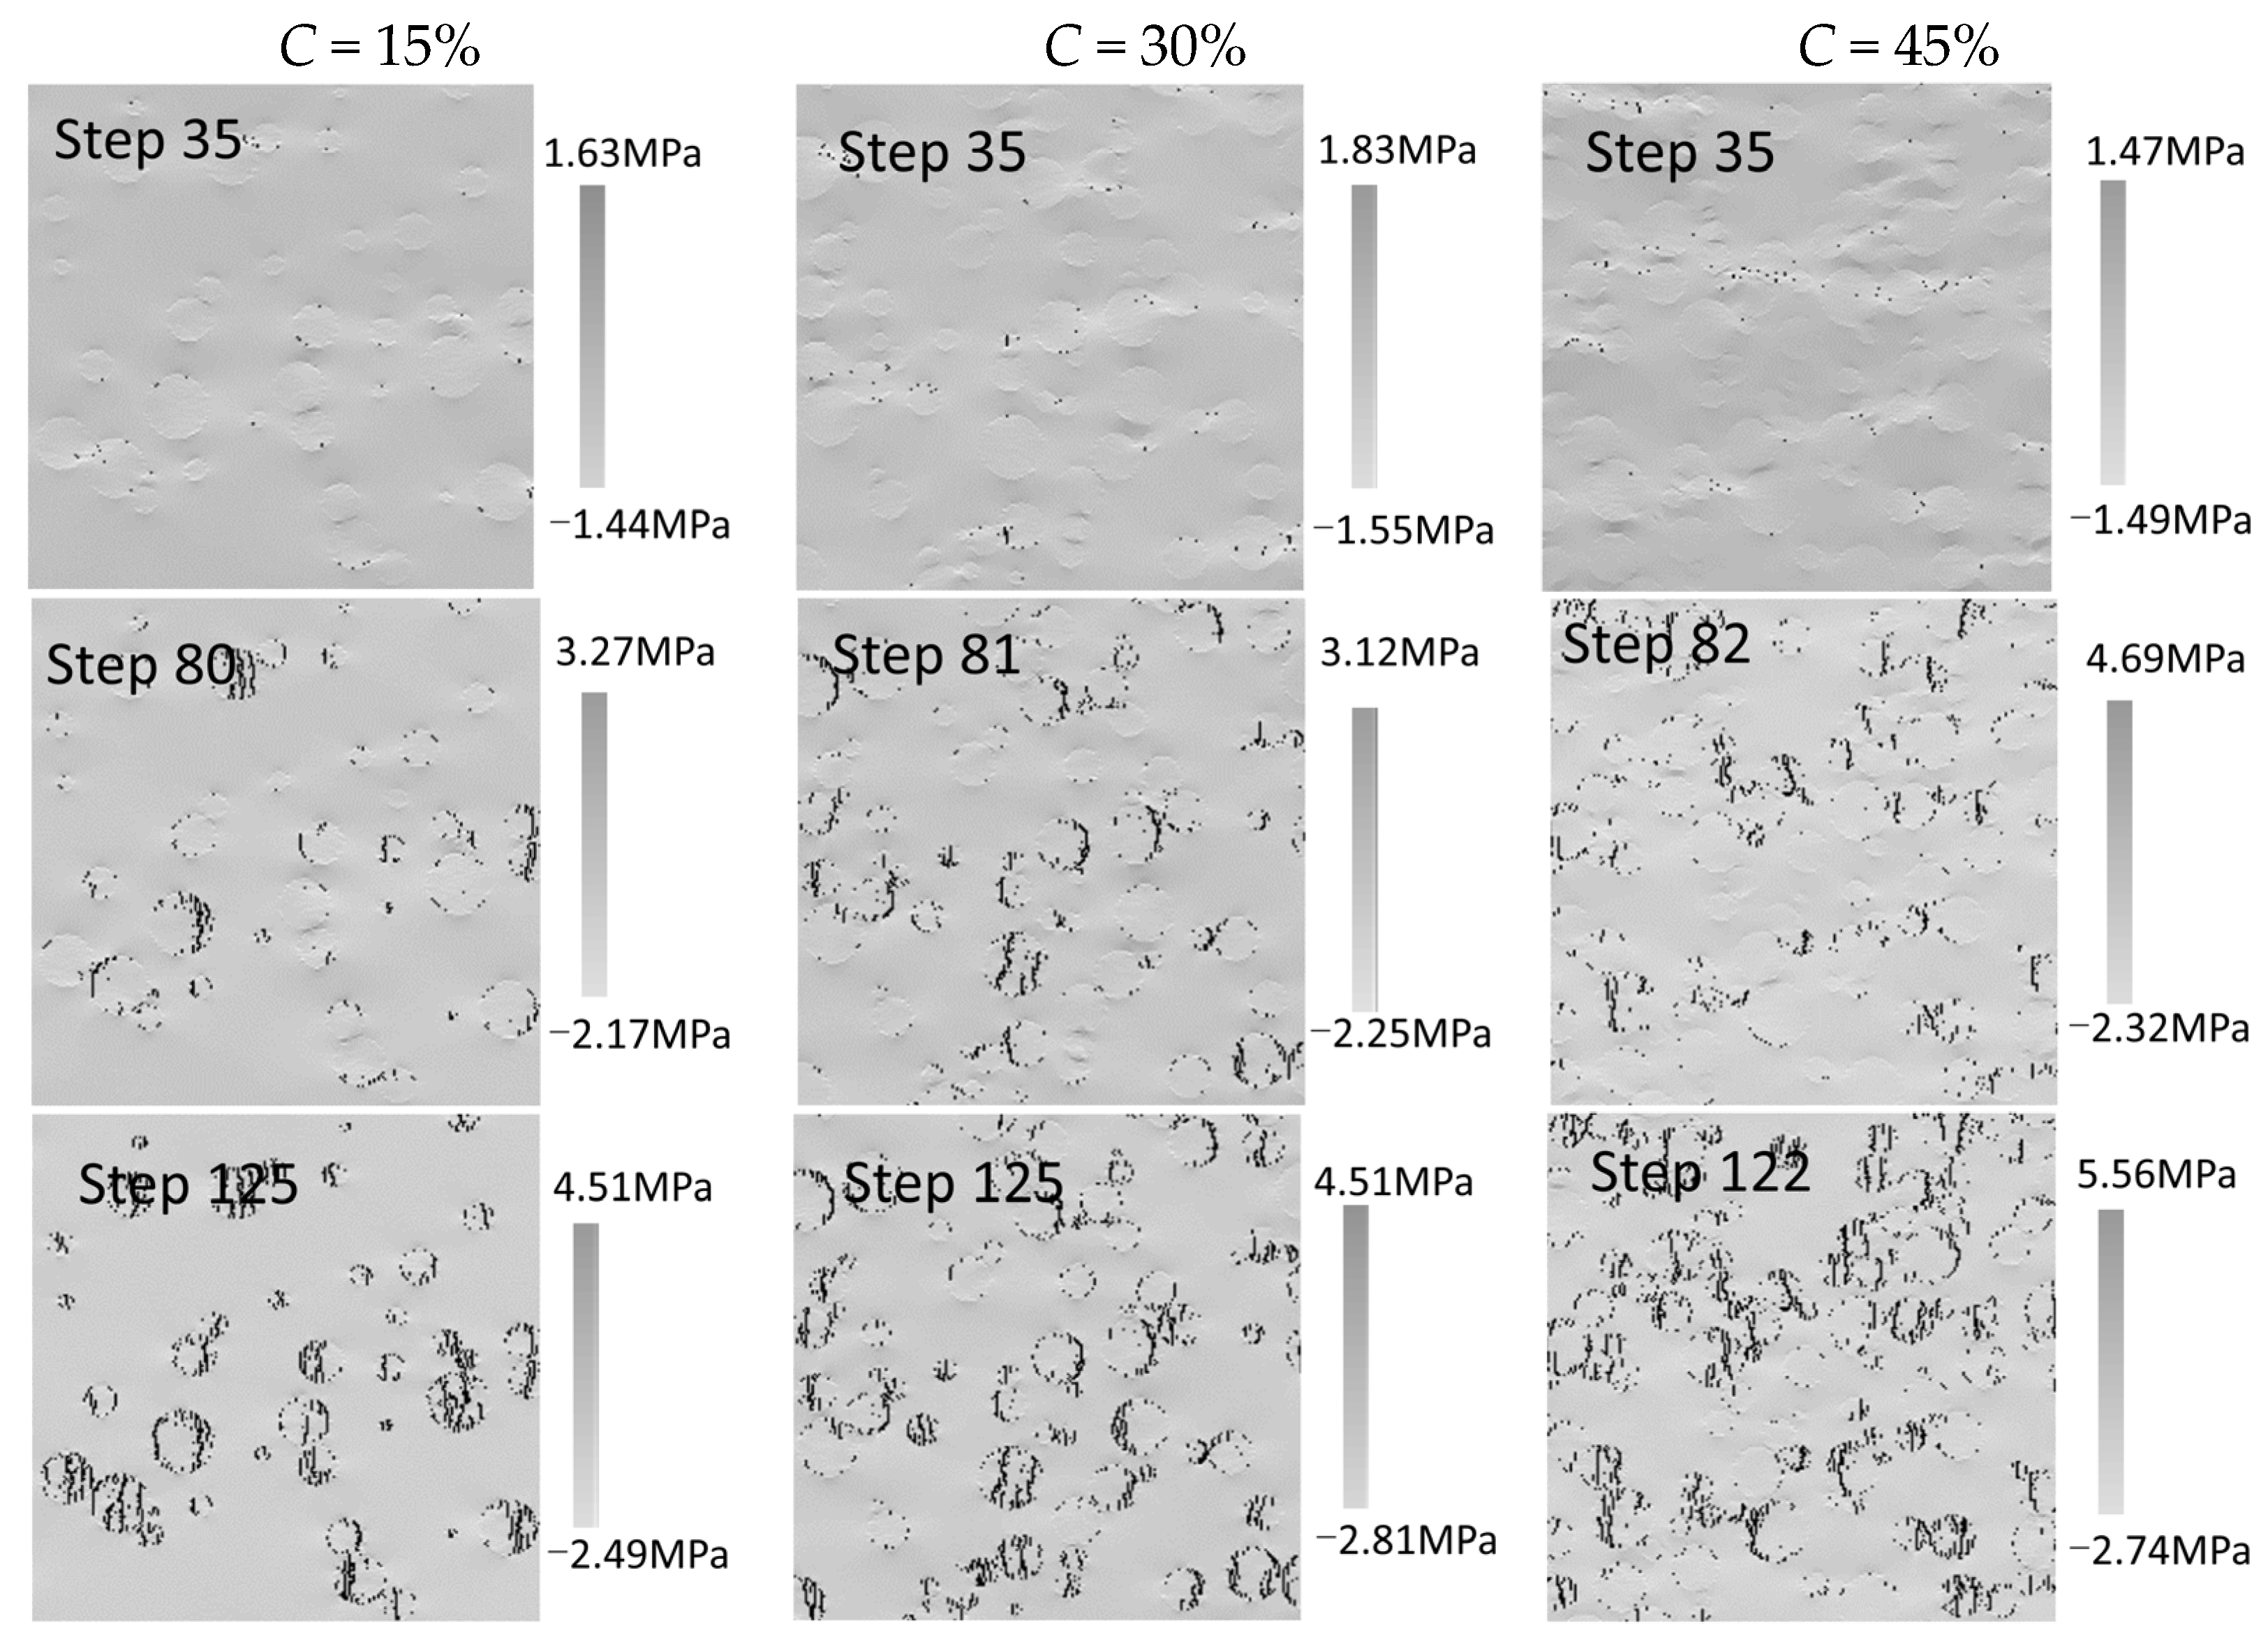
3.3. Effect of Inclusion Content on the Fracturing Behavior
4. Conclusions
- (1)
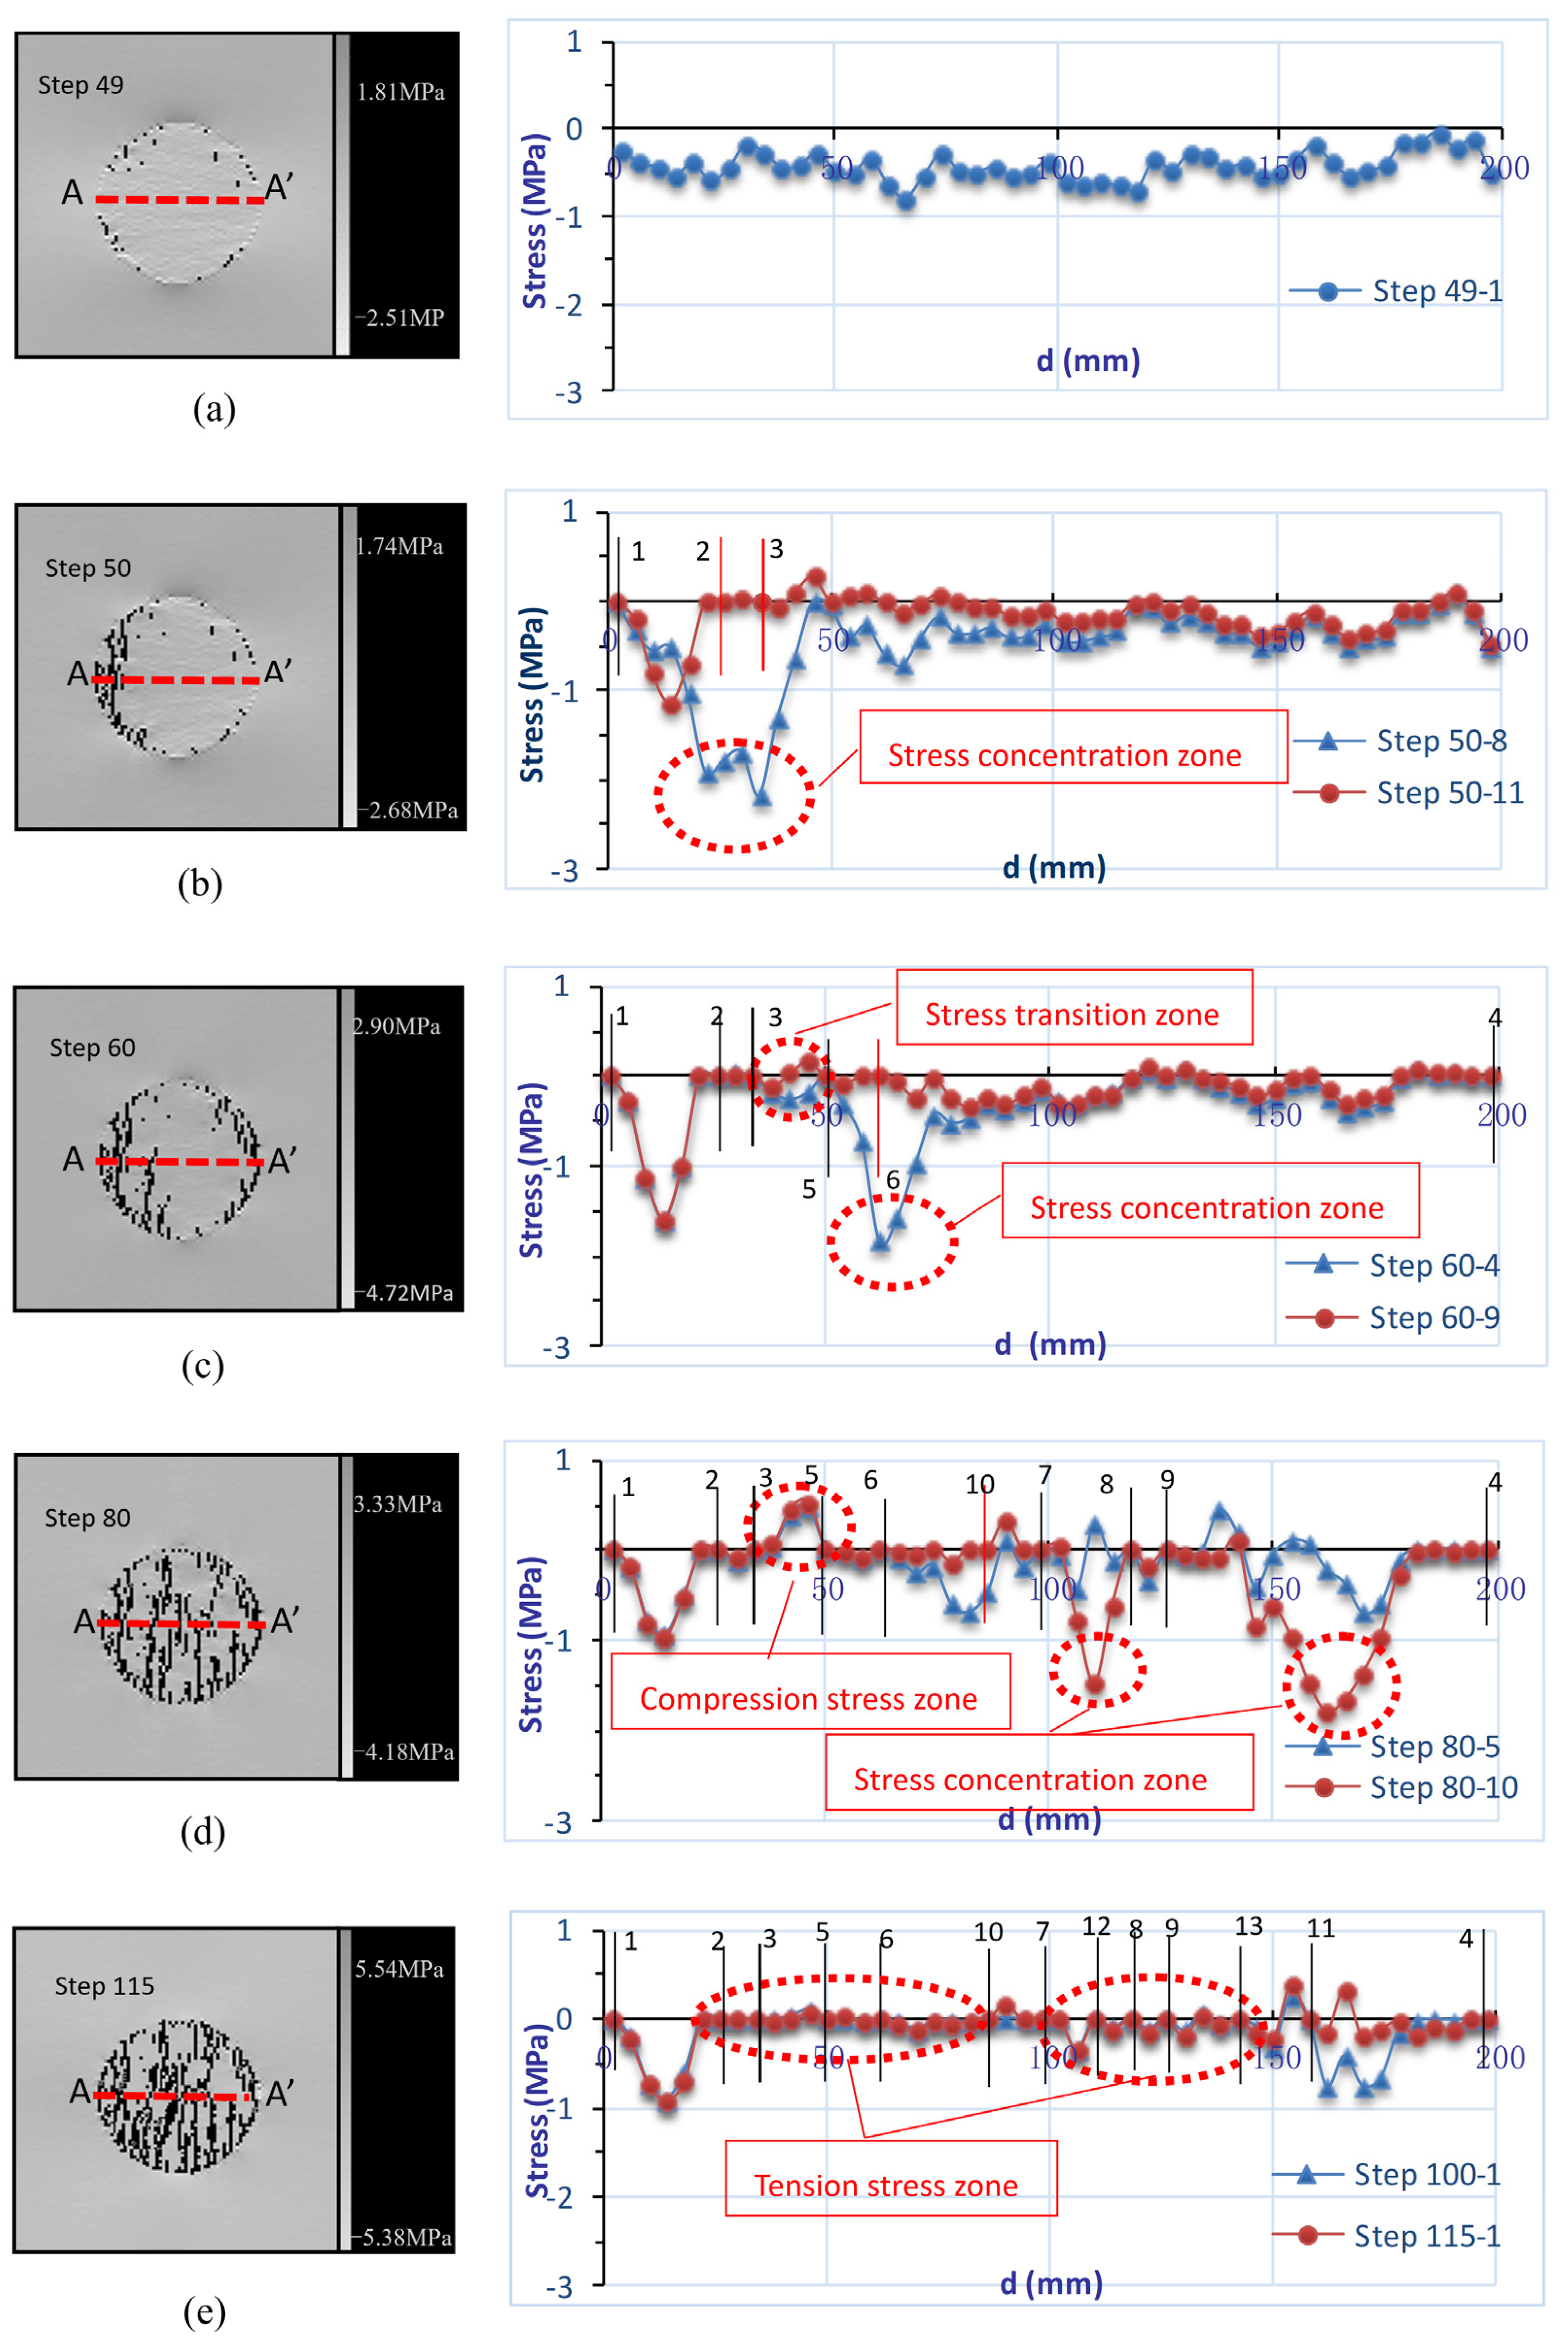
- The spacing between two existing fractures directly governs the stress redistribution during fracture filling. With the decreasing of the spacing between the adjacent fractures, the stress is firstly transferred from negative to positive, then transferred from positive to negative. When the fracture spacing reaches the critical value, the tensile stress becomes so small that the magnitude of the stress is lower than the tensile strength of the inclusion. Consequently, there are no more fractures that can be infilled between the adjacent two fractures. Numerical results provide an intuitive way to see the fracturing process and fracture-induced stress re-distribution of inclusions embedded in the rock matrix, which cannot be observed directly in the field.
- (2)
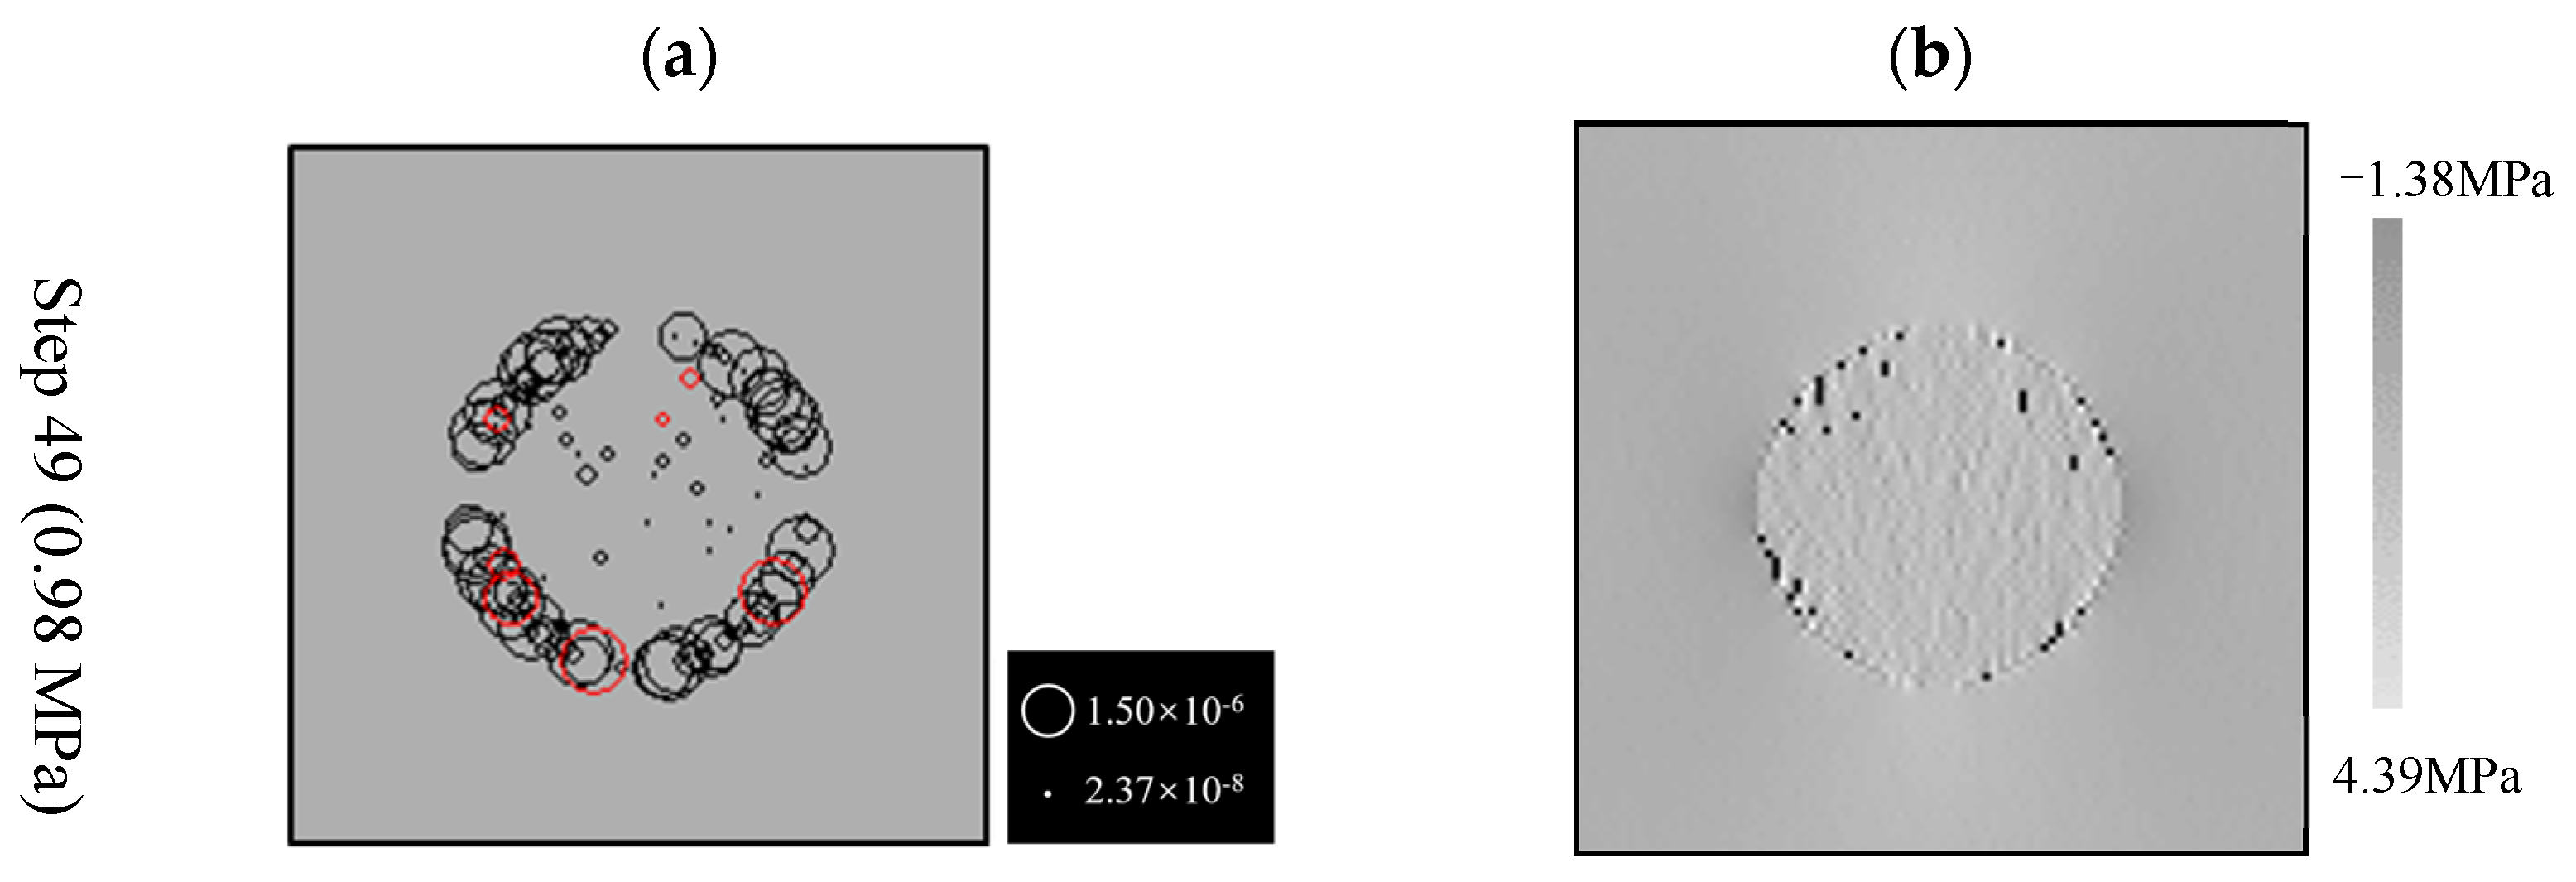
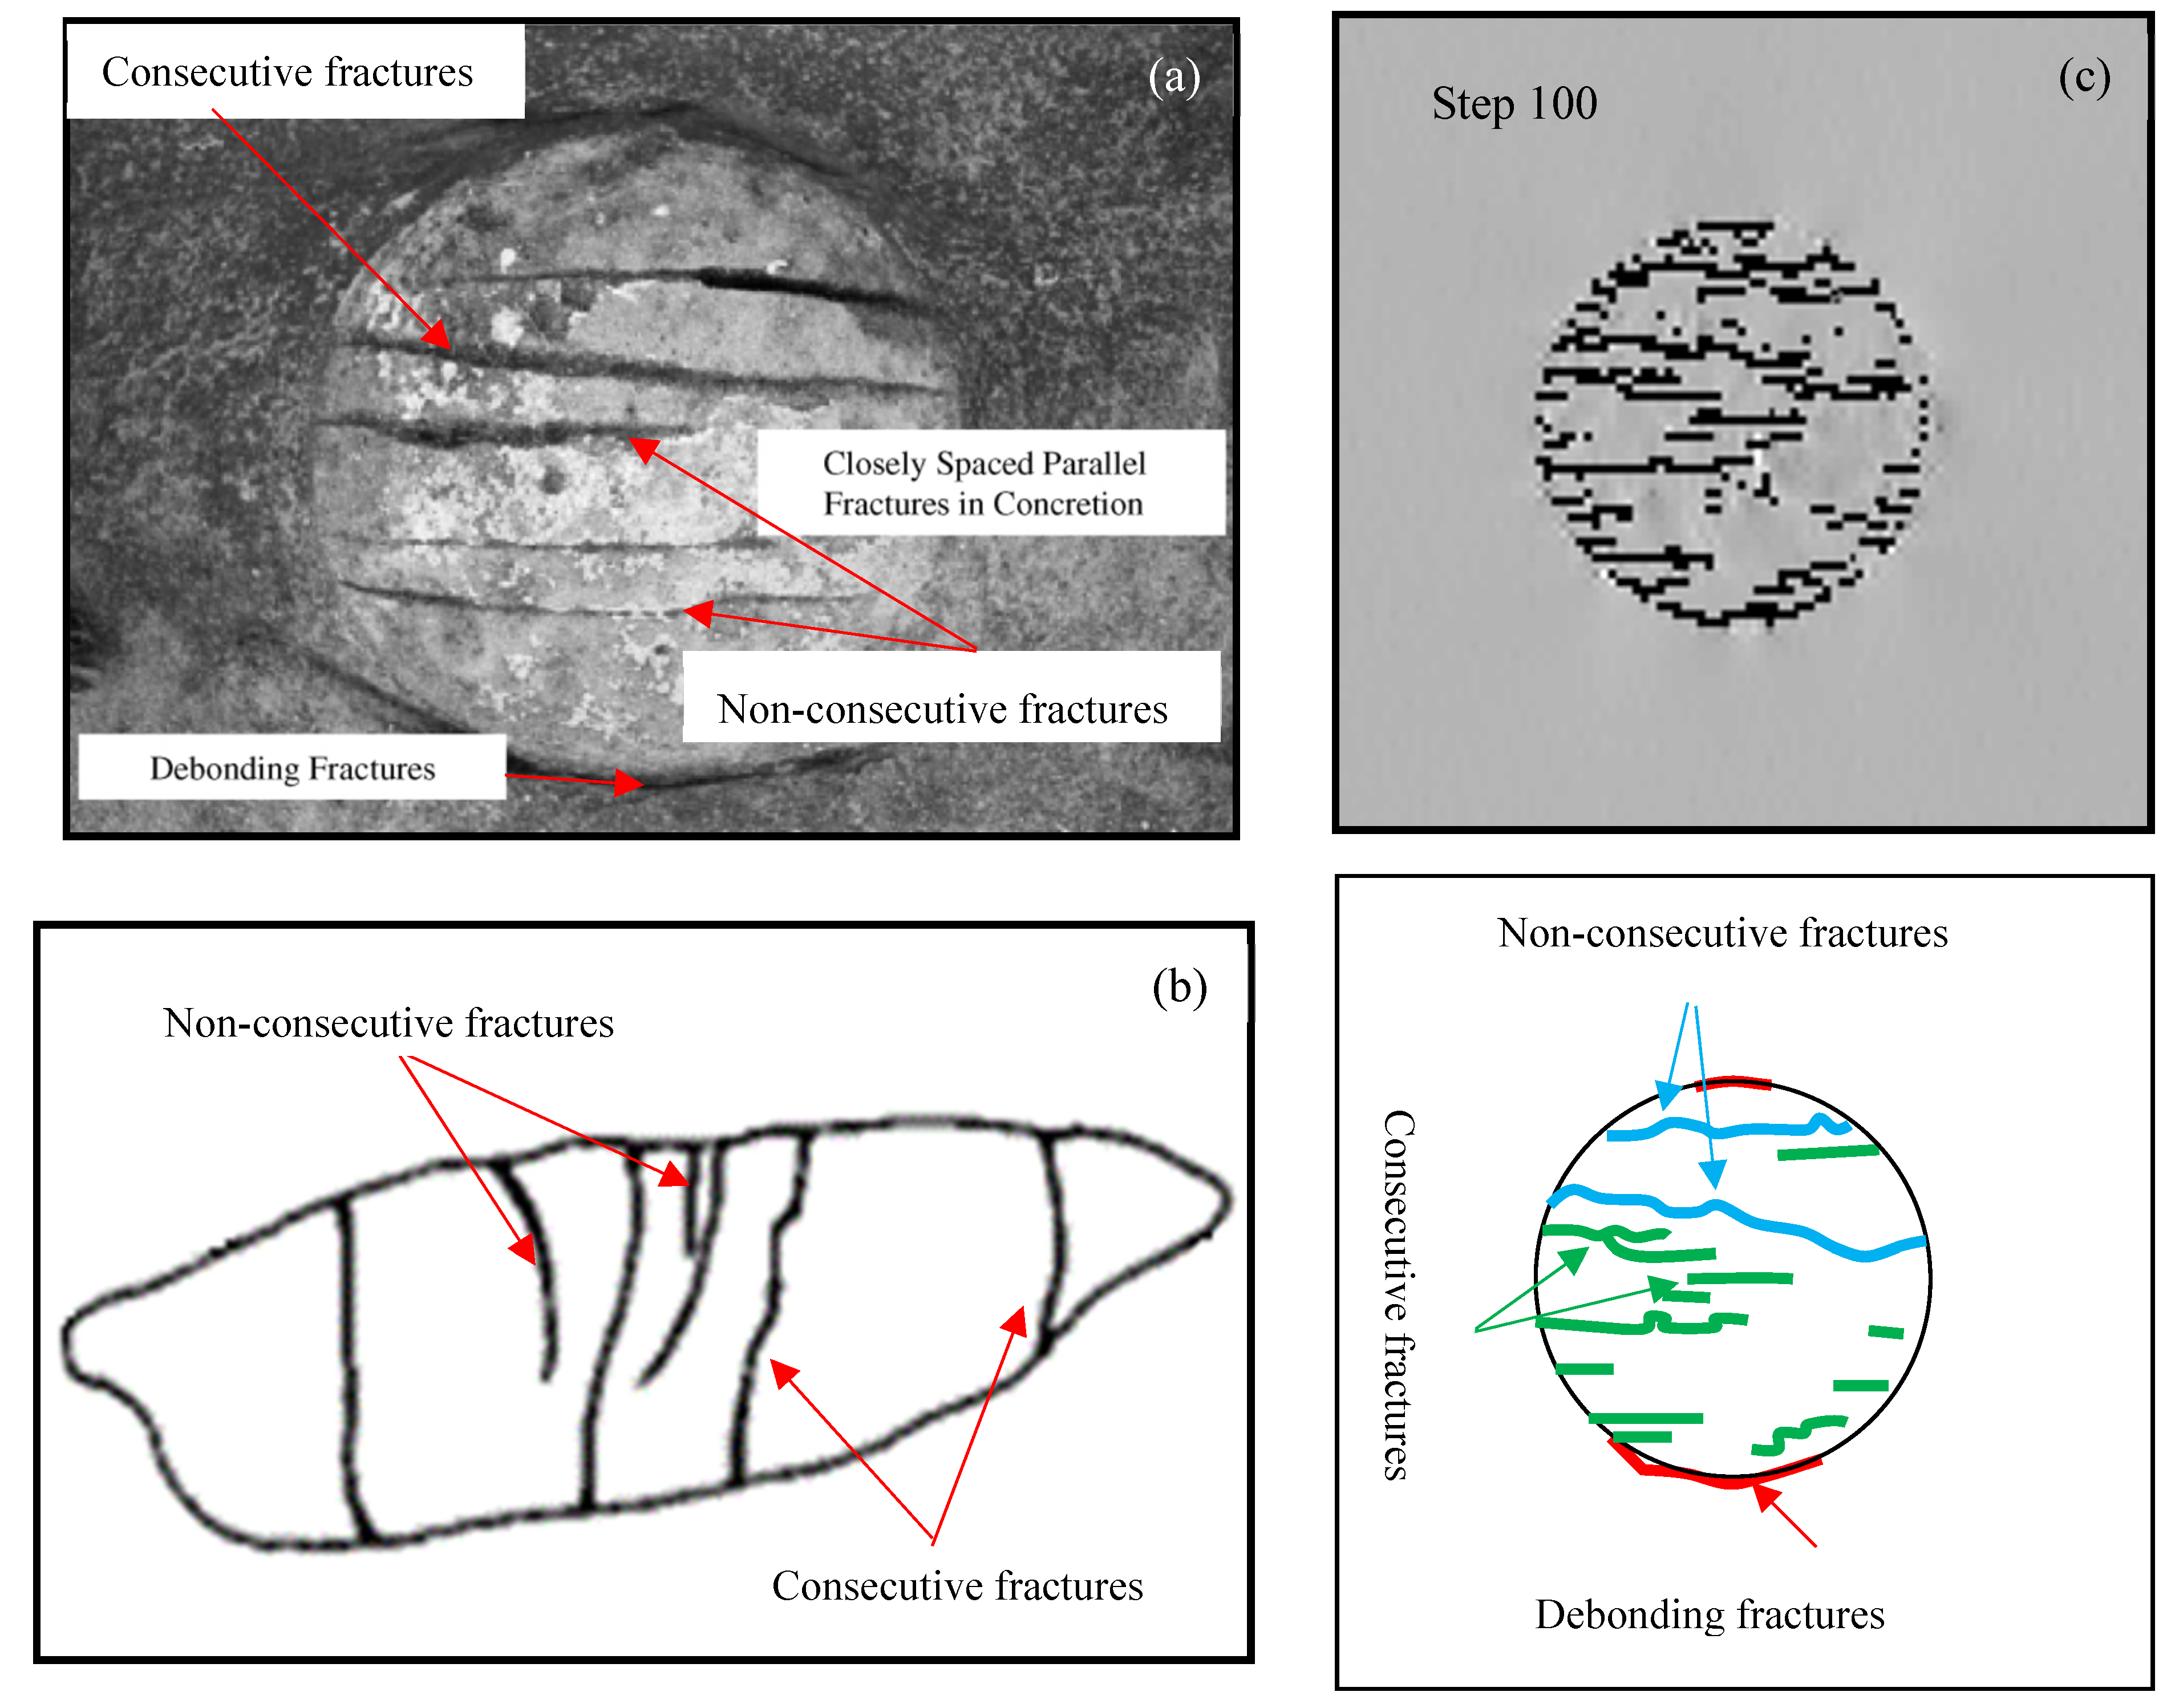
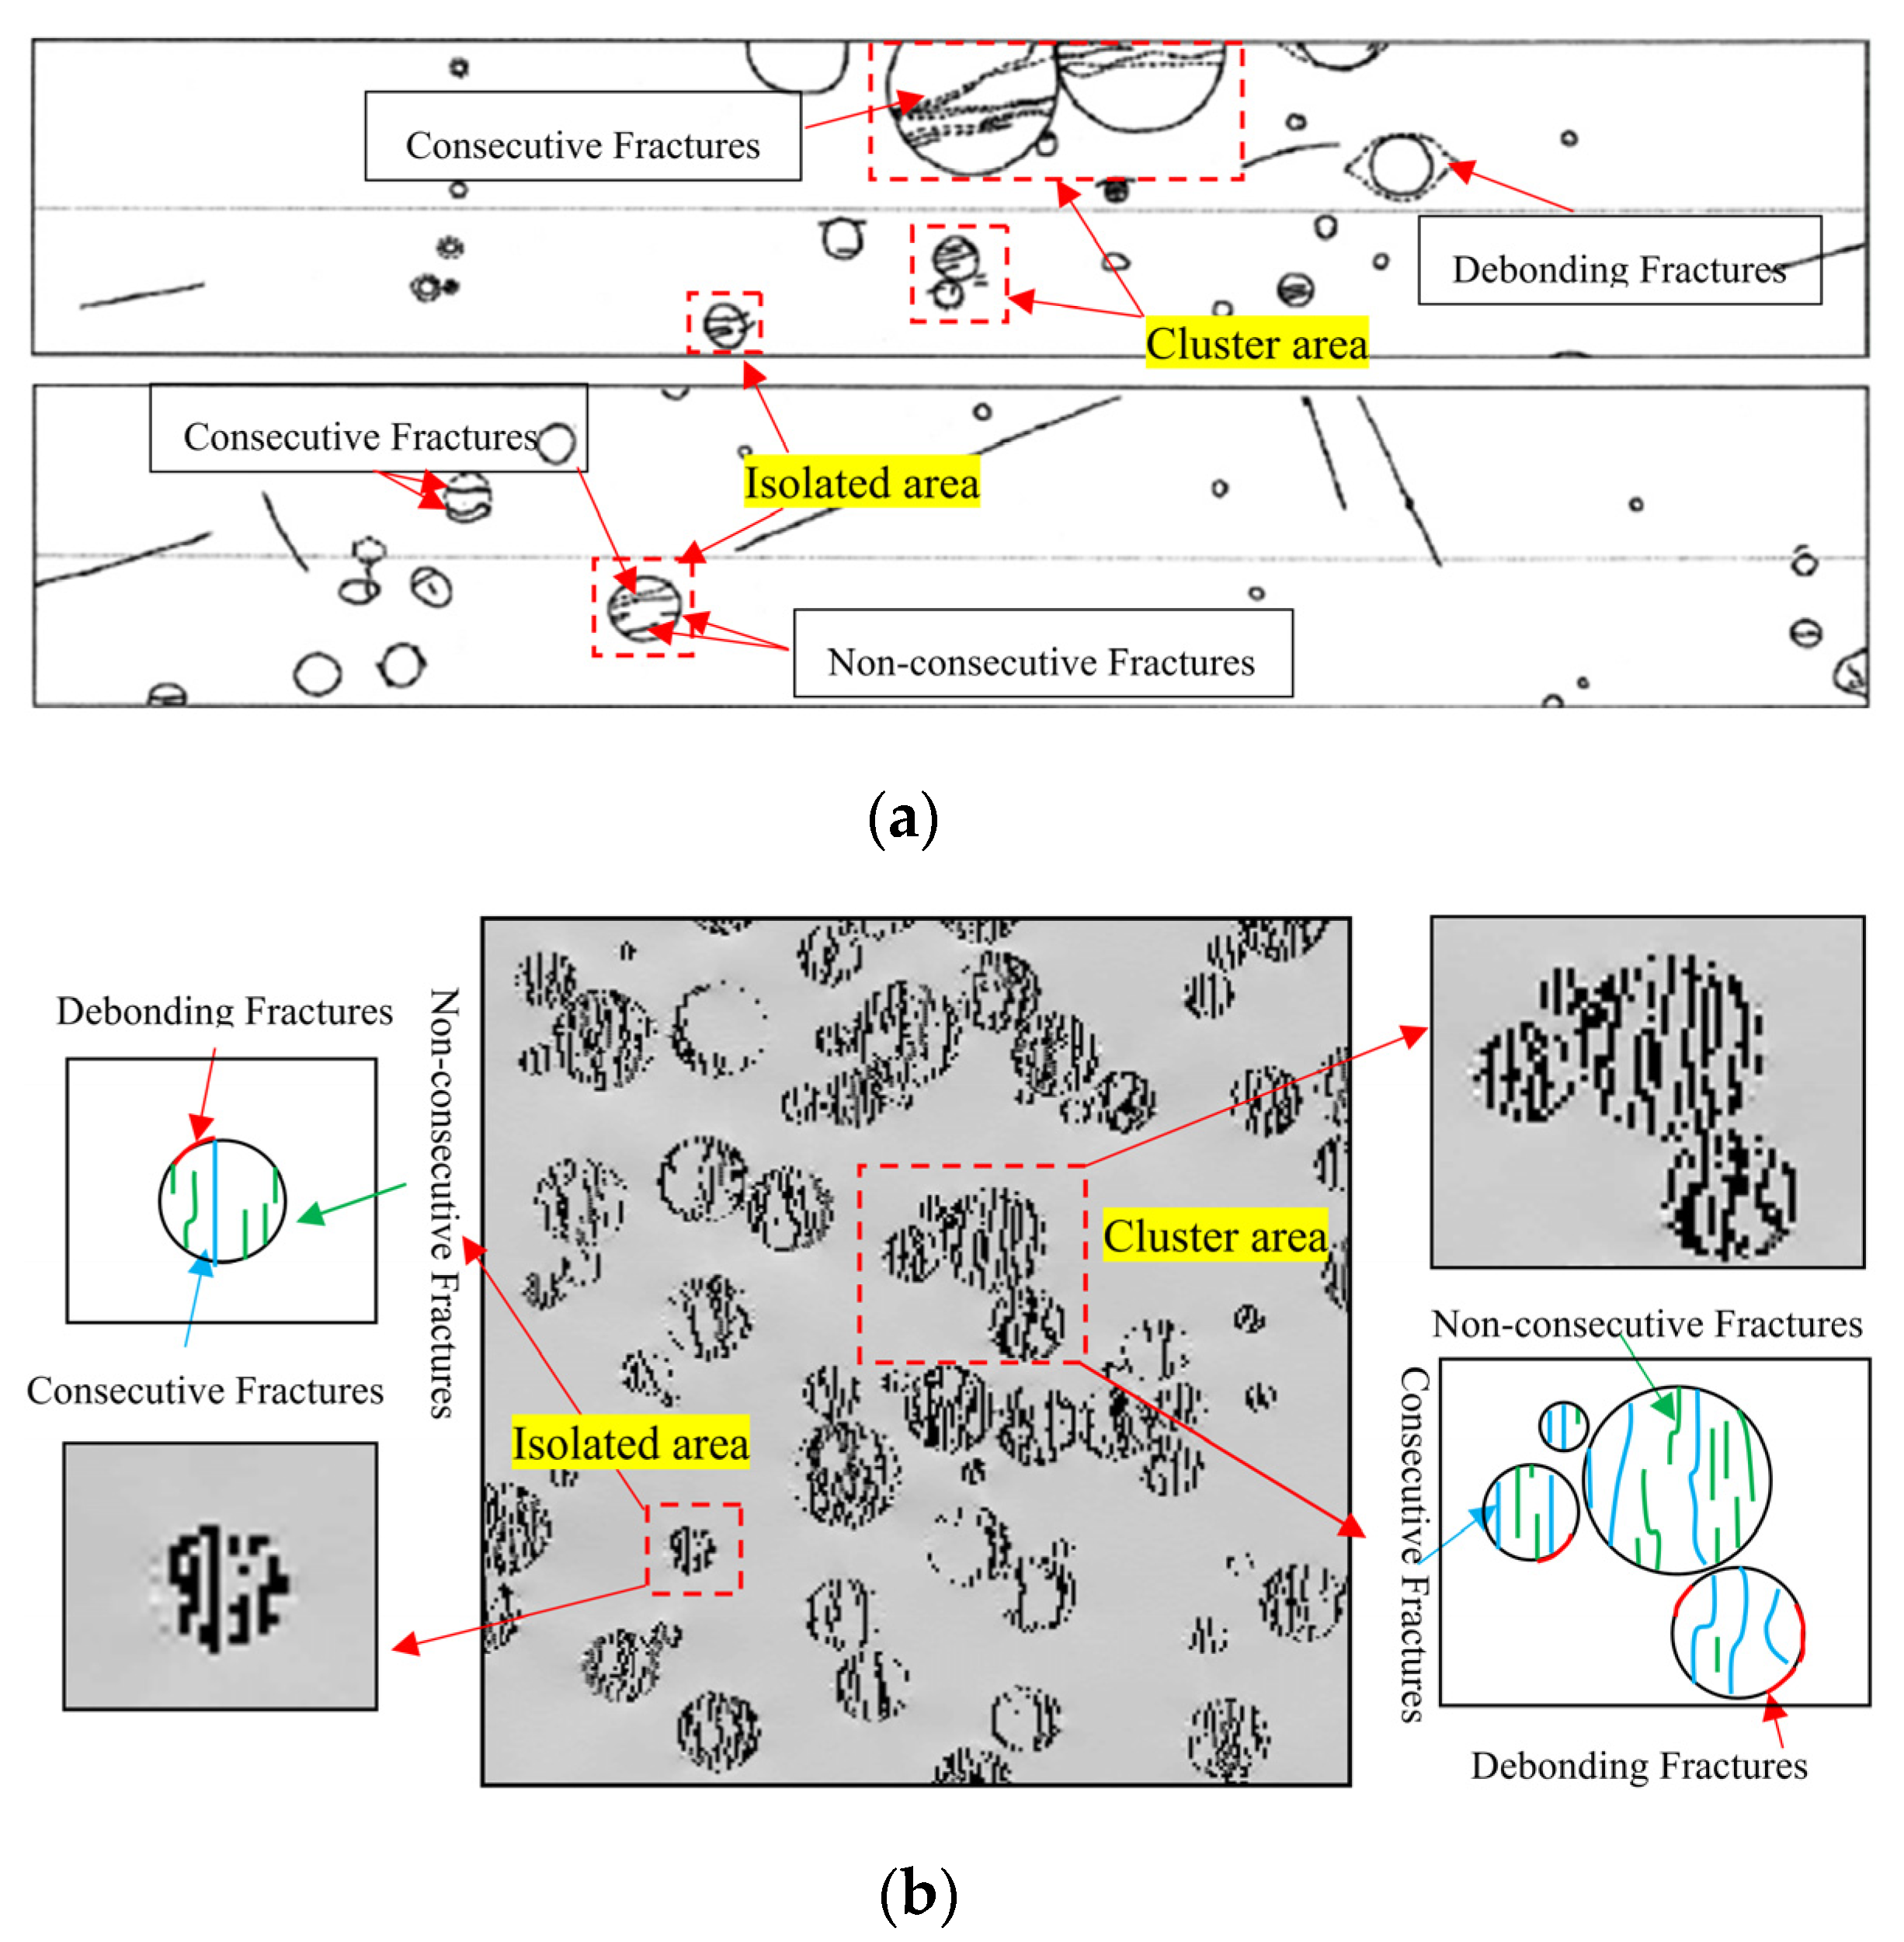
- Three types of fractures may occur in either single or multiple inclusions, i.e., consecutive, non-consecutive, and debonding fractures. However, the path of macroscopic fractures may be flexuous with small flaws such as branches because of the heterogeneity of material. Meanwhile, although the effect of heterogeneity on the stress inside inclusion is negligible, the impact of heterogeneity on fracturing mode is not negligible. Fractures typically initiate at local concentrations of tensile stress around flaws. Since flaws produce greater stress concentrations, the location of fracture initiation depends on the distribution of the flaws as well as the magnitude of maximum principal tension stress.
- (3)
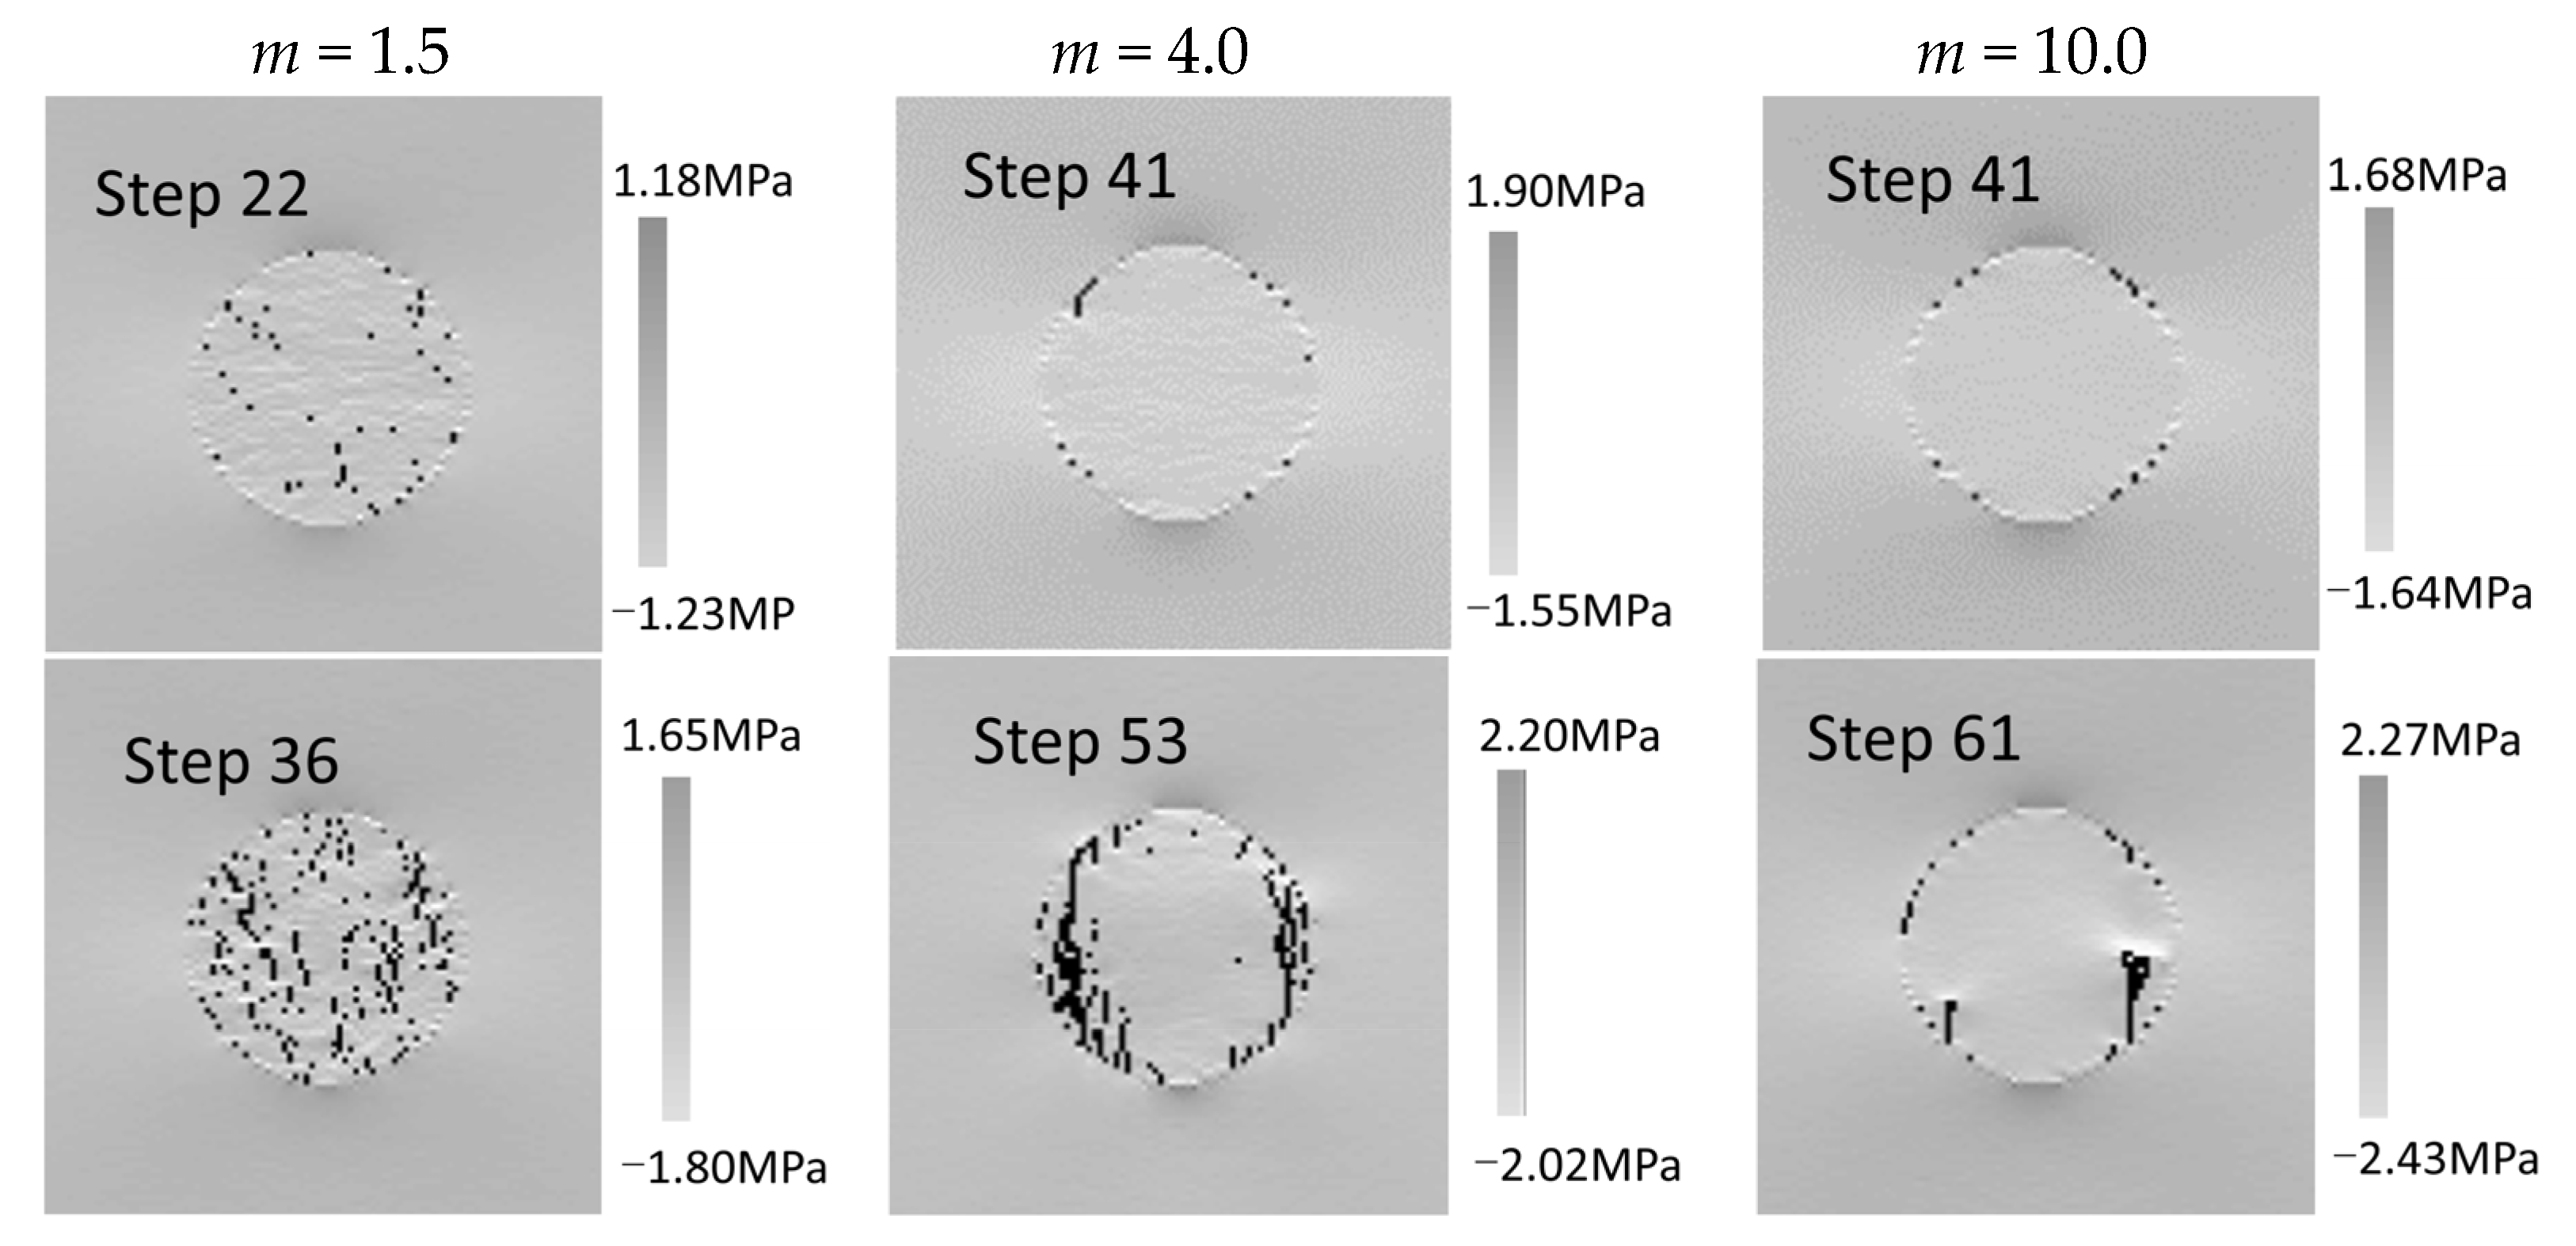
- The ratio Ei/Er affects the fracturing process of inclusions significantly. It is found that, when Ei/Er ratio is lower than 1.0, the internal fractures even the matrix failure are always the common mode, and few debonding fractures are found. Only a few numbers of consecutive and non-consecutive fractures are formed in some inclusions, even though the compressive load is relatively high. When the Ei/Er ratio is higher than 1.0, mixed fracturing modes are found. With the increasing Ei/Er ratio, a larger number of consecutive and non-consecutive fractures sub-parallel fractures are easily formed with a relatively lower compressive load.
- (4)
- The high inclusion content will enhance the disturbing and interaction between inclusions. Therefore, more scattered flaws can be found at the initial loading stage of the model containing multiple inclusions. Nevertheless, the inclusion content has no evident impact on the final fractured mode.
Author Contributions
Funding
Institutional Review Board Statement
Informed Consent Statement
Data Availability Statement
Conflicts of Interest
References
- Eidelman, A.; Reches, Z.E. Fractured pebbles—A new stress indicator. Geology 1992, 20, 307–310. [Google Scholar] [CrossRef]
- McConaughy, D.T.; Engelder, T. Joint interaction with embedded concretions: Joint loading configurations inferred from propagation paths. J. Struct. Geol. 1999, 21, 1637–1652. [Google Scholar] [CrossRef]
- Bessinger, B.; Cook, N.G.W.; Myer, L.; Nakagawa, S.; Nihei, K.; Benito, P.; Suarez-Rivera, R. The role of compressive stresses in jointing on Vancouver Island, British Columbia. J. Struct. Geol. 2003, 25, 983–1000. [Google Scholar] [CrossRef]
- Häfne, S.; Eckardt, S.; Könke, C. A geometrical inclusion-matrix model for the finite element analysis of concrete at multiple scales. In Proceedings of the 16th IKM, Weimar, Germany, 10–12 June 2003. [Google Scholar]
- Janeiro, R.P.; Einstein, H.H. Experimental study of the cracking behavior of specimens containing inclusions (under uniaxial compression). Int. J. Fract. 2010, 164, 83–102. [Google Scholar] [CrossRef]
- Eshelby, J.D. The Determination of the Elastic Field of an Ellipsoidal Inclusion, and Related Problems. Proc. R. Soc. Lond. 1957, 241, 376–396. [Google Scholar]
- Jaeger, J.C.; Cook, N.G.W. Fundamentals of rock mechanics. Third edition. Sci. Paperb. Vol. 1979, 9, 251–252. [Google Scholar]
- Quesada, D.; Leguillon, D.; Putot, C. Multiple failures in or around a stiff inclusion embedded in a soft matrix under a compressive loading. Eur. J. Mech. A Solids 2009, 28, 668–679. [Google Scholar] [CrossRef]
- Meng, C.; Pollard, D.D. Eshelby’s solution for ellipsoidal inhomogeneous inclusions with applications to compaction bands. J. Struct. Geol. 2014, 67, 1–19. [Google Scholar] [CrossRef]
- Meng, C.; Heltsley, W.; Pollard, D.D. Evaluation of the Eshelby solution for the ellipsoidal inclusion and heterogeneity. Comput. Geosci. 2012, 40, 40–48. [Google Scholar] [CrossRef]
- Tang, C. Numerical simulation of progressive rock failure and associated seismicity. Int. J. Rock Mech. Min. Sci. 1997, 34, 249–261. [Google Scholar] [CrossRef]
- Zhu, W.C.; Tang, C.A. Micromechanical Model for Simulating the Fracture Process of Rock. Rock Mech. Rock Eng. 2004, 37, 25–56. [Google Scholar] [CrossRef]
- Li, G.; Tang, C.A. A statistical meso-damage mechanical method for modeling trans-scale progressive failure process of rock. Int. J. Rock Mech. Min. Sci. 2015, 74, 133–150. [Google Scholar] [CrossRef]
- Wang, Y.Y.; Gong, B.; Tang, C.A.; Zhao, T. Numerical study on size effect and anisotropy of columnar jointed basalts under uniaxial compression. Bull. Eng. Geol. Environ. 2022, 81, 41. [Google Scholar] [CrossRef]
- Wang, Y.Y.; Gong, B.; Tang, C.A. Numerical investigation on fracture mechanisms and energy evolution characteristics of columnar jointed basalts with different model boundaries and confining pressures. Front. Earth Sci. 2021, 9, 763801. [Google Scholar] [CrossRef]
- Tang, S.B.; Tang, C.A. Crack propagation and coalescence in quasi-brittle materials at high temperatures. Eng. Fract. Mech. 2015, 134, 404–432. [Google Scholar] [CrossRef]
- Feng, X.H.; Gong, B.; Tang, C.A.; Zhao, T. Study on the non-linear deformation and failure characteristics of EPS concrete based on CT-scanned structure modelling and cloud computing. Eng. Fract. Mech. 2022, 261, 108214. [Google Scholar] [CrossRef]
- Chen, B.P.; Gong, B.; Wang, S.Y.; Tang, C.A. Research on zonal disintegration characteristics and failure mechanisms of deep tunnel in jointed rock mass with strength reduction method. Mathematics 2022, 10, 922. [Google Scholar] [CrossRef]
- Liang, Z.Z.; Gong, B.; Li, W. Instability analysis of a deep tunnel under triaxial loads using a three-dimensional numerical method with strength reduction method. Tunn. Undergr. Space Technol. 2019, 86, 51–62. [Google Scholar] [CrossRef]
- Weibull, W. The Phenomenon of Rupture in Solids; Generalstabens Litografiska Anstalts Förlag: Stockholm, Sweden, 1939. [Google Scholar]
- Basu, B.; Tiwari, D.; Kundu, D.; Prasad, R. Is Weibull distribution the most appropriate statistical strength distribution for brittle materials? Ceram. Int. 2009, 35, 237–246. [Google Scholar] [CrossRef]
- Li, L.C.; Tang, C.A.; Fu, Y.F. Influence of heterogeneity on fracture behavior in multi-layered materials subjected to thermo-mechanical loading. Comput. Mater. Sci. 2009, 46, 667–671. [Google Scholar] [CrossRef]
- Li, G.; Wang, K.; Gong, B.; Tao, Z.G.; Du, K. A multi-temporal series high-accuracy numerical manifold method for transient thermoelastic fracture problems. Int. J. Solids Struct. 2021, 230–231, 111151. [Google Scholar] [CrossRef]
- Gong, B.; Wang, S.Y.; Sloan, S.W.; Shen, D.C.; Tang, C.A. Modelling rock failure with a novel continuous to discontinuous method. Rock Mech. Rock Eng. 2019, 52, 3183–3195. [Google Scholar] [CrossRef]
- Gong, B.; Tang, C.A.; Wang, S.Y.; Bai, H.M.; Li, Y.C. Simulation of the nonlinear mechanical behaviors of jointed rock masses based on the improved discontinuous deformation and displacement method. Int. J. Rock Mech. Min. Sci. 2019, 122, 104076. [Google Scholar] [CrossRef]
- Liang, Z.Z.; Gong, B.; Wu, X.K.; Zhang, Y.B.; Tang, C.A. Influence of principal stresses on failure behavior of underground openings. Chin. J. Rock Mech. Eng. 2015, 34, 3176–3187. [Google Scholar]
- Bai, T.; Pollard, D.D. Fracture spacing in layered rocks: A new explanation based on the stress transition. J. Struct. Geol. 2000, 22, 43–57. [Google Scholar] [CrossRef]
- Bai, T.; Pollard, D.D.; Gao, H. Explanation for fracture spacing in layered materials. Nature 2000, 403, 753. [Google Scholar] [CrossRef] [PubMed]
- Bao, C.; Tang, C.A.; Cai, M.; Tang, S. Spacing and failure mechanism of edge fracture in two-layered materials. Int. J. Fract. 2012, 181, 241–255. [Google Scholar] [CrossRef]
- Li, L.C.; Tang, C.A.; Wang, S.Y. A Numerical Investigation of Fracture Infilling and Spacing in Layered Rocks Subjected to Hydro-Mechanical Loading. Rock Mech. Rock Eng. 2012, 45, 753–765. [Google Scholar] [CrossRef]
- Tang, C.A.; Liang, Z.Z.; Zhang, Y.B.; Chang, X.; Tao, X.; Wang, D.G.; Zhang, J.X.; Liu, J.S.; Zhu, W.C.; Elsworth, D. Fracture spacing in layered materials: A new explanation based on two-dimensional failure process modeling. Am. J. Sci. 2008, 308, 49–72. [Google Scholar] [CrossRef]
- Gong, B.; Wang, Y.Y.; Zhao, T.; Tang, C.A.; Yang, X.Y.; Chen, T.T. AE energy evolution during CJB fracture affected by rock heterogeneity and column irregularity under lateral pressure. Geomat. Nat. Hazards Risk 2022, 13, 877–907. [Google Scholar] [CrossRef]
- Wu, N.; Liang, Z.Z.; Zhang, Z.H.; Li, S.H.; Lang, Y.X. Development and verification of three-dimensional equivalent discrete fracture network modelling based on the finite element method. Eng. Geol. 2022, 306, 106759. [Google Scholar] [CrossRef]
- Tang, C.A.; Xu, X.H.; Kou, S.Q.; Lindqvist, P.A.; Liu, H.Y. Numerical investigation of particle breakage as applied to mechanical crushing—Part I: Single-particle breakage. Int. J. Rock Mech. Min. Sci. 2001, 38, 1147–1162. [Google Scholar] [CrossRef]


| Parameters | Inclusion | Matrix |
|---|---|---|
| Homogeneity index (m) | 100 | 100 |
| Young’s modulus (E)I/GPa | 100 | 5 |
| Uniaxial compressive strength(fc0)/MPa | 50 | 100 |
| Tensile strength (ft0)/MPa | 2.5 | 10 |
| Poisson ratio (ν) | 0.25 | 0.25, 0.3, 0.35, 0.4, 0.45, 0.5 |
| Friction angle (φ)/° | 30 | 30 |
| Parameters | Inclusion | Matrix |
|---|---|---|
| Homogeneity index (m) | 1.5, 2, 3, 4, 6, 8, 10, 15, 20 | 1.5, 2, 3, 4, 6, 8, 10, 15, 20 |
| Young’s modulus (E)/GPa | 5, 50, 100, 150 | 2, 5, 50, 150 |
| Uniaxial compressive strength (fc0)/MPa | 50 | 100 |
| Tensile strength (ft0)/MPa | 2.5 | 10 |
| Poisson’s ratio (ν) | 0.25 | 0.45 |
| Friction angle (φ)/° | 30 | 30 |
| Parameters | Inclusion | Matrix |
|---|---|---|
| Homogeneity index (m) | 3 | 20 |
| Elastic modulus (E)/GPa | 3, 5, 20, 50, 100 | 2, 5, 20, 100, 150 |
| Uniaxial compressive strength (fc0)/MPa | 50 | 100 |
| Tensile strength (ft0)/MPa | 2.5 | 10 |
| Poisson’s ratio (ν) | 0.25 | 0.45 |
| Friction angle (φ)/° | 30 | 30 |
Publisher’s Note: MDPI stays neutral with regard to jurisdictional claims in published maps and institutional affiliations. |
© 2022 by the authors. Licensee MDPI, Basel, Switzerland. This article is an open access article distributed under the terms and conditions of the Creative Commons Attribution (CC BY) license (https://creativecommons.org/licenses/by/4.0/).
Share and Cite
Yu, C.; Gong, B.; Wu, N.; Xu, P.; Bao, X. Simulation of the Fracturing Process of Inclusions Embedded in Rock Matrix under Compression. Appl. Sci. 2022, 12, 8041. https://doi.org/10.3390/app12168041
Yu C, Gong B, Wu N, Xu P, Bao X. Simulation of the Fracturing Process of Inclusions Embedded in Rock Matrix under Compression. Applied Sciences. 2022; 12(16):8041. https://doi.org/10.3390/app12168041
Chicago/Turabian StyleYu, Chaoyun, Bin Gong, Na Wu, Penglei Xu, and Xiankai Bao. 2022. "Simulation of the Fracturing Process of Inclusions Embedded in Rock Matrix under Compression" Applied Sciences 12, no. 16: 8041. https://doi.org/10.3390/app12168041
APA StyleYu, C., Gong, B., Wu, N., Xu, P., & Bao, X. (2022). Simulation of the Fracturing Process of Inclusions Embedded in Rock Matrix under Compression. Applied Sciences, 12(16), 8041. https://doi.org/10.3390/app12168041