Article

Temperature Sensing with Thin Films of Flame-Formed Carbon Nanoparticles

1
Istituto di Scienze e Tecnologie per l’Energia e la Mobilità Sostenibili, Consiglio Nazionale Delle Ricerche, STEMS-CNR, 80125 Napoli, Italy
2
Dipartimento di Ingegneria Chimica, dei Materiali e della Produzione Industriale, DICMAPI Università degli Studi di Napoli Federico II, 80125 Napoli, Italy
3
Dipartimento di Fisica “Ettore Pancini”, Università Degli Studi di Napoli Federico II, Via Cintia, 80126 Napoli, Italy
4
Task Force di Bioelettronica, Università degli Studi di Napoli Federico II, Via Cintia, 80126 Napoli, Italy
*
Authors to whom correspondence should be addressed.
Appl. Sci. 2022, 12(15), 7714; https://doi.org/10.3390/app12157714
Submission received: 30 June 2022 / Revised: 26 July 2022 / Accepted: 27 July 2022 / Published: 31 July 2022

Abstract

:
A porous nanostructured film of flame-formed carbon nanoparticles has been produced with a one-step procedure. The morphological and structural characteristics of the film have been characterized by atomic force microscopy and Raman spectroscopy. The electrical resistance as a function of the temperature has been investigated in the range from ambient temperature to 120 °C. A nonmetallic behavior has been observed, with a monotonic decrease of the film resistance as temperature increases. Electrical conduction is explained in terms of charge carriers tunneling and percolation between the carbon grains and is not perfectly described by an Arrhenius behavior. A negative temperature coefficient of resistance (TCR) of the order of −100 × 10−4 K−1 has been measured. The high absolute TCR value, together with the ease of material microfabrication processing and biocompatibility of the carbon material make this film ideal for temperature sensing in many environments. A functional relationship between resistance and temperature, which is necessary for practical applications, has been finally derived. A very good agreement between experimental data and fit is obtained with a fifth order polynomial.

1. Introduction

The development of cost-competitive and sustainable advanced nanomaterials is an essential part of the solution to the challenges of the 21st century regarding circular strategies. In this scenario, carbon nanomaterials can play an important role in the development of light sensors and a reduction of the environmental impact.
Advanced carbon materials are very promising functional materials because of their good electrical conductivity, high chemical and thermal stability and low toxicity. Based on these unique features, their exploitation is increasing in various applications, such as flexible/stretchable sensors for wearable electronics [1,2], energy storage [3], sensors [4], and smart biotechnology [5,6,7], just to mention a few.
Besides the new forms of carbon nanostructures such as graphene, fullerene and nanotubes, applications of highly porous carbon structures are also emerging [8]. Novel materials made of carbon spheres, integrating the advantages of carbon materials with spherical colloids, present unique features such as regular geometry, tunable porosity and well-defined particle size distribution [9].
Carbon nanoparticles form spontaneously in fuel-rich flames. This is at the base of well-established methods of carbon materials production, such as carbon black [10,11], fullerenes [12], carbon nanotubes [13], graphitic nanofibers [14] and graphene [15]. Additionally, in recent years, interest in candle soot [16] and waste soot [17] applications has also been growing.
Soot particles are often subject to pre- or post-deposition treatments to improve specific properties [18], such as heat treatments for making soot more conductive [19] or chemical methods for surface functionalization [20]. However, untreated soot, and in particular, the nanoparticles formed at the inception and early growth stages present very interesting properties.
At inception of the formation process, carbon nanoparticles are made of large polyaromatic molecules, PAHs, that aggregate through van der Waals forces and chemical cross-linking [21,22,23] to form particles. These molecular constituents have been recently visualized by high resolution atomic force microscopy [24]. While most of them are pericondensed PAHs made of benzenoid-fused rings, aromatics containing five-member rings as well as persistent radicals have also been observed [25,26]. These particles, also named nucleation or incipient particles, are 2–3 nm in size [24,25,26]; X-ray photoelectron spectroscopy (XPS) confirmed the presence of oxygen [27,28,29], and the optical and electronic properties have been recently demonstrated to be size-dependent [30] exhibiting a quantum dot behavior [31]. With a longer residence time in flame, particles grow by coagulation and heterogeneous surface reactions. In this way, a micron-size chain-like aggregate made of 10–50 nm large primary particles can be formed [32]. Therefore, with a suitable choice of the flame synthesis parameters and a fine setting of the flame reactor, carbon nanoparticles (CNPs) with tunable properties, such as fraction of amorphous versus graphitic-like phase, size, optical and electronic properties, can be produced [30,31,32,33].
For practical applications, the correct handling of particle self-assembly into a uniform film with precise control of chemical and physical properties is very important and it poses a significant challenge. Thermophoretic sampling [34] is a particularly interesting method to produce thin films for sensing [35] or other applications [36] relying on nanostructured, self-assembled films. The thermophoretic force drives the particles from the hot flame towards a cold substrate inserted into the flame [33]. The resulting ballistic-like deposition mechanism produces a nanostructured film with a porous, fractal self-affine topology [33] made of grains and voids, whose properties depend on the properties of the original particles and the deposition time. The obtained film porosity and high surface area are ideal for gas sensing applications [37].
Films of CNPs exhibit good conductivity that depends on the carbon particles composition and the film structure. The conduction mechanism exploits tunneling and percolation of the charge carriers among the grains [27], such that the film conductivity depends on the temperature and inter-grain distance. Considering that the tunnel coupling effect has an intrinsically exponential dependence on the inter-grain distance, granular conductors were found to be suitable materials for strain-sensing [38]. However, since both charge carriers and inter-grain distance depend on temperature, films of CNPs are also expected to be very sensitive to temperature variation.
In this context, we aim to develop cost-effective temperature sensors based on safe materials for the environment. Our process is a simple, one-step procedure, which does not make use of solvents nor toxic substances. The material under investigation is produced by flame synthesis of carbon nanoparticles. Their self-assembly in a nanostructured film is obtained by thermophoretic deposition on a cold substrate inserted into a flame. The dependence of the film’s electrical conduction from the temperature is investigated.

2. Materials and Methods

Carbon particles are produced in an atmospheric pressure laminar premixed ethylene-air flame stabilized on a water-cooled sintered bronze McKenna burner having a diameter of 6 cm. The cold gas velocity was set at 9.8 cm/s and the carbon to oxygen (C/O) atomic ratio was 0.77 (flame equivalence ratio Φ = 2.33). In particular, the air and ethylene flow rates sent to the burner are 1.875 and 2.051 Nl/min, respectively.
Particles were collected from the flame and deposited on the electrode substrate by in situ thermophoretic sampling performed via rapid insertion of the substrate in flame (at a height above the burner of Z = 10 mm) by means of a pneumatic actuator. This method relies on the thermophoretic force to drive particles from the hot flame environment toward the cold substrate where they impact and deposit. The insertion time was set to 100 ms to minimize the heating of the substrate. The heating would reduce thermophoretic forces and thus collection efficiency, and it would also modify particle structure and composition by thermal effects. To collect enough material, multiple insertions (up to 40) were operated. The total deposition time was tdep = 4 s. The synthesis parameters were chosen on the basis of previous studies, where the dependence of the film conductivity as a function of the flame parameters and the film thickness was investigated [33,39]. The process was optimized to obtain high resistivity films. That allowed us to neglect self-heating effects due to the low current flowing into the sensor.
The substrates were thin-film InterDigitated gold electrodes (IDE, MICRUX ED-IDE1-Au). The electrodes have a channel length (L) equal to 10 μm and a total width (W) of 490 mm, thus having a width to length ratio (W/L) of 49,000.
The synthesis technique allows the depositing of the film on a variety of substrates and with arbitrary shapes. That paves the way to embed temperature sensors in a variety of commercial products where temperature analysis is required.
The morphological and structural characterization of the samples were obtained by Raman spectroscopy and atomic force microscopy (AFM).
Raman spectroscopy measurements of the carbonaceous thin film deposited on the InterDigitated electrode substrates were performed by a Raman microscope (model Xplora, from Horiba, Kyoto, Japan) equipped with a 100 × 0.9 NA objective lens. The wavelength of the laser beam was 532 nm and the power was reduced to less than 1 mW to avoid damaging the sample. Film morphology was visualized with a scanning probe microscope (model NTEGRA, from NT-MDT, Apeldoorn, The Netherlands) equipped with supersharp silicon probes (model SSS-NCHR, from NANOSENSORSTM, Neuchatel, Switzerland) operated in semi-contact mode in air.
For the thermal analysis, the sample was placed in a Linkam HFS600E-PB4 heating stage equipped with electrical probes and the T95 controller system. Electrical measurements were performed by a Source Measure Unit (SMU) (model ×200, from Ossila Ltd., Sheffield, UK).

3. Results and Discussion

The morphology of the CNP film was investigated by AFM. Figure 1a shows the acquired image of a continuous granular film with the grain size of the order of 200 nm.
The AFM image reproduces the topological map of the deposited material on a sample area of 4 × 4 μm2. The maximum height of the film was 350 nm, so the volume of the parallelepiped where all the particles are contained is 5.6 μm3. The integral of the height profile over the base area gives the volume occupied by the particles. The ratio between this integral and the volume of the parallelepiped is the volume fraction occupied by the carbon film; the complement to 1 is the void fraction.
The distribution of the heights as obtained from the “Roughness analysis” tool in the AFM software is shown in Figure 1b. The void fraction of the film was φ = 0.56.
As discussed in detail in [39], for a thermophoretically deposited film, the thickness, δ, is expressed by:
δ = N p v t h 1 φ π 6 D p 3 t d e p
where Np and Dp are the number and average diameter of the particles in flame, vth is the thermophoretic velocity and φ is the void fraction of the film. In our deposition process, vth =7 cm/s [39], Np ~ 1011 part/cm3 Dp = 25 nm [40], and tdep = 4 s, φ = 0.56 resulted in δ ~ 500 nm.
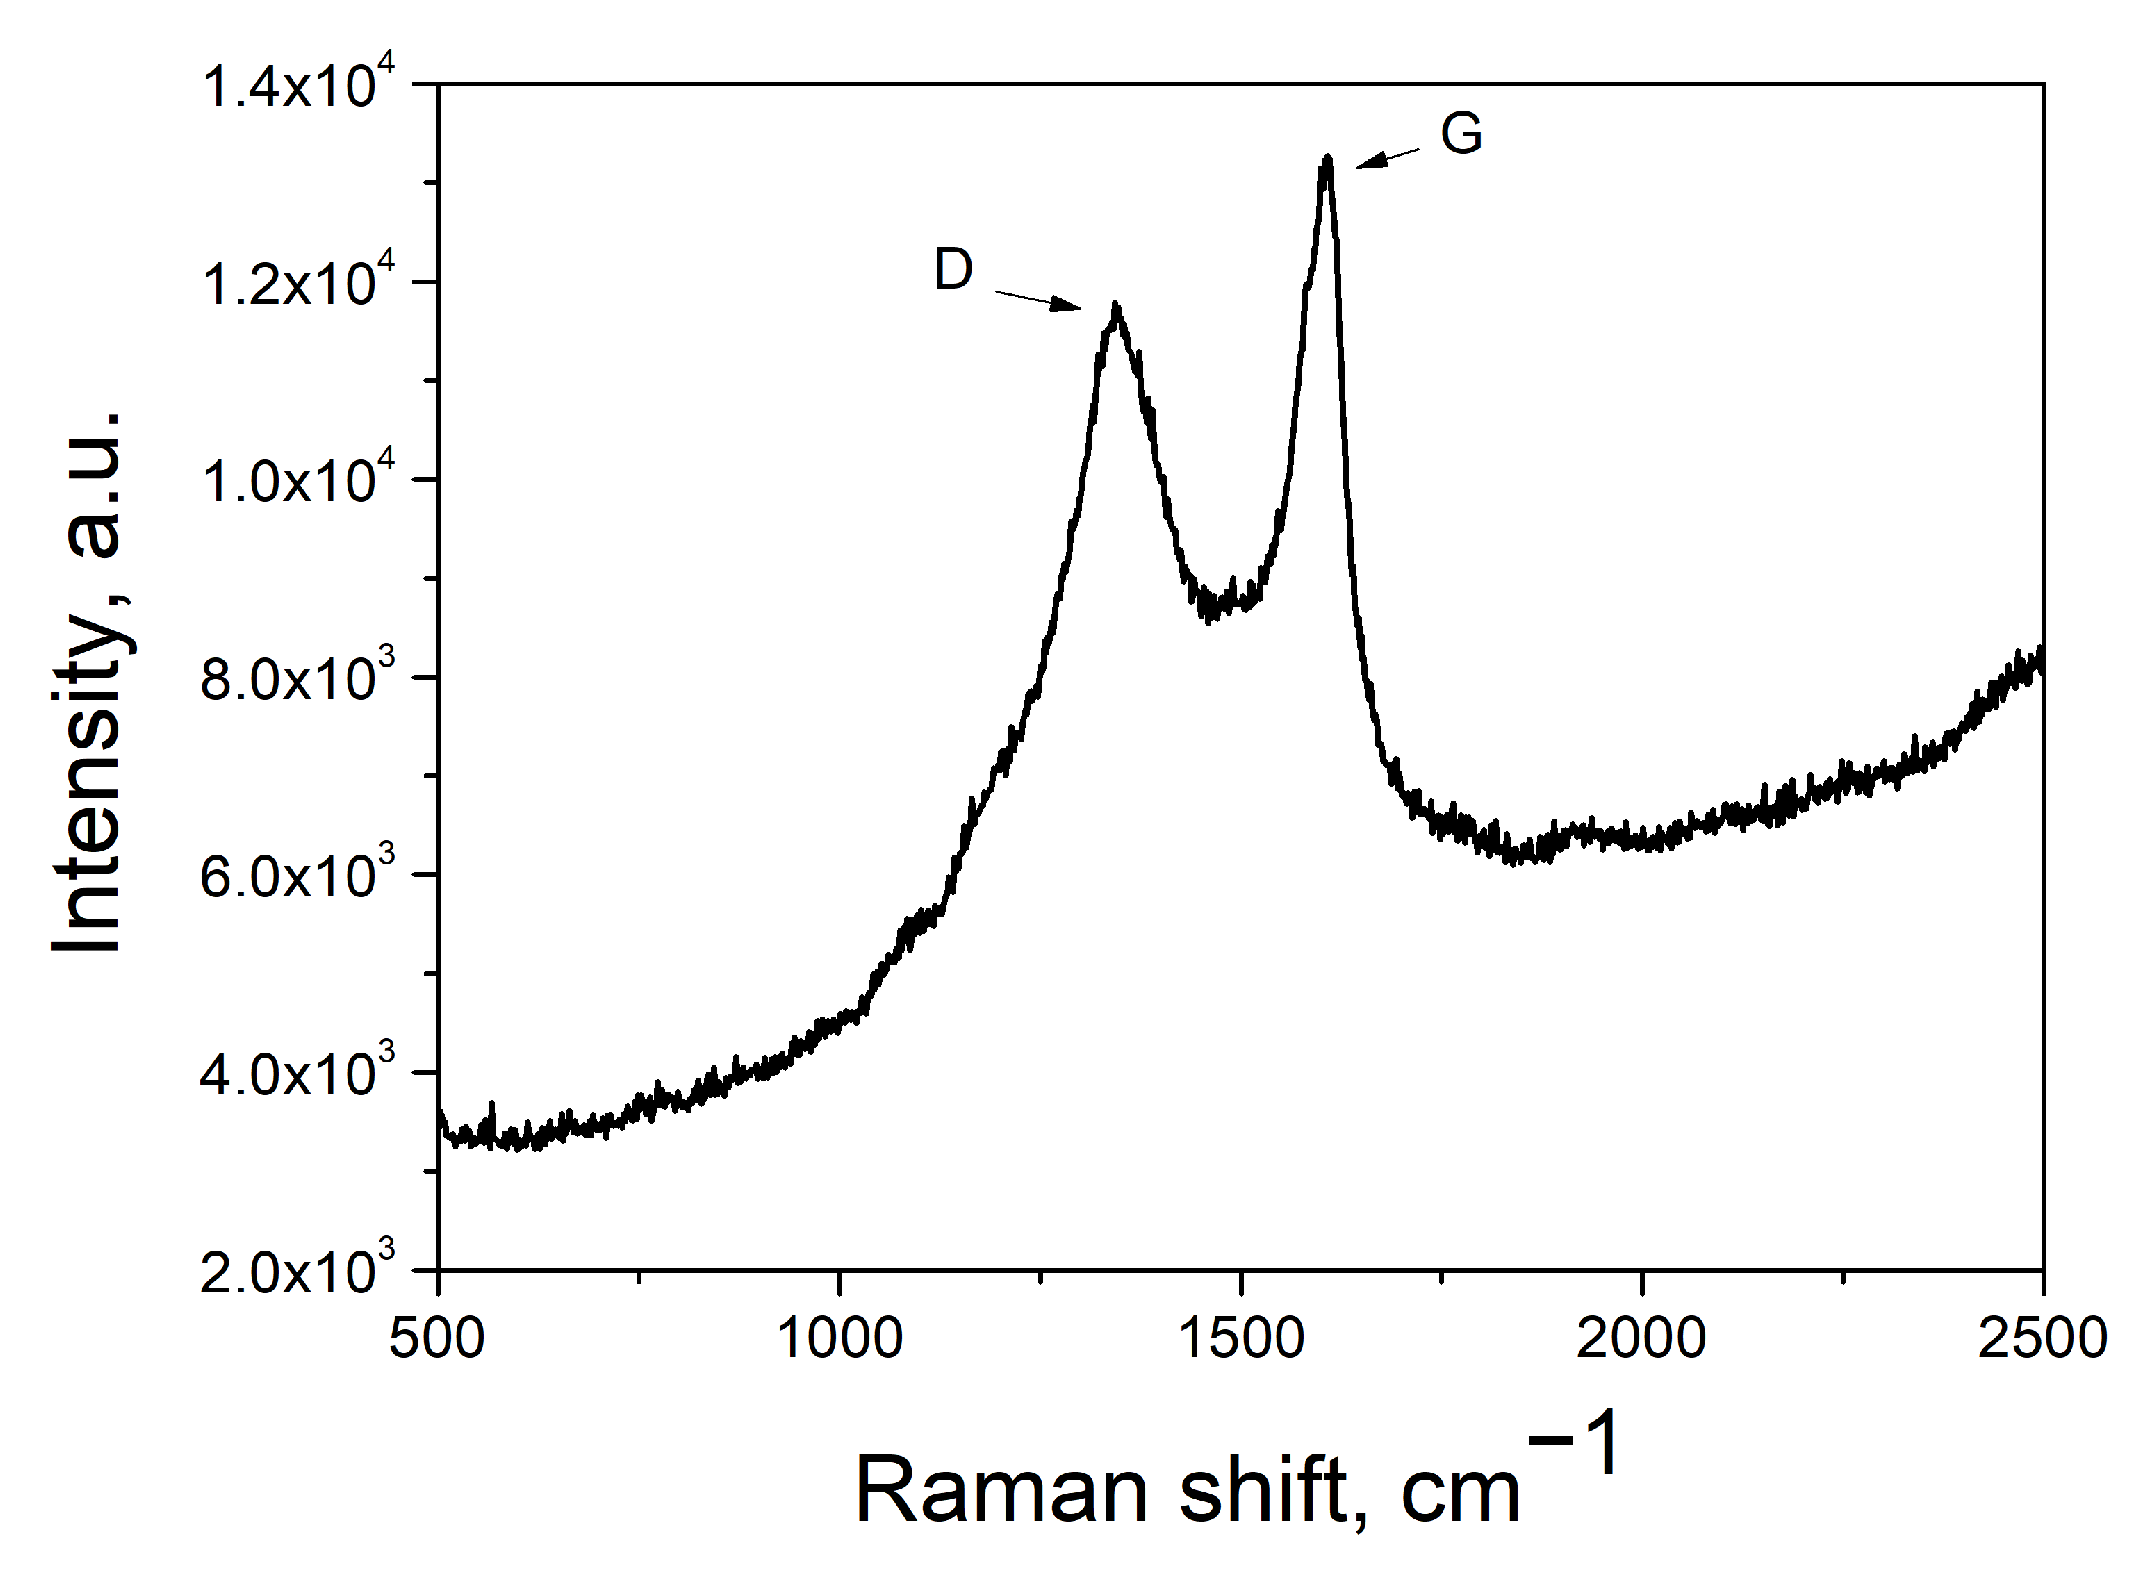
Figure 2 reports the Raman spectrum of the sample. It shows two main prominent peaks at the wavenumbers of 1350 and 1600 cm−1 corresponding to the D and G bands of carbon materials [41,42]. The intensity of the D band peak is dependent on the number of defects and boundaries in the graphitic areas, while the G band provides information about the sp2 bonded carbon networks. The wideness of the bands indicates that the structure consists of very small crystallites. Based on the intensities of these bands, the average crystallite size of the graphitic component, La, can be estimated using the following equation [41]:
L a 2 nm 2 = 5.4 × 10 2 × E L 4 eV 4 I D I G
where EL is the energy of the incident photon. From the spectrum in Figure 2, we obtain a I(D)/I(G) value of 0.9, which results, according to Equation (2), in La = 1.2 nm. This value of La, roughly corresponds to the aromatic building blocks of particles formed in a similar flame that were imaged by AFM [24,25]. The particle structure consisting of an aggregate of large aromatic molecules is also consistent with the presence of a fluorescence background in the spectrum in Figure 2.
Further results of the size characterization of the pristine CNPs and the XPS and UPS analysis of the CNP film, performed in previous works, are shown in Figures S1–S5 in the Supplementary Materials.
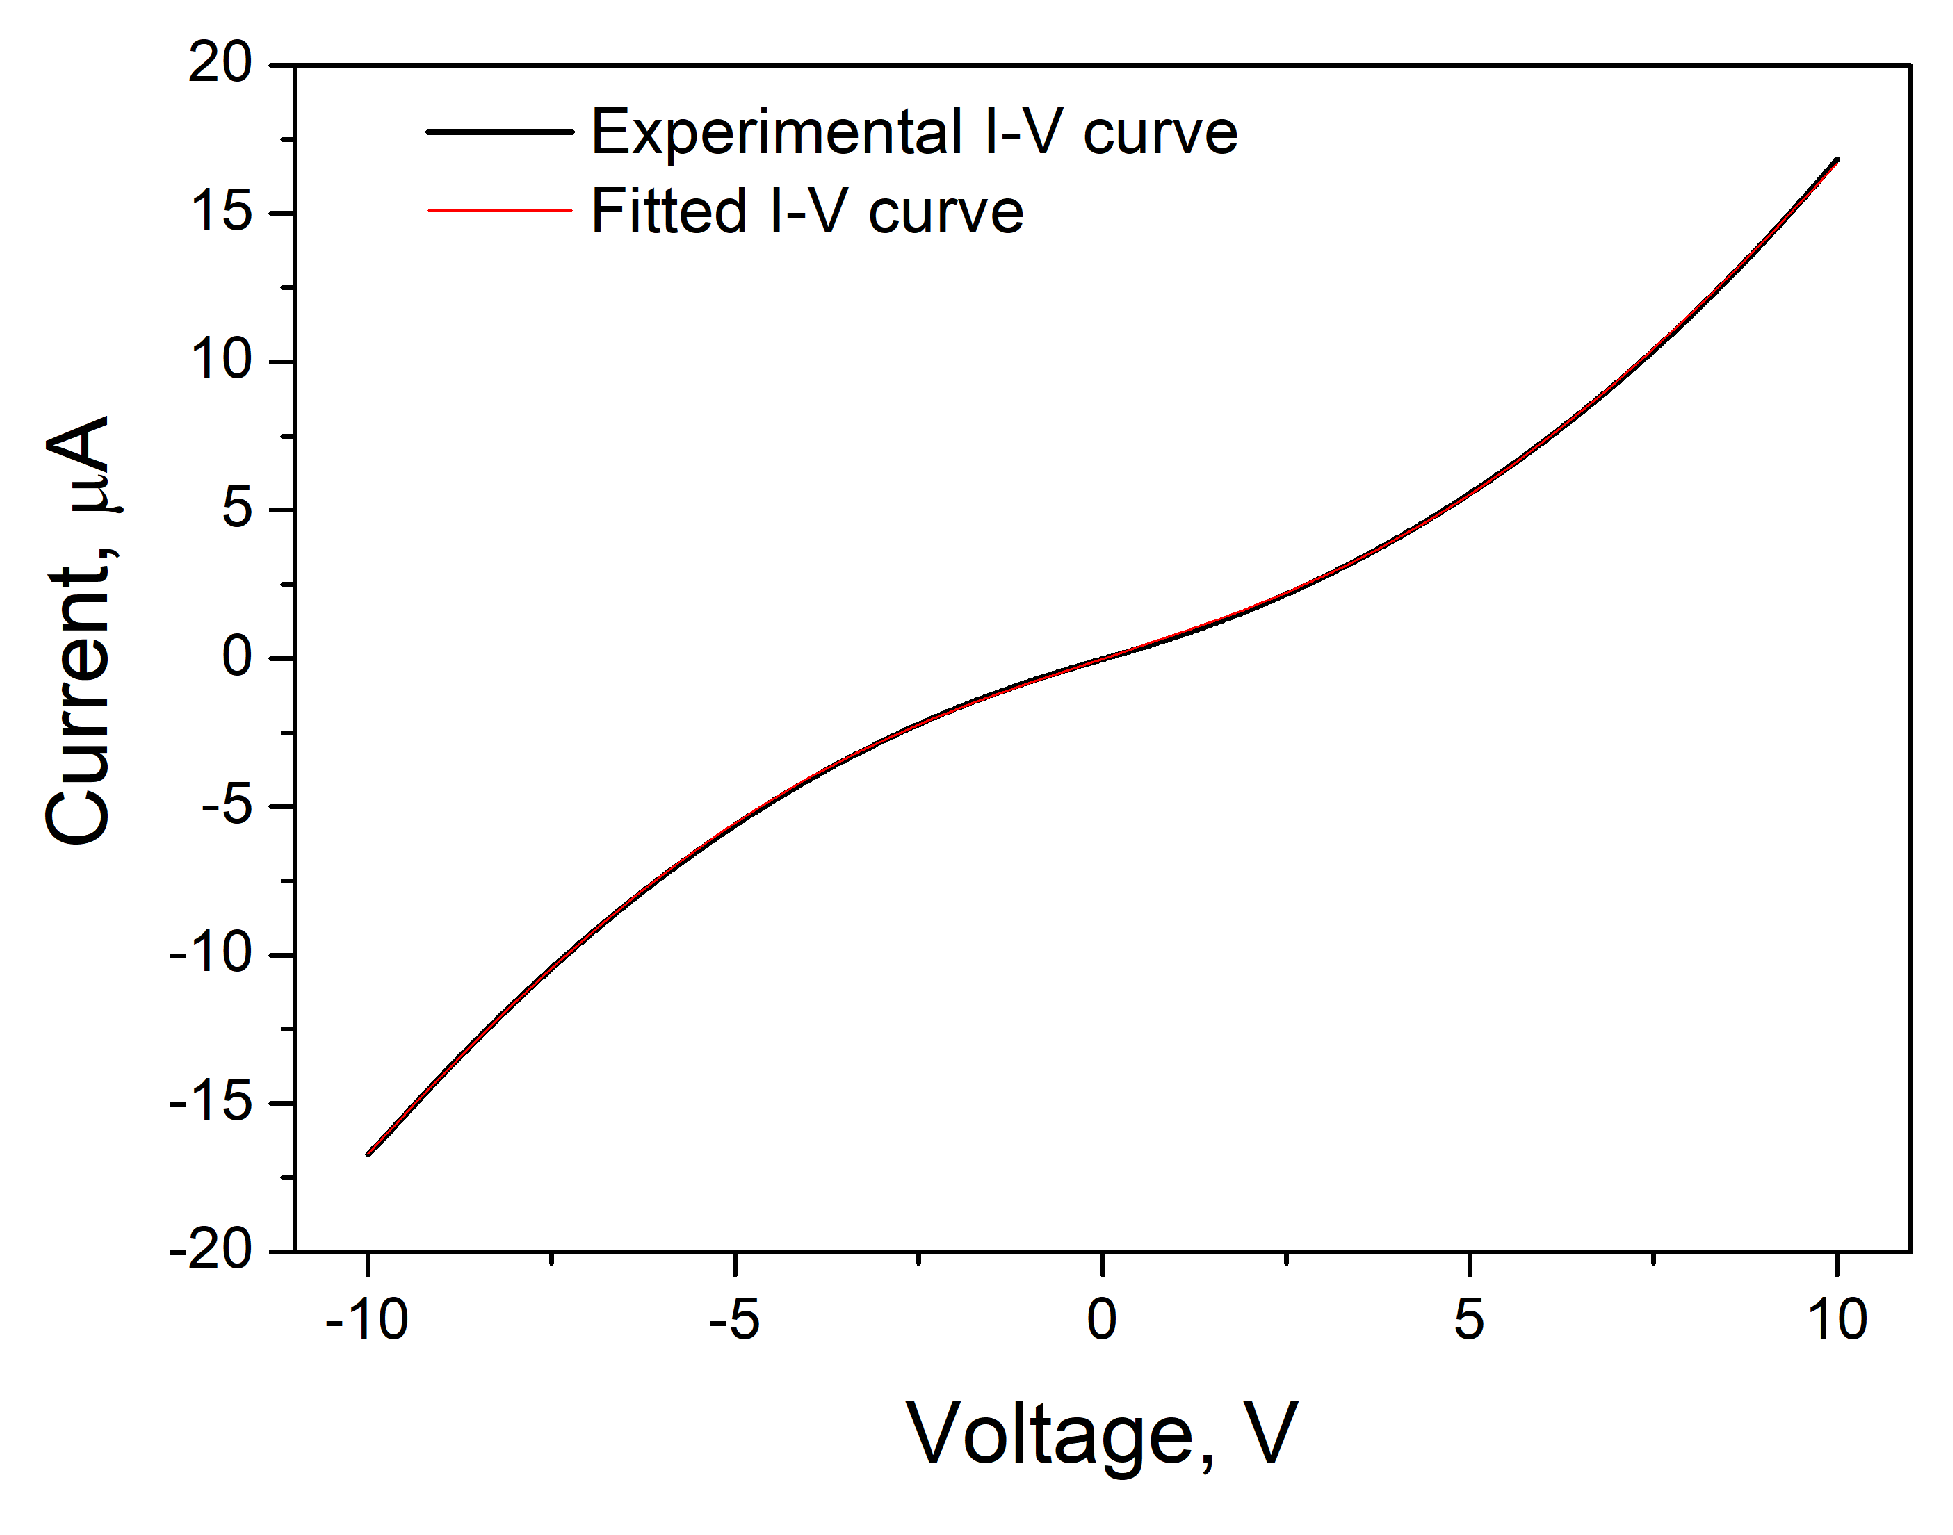
The I–V curve measured in the voltage range −10 V to 10 V is shown in Figure 3. The curve is symmetrical and non-linear, which is typical of granular systems [43].
In these materials, the phenomenon of local electrical conduction can be described as the tunneling of electrons between two neighboring particles in a percolative network [44,45]. Based on these assumptions, Bruschi and Nannini [43] derived the following theoretical equation that predicts the bulk I–V characteristic of a granular material in which the electrical conduction is governed by tunneling and percolation between grains.
I = C A B V e A B × V T   1 A + B V e A + B × V T   1
where A is proportional to the activation energy of the process Ea through the Boltzmann constant kB:
A = E a k B
B depends on both temperature and material, and C has an exponential dependence on the tunneling distance S:
C   e x p   S
The curve fitting the data according to Equation (3) is also reported in Figure 3 as the red line. As can be seen, Equation (3) agrees very well with the data. Repeated measurements furnish an activation energy Ea of about 70 meV.
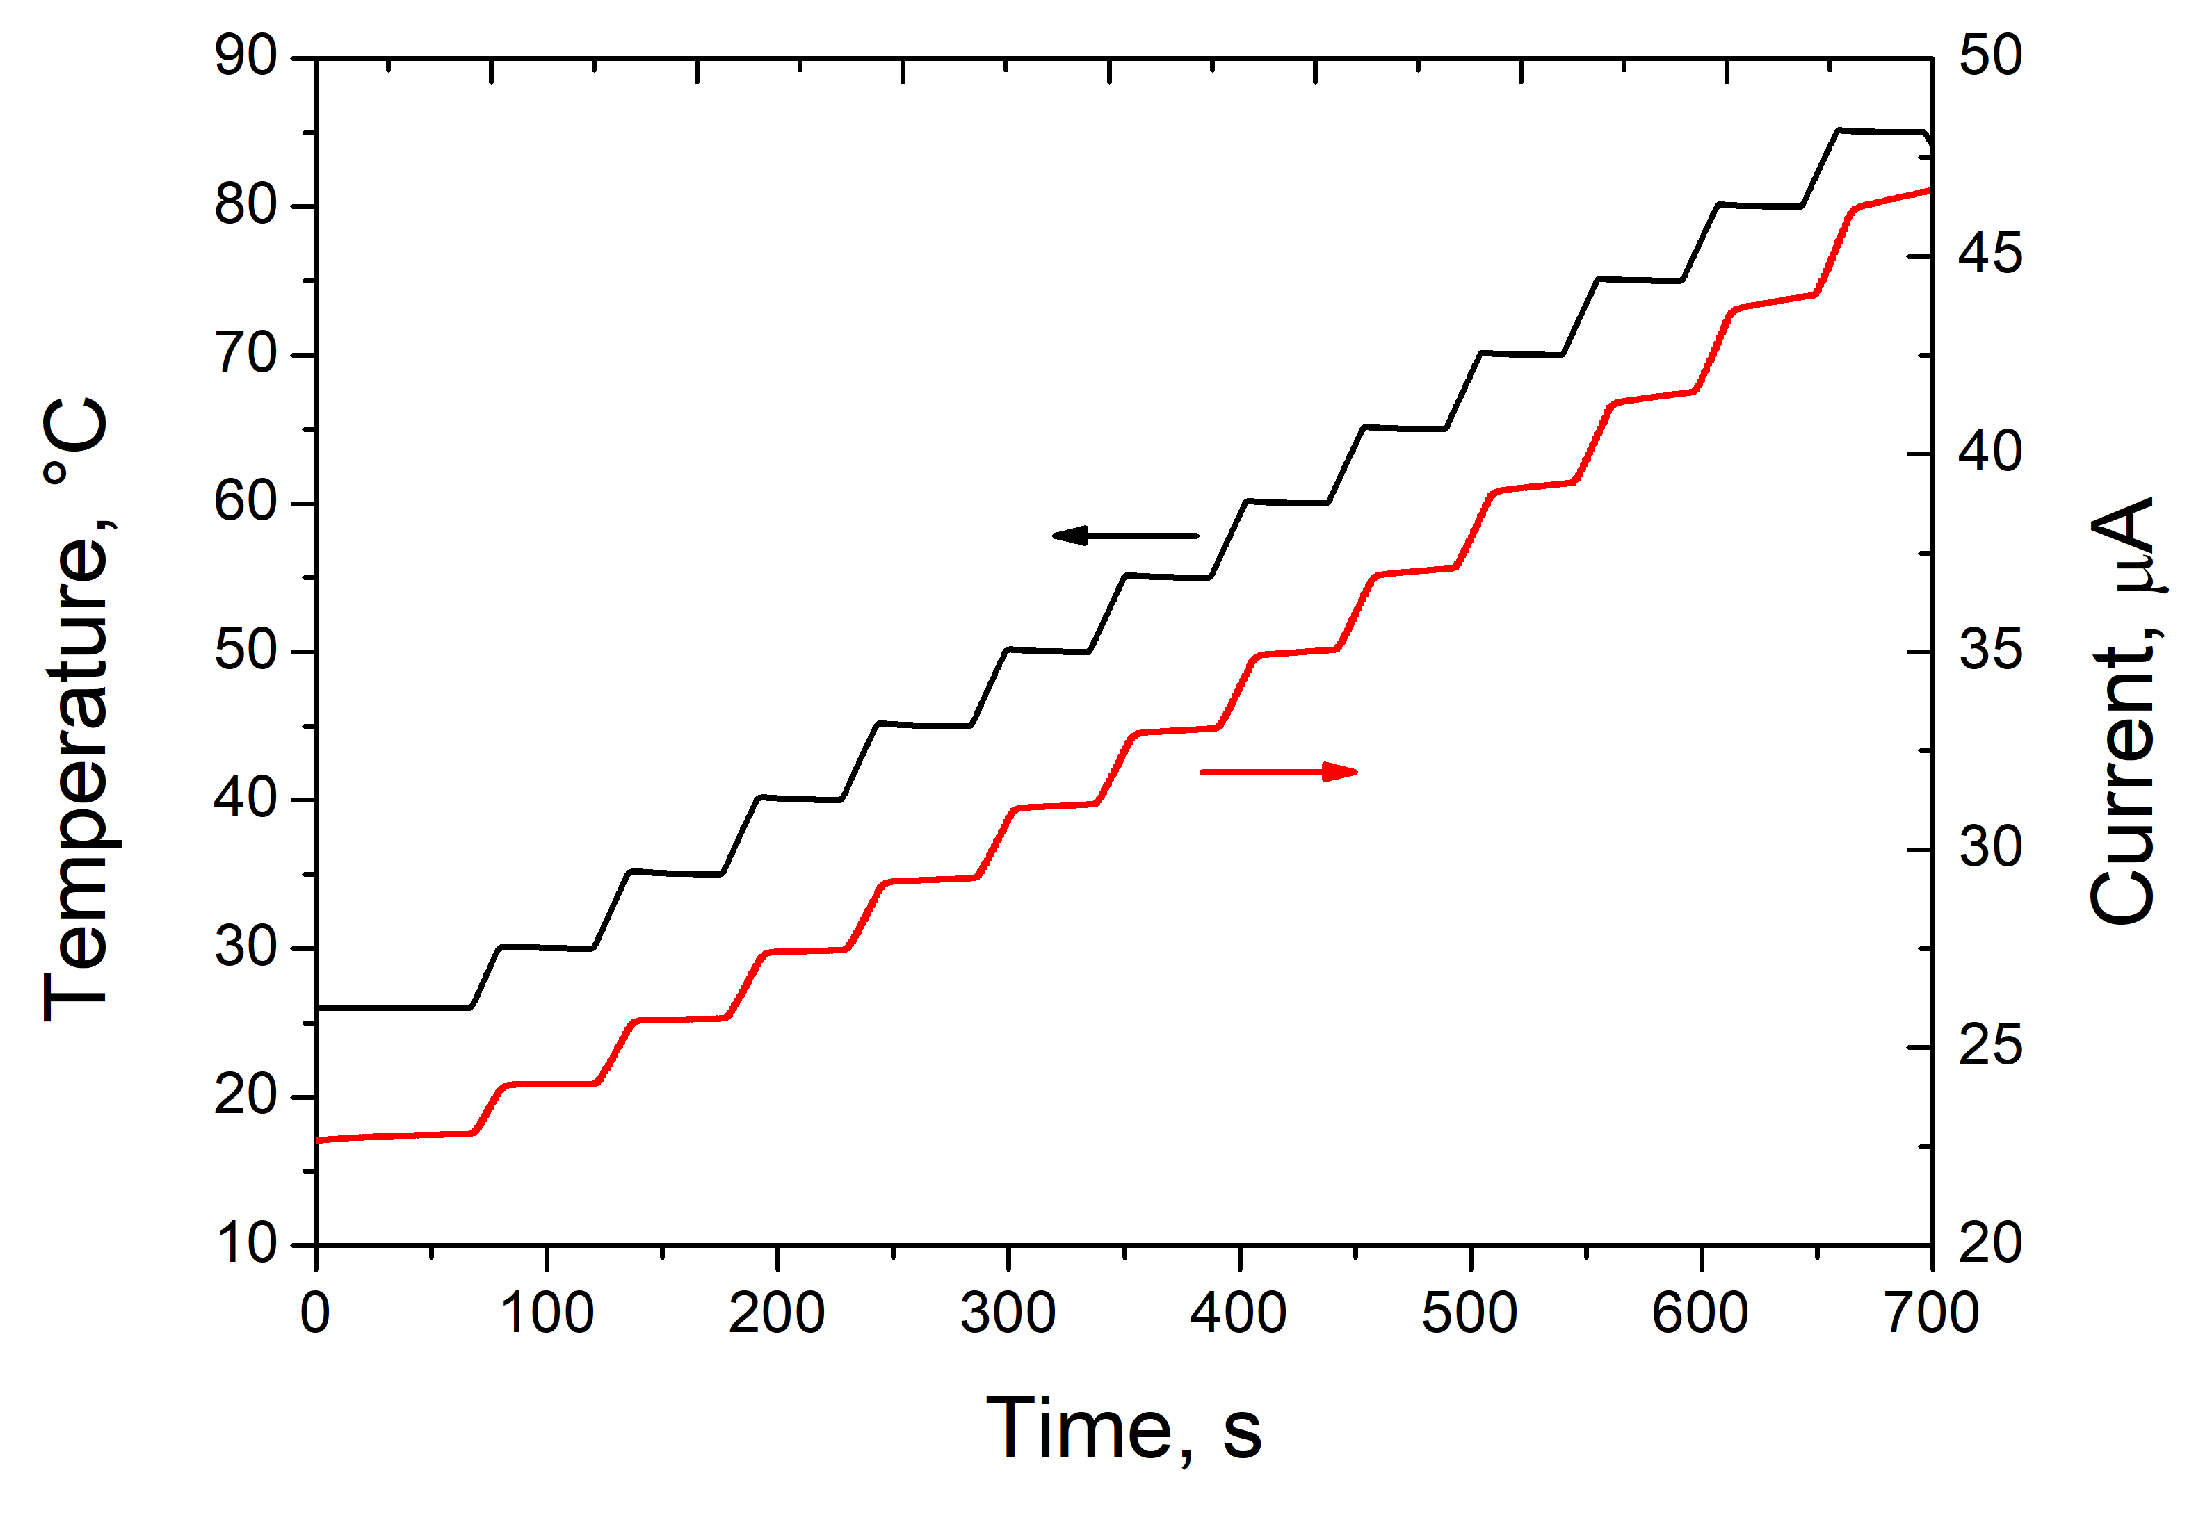
Thermally excited carriers can pass through the barrier by quantum-mechanical tunneling. When the temperature increases, the number of thermally excited carriers increases and thus current increases. This is shown in Figure 4 where the current measured for an applied voltage of 10 V is measured while the temperature is changed stepwise from 26 °C to 85 °C. It can be seen that the current also increases stepwise.
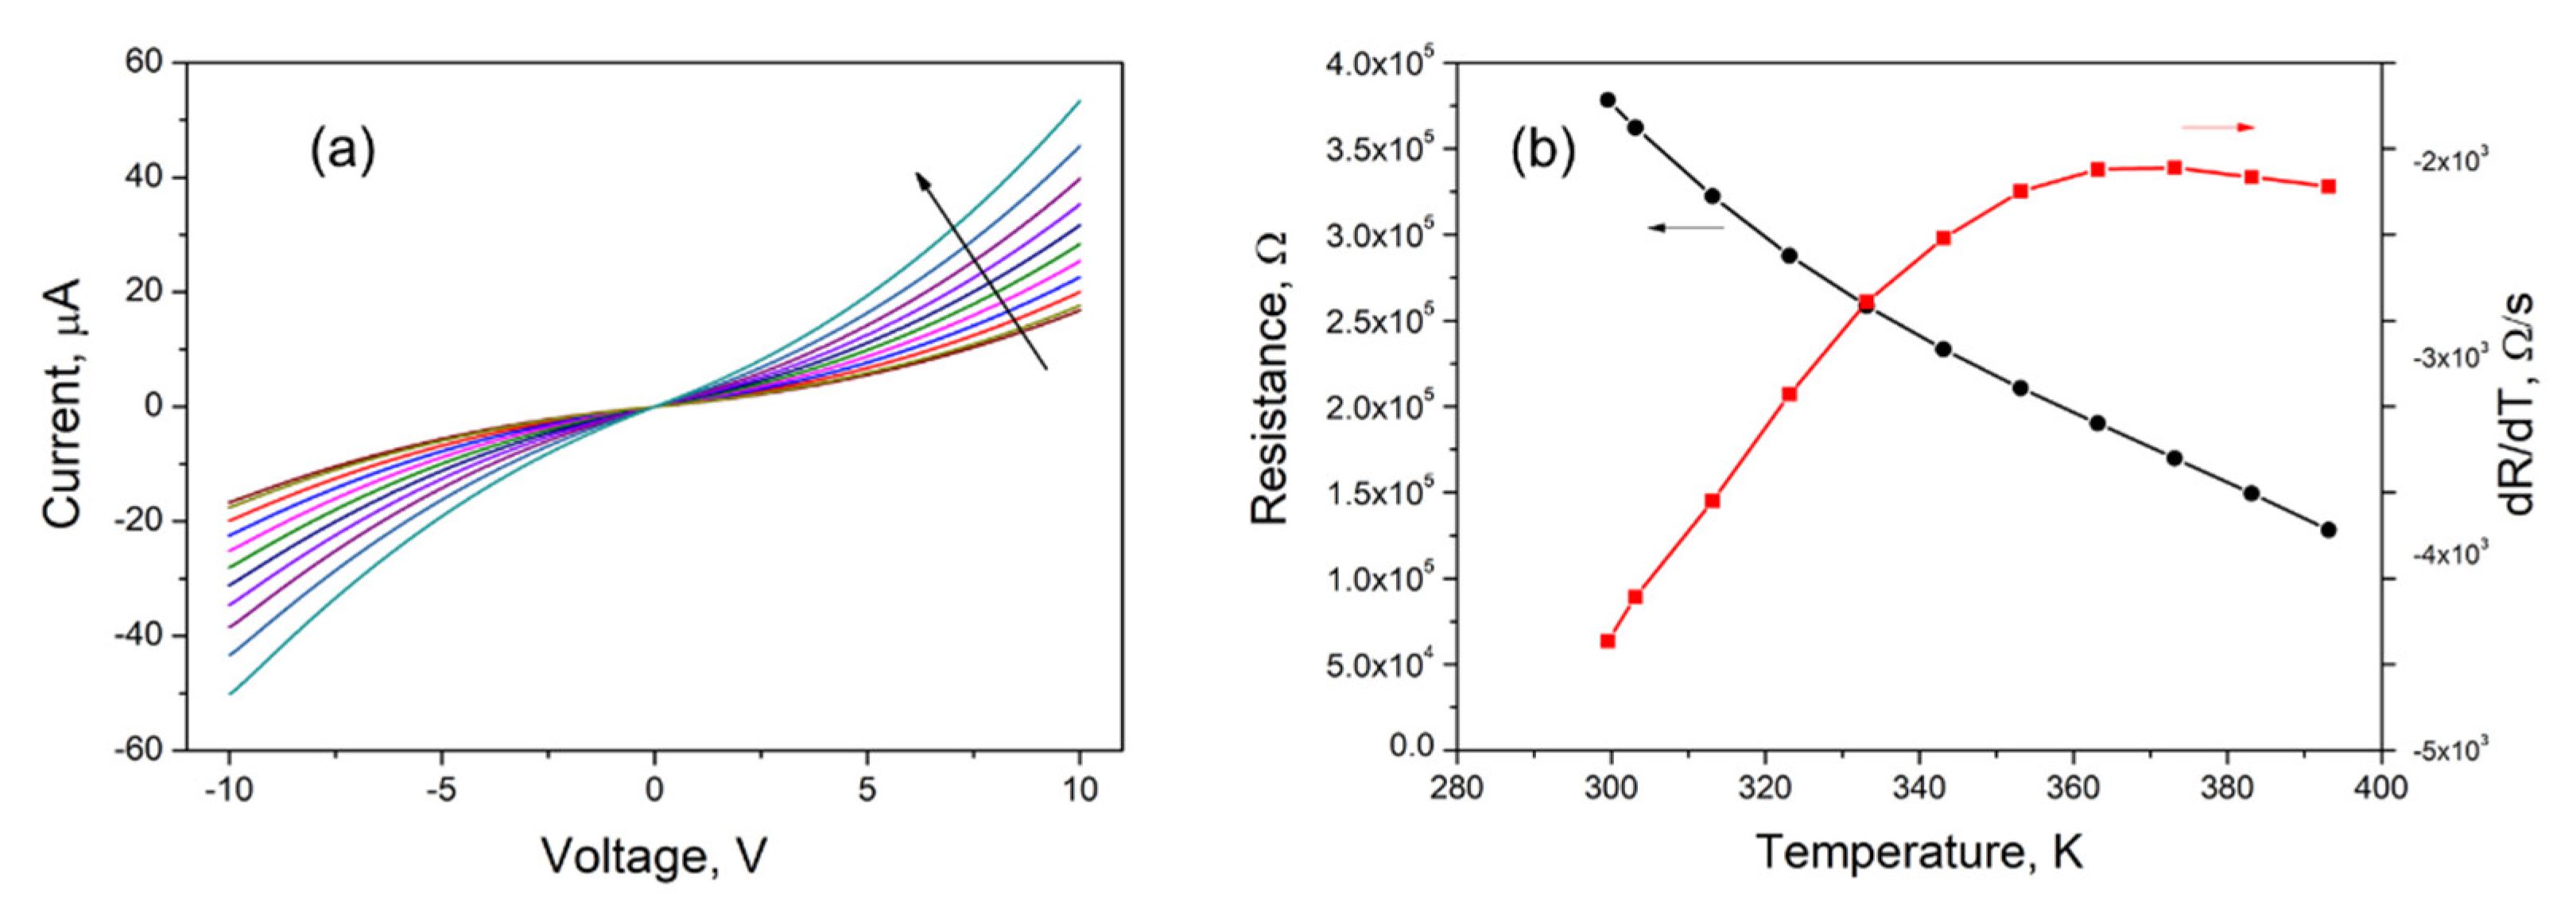
The thermal characterization of the CNP film was then performed measuring the I–V curves in the temperature range of 300 to 400 K with a step of 10 K. Heating cycles were repeated over various days. The film showed a good repeatability of the response to the heating cycle, recovery and stability over time. That can be seen by the reproducibility of the curve shown in Figure S6 in the supplementary material, taken at ambient temperature and at 50 °C after a week and after the sample had experienced full heating cycles up to 100 °C. Figure 5 shows the I–V curves between −10 V and 10 V (Figure 5a) and the temperature dependence of the electrical resistance, ΔVI, measured in correspondence of the voltage interval of 8–10 V and of its derivative with respect to the temperature (Figure 5b). The 8–10 V interval has been chosen since the curve shows the best linearity. All the curves are well fitted by Equation (3) and the parameters of the fit are reported in Table S1 in the Supplementary Materials.
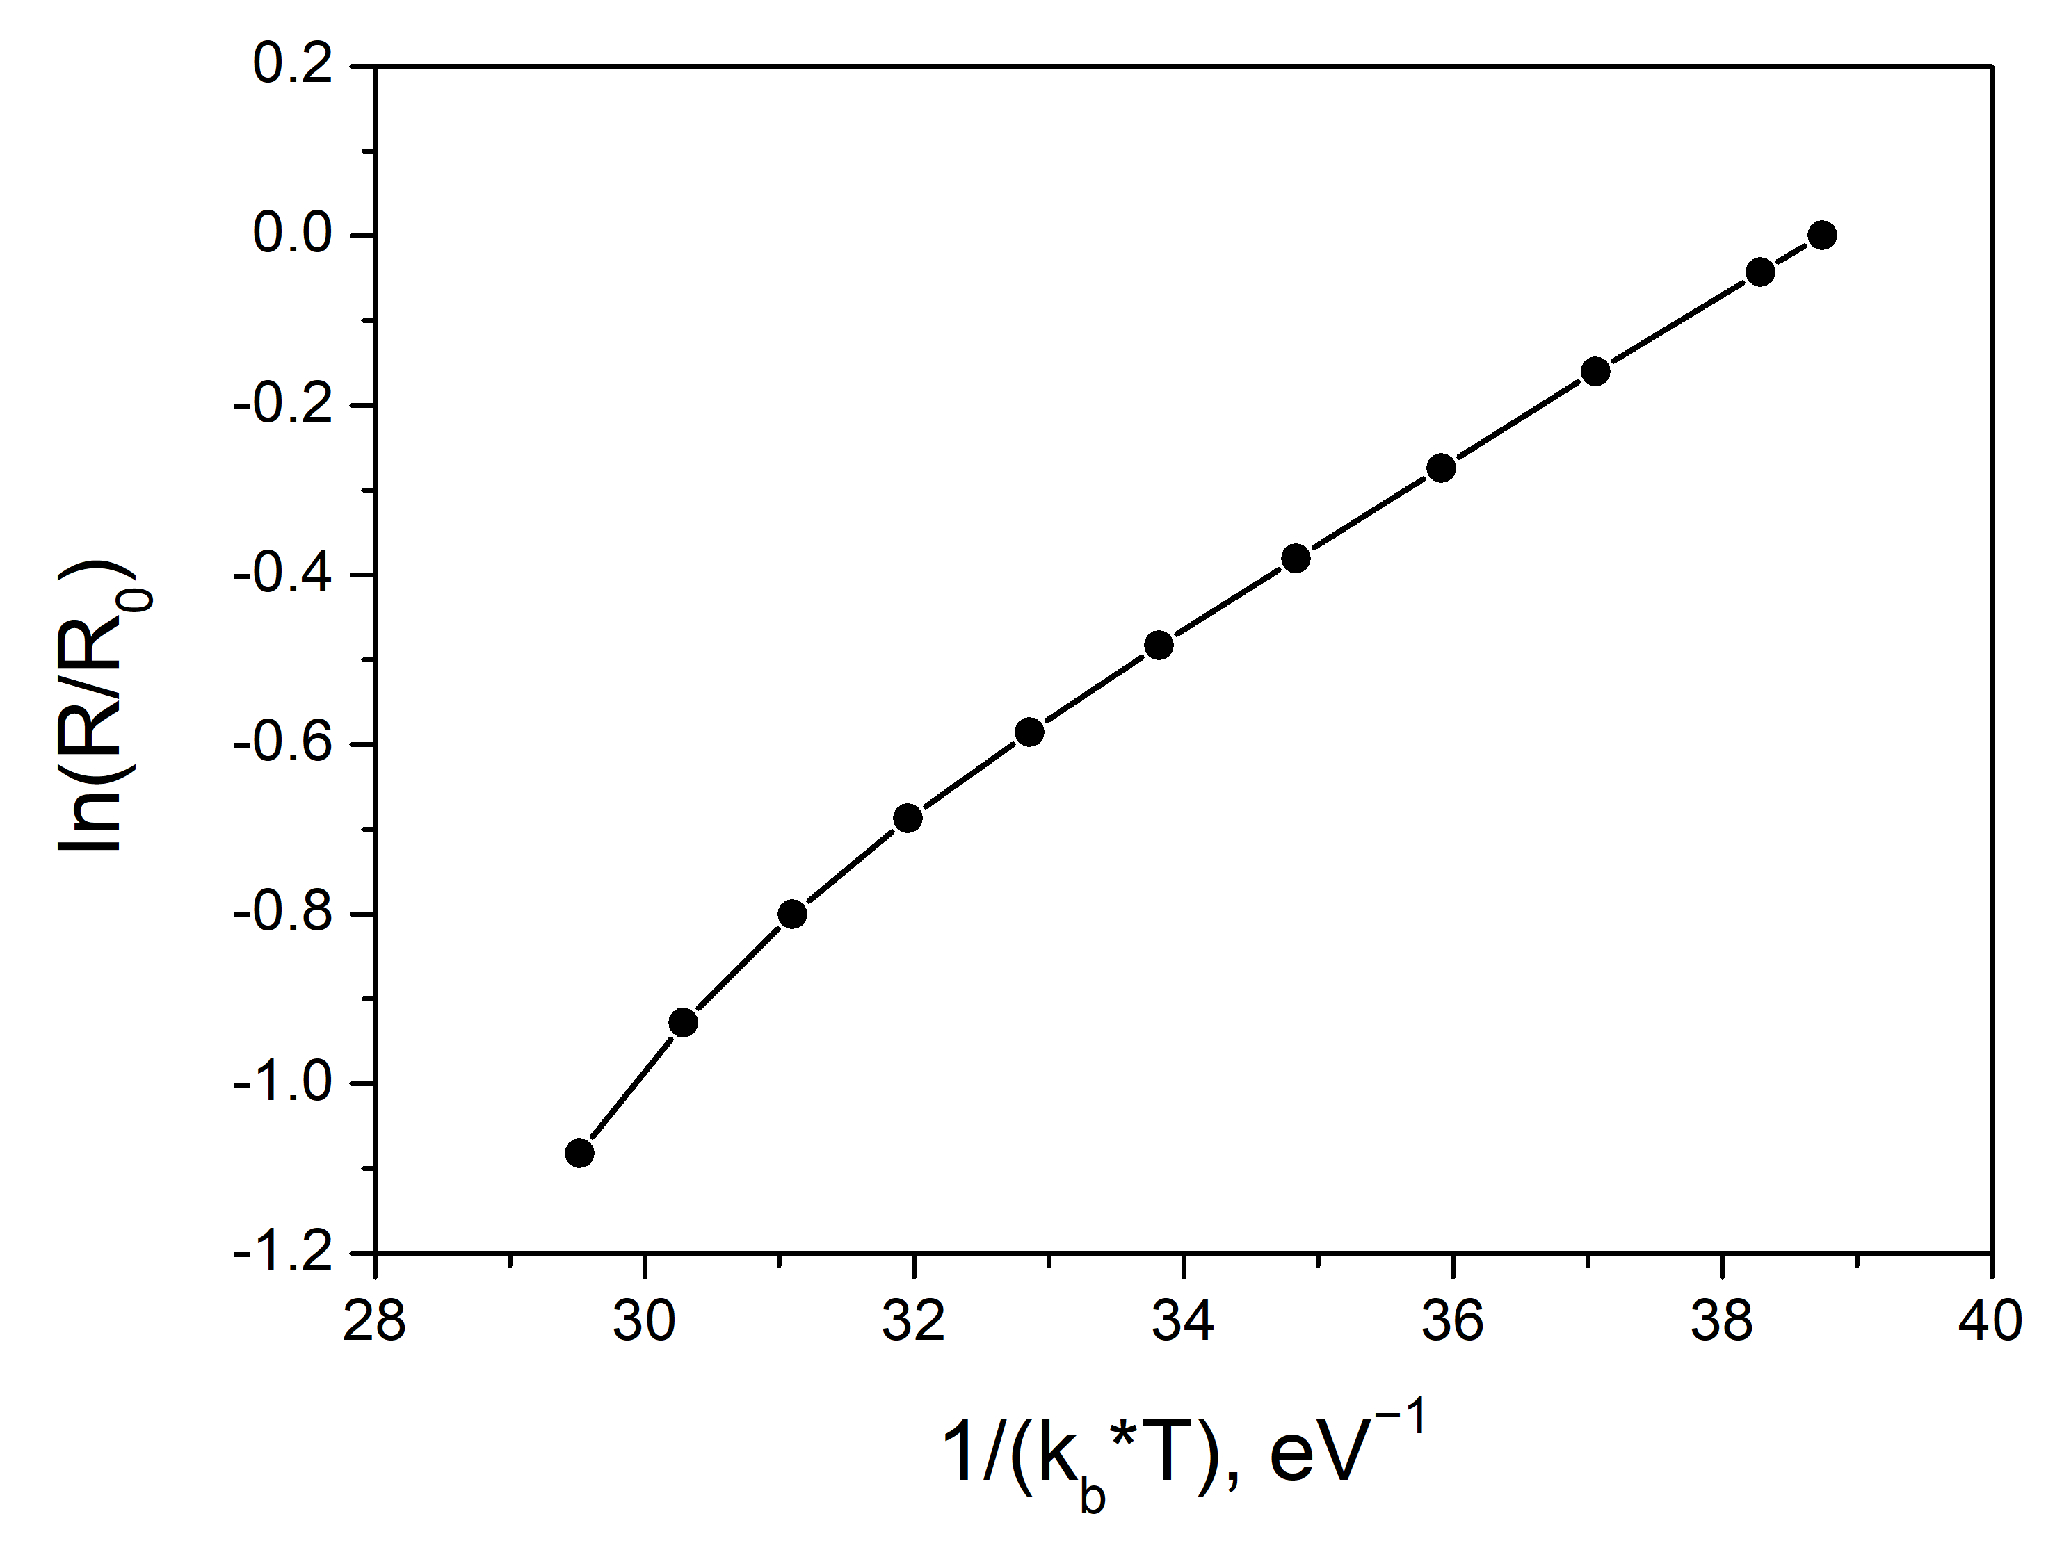
The resistance significantly decreases when the temperature increases from 300 K to 400 K; however, the rate of such a decrease is almost linear with T up to 320 K, and it reaches a plateau above 340 K. The change in the resistance of the film also showed good reproducibility over days, within a few percent. The decrease in the electrical resistance with increasing temperature indicates that the conduction of the CNP film is thermally activated. This is consistent with the presence of an energy barrier that the electron needs to overcome while moving from one grain to another. From the fitting of the curves with Equation (3) (see Table S1 in Supplementary Materials) results that Ea slightly increases with T, indicating that the conduction process cannot be described by a Arrhenius behavior. This is also shown by the nonlinear trend in the plot in Figure 6, in which the ln(R/R0) versus 1/(kb*T) is reported, where R0 is the resistance of the film at ambient temperature and kb the Boltzmann constant. The C parameter obtained from the fit increases with T. This indicates that the tunneling distance reduces with the increase of T, which can be justified by the thermal expansion of the film grains.
The change of resistivity with respect to temperature can be exploited for temperature sensing. In analogy with negative coefficient thermistors, the temperature coefficient of resistance (TCR) can be defined by the following Equation:
T C R = 1 R d R d T
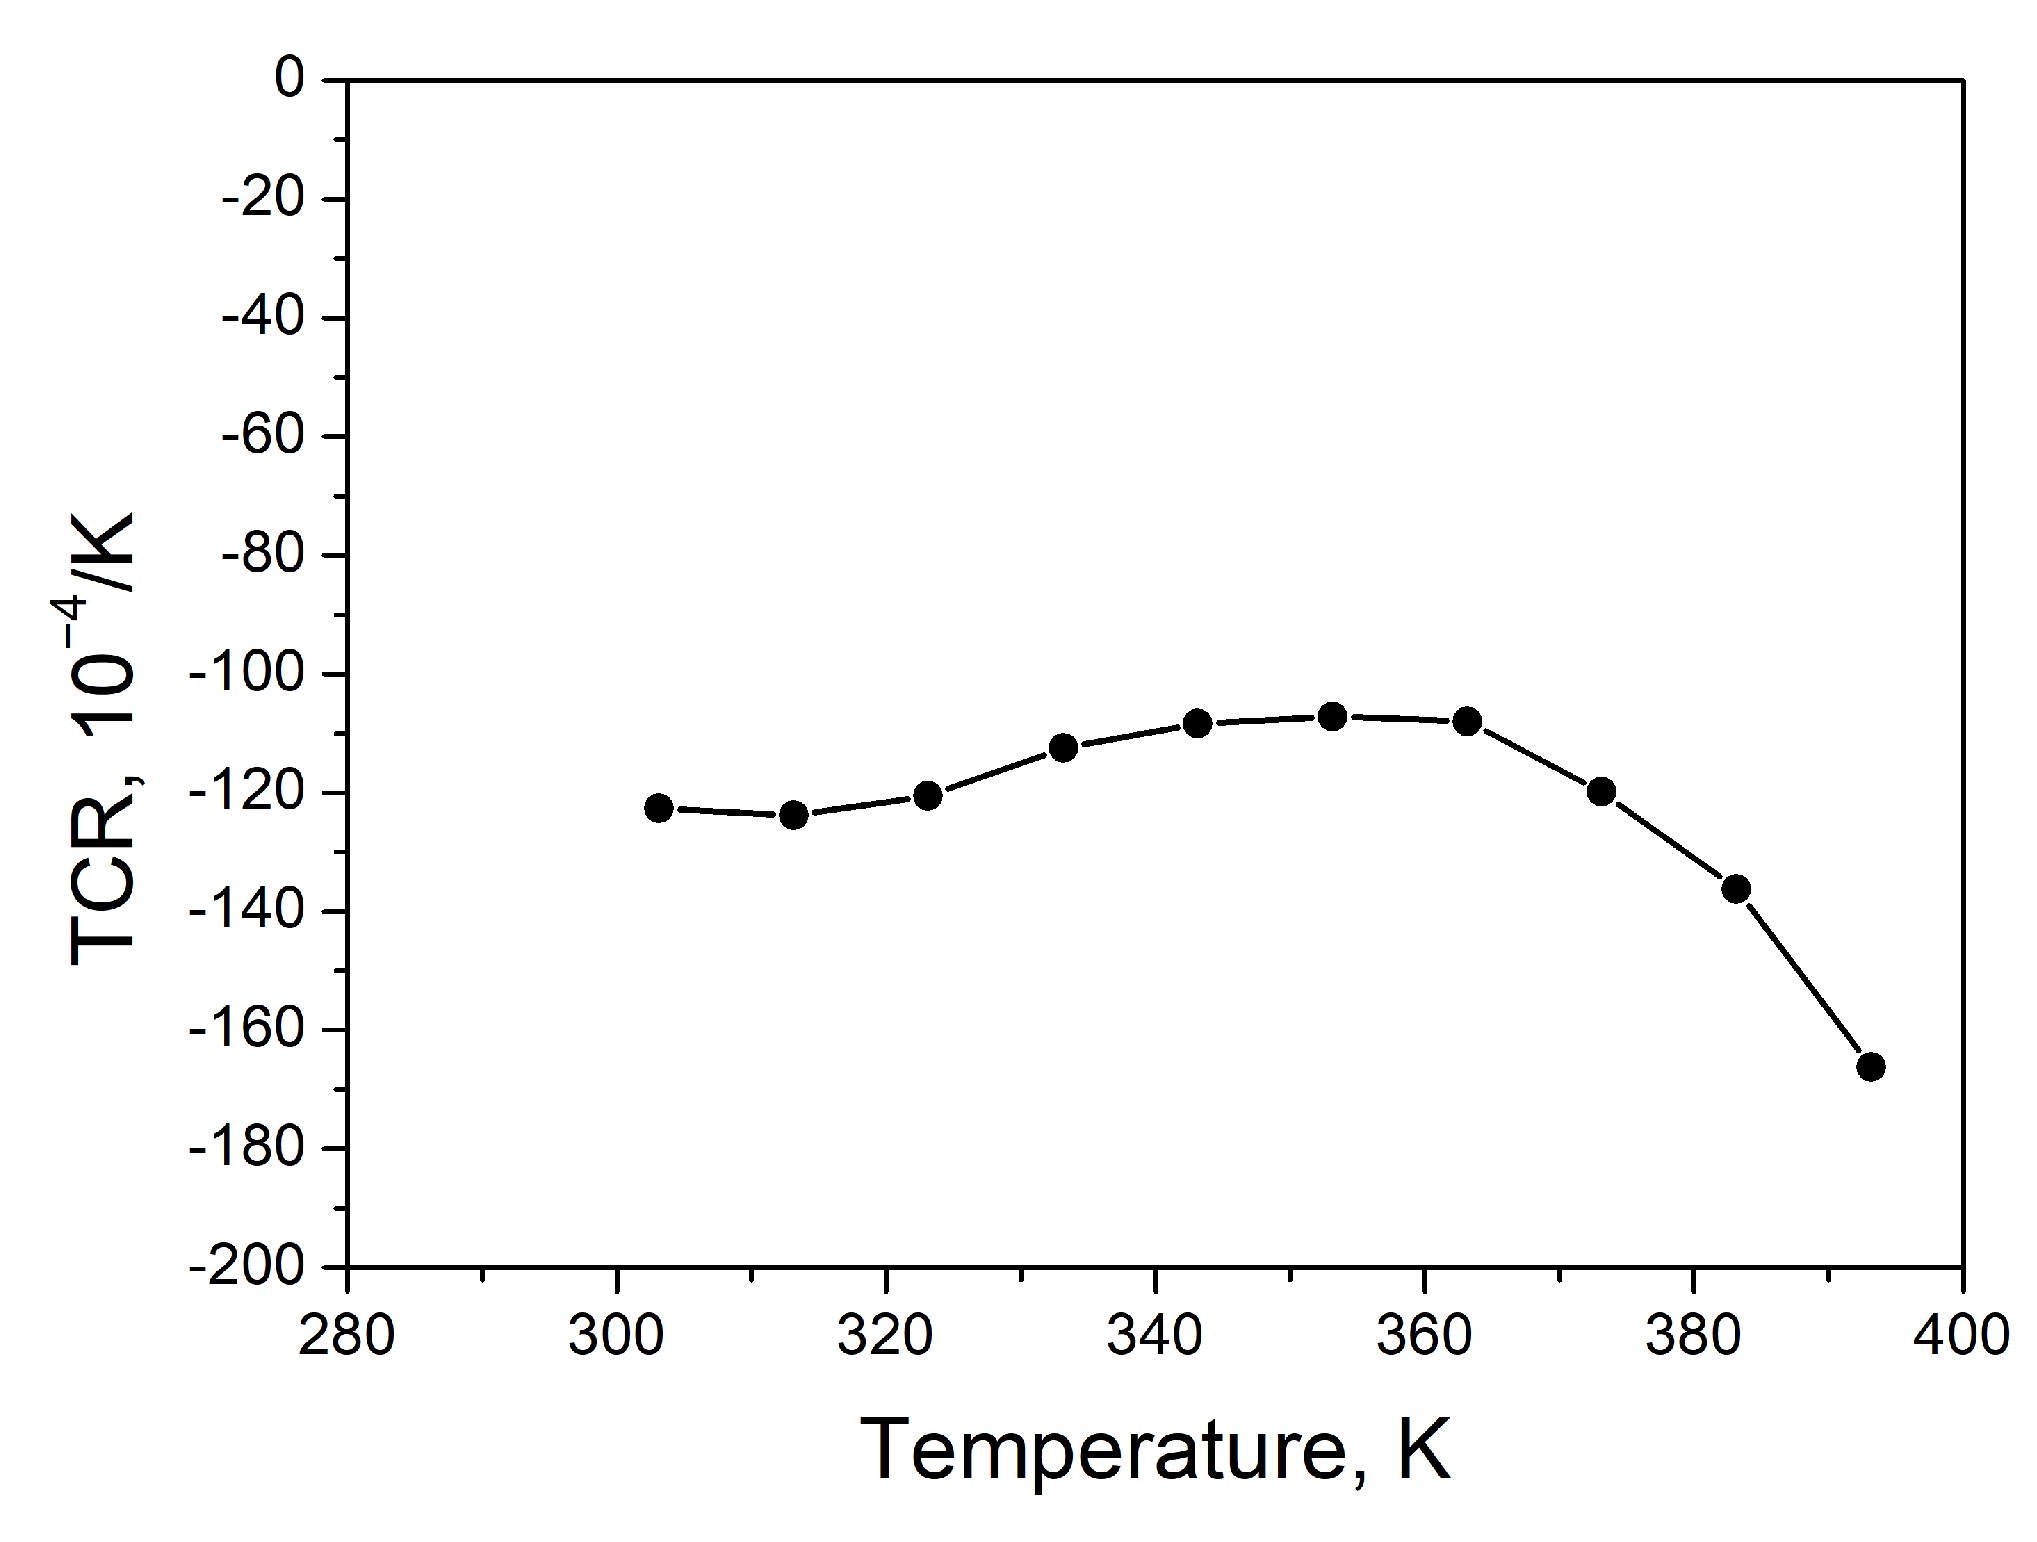
The measured TCRs are shown in Figure 7. The values range from 100 × 10 4 K−1 to 170 × 10 4 K−1, which are comparable to that of Polysilicon (from 250 × 10 4 K−1 to 10 × 10 4 K−1) [46]. The absolute value is also comparable to that of common temperature sensing metal materials such as platinum ( 39.2 × 10 4 K−1), copper ( 43 × 10 4 K−1) and nickel ( 68.1 × 10 4 K−1) [47] as well as carbon nanotube networks (−7 ×   10 4 K−1) [48] and graphene ( 15   ÷   80 × 10 4 K−1) [49].
The high absolute TCR value and a high nominal resistance, together with the ease of material microfabrication processing and biocompatibility of the carbon material make CNP film ideal for temperature sensing in many environments.
In practical applications, it is important to calibrate the response of the sensor and to find the functional relationship between resistance and temperature.
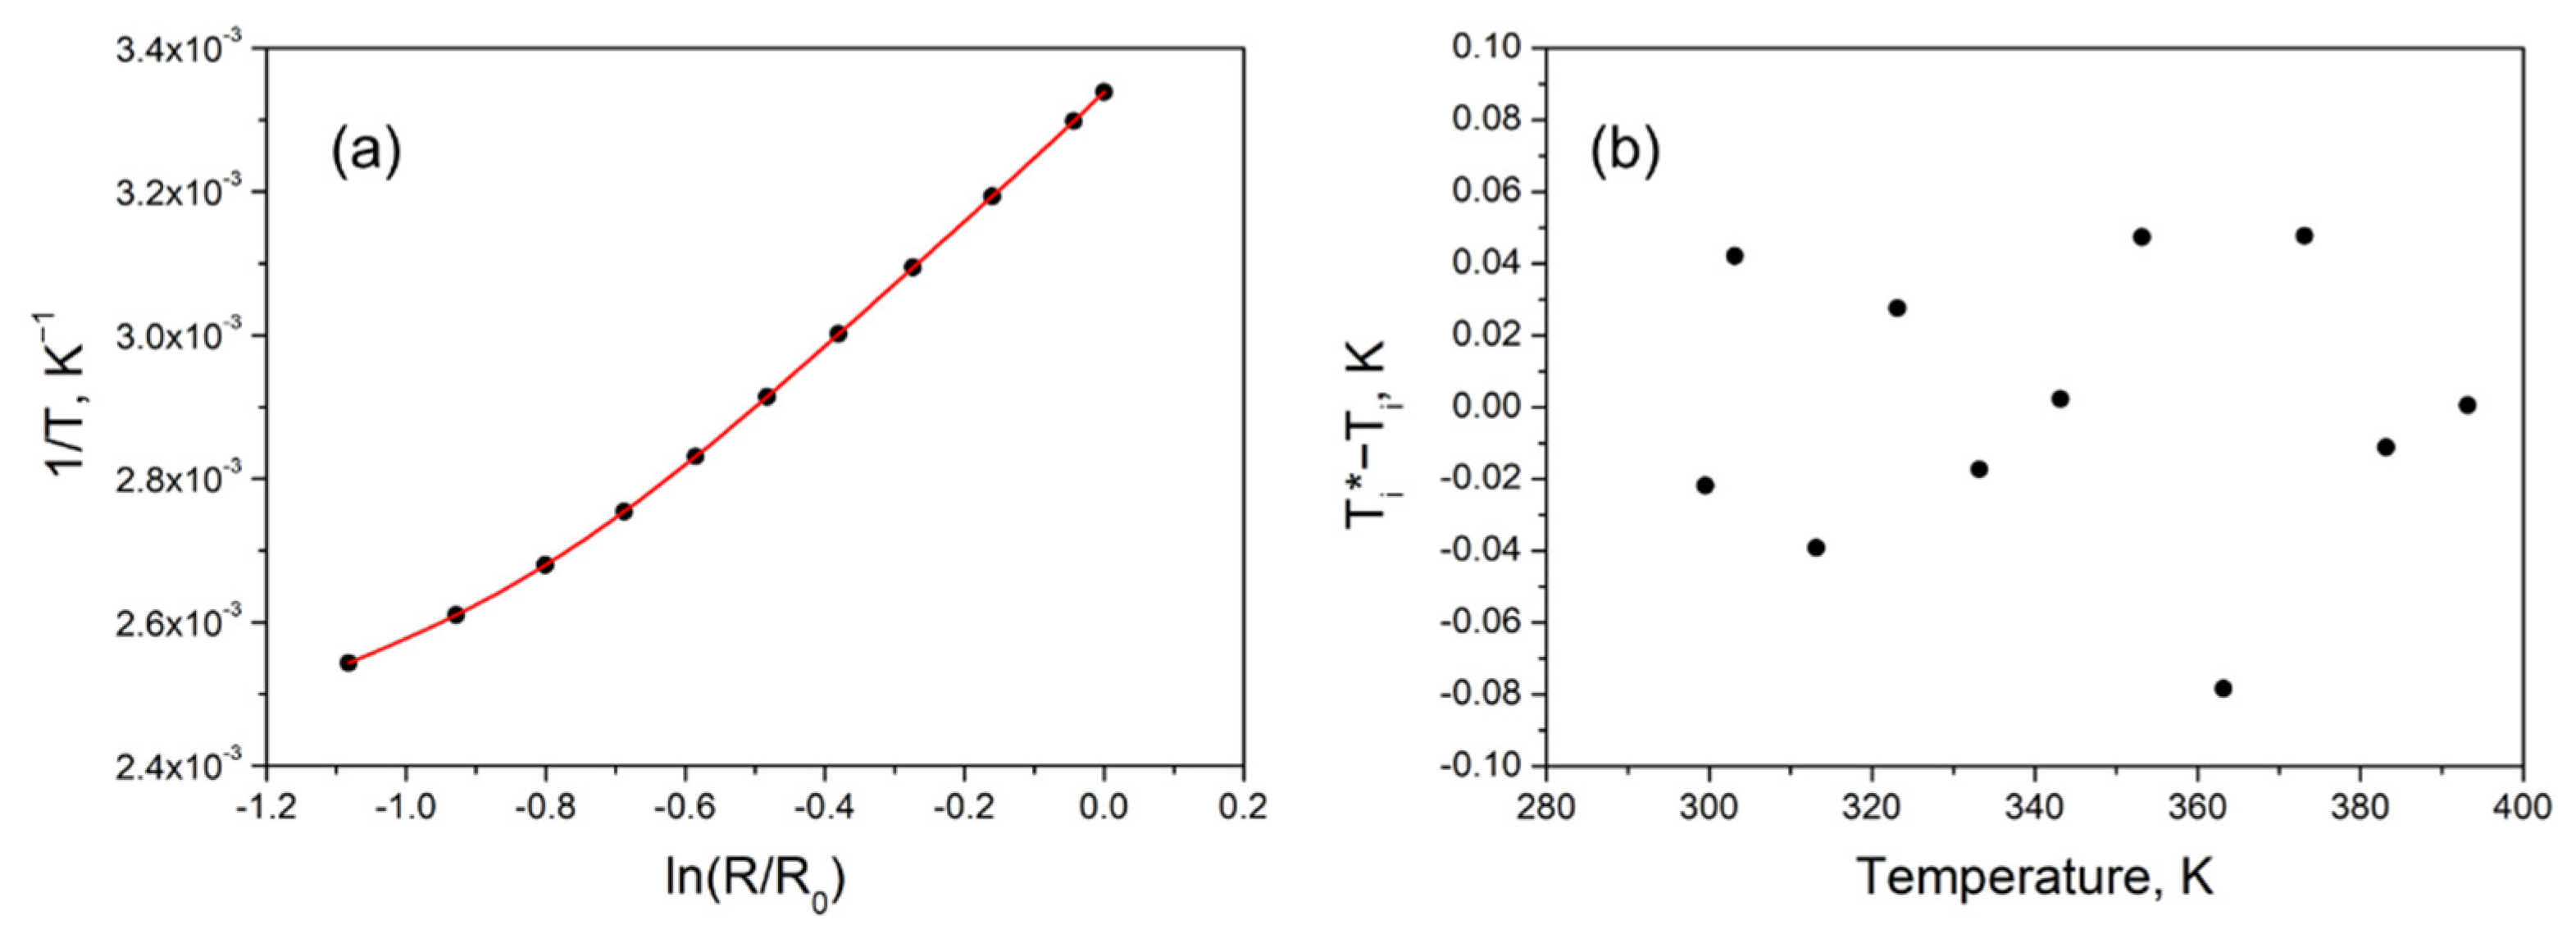
Different calibration equations are generally used for NTC thermistor [50]. The most popular equation, the basic equation, is a two-parameter exponential, while several other calibration equations employ different order polynomials. The film of carbon nanoparticles here investigated is well fitted by a fifth order polynomial. This is clearly shown in Figure 8 that reports the fitting residual of temperature given by:
Δ T = T i * T i
where T i is the temperature measured at each calibration point, and T i * is the temperature calculated from the calibration equation. The specified temperature point is denoted with subscript i.
In the whole temperature range herein investigated, the residual of the calibration fit is less than 0.1 K.

4. Conclusions

A one-step procedure based on the flame synthesis of carbon nanoparticles and their direct deposition by thermophoresis on a substrate with interdigitated gold electrodes has been adopted in this study. Both the morphological and structural characteristics of so prepared carbonaceous films have been characterized by AFM and Raman spectroscopy. The electrical resistance as a function of the temperature has been investigated from ambient temperature up to nearly 400 K.
A monotonic decrease of the film resistance with temperature increase is observed, which is typical of a nonmetallic behavior. The change of resistivity with respect to temperature is described by a negative temperature coefficient of resistance (TCR), with absolute value higher than 100 × 10−4 K−1. A functional relationship between resistance and temperature, which is necessary for practical applications, has been finally derived. A good fit is obtained with a fifth order equation.
The sensitivity of the CNP film’s electrical response to temperature changes, together with the ease of material microfabrication processing and biocompatibility of the carbon material, make these films ideal for temperature sensing in many environments.
In a future work, the study will be extended to higher temperatures to investigate the maximum working temperature before structural damage occurs. Furthermore, different films will be investigated as function of the main synthesis parameters (such as fuel kind and equivalence ratios, flame temperatures, particle residence time in flame, etc.) to optimize the sensor response to the temperature and its stability.
The technique to produce carbon nanostructured thin films presented in this work is a reliable, low-cost procedure that does not make use of solvent nor toxic substances. Furthermore, the films can be deposited on a variety of substrates and with arbitrary shapes.
The flame synthesized CNP films can be easily applied to developing temperature sensors embedded in different materials with different geometries. This is a promising technology open to novel applications such as, for instance, smart packaging and wearable biosensors.

Supplementary Materials

The following supporting information can be downloaded at: https://www.mdpi.com/article/10.3390/app12157714/s1, Figure S1: particle diameter; Figure S2: XPS C1s spectrum; Figure S3 energy loss spectrum; Figure S4: UPS valence band spectrum; Figure S5: Tauc plot; Figure S6: I–V curves. References [29,33,40] are cited in the supplementary materials.

Author Contributions

Conceptualization, P.M., M.C., A.A. and A.D.; methodology, P.M. and M.C.; investigation, P.M., G.D.F. and M.C.; data curation, P.M., G.D.F., A.A. and M.C.; writing—review and editing, P.M., G.D.F., M.C., A.A. and A.D.; funding acquisition, P.M. and A.D. All authors have read and agreed to the published version of the manuscript.

Funding

This research was conducted under the PRIN project 2017PJ5XXX: “MAGIC DUST” of the Italian Ministero dell’Università e della Ricerca, MUR.

Institutional Review Board Statement

Not applicable.

Informed Consent Statement

Not applicable.

Data Availability Statement

The data presented in this study are available on request from the corresponding author.

Conflicts of Interest

The authors declare no conflict of interest. The funders had no role in the design of the study; in the collection, analyses, or interpretation of data; in the writing of the manuscript; or in the decision to publish the results.

References

  1. Trung, T.Q.; Ramasundaram, S.; Hwang, B.-U.; Lee, N.-E. An All-Elastomeric Transparent and Stretchable Temperature Sensor for Body-Attachable Wearable Electronics. Adv. Mater. 2016, 28, 502–509. [Google Scholar] [CrossRef] [PubMed]
  2. Wang, C.; Xia, K.; Wang, H.; Liang, X.; Yin, Z.; Zhang, Y. Advanced Carbon for Flexible and Wearable Electronics. Adv. Mater. 2019, 31, e1801072. [Google Scholar] [CrossRef] [PubMed]
  3. Iqbal, S.; Khatoon, H.; Pandit, A.H.; Ahmad, S. Recent development of carbon based materials for energy storage devices. Mater. Sci. Energy Technol. 2019, 2, 417–428. [Google Scholar] [CrossRef]
  4. Liu, J.; Bao, S.; Wang, X. Applications of Graphene-Based Materials in Sensors: A Review. Micromachines 2022, 13, 184. [Google Scholar] [CrossRef]
  5. Milcovich, G.; Lettieri, S.; Antunes, F.E.; Medronho, B.; Fonseca, A.C.; Coelho, J.F.; Marizza, P.; Perrone, F.; Farra, R.; Dapas, B.; et al. Recent advances in smart biotechnology: Hydrogels and nanocarriers for tailored bioactive molecules depot. Adv. Colloid Interface Sci. 2017, 249, 163–180. [Google Scholar] [CrossRef] [Green Version]
  6. Wang, J.; Liu, X.; Milcovich, G.; Chen, T.-Y.; Durack, E.; Mallen, S.; Ruan, Y.; Weng, X.; Hudson, S.P. Co-reductive fabrication of carbon nanodots with high quantum yield for bioimaging of bacteria. Beilstein J. Nanotechnol. 2018, 9, 137–145. [Google Scholar] [CrossRef] [Green Version]
  7. Bartelmess, J.; Milcovich, G.; Maffeis, V.; D’Amora, M.; Bertozzi, S.M.; Giordani, S. Modulation of Efficient Diiodo-BODIPY in vitro Phototoxicity to Cancer Cells by Carbon Nano-Onions. Front. Chem. 2020, 8, 573211. [Google Scholar] [CrossRef]
  8. Li, W.; Fang, R.; Xia, Y.; Zhang, W.; Wang, X.; Xia, X.; Tu, J. Multiscale Porous Carbon Nanomaterials for Applications in Advanced Rechargeable Batteries. Batter. Supercaps 2019, 2, 9–36. [Google Scholar] [CrossRef] [Green Version]
  9. Liu, J.; Wickramaratne, N.P.; Qiao, S.Z.; Jaroniec, M. Molecular-based design and emerging applications of nanoporous carbon spheres. Nat. Mater. 2015, 14, 763–774. [Google Scholar] [CrossRef]
  10. Rodriguez-Fernandez, H.; Dasappa, S.; Sabado, K.D.; Camacho, J. Production of Carbon Black in Turbulent Spray Flames of Coal Tar Distillates. Appl. Sci. 2021, 11, 10001. [Google Scholar] [CrossRef]
  11. Singh, M.; Gharpure, A.; Wal, R.L.V.; Kollar, J.; Herd, C.R. Effect of Fuel Composition on Carbon Black Formation Pathways. Appl. Sci. 2022, 12, 2569. [Google Scholar] [CrossRef]
  12. Richter, H.; Labrocca, A.J.; Grieco, W.J.; Taghizadeh, K.; Lafleur, A.A.L.; Howard, J.B. Generation of Higher Fullerenes in Flames. J. Phys. Chem. B 1997, 101, 1556–1560. [Google Scholar] [CrossRef]
  13. Height, M.J.; Howard, J.B.; Tester, J.W.; Sande, J.B.V. Flame synthesis of single-walled carbon nanotubes. Carbon 2004, 42, 2295–2307. [Google Scholar] [CrossRef]
  14. Khosravi, M.; Amini, M.K. Flame synthesis of carbon nanofibers on carbon paper: Physicochemical characterization and application as catalyst support for methanol oxidation. Carbon 2010, 48, 3131–3138. [Google Scholar] [CrossRef]
  15. Memon, N.; Tse, S.D.; Chhowalla, M.; Kear, B.H. Role of substrate, temperature, and hydrogen on the flame synthesis of graphene films. Proc. Combust. Inst. 2013, 34, 2163–2170. [Google Scholar] [CrossRef]
  16. Mulay, M.R.; Chauhan, A.; Patel, S.; Balakrishnan, V.; Halder, A.; Vaish, R. Candle soot: Journey from a pollutant to a func-tional material. Carbon 2019, 144, 684–712. [Google Scholar] [CrossRef]
  17. Lee, W.-J.; Kim, H.V.; Choi, J.-H.; Panomsuwan, G.; Lee, Y.-C.; Rho, B.-S.; Kang, J. Recycling Waste Soot from Merchant Ships to Produce Anode Materials for Rechargeable Lithium-Ion Batteries. Sci. Rep. 2018, 8, 5601. [Google Scholar] [CrossRef] [Green Version]
  18. Baldelli, A.; Esmeryan, K.D.; Popovicheva, O. Turning a negative into a positive: Trends, guidelines and challenges of developing multifunctional non-wettable coatings based on industrial soot wastes. Fuel 2021, 301, 121068. [Google Scholar] [CrossRef]
  19. Zhang, B.; Wang, D.; Yu, B.; Zhou, F.; Liu, W. Candle soot as a supercapacitor electrode material. RSC Adv. 2014, 4, 2586–2589. [Google Scholar] [CrossRef]
  20. Campbell, D.J.; Andrews, M.J.; Stevenson, K.J. New Nanotech from an Ancient Material: Chemistry Demonstrations Involving Carbon-Based Soot. J. Chem. Educ. 2012, 89, 1280–1287. [Google Scholar] [CrossRef]
  21. D’Anna, A. Combustion-formed nanoparticles. Proc. Combust. Inst. 2009, 32, 593–613. [Google Scholar] [CrossRef]
  22. Wang, H. Formation of nascent soot and other condensed-phase materials in flames. Proc. Combust. Inst. 2011, 33, 41–67. [Google Scholar] [CrossRef]
  23. Martin, J.W.; Salamanca, M.; Kraft, M. Soot inception: Carbonaceous nanoparticle formation in flames. Prog. Energy Combust. Sci. 2022, 88, 100956. [Google Scholar] [CrossRef]
  24. Schulz, F.; Commodo, M.; Kaiser, K.; De Falco, G.; Minutolo, P.; Meyer, G.; D’anna, A.; Gross, L. Insights into incipient soot formation by atomic force microscopy. Proc. Combust. Inst. 2019, 37, 885–892. [Google Scholar] [CrossRef]
  25. Commodo, M.; Kaiser, K.; De Falco, G.; Minutolo, P.; Schulz, F.; D’Anna, A.; Gross, L. On the early stages of soot formation: Molecular structure elucidation by high-resolution atomic force microscopy. Combust. Flame 2019, 205, 154–164. [Google Scholar] [CrossRef]
  26. Vitiello, G.; De Falco, G.; Picca, F.; Commodo, M.; D’Errico, G.; Minutolo, P.; D’Anna, A. Role of radicals in carbon clustering and soot inception: A combined EPR and Raman spectroscopic study. Combust. Flame 2019, 205, 286–294. [Google Scholar] [CrossRef]
  27. Commodo, M.; De Falco, G.; Larciprete, R.; D’Anna, A.; Minutolo, P. On the hydrophilic/hydrophobic character of carbonaceous nanoparticles formed in laminar premixed flames. Exp. Therm. Fluid Sci. 2016, 73, 56–63. [Google Scholar] [CrossRef]
  28. Johansson, K.O.; Dillstrom, T.; Monti, M.; El Gabaly, F.; Campbell, M.F.; Schrader, P.E.; Popolan-Vaida, D.M.; Richards-Henderson, N.K.; Wilson, K.R.; Violi, A.; et al. Formation and emission of large furans and oxygenated hydrocarbons from flames. Proc. Natl. Acad. Sci. USA 2016, 113, 8374–8379. [Google Scholar] [CrossRef] [Green Version]
  29. Commodo, M.; D’Anna, A.; De Falco, G.; Larciprete, R.; Minutolo, P. Illuminating the earliest stages of the soot formation by photoemission and Raman spectroscopy. Combust. Flame 2017, 181, 188–197. [Google Scholar] [CrossRef]
  30. De Falco, G.; Mattiello, G.; Commodo, M.; Minutolo, P.; Shi, X.; D’Anna, A.; Wang, H. Electronic band gap of flame-formed carbon nanoparticles by scanning tunneling spectroscopy. Proc. Combust. Inst. 2021, 38, 1805–1812. [Google Scholar] [CrossRef]
  31. Liu, C.; Singh, A.V.; Saggese, C.; Tang, Q.; Chen, D.; Wan, K.; Vinciguerra, M.; Commodo, M.; De Falco, G.; Minutolo, P.; et al. Flame-formed carbon nanoparticles exhibit quantum dot behaviors. Proc. Natl. Acad. Sci. USA 2019, 116, 12692–12697. [Google Scholar] [CrossRef] [PubMed] [Green Version]
  32. Baldelli, A.; Trivanovic, U.; Sipkens, T.A.; Rogak, S.N. On determining soot maturity: A review of the role of microscopy- and spectroscopy-based techniques. Chemosphere 2020, 252, 126532. [Google Scholar] [CrossRef] [PubMed]
  33. De Falco, G.; Commodo, M.; Bonavolontà, C.; Pepe, G.P.; Minutolo, P.; D’Anna, A. Optical and electrical characterization of carbon nanoparticles produced in laminar premixed flames. Combust. Flame 2014, 161, 3201–3210. [Google Scholar] [CrossRef]
  34. Dobbins, R.A.; Megaridis, C.M. Morphology of flame-generated soot as determined by thermophoretic sampling. Langmuir 1987, 3, 254–259. [Google Scholar] [CrossRef]
  35. Tricoli, A.; Bo, R. Nanoparticle-based biomedical sensors. Mater. Sci. Eng. R Rep. 2020, 15, 247–269. [Google Scholar] [CrossRef]
  36. Merchan-Breuer, D.A.; Murphy, E.; Berka, B.; Nova, L.C.M.; Liu, Y.; Merchan-Merchan, W. Synthesis of Carbonaceous Hydrophobic Layers through a Flame Deposition Process. Appl. Sci. 2022, 12, 2427. [Google Scholar] [CrossRef]
  37. Dhall, S.; Mehta, B. Room temperature hydrogen gas sensor using candle carbon soot. Int. J. Hydrogen Energy 2020, 45, 14997–15002. [Google Scholar] [CrossRef]
  38. Huth, M. Granular metals: From electronic correlations to strain-sensing applications. J. Appl. Phys. 2010, 107, 113709. [Google Scholar] [CrossRef]
  39. De Falco, G.; Commodo, M.; Barra, M.; Chiarella, F.; D’Anna, A.; Aloisio, A.; Cassinese, A.; Minutolo, P. Electrical characterization of flame-soot nanoparticle thin films. Synth. Met. 2017, 229, 89–99. [Google Scholar] [CrossRef]
  40. Sgro, L.; Basile, G.; Barone, A.; D’Anna, A.; Minutolo, P.; Borghese, A.; D’Alessio, A. Detection of combustion formed nanoparticles. Chemosphere 2003, 51, 1079–1090. [Google Scholar] [CrossRef]
  41. Ferrari, A.C.; Basko, D.M. Raman spectroscopy as a versatile tool for studying the properties of graphene. Nat. Nanotechnol. 2013, 8, 235–246. [Google Scholar] [CrossRef] [Green Version]
  42. Merlen, A.; Buijnsters, J.G.; Pardanaud, C. A guide to and review of the use of multiwavelength raman spectroscopy for characterizing defective aromatic carbon solids: From graphene to amorphous carbons. Coatings 2017, 7, 153. [Google Scholar] [CrossRef]
  43. Bruschi, P.; Nannini, A. Current vs. voltage characteristics of ion-beam-grown polymer-metal granular thin films. Thin Solid Films 1991, 201, 29–38. [Google Scholar] [CrossRef]
  44. Balberg, I.; Wagner, N.; Goldstein, Y.; Weisz, S. Tunneling and Percolation Behavior in Granular Metals. MRS Proc. 1990, 195, 233–238. [Google Scholar] [CrossRef]
  45. Stauffer, D.; Aharony, A. Introduction to Percolation Theory, 2nd ed.; Taylor & Francis: London, UK, 1994. [Google Scholar]
  46. Obermeier, E.; Kopystynski, P.; NieBl, R. Characteristics of polysilicon layers and their application in sensors. In IEEE Solid-State Sensors Workshop; IEEE Press: New York, NY, USA, 1986. [Google Scholar]
  47. Kuo, J.T.W.; Yu, L.; Meng, E. Micromachined Thermal Flow Sensors—A Review. Micromachines 2012, 3, 550–573. [Google Scholar] [CrossRef] [Green Version]
  48. Di Bartolomeo, A.; Sarno, M.; Giubileo, F.; Altavilla, C.; Iemmo, L.; Piano, S.; Bobba, F.; Longobardi, M.; Scarfato, A.; Sannino, D.; et al. Multiwalled carbon nanotube films as small-sized temperature sensors. J. Appl. Phys. 2009, 105, 064518. [Google Scholar] [CrossRef]
  49. Al-Mumen, H.; Rao, F.; Dong, L.; Li, W. Design, fabrication, and characterization of graphene thermistor. In Proceedings of the 8th Annual IEEE International Conference on Nano/Micro Engineered and Molecular Systems, Suzhou, China, 7–10 April 2013; pp. 1135–1138. [Google Scholar] [CrossRef]
  50. Liu, G.; Guo, L.; Liu, C.; Wu, Q. Evaluation of different calibration equations for NTC thermistor applied to high-precision temperature measurement. Measurement 2018, 120, 21–27. [Google Scholar] [CrossRef]
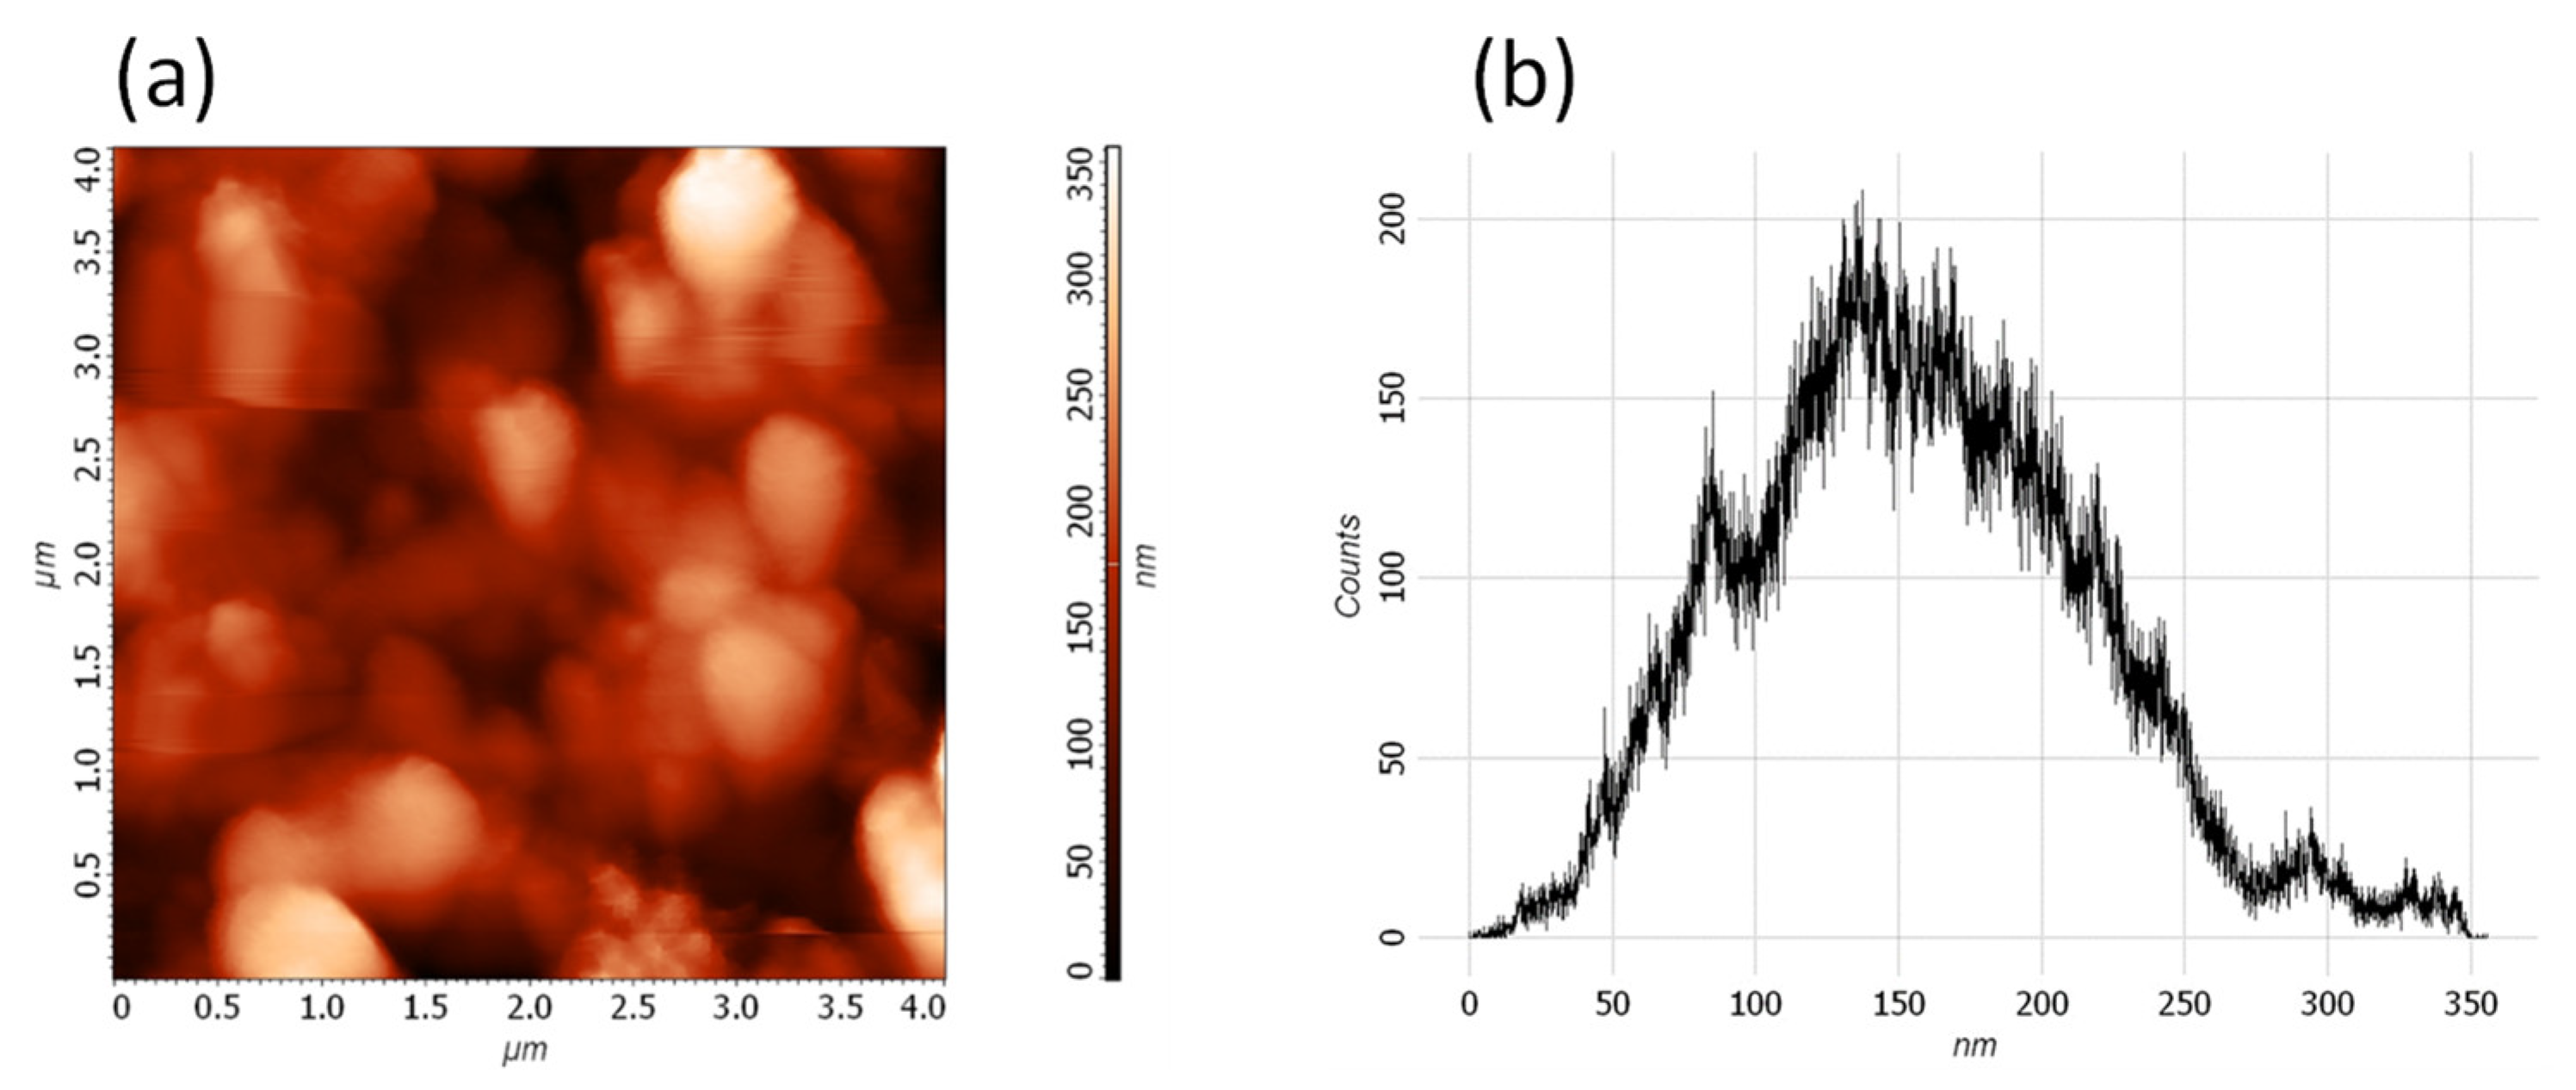
Figure 1. (a) AFM image of the collected flame-formed CNPs deposited on the substrate. (b) Distribution of the heights measured in the AFM image.
Applsci 12 07714 g001
Figure 2. Raman spectrum of flame-formed carbon nanoparticles.
Applsci 12 07714 g002
Figure 3. I–V curve measured for applied voltage ranging from −10 V to 10 V at room temperature (black line) and best fit from Equation (3) (red line).
Applsci 12 07714 g003
Figure 4. Current measured for an applied voltage of 10 V when the temperature is raised stepwise from the ambient temperature to 85 °C.
Applsci 12 07714 g004
Figure 5. (a) I–V curves measured for applied voltage ranging from −10 V to 10 V at ambient temperature and T increasing from 300 to 393 K with a step of 10 K. (b) Electrical resistance, ΔVI, measured in the temperature interval of 300 K–400 K and the temperature dependence of the derivative of resistance with respect to the temperature.
Applsci 12 07714 g005
Figure 6. Arrhenius plot of ln(R/R0) versus 1/(kb*T).
Applsci 12 07714 g006
Figure 7. Temperature coefficient of resistance TCR measured over the interval of 300 K–400 K.
Applsci 12 07714 g007
Figure 8. (a) Functional relationship between resistance and temperature, 1/T vs. ln(R/R0) with the resistance evaluated R0 at ambient temperature. (b) Residuals versus T.
Applsci 12 07714 g008
Publisher’s Note: MDPI stays neutral with regard to jurisdictional claims in published maps and institutional affiliations.