1. Introduction
Because of the rapid developments in Big Data and internet technology [
1], the reformation of school’s comprehensive evaluation system has been improved continuously, and students’ grades are the most comprehensive reflection of course learning, which directly affects their future development. Teachers, as guides in the process of students’ growth and success, should keep pace with times in education. As per the present academic management model, they should consider how to transform its lag into progress, thus helping students make academic plans in advance and comprehensively analysing the academic performance of students, which is an important part of academic work.
Data mining [
2] helps researchers discover and understand implicit patterns in the collection using its existing data. Because of the continuous development and evolution of Big Data technology, it has gradually evolved into a data mining technology based on the era of Big Data [
3].
Educational data mining [
4,
5,
6] refers to data mining techniques used to analyse educational data. With the prolonged COVID-19 outbreak [
7], as more efficient data are transferred from offline to online, educational data mining faces bigger challenges, thereby providing researchers with additional raw materials. Feldman-Maggor et al. [
8] examined the learning process of undergraduate online general chemistry courses using two logistical regression models and a decision tree algorithm. The submission status of optional assignments and the student’s cumulative video open mode have been reported to have strong correlations with the students’ grades.
Machine learning (ML) [
9,
10,
11] is a cutting-edge tool that simulates human behaviour via computer algorithms. Based on the original data, certain potential objective laws are summarised via continuous machine calculations.
Given the rapid development of ML, the aspect of deep learning [
12] is particularly prominent, and more deep-level algorithms are being applied in all walks of life. Deep neural networks [
13,
14,
15,
16,
17,
18] are used for predicting linear regression (LR) problems. The primary advantages are as follows: (1) power consumption is independent of batch size and architecture; (2) accuracy and inference time have a hyperbolic relationship; (3) the energy constraint is the upper limit of the maximum achievable accuracy and model complexity; and (4) the number of operations is a reliable estimate of the inference time.
Although educational data mining and learning analysis have experienced an increase in exploration and use, they are still difficult to accurately define. However, deep learning methods predict college course grades and recommend optimal learning methods for mid- and down-stream students based on focus.
2. Research Actuality
In the 1960s, ML algorithms such as perceptron [
19], decision tree [
20], and logical regression [
21] were first used in teaching management research in major foreign universities, such as predicting the efficiency of online classes, predicting the situation of students staying in school, and assessing the advantages and disadvantages of school teaching.
By searching for ML performance prediction on Google Scholar, 1,670,000 search results were identified, of which 59,700 were reported since 2021. It is obvious that this research area still has global interest. Balqis et al. [
22] proposed a custom rule-based model to identify risk students and put forwards reasonable remedial action methods in the research of student achievement analysis and prediction, through which they could recognise the most important and influential attributes to take appropriate corrective measures and help the high-risk students as early as possible. Khakata Esther et al. [
23] used the decision tree to predict students’ performance in the internet media environment to judge whether they may perform well in using the internet technology in their learning. Alam talha Mahboob et al. [
24] proposed a new method to measure the performance of public education institutions using an ML model. They constructed an effective model through five ML algorithms, such as the J48 decision tree, and compared their results. The artificial neural network outperforms other models in some feature selection methods. Hussain et al. [
25] used ML (training regression models and DT-classifiers) to predict students’ academic performance at secondary and intermediate levels, and then they finally analysed the results obtained by the model. The obtained results demonstrated that ML techniques are effective and relevant for predicting student performance. Berens et al. [
26] built an early detection system that uses regression analysis, neural networks, decision trees, and AdaBoost algorithms to identify student characteristics that distinguish potential dropouts and graduates, and its highest accuracy can be improved to 90%. Baashar et al. [
27] used artificial neural networks (ANNs) to predict students’ academic performance, thus confirming that ANNs are always used along with data analysis and data mining methods, thereby allowing researchers to evaluate the validity of their results in assessing academic achievement.
Domestically, by searching Google Scholar for predicting Chinese ML results, >6000 articles written in Chinese can be obtained in China, of which only 500 articles have been published after 2021. Because certain outstanding domestic scholars publish articles in English (published here indicates that there are fewer related articles written in Chinese), Yuling et al. [
28] proposed a multi-task MIML learning method for pre-class student achievement prediction, which can predict students who are at risk of failing to a certain extent before the course starts, thus improving the predictability of traditional methods. Hongchen et al. [
29] proposed a method for predicting student achievement based on factor analysis and back-propagation (BP) neural network. The experiments on the Q&A event log demonstrate that the current method has certain effects. Junnan et al. [
30] predicted students’ online grades using data mining and predicted learners’ course grades based on their online learning status. Jia et al. [
31] analysed and interpreted large educational data using five typical ML algorithms: logistic regression, decision tree, naive Bayes algorithm, back-propagation, and random forest, and finally confirmed that the logistic regression algorithm is the most accurate student achievement prediction algorithm. Guang et al. [
32] used the Bayesian network based on evidence-based reasoning to effectively solve low credibility and weak interpretability problems. Compared with the commonly used ML and deep learning models, it demonstrated lower error and stronger interpretability.
Countries attach considerable importance to monitoring the academic performance of students. Students are the future and hope of a country, and their academic status is something we should all focus on. The analysis and research of ML data in education is extensively involved at home and abroad, thus aiding the education of students, teachers, and institutions. This is used to analyse and process the historical data of students’ academic performance, classify and manage students, and propose targeted plans suitable for students’ academic study to assist teachers in formulating reasonable teaching plans more effectively.
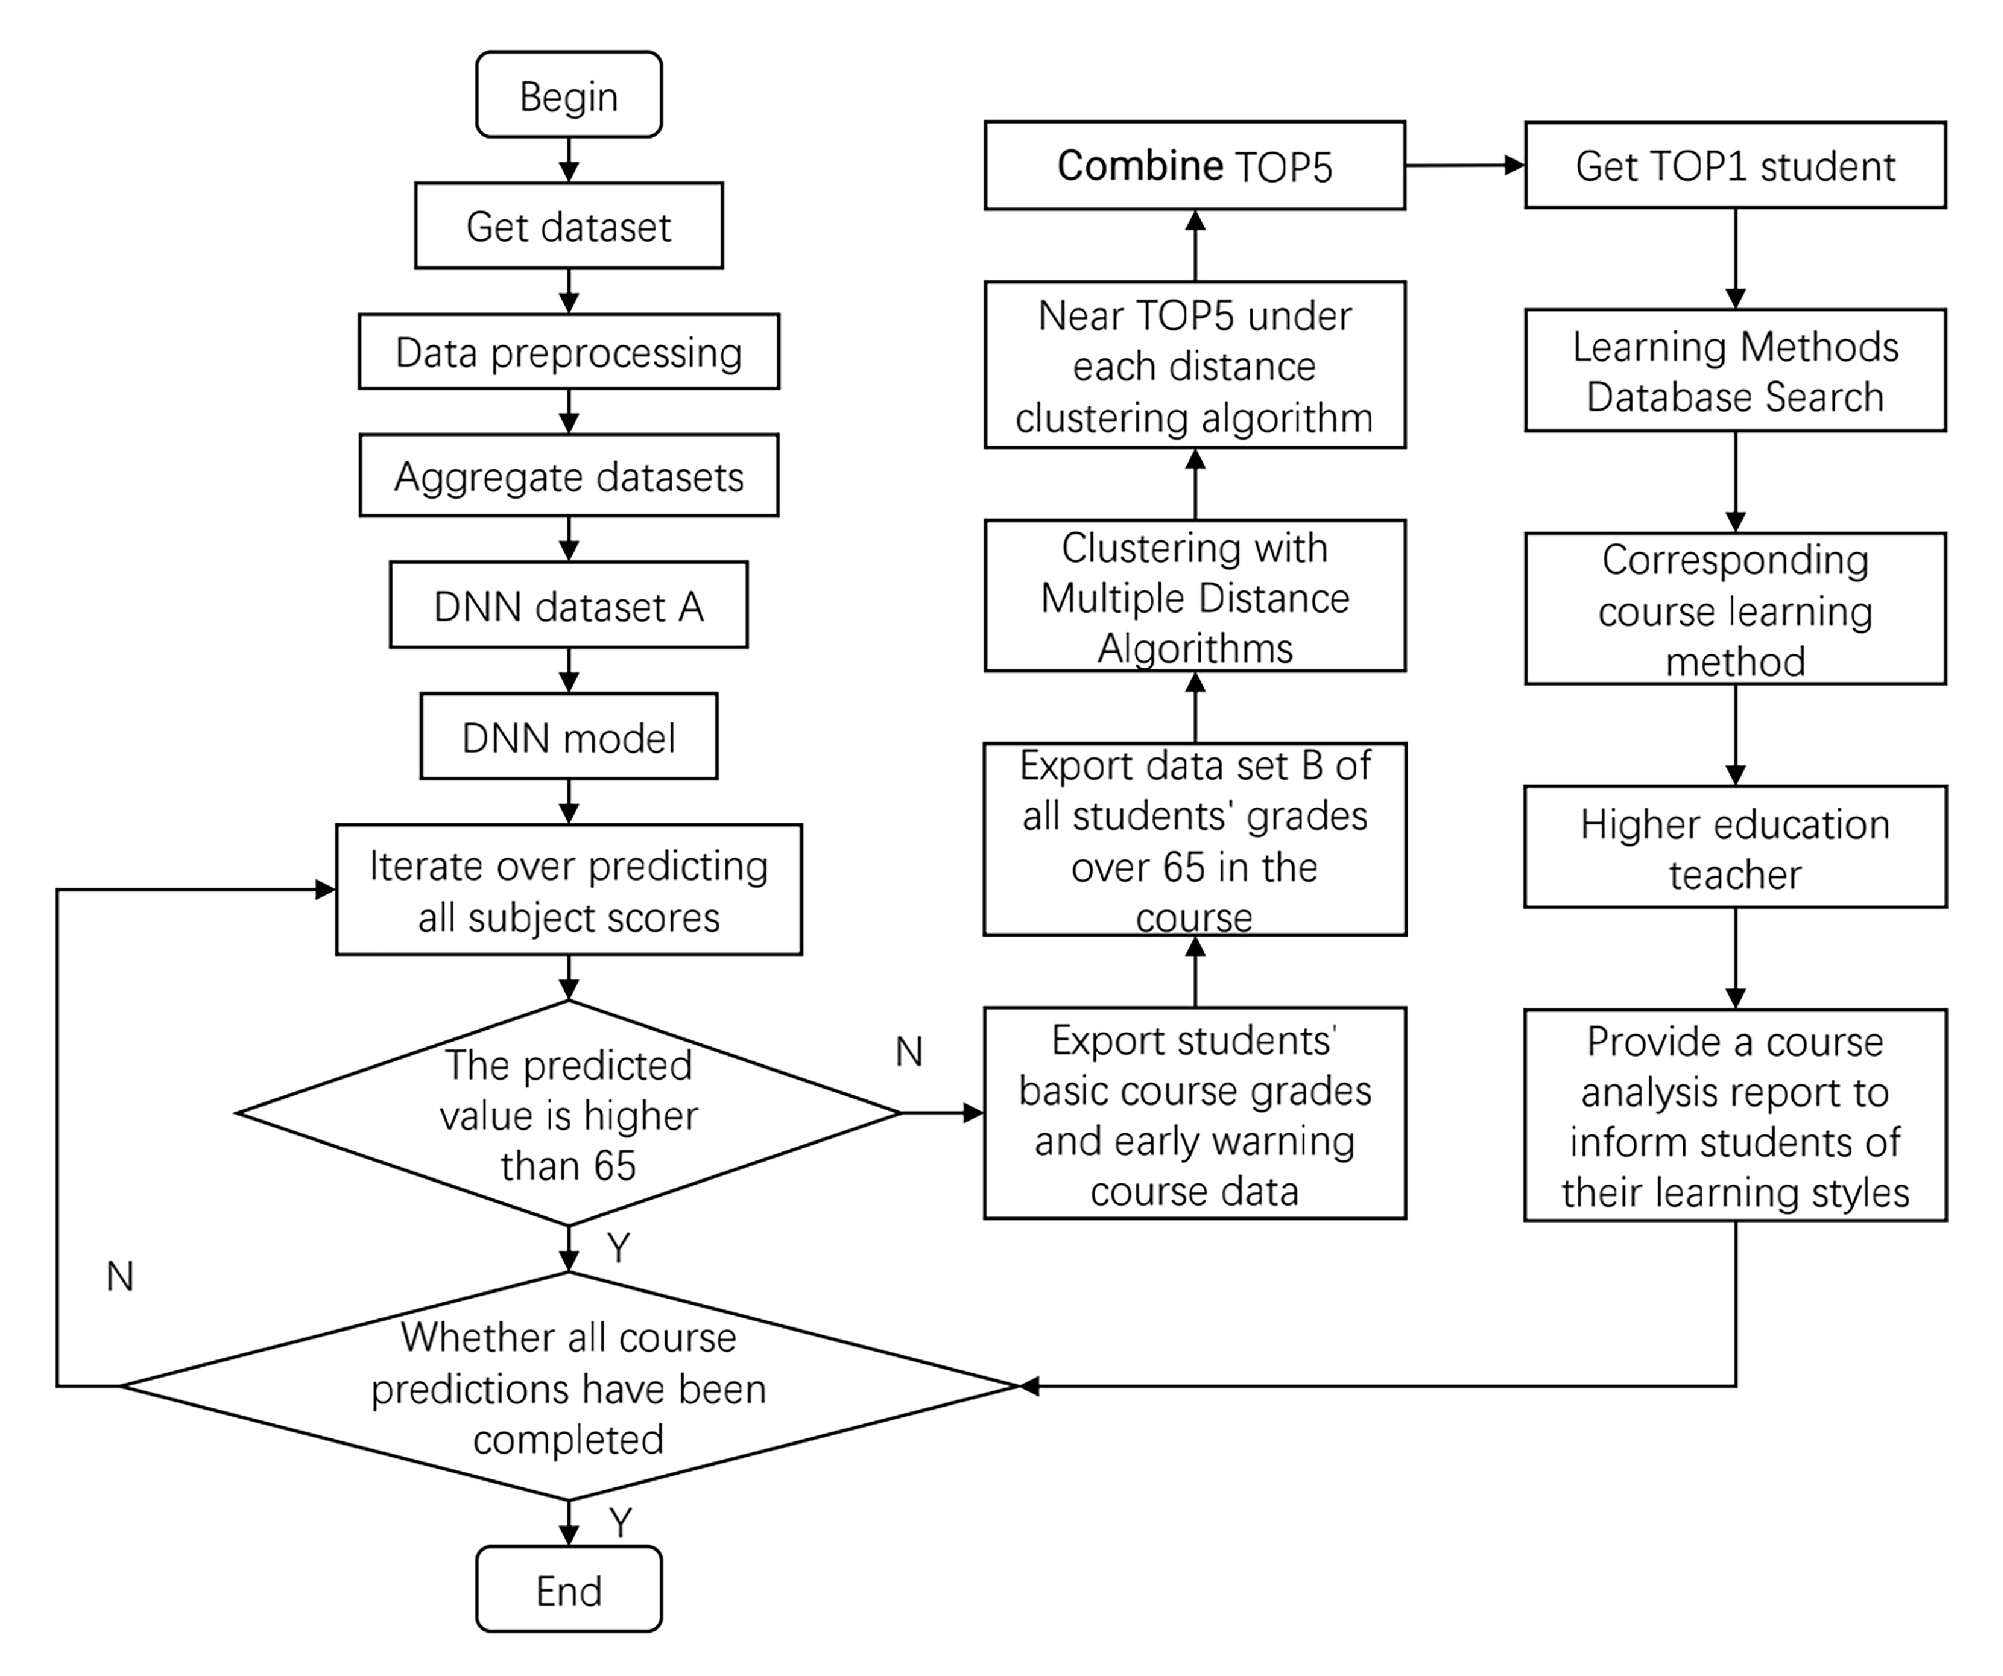
Although several experts have conducted relevant research on students achieving early-warning and similar learning method recommendation, few substantive applications have been performed. In this regard, we can further improve the prediction effect by anticipating the likely pressure and challenges in the courses ahead of time and sending different course analyses to students so that each student receives a clear message about each course based on the powerful fitting and generalisation ability of the deep neural network (DNN). For students who may fail the course exam, we could store their data in the early-warning information table. By integrating the clustering algorithm of association rules, we match a senior student, who has a similar learning situation but has passed or been promoted to the subsequent courses, and then find the student and seek his information such as his daily learning, homework, review, and exam preparation method in the corresponding course. Later, we can provide accurate feedback to the students taking the course, achieving the person-to-person improvement effect. The specific model design idea is shown in
Figure 1.
3. Dataset
3.1. Data Sources
The dataset used in this study comes from students’ performance data in the College of Metallurgical Engineering at a university in the Anhui Province. After cleaning, the major achievement data of 1683 students from 2017 to 2020 were selected, including elective and compulsory scores. In this study, the compulsory score data were solely used because of the lack of consistency in students’ elective courses. Considering the different courses of different majors and the principle of diversity of sample selection, we chose the Metallurgical Engineering major, which has the largest number of students, and obtained 21,350 compulsory score data from 675 students as the total dataset.
For our daily teaching work, we have a certain tendency towards the relevance of the same type of course. Because of the universality of laboratories, we chose professional courses and basic public courses (language courses and logic courses) as the representative of general courses and directly used the specific courses (Metallurgical Physical Chemistry 1, College English and Linear Algebra), using the Pearson correlation coefficient method to obtain the correlation table to confirm the universality of the current data.
Since the system uses two ML models, we must carry out some processing on the total dataset and obtain two types of datasets, namely the conventional dataset A (including all students’ grades). Dataset B, where grades are higher than the early-warning line (all grades higher than 65 in the corresponding courses are selected), can be generated according to the grades of each subject requiring an early warning.
3.2. Data Pre-Processing
To provide a dataset suitable for the DNN and clustering algorithm based on association analysis, as much as possible, the pre-processing steps should be standardised. The detailed pre-processing process in this study is as follows:
- (1)
Data integration. The data obtained from the school’s educational administration system is a single piece of score data containing several attributes of the course, which is first stored in the MySQL server of the student integrated management system independently developed by the college, and the current 21,350 scores are integrated and exported to the table using database statements.
- (2)
Data cleaning. Data cleaning refers to screening and reviewing the original data, as well as addressing the inconsistency of data, missing data, wrong data, and duplicate data. It should be considered that as the training scheme evolves, the curriculum system in different grades will change, and some courses will be replaced or deleted from the perspective of professional personnel.
- (3)
Data conversion and processing. Using the Python Pandas framework, the String type is converted to the double type, and the excellent (A), good (B), moderate (C), pass (D), and fail (E) types are converted to numerical values of 95, 85, 75, 65, and 55, respectively. Then, missed exams are converted to 0 points, and the missing values are converted into the average of the student’s average score and the average score of the course using the horizontal and vertical categories for the student’s grade data below 10 points. The mask and number start with student number 0.
- (4)
Training data division. After the cleaned data are randomly disrupted, the original data are randomly divided into a training set and a verification set in a 3:1 ratio. The training set is used to train the DNN model, and the verification set is used to test the generalisation ability of the model after each iteration to prevent overfitting.
4. Grade Prediction Method Based on DNNs
4.1. Introduction of DNN Algorithm
A neural network is the repeated superposition of the perceptron [
33] model. The deep neural network (DNN) [
13,
14,
15,
16,
17,
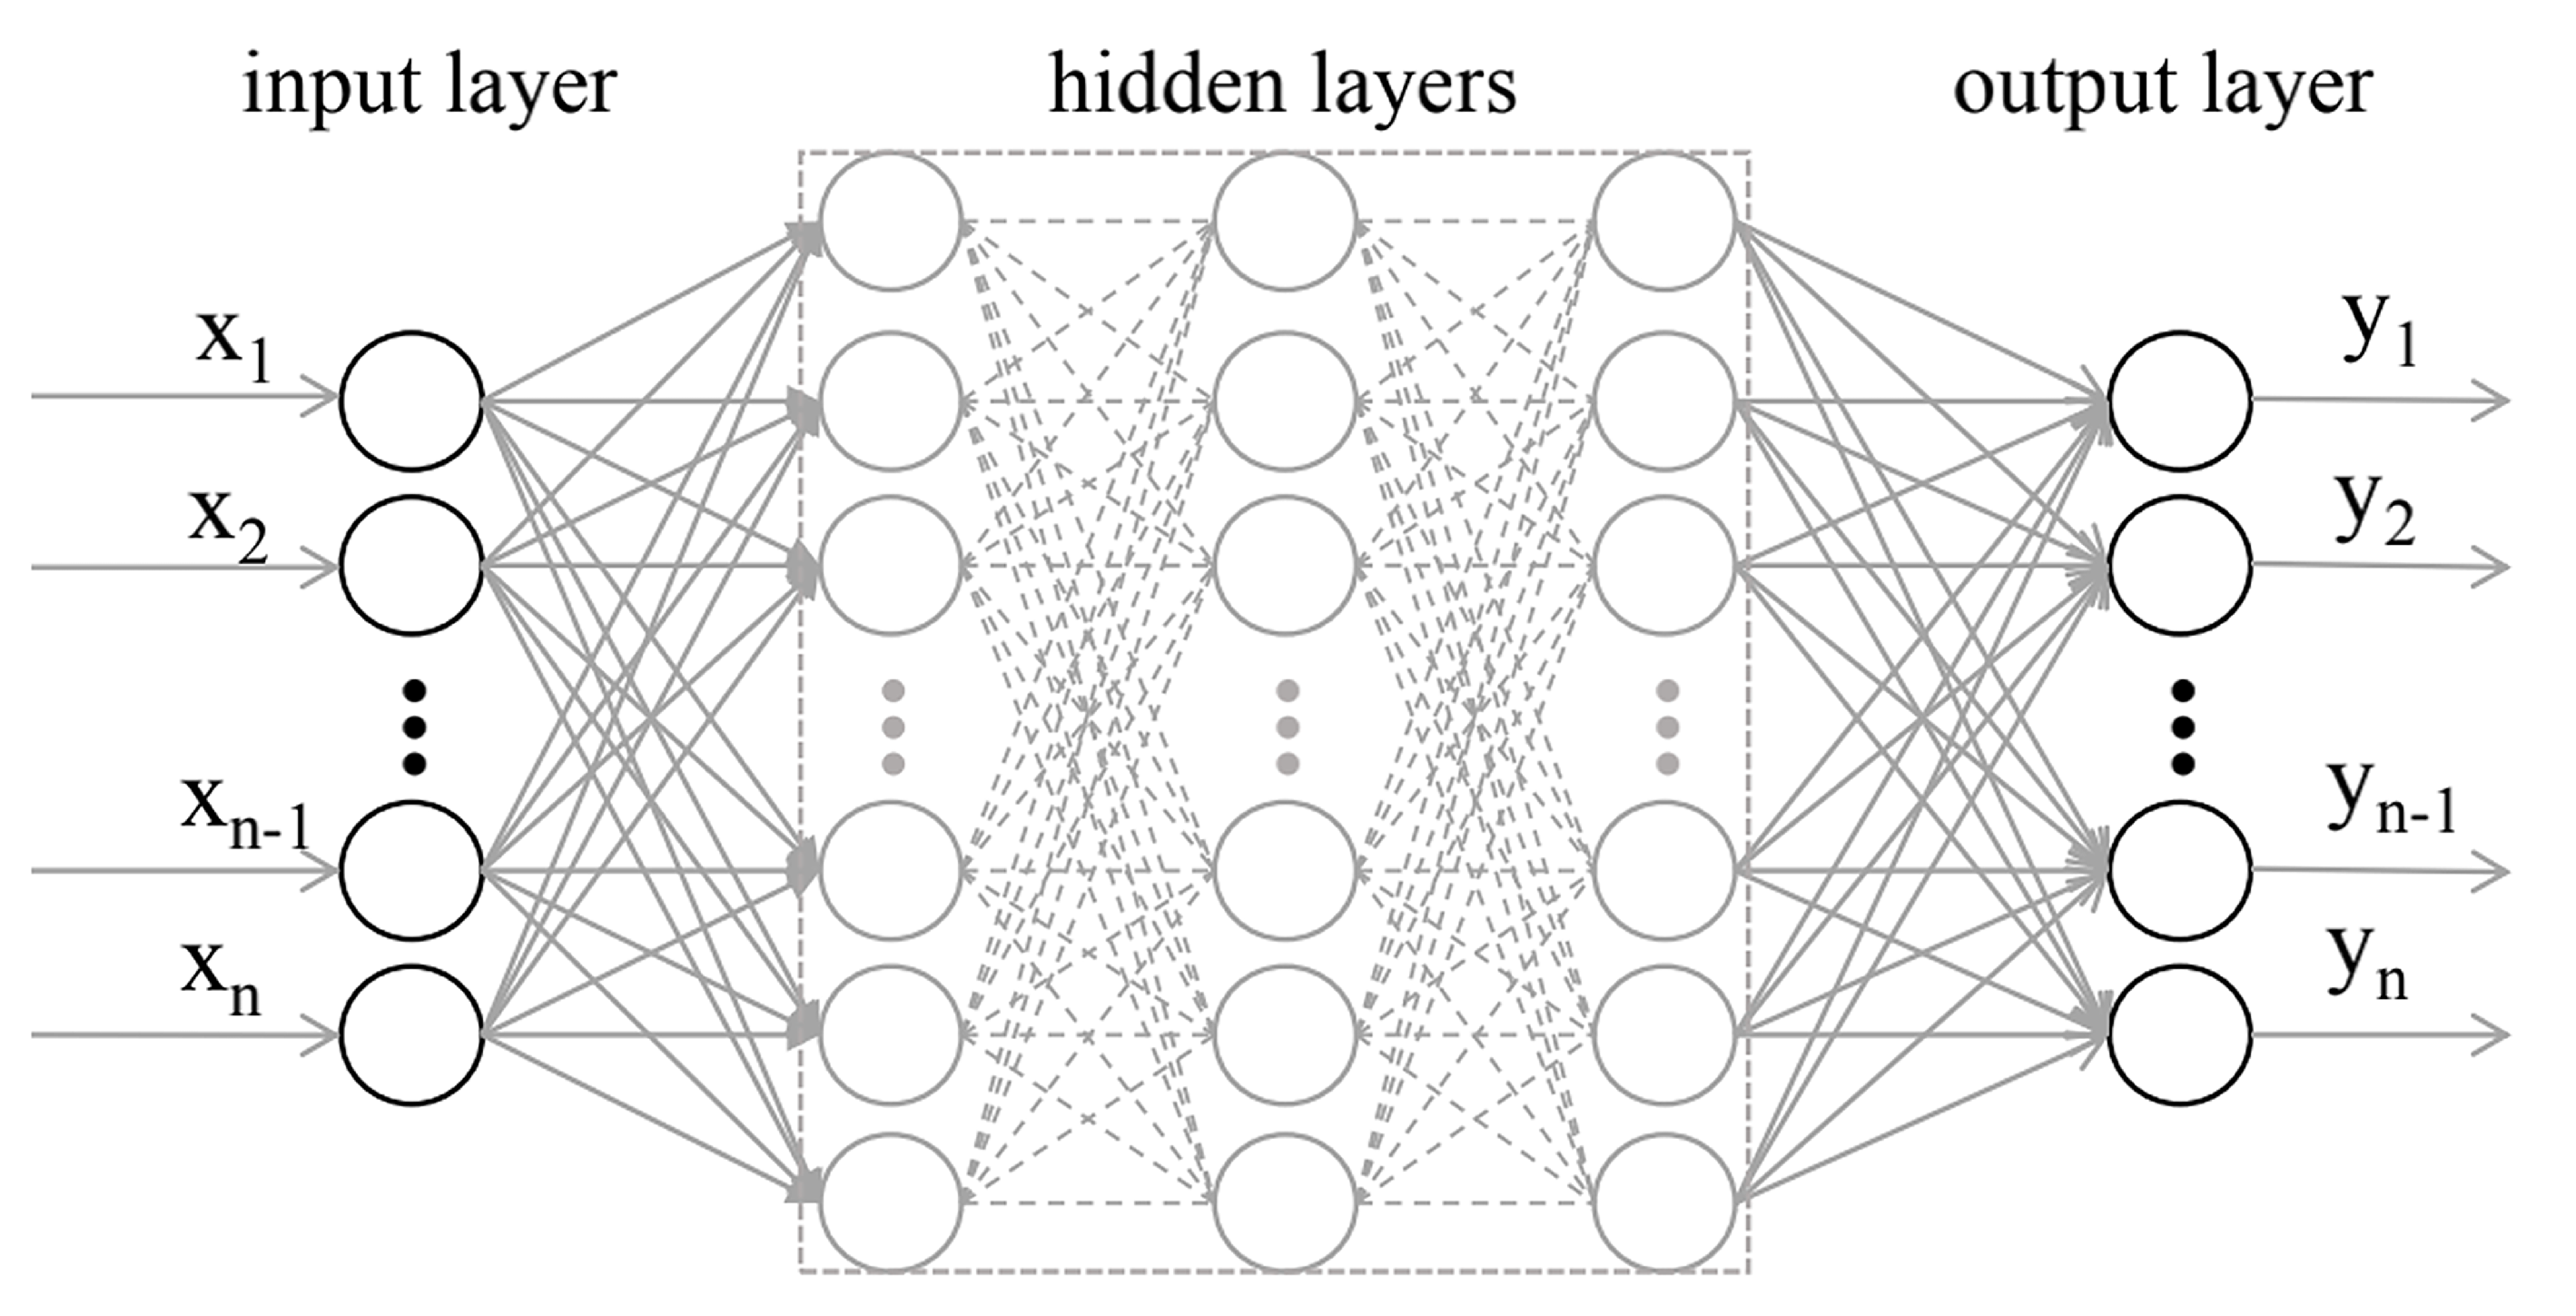
18] can be understood as a large network structure composed of neurons with nonlinear units. Compared with the NN, the DNN can help obtain the extremely complex multivariate multi-function model, and solve more complex problems, as shown in
Figure 2.
It is a multi-layer neural network that examines the output characteristics of the upper layer as the input characteristics of the next layer. After multi-layer nonlinear transformation training of the original characteristics, the characteristics of the initial sample are gradually converted to another feature space as per requirements to examine the characteristics of the existing input with better effects. Because of the rich dimension of the massive data, the DNN is capable of mining the potential information of the massive data more comprehensively and accurately by establishing multi-level mathematical models and training massive data to improve the information value.
The DNN is divided according to the positions of the different network layers. The first layer is the input layer, the last layer is the output layer, and the middle layers are concealed layers. As shown in
Figure 2, any neuron in each connected layer is fully connected. The weighted coefficient matrices W and bias B are used to perform a series of linear and activation operations of feed-forward propagation on the input vector. Finally, the model output results are obtained. Nevertheless, the training of the DNN model is completed via back-propagation. In the process, the loss function is used to measure the loss between the model output value and the real value (the model loss function in this study uses the mean square error loss (MSEL) function, as shown in Formula (1)). The weight coefficient matrices W and bias B are constantly updated until the training is completed.
The pseudocode of the DNN algorithm is shown in Algorithm 1.
4.2. Grade Prediction Based on the DNN
The DNN is built using the Python language and the Pytorch framework [
34], with 28-course scores as the featured item in the input and output layers predicting the scores of three courses. The network is also constructed with six hidden layers of 1375 neurons in total. Then, the number of neurons in the eight layers is 28, 256, 128, 512, 256, 128, 64, and 3, respectively. As shown in Algorithm 1, a number of parameters, such as activation, optimiser, loss, batch size, weight decay, epochs, and the early termination of iteration threshold, are set. The previously processed dataset A is used as a sample for training. Each layer’s W and B values are solved using iterative training with the BP until the current training iterations reach the specified number or the loss reaches the set threshold. Then, the trained model is solidified to the specified position to complete the training. Many experimental tests are performed following relevant steps. Finally, the MSEL between test and training data is used as an indicator to obtain and set multiple attribute parameters consistent with the project, thus obtaining the final training and results.
Figure 3 shows the decline process of the DNN training the MSEL.
| Algorithm 1 The Pseudocode of DNN Algorithm |
| Input: ‘data set’: the training set, validation set, test set; |
| 1: ‘epochs’: the maximum number of iterations; |
| 2: ‘batch size’: the minimum batch size of the data loader; |
| 3: ‘optimizer’: the optimisation algorithm (optimiser in torch.optim); |
| 4: ‘optim hparas’: the learning rate, momentum, regularisation factor; |
| 5: ‘early stop’: the number of epochs since the model was last improved; |
| 6: ‘save path’: the model will be saved here; |
| Output: The trained deep neural network model; |
| 7: initialize the parameters according to the input; |
| 8: data normalisation; |
| 9: create a network; |
| 10: train the network: |
| 11: repeat |
| 12: repeat for training process: |
| 13: forward-propagation; |
| 14: back-propagation; |
| 15: until for reaches the end condition |
| 16: Using the network; |
| 17: The data are reversely normalized; |
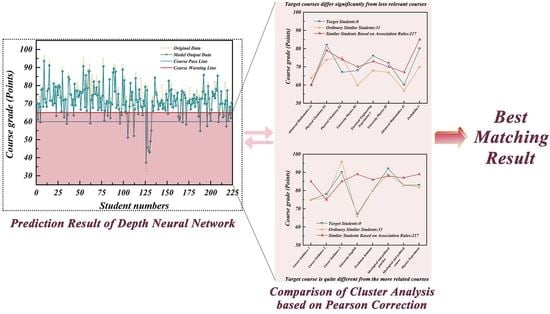
When the DNN training is completed, the model parameter is saved to the memory. Subsequently, the offline model is then read, and the trained network model is used to predict the grades. Finally, the predicted value is compared with that of real data, and dark-green and orange-dotted lines are used to mark the initial and predicted data values, respectively.
Because multiple courses require prediction, we selected three representative subjects to demonstrate in the experiment project, namely Physical Chemistry of Metallurgy 1, University English 4, and Linear Algebra B. As shown in
Figure 4, a broken line comparison diagram of predicted and real grades in the corresponding courses is generated using the abovementioned approach, with 65 and 60 as the early warning and passing grades, respectively.
The overlapped brownish-red line shows that the predicted data agree with the real data when the two lines are overlayed with a degree of transparency. However, the non-overlapping parts indicate certain errors in the model. Students’ grades in different semesters may fluctuate with attitude changes. However, they are not distinct in most data, indirectly demonstrating that the volatility is in the acceptable range. Accordingly, the current model and parameters can be used for stable test set fitting.
An automated batch programme is set up as per the process to predict the grades of all courses in the current semester. The prediction results are shown in
Table 1.
We automatically acquired the predicted grades of <65 and requested the student’s e-mail IDs from the database. E-mails were generated in fixed forms using the predicted grades via an automatic batch mail system and then sent to students from the college teacher’s official email to remind them to master the important learning points.
Students whose predicted grades were less than or equal to 65 are selected, and all students’ course information were obtained. In the total dataset, the pre-warning course of the student was higher than 65 points for screening, and the selected data were used as the dataset B above the pre-warning line. The dataset of the association analysis and clustering algorithm was used to perform the next test.
4.3. Comparative Experiment Based on LR
LR [
35] is a popular statistical method used to describe a continuous output variable related to multiple independent variables
,
. Random forest (RF) [
36] is an ensemble of tree-structured classifiers that have effectively been used for classification and regression problems. The BP neural network (BPNN) [
37] has many applications. It is a type of network with one-way propagation and multi-layer forward characteristics. It belongs to the feed-forward neural network and adopts the error BP algorithm and has been effectively used for classification and regression problems. By reading the relevant ML materials, the above three ML algorithms are reproduced, various model parameters are set according to the instructions, and the processed data set A is used for model training.
The mean absolute error (MAE), mean square error (MSE), mean absolute percentage error (MAPE), and prediction of ups-and-downs accuracy (PUDA) are used as indicators of the merits of the model, and their mathematical representations are shown in
Table 2.
is the ith true value and
is the ith-predicted value. The performance of various algorithms in the current dataset is shown in
Table 3. The larger the corresponding values of MAE, MSE, and MAPE in the table, the smaller the model effect and fitting performance of the model. The larger the value of the PUDA index, the better the fitting performance of the model. For the training (train) and test sets (test), if the difference between the train and test indicators is greater, the generalisation performance of the model will be worse and the model becomes over-fitted, and vice versa. The current model has a good generalisation performance.
By comparing the specific performance of multiple algorithms in the training and test sets divided by the current data set through the four train parameters, it becomes obvious that although RF better fits the training set, its performance in the test set is less effective. Furthermore, by comparing the two indicators of train MAE and MSE, the BPNN and the DNN yielded similar results; however, by using test MAE and MAE, it is clear that the BPNN is overfitted. Furthermore, in this study, the DNN used has a better generalisation performance than the above-mentioned three algorithms.
6. Conclusions
The grade prediction and learning recommendation model proposed in this study is combined with the DNN algorithm. Compared with LR, random forest, and BP neural network, the current model improves the prediction accuracy to some extent and can fit the data better. Using the improved clustering algorithm, to further migrate the day-to-day teaching of student grades ahead of the final exam. The early-grade warning work helps to improve students’ learning situations and helps them plan their studies better. Based on the model examples in this study, the proposed model can be extensively used in daily life, industrial production, and intelligent manufacturing. Replacing the existing complex tasks with relevant ML algorithms will ease labour for more creative work. With the development of deep learning, certain seemingly unrealistic ideas are becoming a reality.
Finally, the findings from this research are especially relevant in the context of the COVID-19 pandemic and will continue to be important in the post-COVID-19 world. Predicting student achievement has become extremely important with the rapid transition from offline learning to online learning in both schools and universities following the coronavirus outbreak in recent years. This dramatic change continues to attract educators, researchers, policymakers, and the media to focus their attention to a variety of learning theories. More factors, such as students’ learning, daily performance, and family influence, can be utilised as basic features for deep learning prediction with increasingly convenient internet tools and continuous optimisations and improvements in Big Data platforms. An overall evaluation of students’ learning will help locate students’ performance information more accurately, thus making it more convenient for teachers to have a comprehensive understanding of students and complete student work in advance.


