Abstract
The popularization of soybean cultivation in Central Poland is progressing due to the European Soy Declaration signed by 13 member states in Brussels on 17 July 2017. Hence, this research was initiated under the European Innovation Partnership on phenotyping soybean cultivars in two regions, i.e., Kuyavian-Pomeranian and Greater Poland for integrated systems. The aim of this study was to determine soybean potential in the agrotechnical and agroclimatic conditions, with the selection of the most suitable cultivars for tillage and no-tillage cultivation in the region of Central Poland. Strict field research was carried out in six locations from 2018–2020 on 20 cultivars selected in terms of their earliness of maturation to the climatic conditions. On the basis of meteorological data, it was found that half of the plantations suffered from drought stress, as evidenced by the hydrothermal coefficients (K) for the growing season of soybean K < 1.2. The significant multivariate relationship (R = 0.67; p < 0.001) between the hydrothermal coefficient K and the vegetation period days (VPD) as the predictors of the soybean yield was determined by the regression equation Y(yield) = 21.8 + 12.0 X(K) + 0.20 X(VPD). A significant multivariate relationship (R = 0.43; p < 0.01) was also found between the seed yield, hydrothermal coefficient K and the protein content, quantified with the regression equation Y(protein) = 32.6 + 0.25 X(Yield) + 0.28 X(K). In the no-tillage system of cultivation, the seed yield of soybean constantly increased with increasing K (+32.3% between dry/relatively dry and optimal periods, +22.4% between optimal and humid periods), while in the tillage system, the yield increased by 22.1% only when K rose from optimal to humid. In the seasons with optimum and humid conditions, no-tilled soybean produced more oil, in comparison to the season of dry conditions, and the opposite trend was found with the greater oil content in the tillage system. Meanwhile, a higher protein content was observed in the tillage system under humid conditions. All soybean cultivars were grouped according to the cluster analysis (k-means) with ANOVA in terms of vegetation period in days, seed yield, oil, and protein content for tillage and no-tillage cultivation. The study confirmed that soybean might be considered in the future as a profitable crop in Central Poland and create perspective for a low-input source of protein and oil.
1. Introduction
The soybean plant is native to Southeast and East Asia, where its cultivation dates back to 5000 years ago. In its home territory, soybeans are called “wonder plants” or “cows” [1] due to their wide application in nutrition and drug production [2]. Soybean (Glycine max) recognition as one of the most valuable crops in the world is largely due to the unique chemical composition of its seeds (18–22% oil and 33–45% protein) [3]. Common soybean (Glycine max (L.) Merrill), also known as veg soybean, belongs to the family Fabaceae, subfamily Faboideae, tribe Phaseole. Soybean is commonly used in human and animal nutrition and constitutes a raw material utilized in many industries, including biofuel and drug production [4,5]. Global soybean production has been increasing significantly over the last decades and is forecasted to continue increasing at least until 2030 [6,7]. The value of soya in livestock and human nutrition and industry has not yet been fully exploited [8,9]. In 2020, approximately 360 million tons of soybean seeds were produced worldwide. The annual production of soybean meal is approximately 220 million tons, which constitutes almost 70% of the total plant meal production [10]. Increasing the soybean cultivation area in Europe, including for fodder purposes, is one of the assumptions of the European Soy Declaration signed by 13 member states in Brussels on 17 July 2017 during the meeting of the Council of Agriculture Ministers of the European Union [11].
In Europe, soybean is grown in 22 countries, including Poland and all the countries adjacent to Poland. The history of soybean in Europe began in the first half of the 18th century, where it was initially cultivated in the Paris Botanical Gardens. Soybean was cultivated on an industrial scale in the 19th century in Austria, Germany, France and Italy [12]. In 2021, the EU’s soybean production was 2.93 million tons, and the main soybean producers are Italy, France, and Romania [11]. Raw soybean oil, a high-value unsaturated fatty acid [13], accounts for over 43 million metric tons of global production. Moreover, edible oil amounts to 26.7% of the total and the rest of it is used for animal feed [10,14].
Despite the long history of soybean cultivation in Poland, the crop area of its production has been presented annually as 14–25 thousand hectares in the last decade [15]. Due to the climatic and soil conditions, the southeastern region seems to be most suitable for soybean cultivation in Poland [16,17]. Moreover, the cultivation of soybean follows the trend of soil conservation made by no-tillage practices and by biochar application, which may have serious environmental and socioeconomic impacts [18]. It consists of leaving organic matter in the soil and reducing the intensity of soil cultivation, as well as lowering the carbon footprint [19,20,21].
Climate variability is one of the most important factors that influences each year the effects of agricultural production, even in high-input and high-technology advanced agricultural areas [22,23]. Some studies were dedicated to determining the limitations for soybean cultivation resulting from temporal variability of climate elements [24], aiming to adapt particular plant cultivars to projected changes in thermal conditions and water balances in the area of the United States [25]. The opinion that an increase in temperature and lengthening of the vegetation period was observed all across Poland has been confirmed for over 10 years [26,27,28]. However, scenarios on the fluctuations in the amount of precipitation in Central Europe are ambiguous [29,30,31].
A strong argument in favor of the popularization of soybean cultivation in Poland has to do primarily with an increasing number of cultivars being adapted for cultivation in our climate and, compared to other legumes, higher nutrient content and lower soil requirements [12]. The production of native soybean in Poland remains at a relatively low level, as a consequence of the high import rate of soybean meal for feed [17]. For cultivar breeding, high-yielding environments contribute to maximizing the expression of genetic yield potential, even if the yield potential is not reached under farmers’ field conditions [32,33]. In addition, the selection of cultivars in unfavorable environments with lower yield potential, such as low fertility and high weed incidence, helps to identify more resilient cultivars [34], and it is largely unknown how breeding affects this performance in modern cultivars compared to older ones, especially the response to high temperatures and drought.
The approach for the study was planned due to the need of implemented research by soybean consortium for Central Poland. The aim of these studies was to determine whether soybean can be produced in the agrotechnical and agroclimatic conditions of Central Poland and what level of yield as well as oil and protein content can be considered. The second important goal was to select the cultivars most suitable for tillage and no-tillage cultivation, depending on the hydrothermal conditions. The third goal was to study the response of soybean to drought stress that accompanied half of the plantations in the studied space-time.
2. Material and Methods
2.1. Location of the Field Trials and Soil Conditions
Field trials were conducted at six locations in 2018–2020 in Central Poland and in two regions, i.e., Kuyavian-Pomeranian and Greater Poland. Research and development works were carried out under the project name ‘Moja Soja’ (My Soybean), which operated on the basis of the Consortium Agreement signed on 27 July 2017. The members form the operational group, belonging to the European Innovation Partnership (EIP), referred to in Art. 56 of the Regulation of the European Parliament and of the Council of Europe of 17 December 2013, for the purpose of joint implementation of the operation involving the development and implementation of innovative solutions in selected farms cultivating and feeding soybeans. An operation called “Soybeans in the Kuyavian-Pomeranian and Greater Poland provinces-innovative solutions in cultivation and feeding for farms”. The first part of the study concerns the production results of the soybean crop, protein and oil contents based on experimental work carried out at three experimental stations (Mochełek, Minikowo and Grocholin) and on the farms participating in the consortium (Rakowo, Witrogoszcz, Jędrzejewo) (Table 1).

Table 1.
Coordinates and soil characteristics of the study sites.
Field trials were conducted on 36 square-meter experimental plots, repeated three times at each site in blocks. Cultivar plots contained 12 rows, each 12 m long with 0.25 m row spacing. The harvested area was limited to the 10 rows, excluding 0.5 m from the edges.
The soil conditions with particle-size distribution exhibited sandy loam at three locations (Grocholin, Rakowo and Jędrzejewo) and loamy sand at another three locations (Mochełek, Minikowo and Witrogosz). The soil showed a neutral pH (in 1 M KCl 6.2–6.9) (PN-ISO 10390:1997P). The soil was characterized by medium to very high availability of phosphorus (158–238 mg P kg–1 soil) (PN-R-04023:1996P) and high potassium availability (196–235 mg K kg–1 soil) (PNR-04022:1996/Az1:2002P). The humus content was at a level of 1.2–2.2% (KQ/PB-34), whereas the nitrogen content ranged from 0.12 to 0.70% (Table 1). These data represent the averaged status of macronutrient content in the spring.
2.2. Cropping Practice
The twenty non-GMO soybean (Glycinia max (L.) Merrill) cultivars, originating from the EU common catalogue of agricultural cultivars (CCA) or from the Polish catalogue (https://coboru.gov.pl, accessed on 29 July 2022), were chosen for the investigation. The relative maturity of cultivars is classified according to both EU and Polish catalogues as very early type (0000), named here as the 1st group–3 cultivars, mid-early type (000+), named as the 2nd group–3 cultivars, late early type (000), named as the 3rd group–5 cultivars, late type (00), named as the 4th group–9 cultivars (Table 2). Cultivar selection was justified by the region’s climatic conditions and by the breeder recommendation, so soybeans should be harvested no later than October 10th. The duration of the period from sowing to harvest when soybean reaches the full maturity stage (BBCH 89) is written here as VPD (vegetation period in days). Each cultivar has the same VPD range as it obtained in the years of study. The propagation material was treated with nodulating bacteria (Bradyrhizobium japonicum) NPPL HiStick® BASF. Soybean was grown in an integrated system without monocultural practices and with chemical products used for macrophage control. The most frequent fore-crops were small cereal species (wheat, barley, and triticale) and corn (Table 3). Two different soil practices were used in the study. Soil cultivation based on plow tillage at three sites (Mochełek, Minikowo and Grocholin), e.g., skimming and harrowing, (in order: autumn: plowing; spring: harrowing, NPK application, cultivation with harrowing, seeding, harrowing). A no-tillage system was used in three other locations (Jędrzejewo, Rakowo and Witrogoszcz) using a stubble cultivator: grubber and cage roller instead of skimming and cultivating instead of autumn plowing); in the spring, the same agronomic operations were carried out as under the plow tillage system. Mineral fertilization was applied before seeding at the following rates: N 30 kg ha–1, P 40–75 kg ha–1, K 60–80 kg ha–1. Fertilizer rates were determined based on the nutritional requirements of the crop plant and soil nutrient availability. The dates of sowing were between 30 April in Grocholin in 2019 and 9 May in Rakowo in 2018. The decision of the term sowing depended on the soil temperature, which must reach a minimum of 8 °C.
Table 2.
Cultivar characteristics in alphabetic order used in the study.
Table 3.
Agrotechnical characteristics in the sites and years of the study.
Weed control was necessary every year and site, with the first treatment performed after sowing soybeans using metribuzine (Sencor Liquid 600 SC, 0.55 L ha−1 at BBCH 00-03) or pendimetaline (Stomp Aqua 455 CS, 1.5 L ha−1 at BBCH 00-05). The emergence of soybean cultivars varied in the years and locations from DAS 13 in Witrogoszcz in 2020 to DAS 30 in Jędrzejewo in 2019. The plant density was 40–60 per m2, depending on the year and sites (data not presented here). Each trial was monitored weekly to control plants from the diseases and pests. The second applications of herbicides, as well as the fungicidal and insecticidal treatments, are presented in Table 3. Methyl thiophanate (a compound from the benzimidazole group) has been used in several places in some seasons against septoriosis—Brown spot soybean leaf spot, application term from a developed trifoliate leaf on the second node until the pods are fully ripe (BBCH 12-79). Acetamipride (a compound from the group of neonicotinoids) was used to control the bean legume pest at the stage of pod and seed development (BBCH 70).
2.3. Measurements
Soybean was harvested with a plot-harvester Wintersteiger® AG, depending on the cultivar earliness (Table 1). Seed moisture was determined by drying a defined quantity of seed for 2 h at 120 °C, calculating the moisture content and using it to adjust the seed yield (dt ha−1) to 14% moisture content. Crude protein content (%) according to PN-EN ISO 5983-1:2006 was analyzed by Kjeltec 2200 Auto Distilation® Tecator, and the oil content (%) according to PN ISO 6492: 2005 by Soxtec system HT 1043 Extraction Unit® Tecator [35].
2.4. Weather Conditions
Weather data, i.e., precipitation and air temperature, were collected during the study from the nearest weather stations (Table 4). The three vegetation seasons of soybean, namely May–September, were valorized using the hydrothermal coefficient (K) according to the equation:
where P is the precipitation total and t is the sum of the daily mean air temperature values. The classification for Poland’s temperate climate is K < 1.0 dry season; 1.1–1.2 relatively dry seasons; 1.3–1.6 optimal humid; and K > 1.7 humid season [36]. The calculated K values are presented in Table 5.
K = 10P/t,
Table 4.
Monthly sum of precipitation and monthly mean temperatures during seasons at the sites of the study.
Table 5.
Hydrothermal coefficient (K) calculated for the seasons 2018–2020 for the study sites.
2.5. Statistical Methods
Analysis of variance (ANOVA) was determined (Table 6) using a mixed model with cultivar and site effect as fixed and year as a random block replication model. The characteristics (yield, protein, oil, VPD and K) were checked for normality by Shapiro–Wilk’s test. The HSD Tukey’s test was used for the means significance differences (p = 0.05) and for the visualization of the means separation on figures. The multivariate regression by the forward method was calculated, taking yield, protein and oil as dependent attributes from year K and VPD as independent variables. The goodness of fit of the regression parameters was evaluated by Student’s t-test (p = 0.05). The division of soybean cultivars into groups that differed significantly in terms of yield, protein, oil and VPD (also in tillage and no-tillage cultivation) was made using cluster analysis (CA) with the k-means method. Confirmation of significance between groups was performed via ANOVA with the grouping variable. The calculations were performed in the STATISTICA 13.0 program (TIBCO Software Inc., Palo Alto, CA, USA).
Table 6.
Mean squares from the three-way analysis of variance for the seed yield, protein content and oil content of soybean.
3. Results
3.1. Soybean Yield
From 2018 through 2020, the seed yield for soybean cultivars planted in two regions of Central Poland averaged 9.81 dt ha−1 (cv. Augusta, at Mochełek in 2018) to 39.29 dt ha−1 (cv. Aligator, at Jędrzejewo in 2020) (data not present). The main factors, e.g., cultivar, site and year, had individually strongly differentiating (p < 0.001) effects on yield, and they interacted (Table 6 and Table 7, Figure 1). In 2020, across the locations and cultivars, the highest mean of soybean yield, i.e., 32.2 dt ha−1, which was higher in comparison to the average yield in 2019 (27%) and the average yield in 2018 (40%), was noted (Table 7). In six locations in the growing season in 2018 and in three locations in 2019, soybean plantations received insufficient sums of precipitation, ranging from 132–207 mm. The hydrothermal coefficient K ranged from 0.4 to 1.2, indicating that half of the plantations experienced drought conditions during the three years of the study (Table 5). The 2020 season had an optimal distribution of rainfall and temperature for soybeans, as both parameters are indicated by the hydrothermal K coefficient ranging from 1.7 to 2.4, namely, optimal and humid conditions (Table 5). The highest average yield in 2020 was noted on the sandy loam soil (e.g., in Jędrzejewo and Rakowo) obtained from the soybean cultivars at the 3rd group of earliness (Figure 1). The interaction of soybean yield depending on the sites and years with various precipitation was thoroughly studied by multi-regression analysis (2). We found a significant multivariate relationship (R = 0.67; p < 0.001) between the hydrothermal coefficient K and the vegetation period day VPD as predictors of soybean yield. The standardized multi regression coefficient b = 0.56 (p < 0.001) was found for the relation between K and yield, while for the VPD and yield, the standardized multi regression b = 0.25 (p < 0.001), which can be quantified with the regression equation:
Y(yield) = 21.8 + 12.0 X1(K) + 0.20 X2(VPD)
Table 7.
Seed yield, protein content and oil content in seed depending on the soybean earliness, cultivars, and years of study. Mean ± standard error from the sites of study in Central Poland.
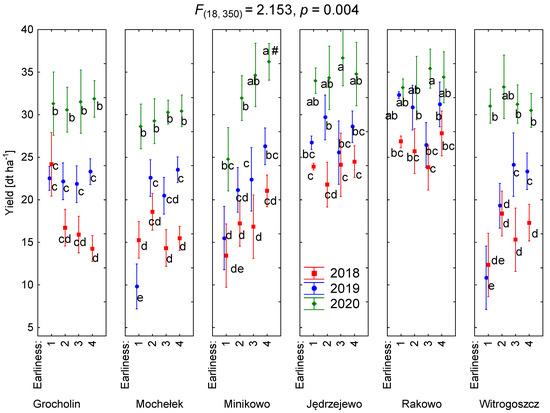
Figure 1.
The seed yield (dt ha−1) depending on the earliness of soybean. Means ± confidence intervals (p = 0.95) from cultivars planted in 2018–2020 in Central Poland. # Various letters indicate the heterogenous groups according to the HSD Tukey’s test at p = 0.05.
As producers of soybean have no influence on the K coefficient, they can decide what type of soybean group and the cultivars they choose, which reflects VPD. Each day of VPD from the range 100–155 increases the production of soybeans by 20 kg of seeds per ha. Meanwhile, each unit of hydrothermal coefficient increases the yield of soybean by 1200 kg of seeds per ha (Figure 2).

Figure 2.
The relationship between soybean yield (dt ha−1) and vegetation period in days (VPD) and hydrothermal coefficient (K) in Central Poland.
3.2. Protein and Oil Contents
Protein content had a significant influence on the cultivar, site and year of study, and cultivar and year interacted with the protein content (Table 6). The highest average protein content was in 2020—44.7%, while in 2018 and 2019, the averages were significantly lower and reached 41.7% and 41.1%, respectively (Table 7). An interaction of genetically attributed protein content in cultivars and the years of study was found (Figure 3). In the first quartile of the highest protein contents, eight cultivars were planted in 2020 (Amarok, Anser, Bohemians, Erica, Sirelia, Augusta, Aurelina, and Mavka), while in 2018 three cultivars were planted, i.e., Bohemians, Erica, and Silesia (Figure 3). Meanwhile, the oil content depends just on the cultivar effect; it was stable over the years, as well as in the sites of study, and showed no interaction between effects (Table 6 and Table 7, Figure 4). The highest content was obtained from the cultivars Bohemians, Galice, Merlin, Aligator and Aurelina. A moderate negative correlation (r = −0.45, p = 0.05) was detected for the relationship between oil and protein in soybean seeds, indicating a 0.1% decrease in oil for each percent increase in the protein content in seeds (Figure 4).
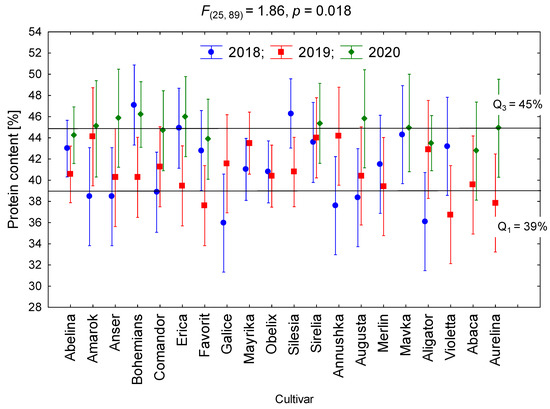
Figure 3.
The protein content in soybean cultivars (%). Means ± confidence intervals (p = 0.95) from sites in Central Poland.
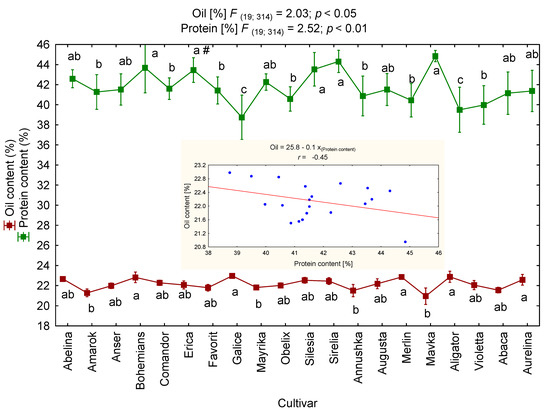
Figure 4.
The contents of protein (%) and oil (%) in soybean cultivars and the correlation between protein and oil. Means ± confidence intervals (p = 0.95) from sites in Central Poland, 2018–2020. # Various letters indicate the heterogenous groups according to the HSD Tukey’s test at p = 0.05.
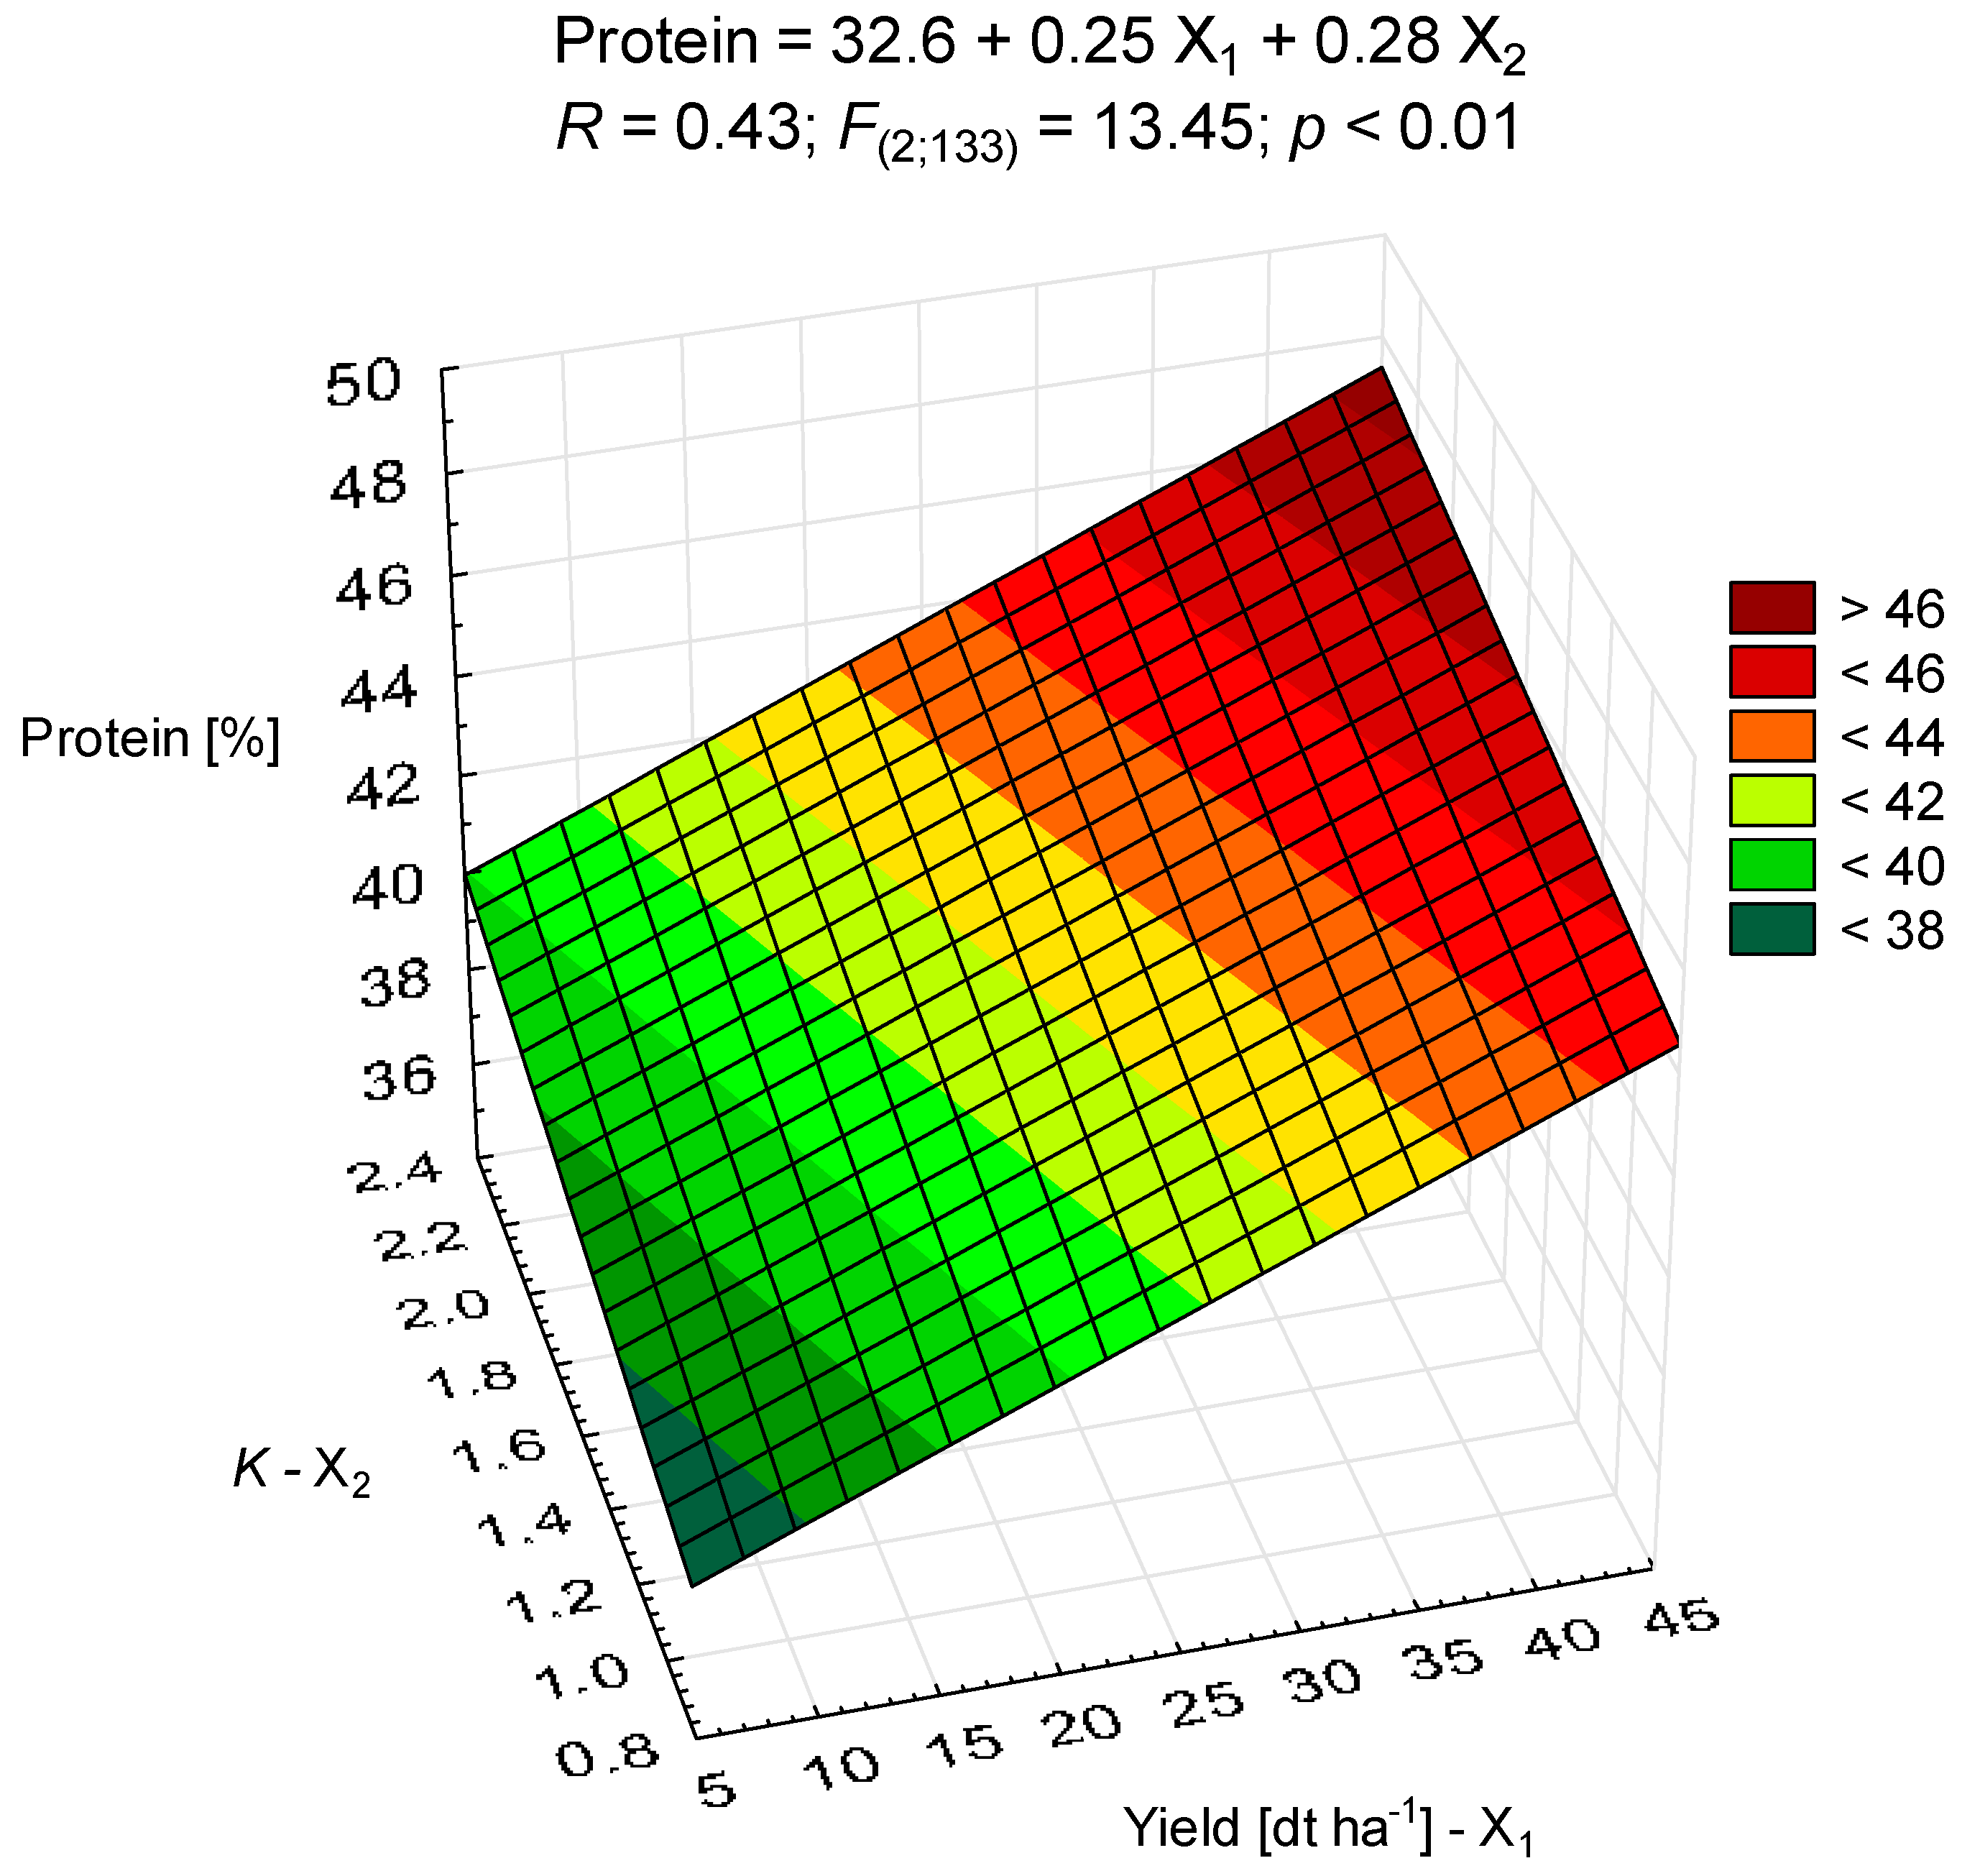
We found a significant multivariate relationship (R = 0.43; p < 0.01) between the protein content and seed yield, and hydrothermal coefficient K. The standardized multi regression coefficient b = 0.14 (p < 0.01) was found for the relationship between yield and proteins, while for the K and protein content, the standardized multi regression b = 0.09 (p < 0.002), which can be quantified with the regression equation (Figure 5):
Y(protein) = 32.6 + 0.25 X1(Y) + 0.28 X2(K)

Figure 5.
The relationship between soybean protein content (%), seed yield (dt ha−1) and hydrothermal coefficient (K).
The protein content in the seed increases per 0.25%, following the increasing seed yield by 100 kg per ha, and per 0.28% in consequence of K increasing.
3.3. Tillage Versus No-Tillage Cultivation
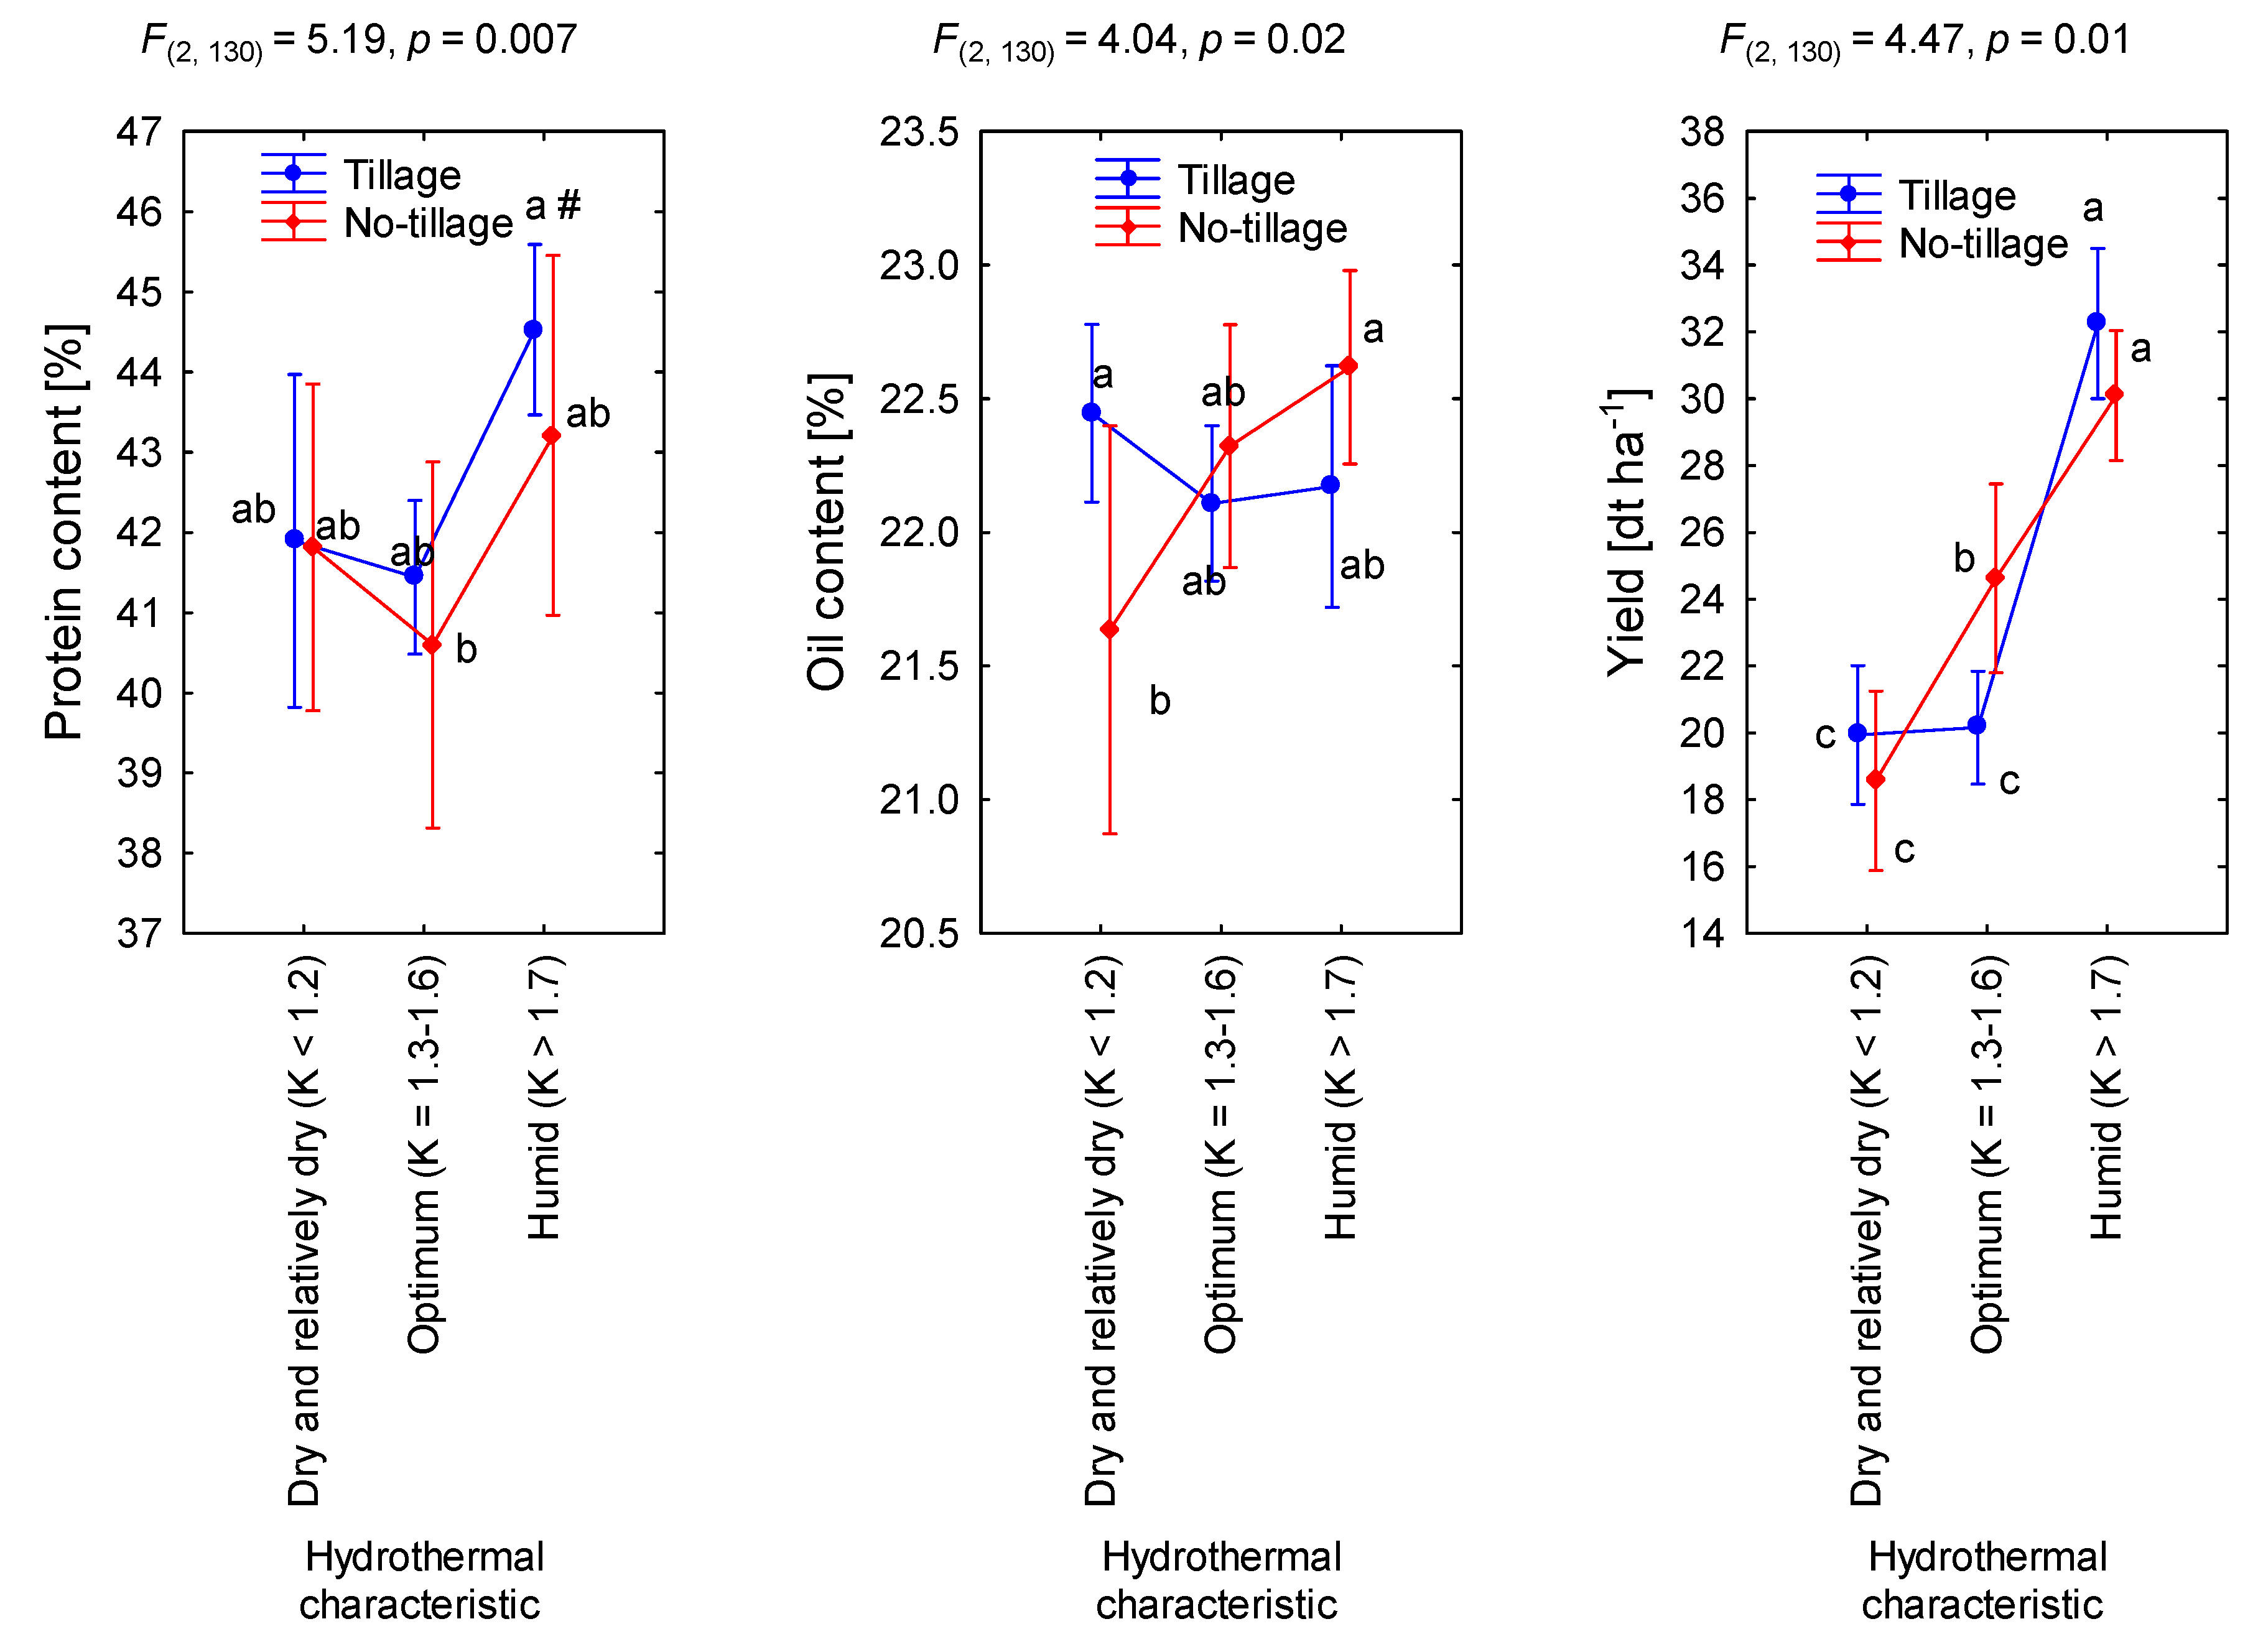
The two-way ANOVA showed that the interaction between the cultivation system and the hydrothermal coefficient for oil content (F = 4.04), protein content (F = 5.19) and soybean yield (F = 4.47) was significant (Figure 6). In tillage cultivation, the yield of soybean under dry and optimal hydrothermal conditions was uniform and significantly lower by 4.45 dt per ha (22.1%) than that under humid hydrothermal conditions. However, in no-tillage, the seed yield increases significantly with the increase in the hydrothermal coefficient. The relative differences between the dry and relatively dry periods and the optimal periods were plus 6 dt per ha (32.3%), and those between the optimal and wet periods were plus 5.5 dt per ha (22.4%). A reverse trend was noted in the oil content depending on the hydrothermal conditions during tillage and no-tillage cultivation, with the highest oil content in dry and relatively dry seasons in the tillage cultivation (22.5%) and in humid conditions in the no-tillage system (22.6%). Under optimal humidity conditions, the oil content of soybeans was at a similar level in both cultivation systems and averaged 22.3%. In terms of protein content in soybeans, a significant difference was observed between the tillage system at high hydrothermal coefficients compared to the no-tillage system and optimal humidity, ranging from 3.9% points. It is interesting that under conditions of dry and relatively dry weather, the protein content was at the same level regardless of the cultivation system (Figure 6).
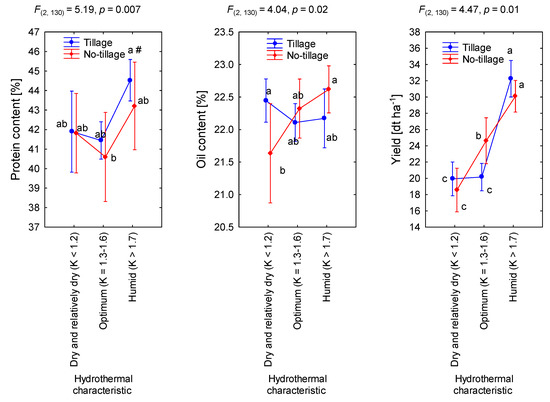
Figure 6.
The effect of tillage/no-tillage system and hydrothermal conditions on soybean. Means ± confidence intervals (p = 0.95) of years and cultivars studied in 2018–2020 in Central Poland. # Various letters indicate the heterogenous groups according to the HSD Tukey’s test at p = 0.05.
3.4. Usefulness of Soybean Cultivars for the Cultivation System
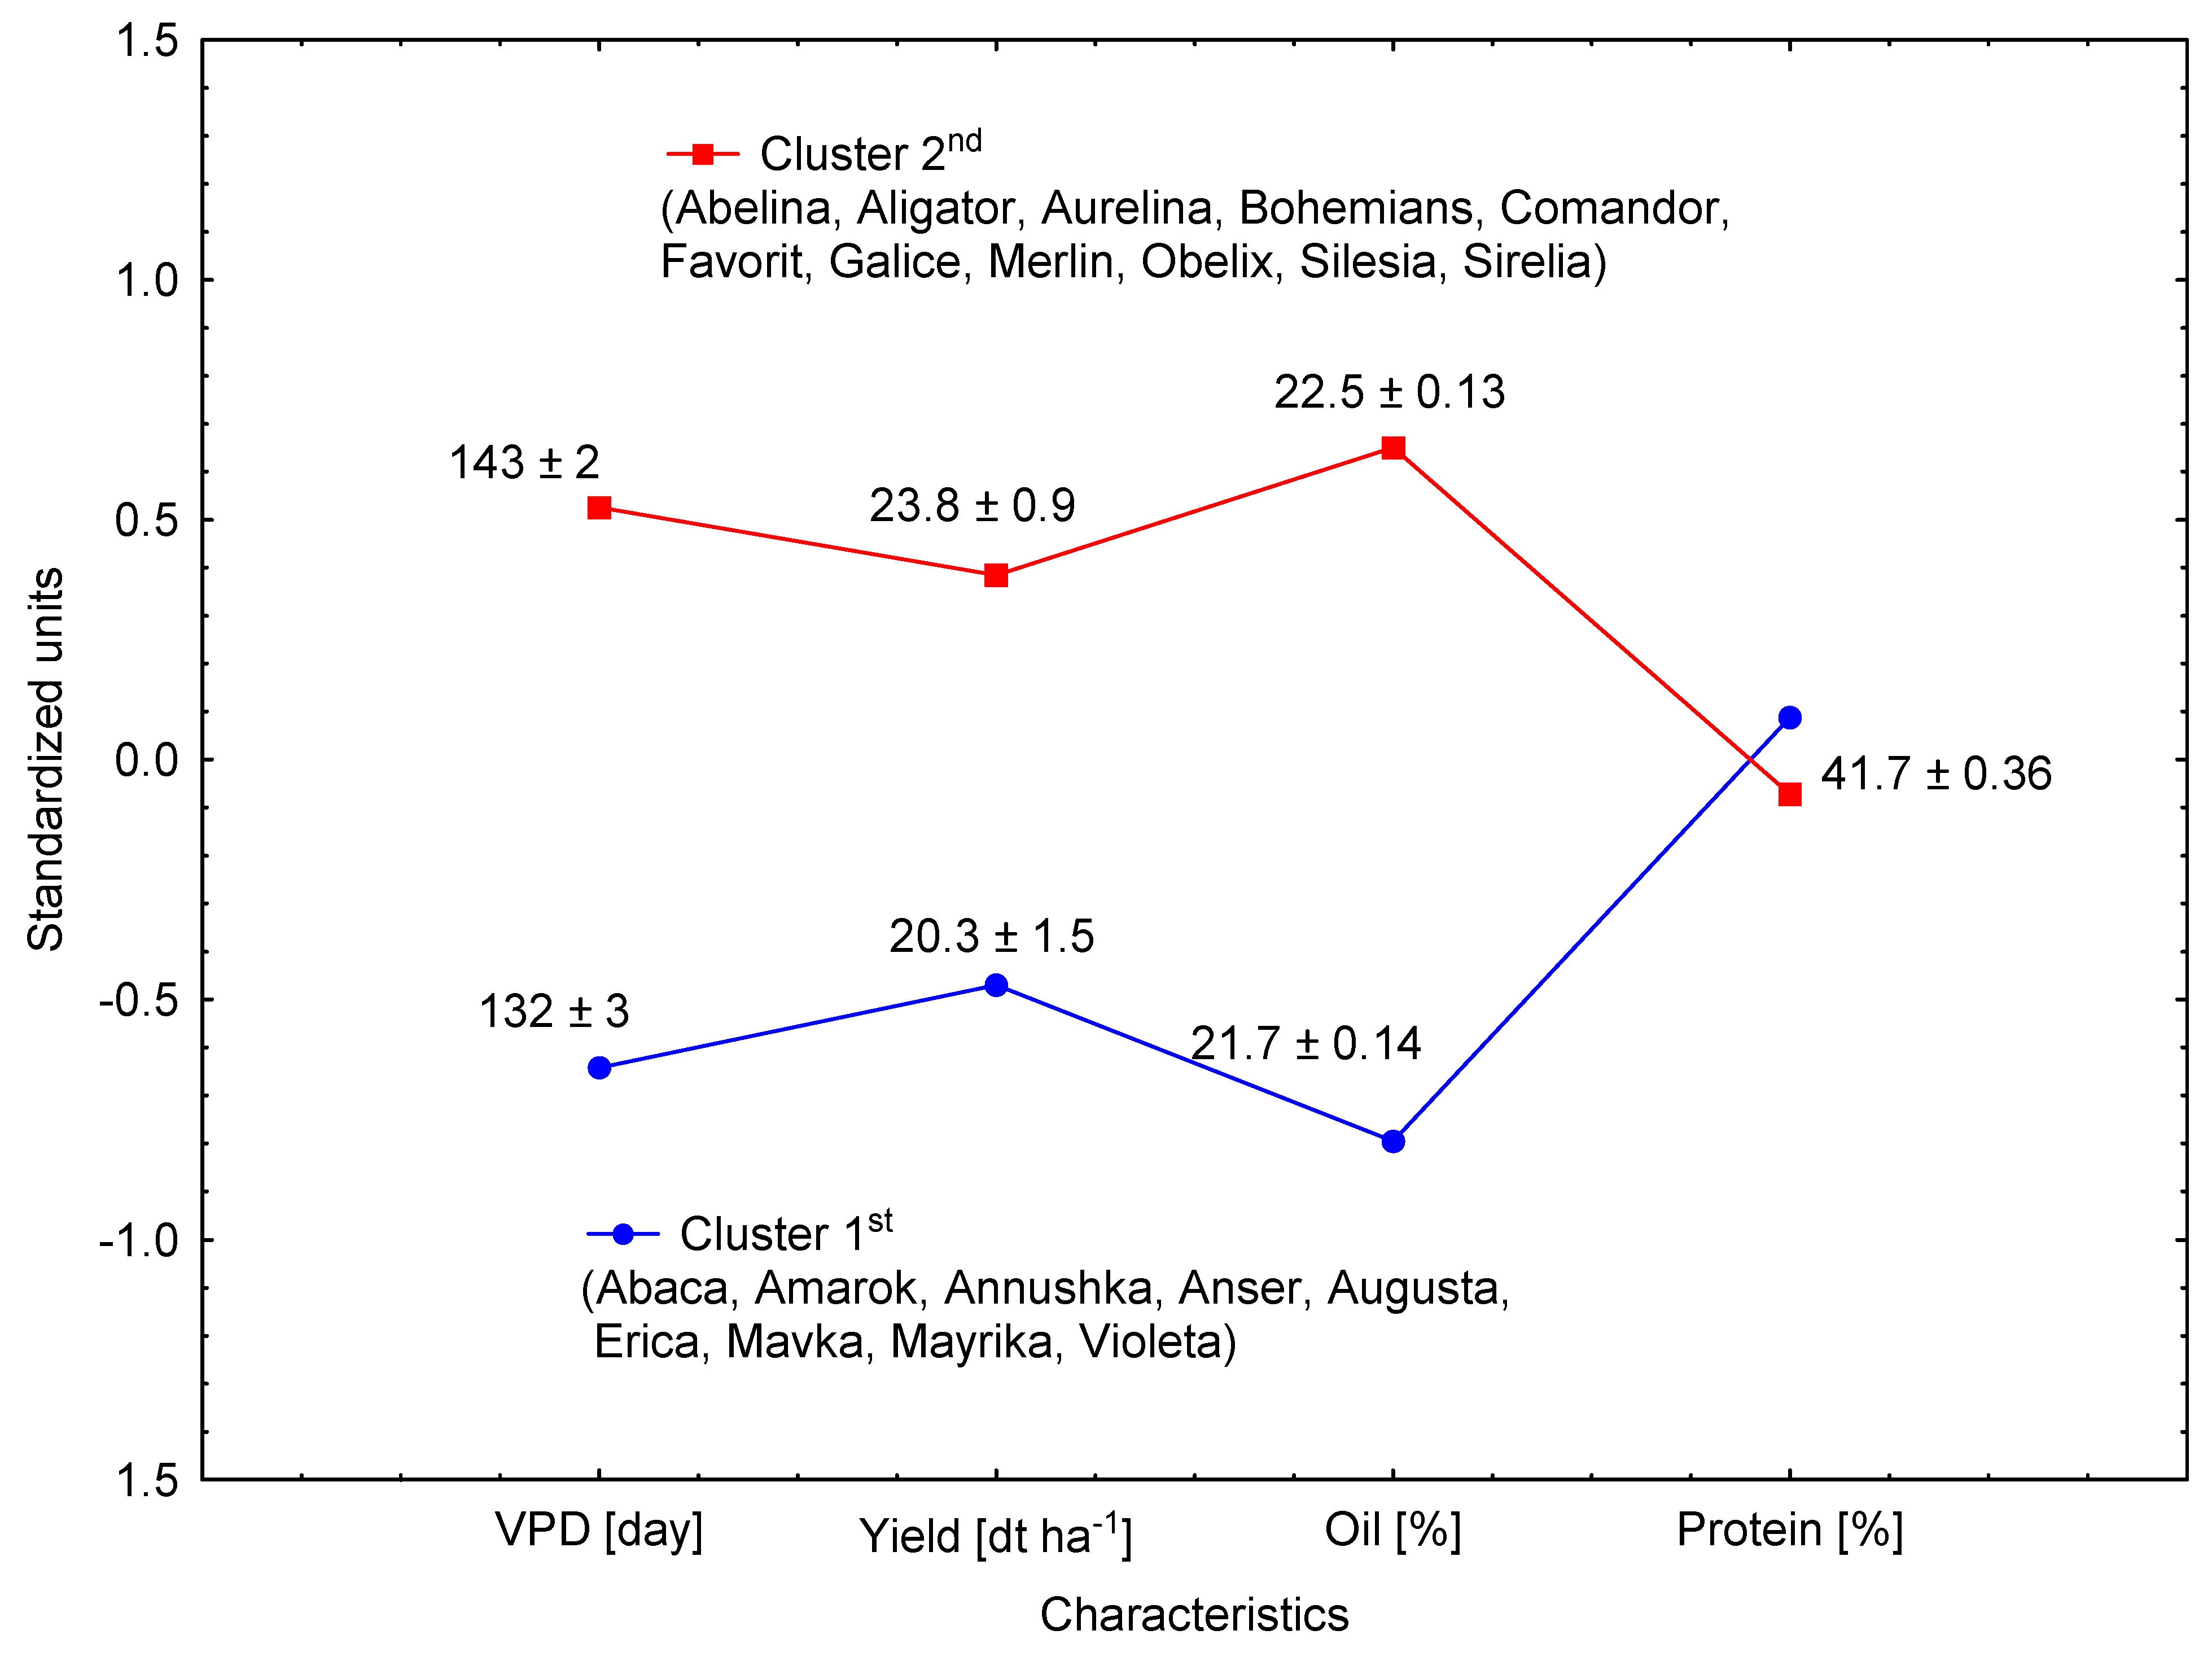
Based on the k-means (CA) analysis, two clusters significantly different in terms of such characteristics as vegetation period in days (VPD), yield, and oil content were obtained, but they did not differ in protein content (Figure 7). Significantly higher seed yield and higher oil content provided the cultivars with an average VPD of 143 ± 2 day (Abelina, Aligator, Aurelina, Bohemians, Comandor, Favorit, Galice, Merlin, Obelix, Sirelia and Silesia) compared to the cultivars grouped around VPD 132 ± 3 day (Abaca, Amarok, Annushka, Answer, Augusta, Erica, Mavka, Mayrika, Violeta).
Figure 7.
Two clusters of soybean cultivars separated on the basis of the k-means cluster analysis. Means ± standard errors from the locations and research years 2018–2020 in Central Poland.
After grouping analysis, it turned out that soybean varieties have varying suitability for the cultivation system, which was confirmed on the basis of average values from the years of research and location. For the tillage system, the cultivars with VPD 143.8 were more useful in terms of yield, to which belong: Abelina, Amarok, Aurelina, Bohemians, Comandor, Favorit, Galice, Mavka, Obelix, Silesia and Sirelia. The cultivars in the tillage system did not differentiate with oil and protein content. Meanwhile, in no-tillage cultivation, the group of higher utility (including yield and oil content) consists of Abelina, Aligator, Bohemians, Comandor, Merlin, Obelix and Silesia with VPD 140.2 (Table 8).
Table 8.
Clusters of soybean cultivars in terms of vegetation period days, seed yield, oil content and protein content for tillage and no-tillage cultivation system. Means ± standard errors from the locations and research years 2018–2020 in Central Poland.
4. Discussion
When starting this study, the UE common catalogue of agricultural plant cultivars (CCA) included 300 soybean varieties, while in Poland, there were 14 cultivars in the national variety register [37,38]. Currently, the number of cultivars has increased three-fold and reached 40 in the Polish catalogue. Thus, the hypothesis was put forward that progress in the selection of cultivars will also have practical significance for Central Poland. The demand for feed protein is covered only in 20% of domestic production. To reduce the import of soybean meal from GMOs, a national program was implemented for 2016–2020 in terms of increasing the use of domestic fodder protein for high production quality of animal products in conditions of sustainable development. It is a common idea of many European countries [39], with the main purpose of creating opportunities to increase the protein security of the country for feed and food purposes.
The original data of a three-year study in six locations in Central Poland allowed for the drawing of several important conclusions regarding the reaction of soybean yield to cultivar selection. Our study confirmed previous world reports [40,41] that the soybean response was primarily dependent on genetically fixed maturation, which we defined here as the vegetation period days (VPD). In the Central Poland region, the highest-yielding cultivars belong to group 3rd, where VPD was defined here between 130–142 day. This is an update until the recent opinion that in Poland, between 52nd and 53rd latitudes, in which the research was conducted, the soybean cultivars must be the early and medium-early group [42]. Moreover, a significant relationship was found on 20 soybean cultivars between VPD and yield, which indicated that each day of vegetation period extension (in the range 100–150 days) increased the yield by 20 kg per ha. Yield improvement of 26 soybean cultivars released over the past 50 years in southern Brazil was described by Umburanas et al. [41]. The average rate of yield gain was 45.9 kg per ha per year (relative growth 2.1%). The authors see this progress in breeding through attributes such as seed number per area and harvest index, less susceptibility to lodging, and reduced plant mortality. On the other hand, an American study confirmed that the main abiotic factors influencing soybean yield are solar radiation and the availability of rainfall [43]. According to American research, delaying soybean sowing causes a yield loss of 0.09 to 1.7% per day. It is known that the cultivars grown in America (Brazil, US) belong to the GM group, and the seed traits cannot be compared to the nGMO genotypes, although certain issues such as sowing delay or tendency to lodging may be discussed here, as a Polish study [44] also confirmed that delayed sowing leads to a significant decrease in yield. Our research was guided by the principle of adapting the soybean sowing date to the phenological phase of cherry bloom, which is convergent with the soil temperature needed for soybean germination in the range of 8 to 10 °C [17]. According to this rule, all plantations were sown within 10 d between 30 April and 9 May, which ensured the proper development of seedlings and further ontogenesis.
A study carried out in this region in 2000–2015 led to inconclusive results regarding thermal conditions for soybean [45]. First reports concluded that temporal variability concerning moderate and strong frosts in late spring increases the risk of soybean plantation disruption. We state that adapting soybean cultivars to the thermal conditions in Central Poland does not seem to be a problem; however, vegetal seasons with insufficient rainfall become problematic. Water conditions for soybean cultivation in Central Poland in this study and the variability of the hydrothermal coefficient confirmed the results of an intensified occurrence of drought [7]. The evidence of nine periods without precipitation or with low precipitation ranging from April to September 132–207 mm indicate drought syndrome. The obtained image of changes in the climatic risk for soybean cultivation in the area of Central Poland is generally consistent [46] and it confirms certain aspects of the theses related to climate warming [47]. This problem also occurs in other soy-growing regions, for example in the Krasnodar region, where the sum of active temperatures (above 10 °C) increased up to 218 °C/10 year and precipitations decreased down to 20.9 mm/10 year from 1987–2015 [48]. Generally, predictive models indicate precipitation decreasing in southern Europe and increasing in northern Europe. Although, the position of the exact border line at which the positive or negative climate change signal starts is not certain; it varies over a broad band somewhere between mid-Scandinavia and the Alps, within which Poland is located [49].
Hydrothermal coefficient (K), which combined two meteorological parameters, i.e., temperature and rainfall, based on our data and according to the trends recorded by Ziernicka-Wojtaszek and Kopicińska [36] was estimated. We believe that K is a convenient and appropriate solution in two aspects: 1. the pattern of temperature and precipitation expressed in one value of K alters two distributions into one, ready for the statistical analysis (multi regression, ANOVA, cluster analysis); 2. the incidences of space-time in four terms (dry, relatively dry, optimal humid, and humid) provide the rank classifications of entire periods, which are easy and legible to describe. In 2018, in all locations where the research was conducted, K indicated drought or relative drought. In 2019, the three locations were classified into dry and relatively dry conditions, and the three others had optimal humid conditions. In 2020, humid conditions for soybean were applied at all sites. We propose the “optimal humid” for soybean, when K = 1.3–1.6, and “humid season” when K > 1.7. Actually, the most humid season in this investigation (with K = 2.4, at Jędrzejewo in 2020) did not reveal severity for soybean plantations, except for the need to dry soybeans up to 14% after harvest, which is standard practice for sale or storage seed. Such a weather pattern prompted us to analyze the soybean yield along with the hydrothermal coefficient, which is original and may be very useful in practice. We found a relationship between K and the yield of soybean that indicated an increase in yield of 120 kg per ha for each increase of 0.1 of K. A study in the Pennsylvania region showed that total rainfall is positively correlated with the yield of soybeans, and the determination ranges between 57–67%, with yield variability up to 72% in [50].
In response to drought stress, soybeans experience reduced growth to alleviate the stress effect and activate tolerance pathways to ensure an adjusted metabolism, which is similar to other plants, for combating drought stress [51,52]. The primary metabolites (carbohydrates, amino acids, lipids) are differentially accumulated in soybean leaves, although they decrease to a lesser extent than under heat stress [53]. Drought stress is mostly responsible for the accumulation of major carbohydrates, such as glucose, fructose, sucrose and raffinose, which indicates that in response to drought, soybean growth is restricted, and more carbohydrates are stored [54]. A study on drought-tolerant and drought-sensitive soybean cultivars indicated that under drought stress, more than 50% of genes related to various metabolic processes increased in expression independent of the tolerance factor [55]. In this study, protein and oil contents were investigated, as they are the two most important parameters of seeds of global usefulness for humans and animals. Soy protein is a more important component in the Polish market because most high-protein feeds come from soybeans. The analyses showed here that the percentage of protein in seeds depends on hydrothermal conditions and cultivar selection. Generally, in the humid season of 2020, the protein content was higher than that in the dry seasons of 2018 and 2019. Water stress reduces the protein content of soybeans and confirms the results of Borowska and Prusiński [56] with the temperature dependence of the protein content. Michałek and Borowski [57] showed that periodic drought increased the percentage of proteins with a significant differentiation of cultivars. This finding was reflected in our study in the case of cv. Bohemians and Silesia in 2018, although most of the 3rd quartile of protein content (>45%) was attributed by cv. Augusta, Erica, Amarok, Anser, Bohemians, and Sirelia, planted in 2020. The positive relationship between protein content and average daily temperature was described by Chen et al. [51]. Moreover, Novikova et al. [48] demonstrated that protein content has been increasing following longevity of the period with temperature above 22 °C and decreasing with a rise in precipitation over a period of temperature above 18 °C. We also found positive relation between protein content and hydrothermal coefficient K accompanying the seed yield.
The balance between protein and oil content is still weighty, as the trend of negative correlation between protein and oil contents in soybean seeds was found here (r = −0.45), similar to the results described for Brazlinian’s cultivars [41]. The oil content in seeds was significantly varied between cultivars at the level of p = 0.05 and was highly attributed to the cv. Bohemians, Galice, Merlin, Aligator, and Aurelina. China’s studies showed that seed oil concentration increased significantly with soybean cultivar yield increase [58], while our results did not confirm this relationship. The accumulation of oil promoted by an increase of the hydrothermal coefficient over the period with temperatures above 19 °C and in late-maturating cultivars was prevented by a prolonged autumn period with temperature below 15 °C [48]. This coincides with current reports that late-maturating varieties have an increased oil content in the no-tillage system.
There are various practical systems to help farmers avoid stressful circumstances. To minimize the late season drought stress effect on yield, Chebrolu et al. [59] proposed shifting the planting and harvest times by incorporating maturity, groups III–V, in soybean cultivation. A study conducted in one location in southeastern Poland in 2014–2017 provided data on the tillage/no-tillage treatment and monoculture/crop rotation practice on soybean cv. Merlin [60]. Authors declare that the seed yield was higher by 10.3% in tilled soil compared to the no-tilled and by 5% in monoculture than in rotation. Our experiments were conducted at six locations in various soil and hydrothermal conditions on 20 cultivars in the crop rotation system. We obtained a more complex pattern of tillage/no-tillage effects depending on the hydrothermal coefficient. In no-tillage soil, the yield of soybean constantly increased with increasing K (32.3% and 22.4%), while in tillage soil, the yield increased only when K rose from optimal to humid (22.1%) conditions. In areas with low rainfall, it is important to practice water conservation cultivation to ensure retention of the highest amount of rainwater. No-tillage practices involving the replacement of the plow with implements that do not turn the soil over offer this possibility to agricultural producers. No-tillage performs best in a dry climate, and crop yields are often equal to or higher than those obtained under conventional tillage [61]. Inconclusive results are found regarding the tillage system on the oil and protein content. Under no-tillage conditions, a higher seed protein content and a lower fat content were found in the case of cv. Merlin cultivated in southeastern Poland [60]. However, an increase in fat yield per hectare for non-tilled soybean has also been obtained [62,63]. The crucial issue of protein and oil content in relation to seed yield and agronomic and hydrothermal conditions should be considered. We found that no-tilled soybean produced more oil in seeds in the seasons with optimum and humid conditions, while in the season of dry conditions, the opposite trend was found with the greater oil content in the tillage system. Meanwhile, a higher protein content was observed in the tillage system under humid conditions. The soybean cultivars studied here showed high variability in yield and protein and oil contents. An important finding from this study is that the new nGMO cultivars maintain genetically high protein levels with increasing yields. The genetic disposition of the oil varies to a much lesser extent than that of the protein and is less susceptible to variation depending on weather conditions. This may be a good perspective for the further development of soybean production in Central Poland.
5. Conclusions
The novelty of this research is a proposal for the evaluation of soybean cultivars for tillage and no-tillage systems suitable for the region of Central Poland. Considering that seed yielding, protein and oil content are economically important, and their level varies between cultivars depending on the type of soil cultivation, decisions should be made skillfully in relation to the selection. It is very important to be able to recognize and evaluate this uncertainty by examining the temporal variability of climatic and agroclimatic indicators in terms of agricultural practice in this area. This is essential for the consideration of adaptation to future climatic conditions in this region. As a result of changes in the global climate, the zones for cultivation of specific soybean cultivars can be shifted. As the choice of soybean cultivars alters the underyielding of protein and oil for farmers, it is important to understand these changes to develop adaptation strategies for resources and development planning.
Author Contributions
Conceptualization, A.W.-P.; Formal analysis, A.W.-P. and K.A.; Investigation, A.W.-P.; Methodology, A.W.-P.; Project administration, K.A.; Software, A.W.-P. and K.A.; Supervision, K.A.; Visualization, A.W.-P.; Writing—original draft, A.W.-P. All authors have read and agreed to the published version of the manuscript.
Funding
Project financed by European Union funds, grant number 00003.DDD.6509.00029.2017.02, title “Soybeans in Kujawy-Pomerania and Wielkopolska—innovative solutions in the cultivation and feeding on farms”.
Institutional Review Board Statement
Not applicable.
Informed Consent Statement
Not applicable.
Conflicts of Interest
The authors declare no conflict of interest.
References
- Hymowitz, T. Soybeans: The Success Story. In Advances in New Crops, Proceedings of the First National Symposium “New Crops: Research, Development, Economics”, Indianapolis, IN, USA, 23–26 October 1988; Timber Press: Portland, OR, USA, 1990; pp. 159–163. [Google Scholar]
- Helferich, W.G.; Andrade, J.E.; Hoagland, M.S. Phytoestrogens and Breast Cancer: A Complex Story. Inflammopharmacology 2008, 16, 219–226. [Google Scholar] [CrossRef] [PubMed]
- Statistical Yearbook World Food and Agriculture. 2020. Available online: https://www.fao.org/3/cb1329en/online/cb1329en.html (accessed on 6 July 2022).
- Hartman, G.L.; West, E.D.; Herman, T.K. Crops That Feed the World Soybean-Worldwide Production, Use, and Constraints Caused by Pathogens and Pests. Food Secur. 2011, 3, 5–17. [Google Scholar] [CrossRef]
- Twardowski, T.; Małyska, A.; Gracz, J.; Tyczewska, A. Soja Przyszłością Polskiego Rolnictwa? Nauka 2014, 4, 121–138. [Google Scholar]
- Lewandowska, S. Perspectives of soybean cultivation in Poland. In Proceedings of the Perspectives of Soybean Cultivation in Poland, Krzyżowa, Poland, 5 July 2016. [Google Scholar]
- Alexandratos, N.; Bruinsma, J. World Agriculture towards 2030/2050: The 2012 Revision; ESA Working paper No. 12-03; FAO: Rome, Italy, 2012. [Google Scholar]
- Hemingway, J.; Eskandari, M.; Rajcan, I. Genetic and Environmental Effects on Fatty Acid Composition in Soybeans with Potential Use in the Automotive Industry. Crop Sci. 2015, 55, 658–668. [Google Scholar] [CrossRef]
- Shaw, E.J.; Rajcan, I. Molecular Mapping of Soybean Seed Tocopherols in the Cross ‘OAC Bayfield’ × ‘OAC Shire’. Plant Breed 2017, 136, 83–93. [Google Scholar] [CrossRef]
- SOYSTAT. Available online: http://soystats.com/ (accessed on 6 July 2022).
- EC. Report from the Commission to the Council and the European Parliament on the Development of Plant Proteins in the European Union; European Commission: Brussels, Belgium, 2018. [Google Scholar]
- Brzóska, F.; Śliwa, J. Non-gm soybean–production and possible use in animal feeding in Poland. Part, I. Soy in the fodder balance and its cultivation in Poland. Wiadomości Zootech. 2016, 54, 98–100. [Google Scholar]
- Liu, K. Chemistry and Nutritional Value of Soybean Components. In Soybeans; Springer: Boston, MA, USA, 1997; pp. 25–113. ISBN 978-1-4613-5711-7. [Google Scholar]
- Sanders, T.A.B. Functional Dietary Lipids: Food Formulation, Consumer Issues and Innovation for Health; Woodhead Publishing: Sawston, UK, 2016; ISBN 978-1-78242-257-0. [Google Scholar]
- Polska Soja–Popularyzacja Uprawy Soi Na Terenie Polski. Available online: https://www.polskasoja.pl/asp/pl_start.asp?typ=13&menu=1&strona=1 (accessed on 6 July 2022).
- Jarecki, W.; Bobrecka-Jamro, D. Wpływ nawożenia dolistnego na plon i skład chemiczny nasion soi (Glycine max (L.) Merrill). Fragm. Agron. 2015, 32, 22–31. [Google Scholar]
- Jerzak, M.A.; Czerwińska-Kayzer, D.; Florek, J.; Śmiglak-Krajewska, M. Determinanty produkcji roślin strączkowych jako alternatywnego źródła białka-w ramach nowego obszaru polityki rolnej w Polsce. Rocz. Nauk. Rolniczych. Ser. G Ekon. Rol. 2012, 99, 113–120. [Google Scholar]
- Latawiec, A.E.; Koryś, A.; Koryś, K.A.; Kuboń, M.; Sadowska, U.; Gliniak, M.; Sikora, J.; Drosik, A.; Niemiec, M.; Klimek-Kopyra, A.; et al. Economic Analysis of Biochar Use in Soybean Production in Poland. Agronomy 2021, 11, 2108. [Google Scholar] [CrossRef]
- Ball, B.C.; Lang, R.W.; Robertson, E.A.G.; Franklin, M.F. Crop Performance and Soil Conditions on Imperfectly Drained Loams after 20–25 Years of Conventional Tillage or Direct Drilling. Soil Tillage Res. 1994, 31, 97–118. [Google Scholar] [CrossRef]
- López-Fando, C. Interactive Effects of Tillage and Crop Rotations on Yield and Chemical Properties of Soils in Semi-Arid Central Spain. Soil Tillage Res. 1995, 36, 45–57. [Google Scholar] [CrossRef]
- Kęsik, T.; Blazewicz-Wozniak, M.; Konopinski, M.; Wach, D.; Mitura, R. The effect of cover crop mulches and reduced soil tillage in onion cultivation on some features of soil. Rocz. Akad. Rol. Poznaniu. Ogrod. 2007, 517–521. [Google Scholar]
- Kang, Y.; Khan, S.; Ma, X. Climate Change Impacts on Crop Yield, Crop Water Productivity and Food Security–A Review. Prog. Nat. Sci. Mater. Int. 2009, 12, 1665–1674. [Google Scholar] [CrossRef]
- Hama, J.R.; Kolpin, D.W.; LeFevre, G.H.; Hubbard, L.E.; Powers, M.M.; Strobel, B.W. Exposure and Transport of Alkaloids and Phytoestrogens from Soybeans to Agricultural Soils and Streams in the Midwestern United States. Environ. Sci. Technol. 2021, 55, 11029–11039. [Google Scholar] [CrossRef] [PubMed]
- Żarski, J.; Kuśmierek-Tomaszewska, R.; Dudek, S. Trends of Changes in Climate Risk of Grain Maize Cultivation in the Bydgoszcz Region. Infrastrukt. Ekol. Teren. Wiej. 2016, III/1, 725–735. [Google Scholar]
- Leng, G.; Zhang, X.; Huang, M.; Asrar, G.R.; Leung, L.R. The Role of Climate Covariability on Crop Yields in the Conterminous United States. Sci. Rep. 2016, 6, 33160. [Google Scholar] [CrossRef] [PubMed]
- Stuczyński, T.; Demidowicz, G.; Deputat, T.; Górski, T.; Krasowicz, S.; Kuś, J. Adaptation Scenarios of Agriculture in Poland to Future Climate Changes. Environ. Monit. Assess. 2000, 61, 133–144. [Google Scholar] [CrossRef]
- Kozyra, J.; Doroszewski, A.; Nieróbca, A. Climate Change and Its Expected Impact on Agriculture in Poland; IUNG-PIB: Puławy, Poland, 2017. [Google Scholar]
- Żmudzka, E. Long-term changes of thermal resources in the vegetative period and the active growth of plants in Poland. Woda Środowisko Obszary Wiejskie 2012, 12, 377–389. [Google Scholar]
- Déqué, M.; Rowell, D.P.; Lüthi, D.; Giorgi, F.; Christensen, J.H.; Rockel, B.; Jacob, D.; Kjellström, E.; de Castro, M.; van den Hurk, B. An Intercomparison of Regional Climate Simulations for Europe: Assessing Uncertainties in Model Projections. Clim. Chang. 2007, 81, 53–70. [Google Scholar] [CrossRef]
- Wibig, J.; Glowicki, B. Trends of Minimum and Maximum Temperature in Poland. Clim. Res. 2002, 20, 123–133. [Google Scholar] [CrossRef]
- Anders, I.; Stagl, J.; Auer, I.; Pavlik, D. Climate Change in Central and Eastern Europe. In Managing Protected Areas in Central and Eastern Europe under Climate Change; Rannow, S., Neubert, M., Eds.; Advances in Global Change Research; Springer: Dordrecht, The Netherlands, 2014; pp. 17–30. ISBN 978-94-007-7960-0. [Google Scholar]
- Rincker, K.; Nelson, R.; Specht, J.; Sleper, D.; Cary, T.; Cianzio, S.R.; Casteel, S.; Conley, S.; Chen, P.; Davis, V.; et al. Genetic Improvement of U.S. Soybean in Maturity Groups II, III, and IV. Crop Sci. 2014, 54, 1419–1432. [Google Scholar] [CrossRef]
- De Bruin, J.; Pedersen, P. Growth, Yield, and Yield Component Changes among Old and New Soybean Cultivars. Agron. J. 2009, 101, 124–130. [Google Scholar] [CrossRef]
- Cober, E.R.; Morrison, M.J. Genetic Improvement Estimates, from Cultivar × Crop Management Trials, Are Larger in High-Yield Cropping Environments. Crop Sci. 2015, 55, 1425–1434. [Google Scholar] [CrossRef]
- AOAC. Official Methods of Analysis, 15th ed.; Association of Official Analytical Chemists: Washington, DC, USA, 1990. [Google Scholar]
- Ziernicka-Wojtaszek, A.; Kopcińska, J. Variation in Atmospheric Precipitation in Poland in the Years 2001–2018. Atmosphere 2020, 11, 794. [Google Scholar] [CrossRef]
- EUR-Lex-C:2016:450:TOC-PL-EUR-Lex. Available online: https://eur-lex.europa.eu/legal-content/EN/TXT/?uri=OJ%3AC%3A2016%3A450%3ATOC (accessed on 6 July 2022).
- Centralny Ośrodek Badania Odmian Roślin Uprawnych, COBORU. Available online: http://www.coboru.gov.pl/ (accessed on 6 July 2022).
- Sudarić, A. Introductory Chapter. In Soybean—Quality and Utilization; IntechOpen: London, UK, 2020; ISBN 978-1-83881-019-1. [Google Scholar]
- Karges, K.; Bellingrath-Kimura, S.D.; Watson, C.A.; Stoddard, F.L.; Halwani, M.; Reckling, M. Agro-economic prospects for expanding soybean production beyond its current northerly limit in Europe. Europ. J. Agron. 2022, 133, 126415. [Google Scholar] [CrossRef]
- Umburanas, R.C.; Kawakami, J.; Ainsworth, E.A.; Favarin, J.L.; Anderle, L.Z.; Dourado-Neto, D.; Reichardt, K. Changes in Soybean Cultivars Released over the Past 50 Years in Southern Brazil. Sci. Rep. 2022, 12, 508. [Google Scholar] [CrossRef]
- Śliwa, J.; Zajac, T.; Oleksy, A.; Klimek-Kopyra, A.; Lorenc-Kozik, A.; Kulig, B. Comparison of the Development and Productivity of Soybean (Glycine Max (L.) Merr.) Cultivated in Western Poland. Acta Sci. Pol. Agric. 2015, 14, 81–95. [Google Scholar]
- Salmerón, M.; Purcell, L.C. Simplifying the Prediction of Phenology with the DSSAT-CROPGRO-Soybean Model Based on Relative Maturity Group and Determinacy. Agric. Syst. 2016, 148, 178–187. [Google Scholar] [CrossRef] [Green Version]
- Serafin-Andrzejewska, M.; Helios, W.; Jama-Rodzeńska, A.; Kozak, M.; Kotecki, A.; Kuchar, L. Effect of sowing date on soybean development in south-western Poland. Agriculture 2021, 11, 413. [Google Scholar] [CrossRef]
- Żarski, J.; Kuśmierek-Tomaszewska, R.; Dudek, S.; Kropkowski, M.; Kledzik, R. Identifying Climatic Risk to Soybean Cultivation in the Transitional Type of Moderate Climate in Central Poland. J. Cent. Eur. Agric. 2019, 20, 143–156. [Google Scholar] [CrossRef]
- Januszewska-Klapa, K. Tendencies of Changes in the Climatic Risk of Growing Crops in Selected Locations of the Kujawsko-Pomorskie Province. Ph.D. Thesis, University of Life Science and Technolgy in Bydgoszcz, Bydgoszcz, Poland, 2016. [Google Scholar]
- Starkel, L.; Kundzewicz, Z.W. Consequences of Climate Change for Spatial Organization of Poland. Nauka 2008, 1, 85–101. [Google Scholar]
- Novikova, L.Y.; Seferova, I.V.; Nekrasov, A.Y.; Perchuk, I.N.; Shelenga, T.V.; Samsonova, M.G.; Vishnyakova, M.A. Impact of weather and climate on seed protein and oil content of soybean in the North Caucasus. Vavilov. J. Genet.Breed. 2018, 22, 708–715. [Google Scholar] [CrossRef]
- Christensen, O.B.; Goodess, C.M.; Harris, I.; Watkiss, P. European and Global Climate Change Projections. Available online: https://www.weadapt.org/knowledge-base/economics-of-adaptation/climatecost-tpbn-1 (accessed on 6 July 2022).
- Faé, G.S.; Kemanian, A.R.; Roth, G.W.; White, C.; Watson, J.E. Soybean Yield in Relation to Environmental and Soil Properties. Eur. J. Agron. 2020, 118, 126070. [Google Scholar] [CrossRef]
- Chen, W.; Yao, Q.; Patil, G.B.; Agarwal, G.; Deshmukh, R.K.; Lin, L.; Wang, B.; Wang, Y.; Prince, S.J.; Song, L.; et al. Identification and Comparative Analysis of Differential Gene Expression in Soybean Leaf Tissue under Drought and Flooding Stress Revealed by RNA-Seq. Front. Plant Sci. 2016, 7, 1044. [Google Scholar] [CrossRef] [Green Version]
- Xoconostle-Cázares, B.; Ramírez-Ortega, F.A.; Flores-Elenes, L.; Ruiz-Medrano, R. Drought Tolerance in Crop Plants. Am. J. Plant Physiol. 2010, 5, 241–256. [Google Scholar] [CrossRef] [Green Version]
- Das, A.; Rushton, P.J.; Rohila, J.S. Metabolomic Profiling of Soybeans (Glycine max, L.) Reveals the Importance of Sugar and Nitrogen Metabolism under Drought and Heat Stress. Plants 2017, 6, 21. [Google Scholar] [CrossRef] [PubMed] [Green Version]
- Myers, J.A.; Kitajima, K. Carbohydrate Storage Enhances Seedling Shade and Stress Tolerance in a Neotropical Forest. J. Ecol. 2007, 95, 383–395. [Google Scholar] [CrossRef]
- Ferreira Neto, J.R.C.; Pandolfi, V.; Guimaraes, F.C.M.; Benko-Iseppon, A.M.; Romero, C.; Silva, R.L.D.O.; Rodrigues, F.A.; Abdelnoor, R.V.; Nepomuceno, A.L.; Kido, E.A. Early Transcriptional Response of Soybean Contrasting Accessions to Root Dehydration. PLoS ONE 2013, 8, e83466. [Google Scholar] [CrossRef] [Green Version]
- Borowska, M.; Prusiński, J. Effect of soybean cultivars sowing dates on seed yield and its correlation with yield parameters. Plant Soil Environ. 2021, 67, 360–366. [Google Scholar] [CrossRef]
- Michałek, S.; Borkowski, E. Yielding, oil, fatty acids and protein content in the seeds of polish soybean cultivars under drought conditions. Acta Agroph. 2006, 8, 459–471. [Google Scholar]
- Qin, X.; Feng, F.; Li, D.; Herbert, S.J.; Liao, Y.; Siddique, K.H.M.; Qin, X.; Feng, F.; Li, D.; Herbert, S.J.; et al. Changes in Yield and Agronomic Traits of Soybean Cultivars Released in China in the Last 60 Years. Crop Pasture Sci. 2017, 68, 973–984. [Google Scholar] [CrossRef]
- Chebrolu, K.K.; Fritschi, F.B.; Ye, S.; Krishnan, H.B.; Smith, J.R.; Gillman, J.D. Impact of Heat Stress during Seed Development on Soybean Seed Metabolome. Metabolomics 2016, 12, 28. [Google Scholar] [CrossRef]
- Gawęda, D.; Nowak, A.; Haliniarz, M.; Woźniak, A. Yield and Economic Effectiveness of Soybean Grown Under Different Cropping Systems. Int. J. Plant Prod. 2020, 14, 475–485. [Google Scholar] [CrossRef] [Green Version]
- Pittelkow, C.M.; Linquist, B.A.; Lundy, M.E.; Liang, X.; van Groenigen, K.J.; Lee, J.; van Gestel, N.; Six, J.; Venterea, R.T.; van Kessel, C. When Does No-till Yield More? A Global Meta-Analysis. Field Crops Res. 2015, 183, 156–168. [Google Scholar] [CrossRef] [Green Version]
- Gao, J.; Hao, X.; Thelen, K.; Robertson, G.P. Agronomic Management System and Precipitation Effects on Soybean Oil and Fatty Acid Profiles. Crop Sci. 2009, 49, 1049–1057. [Google Scholar] [CrossRef]
- Di Mauro, G.; Borrás, L.; Rugeroni, P.; Rotundo, J.L. Exploring soybean management options for environments with contrasting water availability. J. Agron. Crop Sci. 2019, 205, 274–282. [Google Scholar] [CrossRef]

Publisher’s Note: MDPI stays neutral with regard to jurisdictional claims in published maps and institutional affiliations. |
© 2022 by the authors. Licensee MDPI, Basel, Switzerland. This article is an open access article distributed under the terms and conditions of the Creative Commons Attribution (CC BY) license (https://creativecommons.org/licenses/by/4.0/).