Article

Experimental and Numerical Studies on Ground Shock Generated by Large Equivalent Surface Explosions

1
State Key Laboratory of Disaster Prevention & Mitigation of Explosion & Impact, Army Engineering University of PLA, Nanjing 210007, China
2
Engineering Research Center of Safety and Protection of Explosion & Impact of Ministry of Education, Southeast University, Nanjing 211189, China
3
Institute of Architectural Engineering, Huanghuai University, Zhumadian 463000, China
4
Unit 92295 of PLA, Zhanjiang 524005, China
*
Author to whom correspondence should be addressed.
Appl. Sci. 2022, 12(16), 7987; https://doi.org/10.3390/app12167987
Submission received: 3 July 2022 / Revised: 2 August 2022 / Accepted: 8 August 2022 / Published: 10 August 2022
(This article belongs to the Section Civil Engineering)

Abstract

:
Lately, explosions with a large TNT equivalent have occurred with alarming frequency causing severe structural damage. The damage suffered by these structures has been exacerbated by the ground shock generated during these large equivalent explosions. The aim of this work is to study the ground-shock propagation behaviors, the areas affected by them, and determine the minimum safe distance for various structures. To measure ground shock data at different distances from the epicenter of the blast, actual 1 t and 10 t TNT surface explosion experiments were performed. The velocity and attenuation coefficient of the ground shock generated by the 1 t TNT surface explosion were determined, and the empirical equations provided by the UFC 3-340-01 standard were validated. Additionally, numerical analyses were performed to analyze the effects of ground shocks on buildings around an explosion. The maximum particle vibration velocities and attenuation behaviors of a 10 t TNT surface explosion as well as the minimum safe distances for a variety of structures were obtained from the numerical analyses.

1. Introduction

When an explosion occurs underground, it generates shock waves that pose a severe threat to the integrity of underground structures. Moreover, underground explosions generally generate comparatively higher and longer lasting stresses than mid-air explosions, which aggravate structural damage [1,2,3], while seismic loads and the propagation of seismic waves can also pose a severe threat to structures and equipment, and these issues have been studied in references [4,5,6,7,8,9]. Likewise, when an explosion occurs on the surface, ground structures around the explosion will be subjected to the air blast and ground shock simultaneously, which interact with each other to cause severe structural vibrations. These vibrations can damage buildings and their supporting structures as well as cause injuries and death.
The effects of ground shock on underground structures have been studied widely. Merkle et al. [10] evaluated the accuracy of the shock–response spectra when used for the assessment of equipment shock tolerance and studied the effects of air blasts and ground shocks on critical structures with the aim of improving the shock tolerance of mission-critical equipment. Krauthammer [11] proposed a method for the analysis of box-type reinforced concrete (RC) structures that incorporated theoretical and experimental findings on RC slab behavior when subjected to strong dynamic loading into a simplified structural model. Weidlinger et al. [12] developed a method of analysis for the effects of conventional weaponry on underground protective structures and provided numerical examples for its application to the deformation and rigid-body response of a single degree-of-freedom model. The deformation responses computed by this method were found to agree well with finite element computations and experimental data. Zhang et al. [13] conducted experimental studies on shallow-buried RC structures subjected to blast loads and found that the responses of the buried RC structures to impulsive loads and long-duration loads are quite different. Nagy et al. [14] modeled the effects of surface explosions on buried RC structures by creating a model of the explosive charge and surrounding soil region using the Abaqus/Explicit finite element analysis package, which accounts for the sliding, separation, and rebound between the surface of the buried structure and the surrounding soil. This model was able to realistically simulate the responses of buried structures to explosive loads.
Researchers have become increasingly interested in the response of surface structures to ground shock. For instance, Wu et al. [15,16], used the Autodyn 2D program to simulate the ground shock and air blast produced by contact explosions on a rocky surface and obtained empirical expressions in analytical form that were readily applicable for structural response analysis to surface explosions. Lu et al. [17] proposed a numerical method to describe the various structural effects of surface explosions, which established that the critical structural damage caused by typical surface explosions was dominated by air shock loading. Conversely, ground shocks only induced small additional vibrations that had marginal effect on the structure. Hao et al. [18] conducted a theoretical and numerical study on the rocking, flying, and overturning responses of rigid structures to ground shocks, and consequently derived the stability region of rigid structures. They also paid special attention to cases where the vertical ground shock exceeded 1.0 g, which caused the rigid structure to fly into the air, and discussed the effects of ground shocks on the stability of rigid structures.
A number of large equivalent explosions have occurred in recent memory, including the car bomb attacks on the Oklahoma City Federal Building in 1995 with 2177 kg ANFO at a distance 3.0 m from the structure [19], the 2016 “8.12” Tianjin explosions [20], the 2019 “3.21” Xiangshui chemical plant explosion [21], and the 2020 Beirut explosion [22,23], which had a TNT equivalent of 1.79, 500, 340, and >1000 t, respectively. In particular, the TNT equivalent of the Beirut explosion was equivalent to that of a low-weight nuclear bomb. These massive explosions severely damaged structures and infrastructure, and the consequent ground shocks further exacerbated the resulting structural damage.
In view of these explosions and the threat of terrorist attacks, blast-resistant design is necessary for critical structures and infrastructure. Currently, blast-resistant design focuses mainly on structural responses to shock waves. Unfortunately, little is known about the characteristics of the ground shocks generated by large equivalent explosions and the minimum safe distance of any given structure from the explosion epicenter; Momeni et al. [24] proposed an improved calculation method to evaluate the minimum safe distance of steel columns under dynamic explosion load. The low damage probability curves of H-shaped steel columns with different dimensions and boundaries were obtained. A practical empirical formula for evaluating the safe distance of a steel column under an explosion load was presented. In this paper, to evaluate the velocity and attenuation coefficient of ground shocks from a large equivalent explosion and determine the minimum safe distance for a variety of structures, experimental, theoretical, and numerical analyses on ground shocks caused by large equivalent surface explosions were conducted. Subsequently, the propagation patterns, area of effect, the velocities, and attenuation coefficients of ground shocks as well as the minimum safe distance of various structures were determined.

2. Surface Explosion Experiments

2.1. Test Charges and Method of Detonation

The surface explosion experiments were conducted in the Gobi Desert in Alxa, an area where the ground is hard and predominantly consists of a combination of fine alluvial as well as pluvial sediments. The photograph shown in Figure 1a is that of 1 t of TNT explosives. The test charge consisted of an initiating charge, i.e., 50 kg of cast detonation charge (see Figure 1b), along with bulk TNT loaded in nylon bags that each carried 50 kg of TNT.
The test charges were 1 and 10 t of TNT. The 10 t test was the largest conventional explosion test conducted in the last 30–40 years. However, due to the tremendous damage caused by the 10 t explosive charge, data on the resulting ground shock could not be acquired. Therefore, in this section a detailed analysis of the experimental conditions of the 1 t test alone is provided.
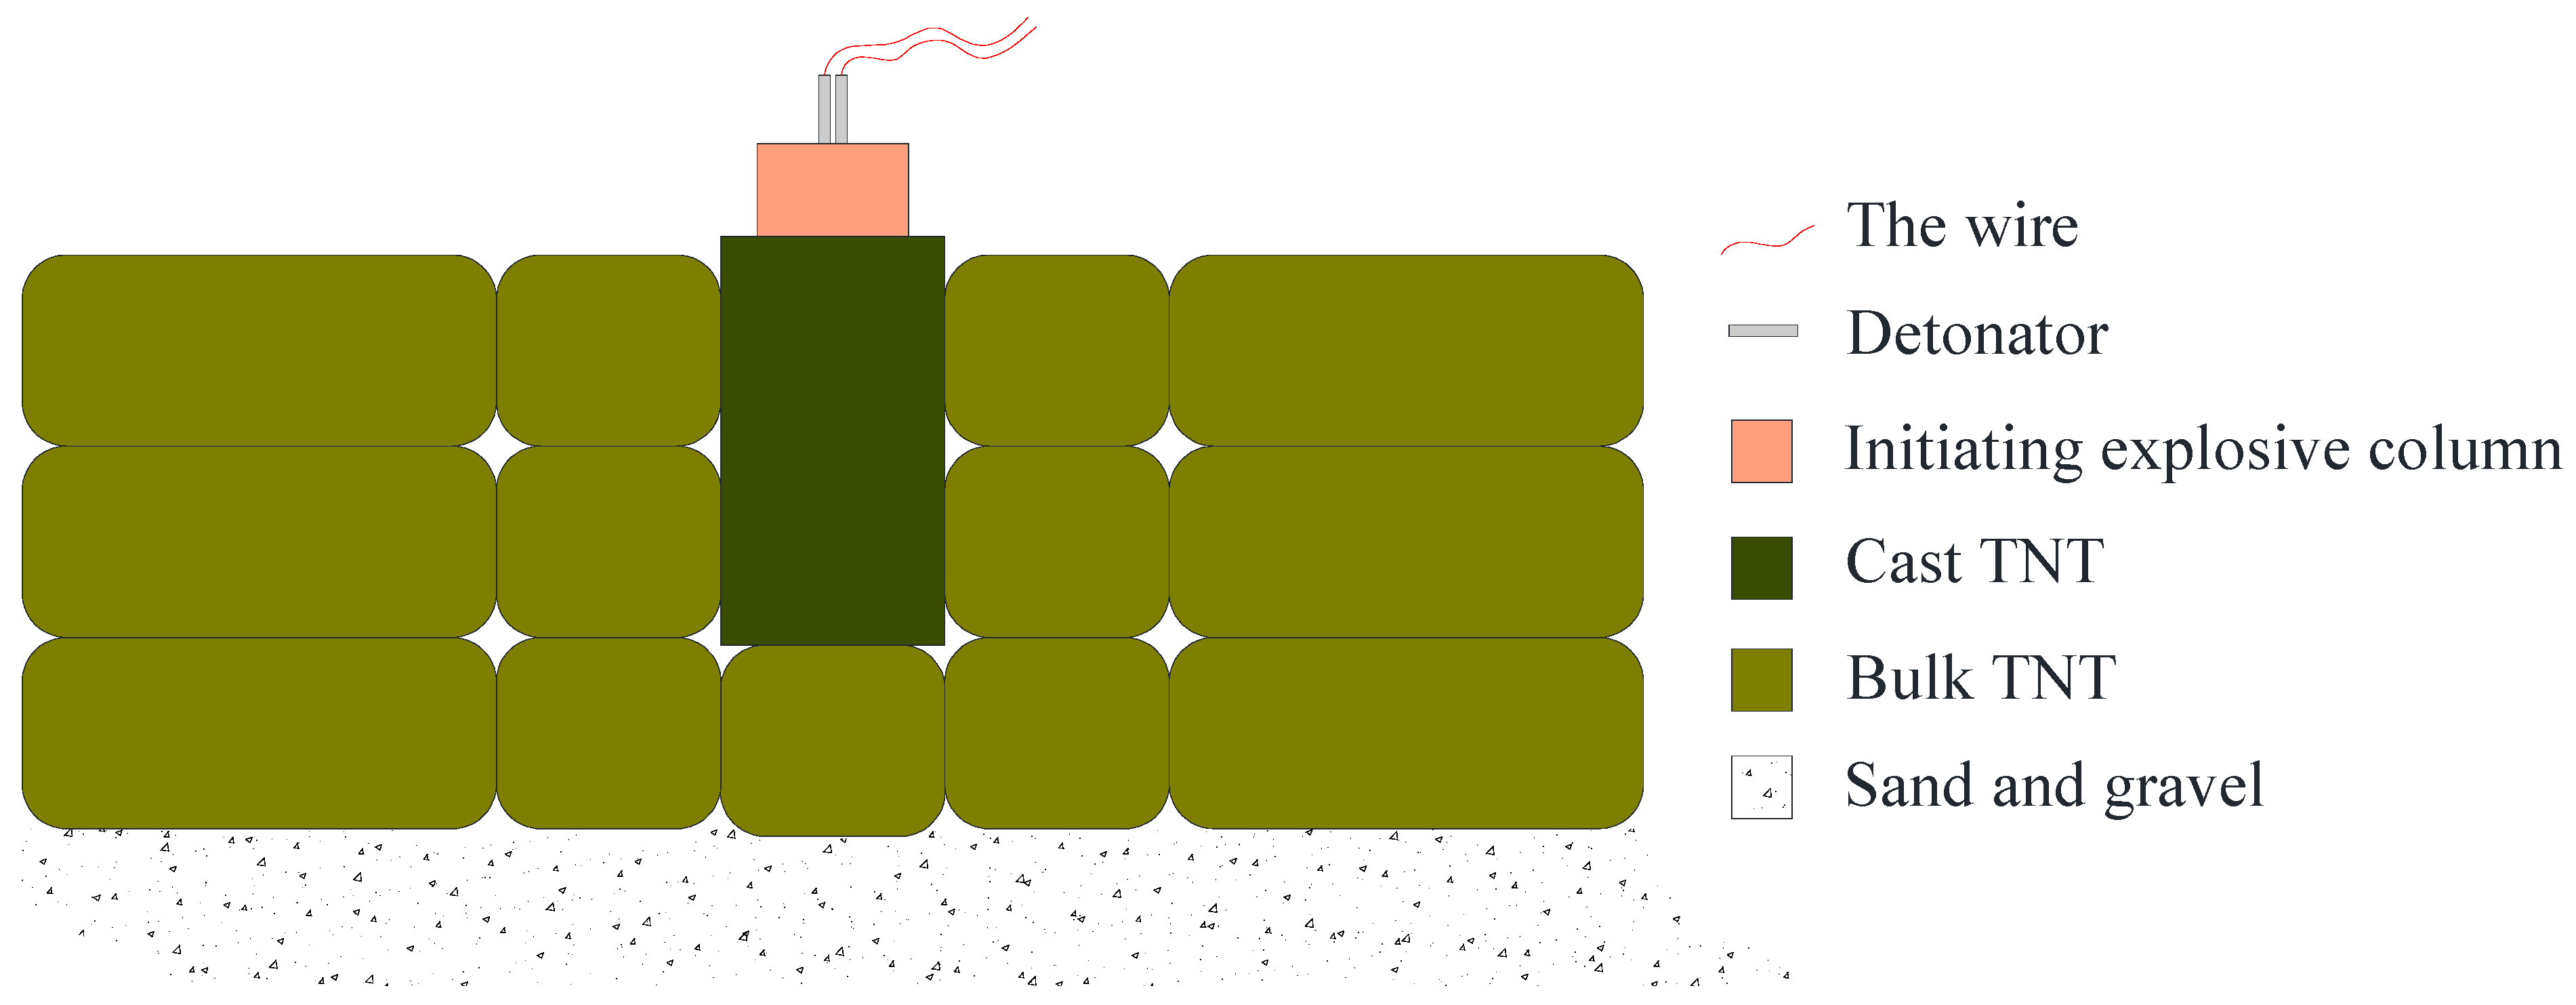
The detonation of the explosive charge was performed in two steps: (1) Two detonators were used to ignite a booster charge, which then ignited the 50 kg TNT initiating charge. (2) The 50 kg cast TNT initiating charge detonated the bulk TNT. A cross section of the arrangement of explosives during the experiment is shown in Figure 2.

2.2. Method of Ground Shock Measurement

The ground shock data of the explosion were recorded using 3-way piezoelectric acceleration sensors and magnetoelectric velocity sensors, whose specifications are detailed in Table 1.
The acceleration sensors and velocity sensors were both placed in the same box and buried at a radial distance of 21 and 42 m away from the epicenter of the explosion, as shown in Figure 3a. The acceleration sensors and velocity sensors were placed in the box with their positive X, Y, and Z directions (shown in Figure 3b) aligned with the east, south, and vertical directions, respectively. The dotted red rectangles in Figure 3c,d depict the pits that were prepared for installation of the sensors and their casing. As the depth of these pits was 0.5 m, this value was treated as the burial depth of the sensors.

3. Experimental Results and Analysis

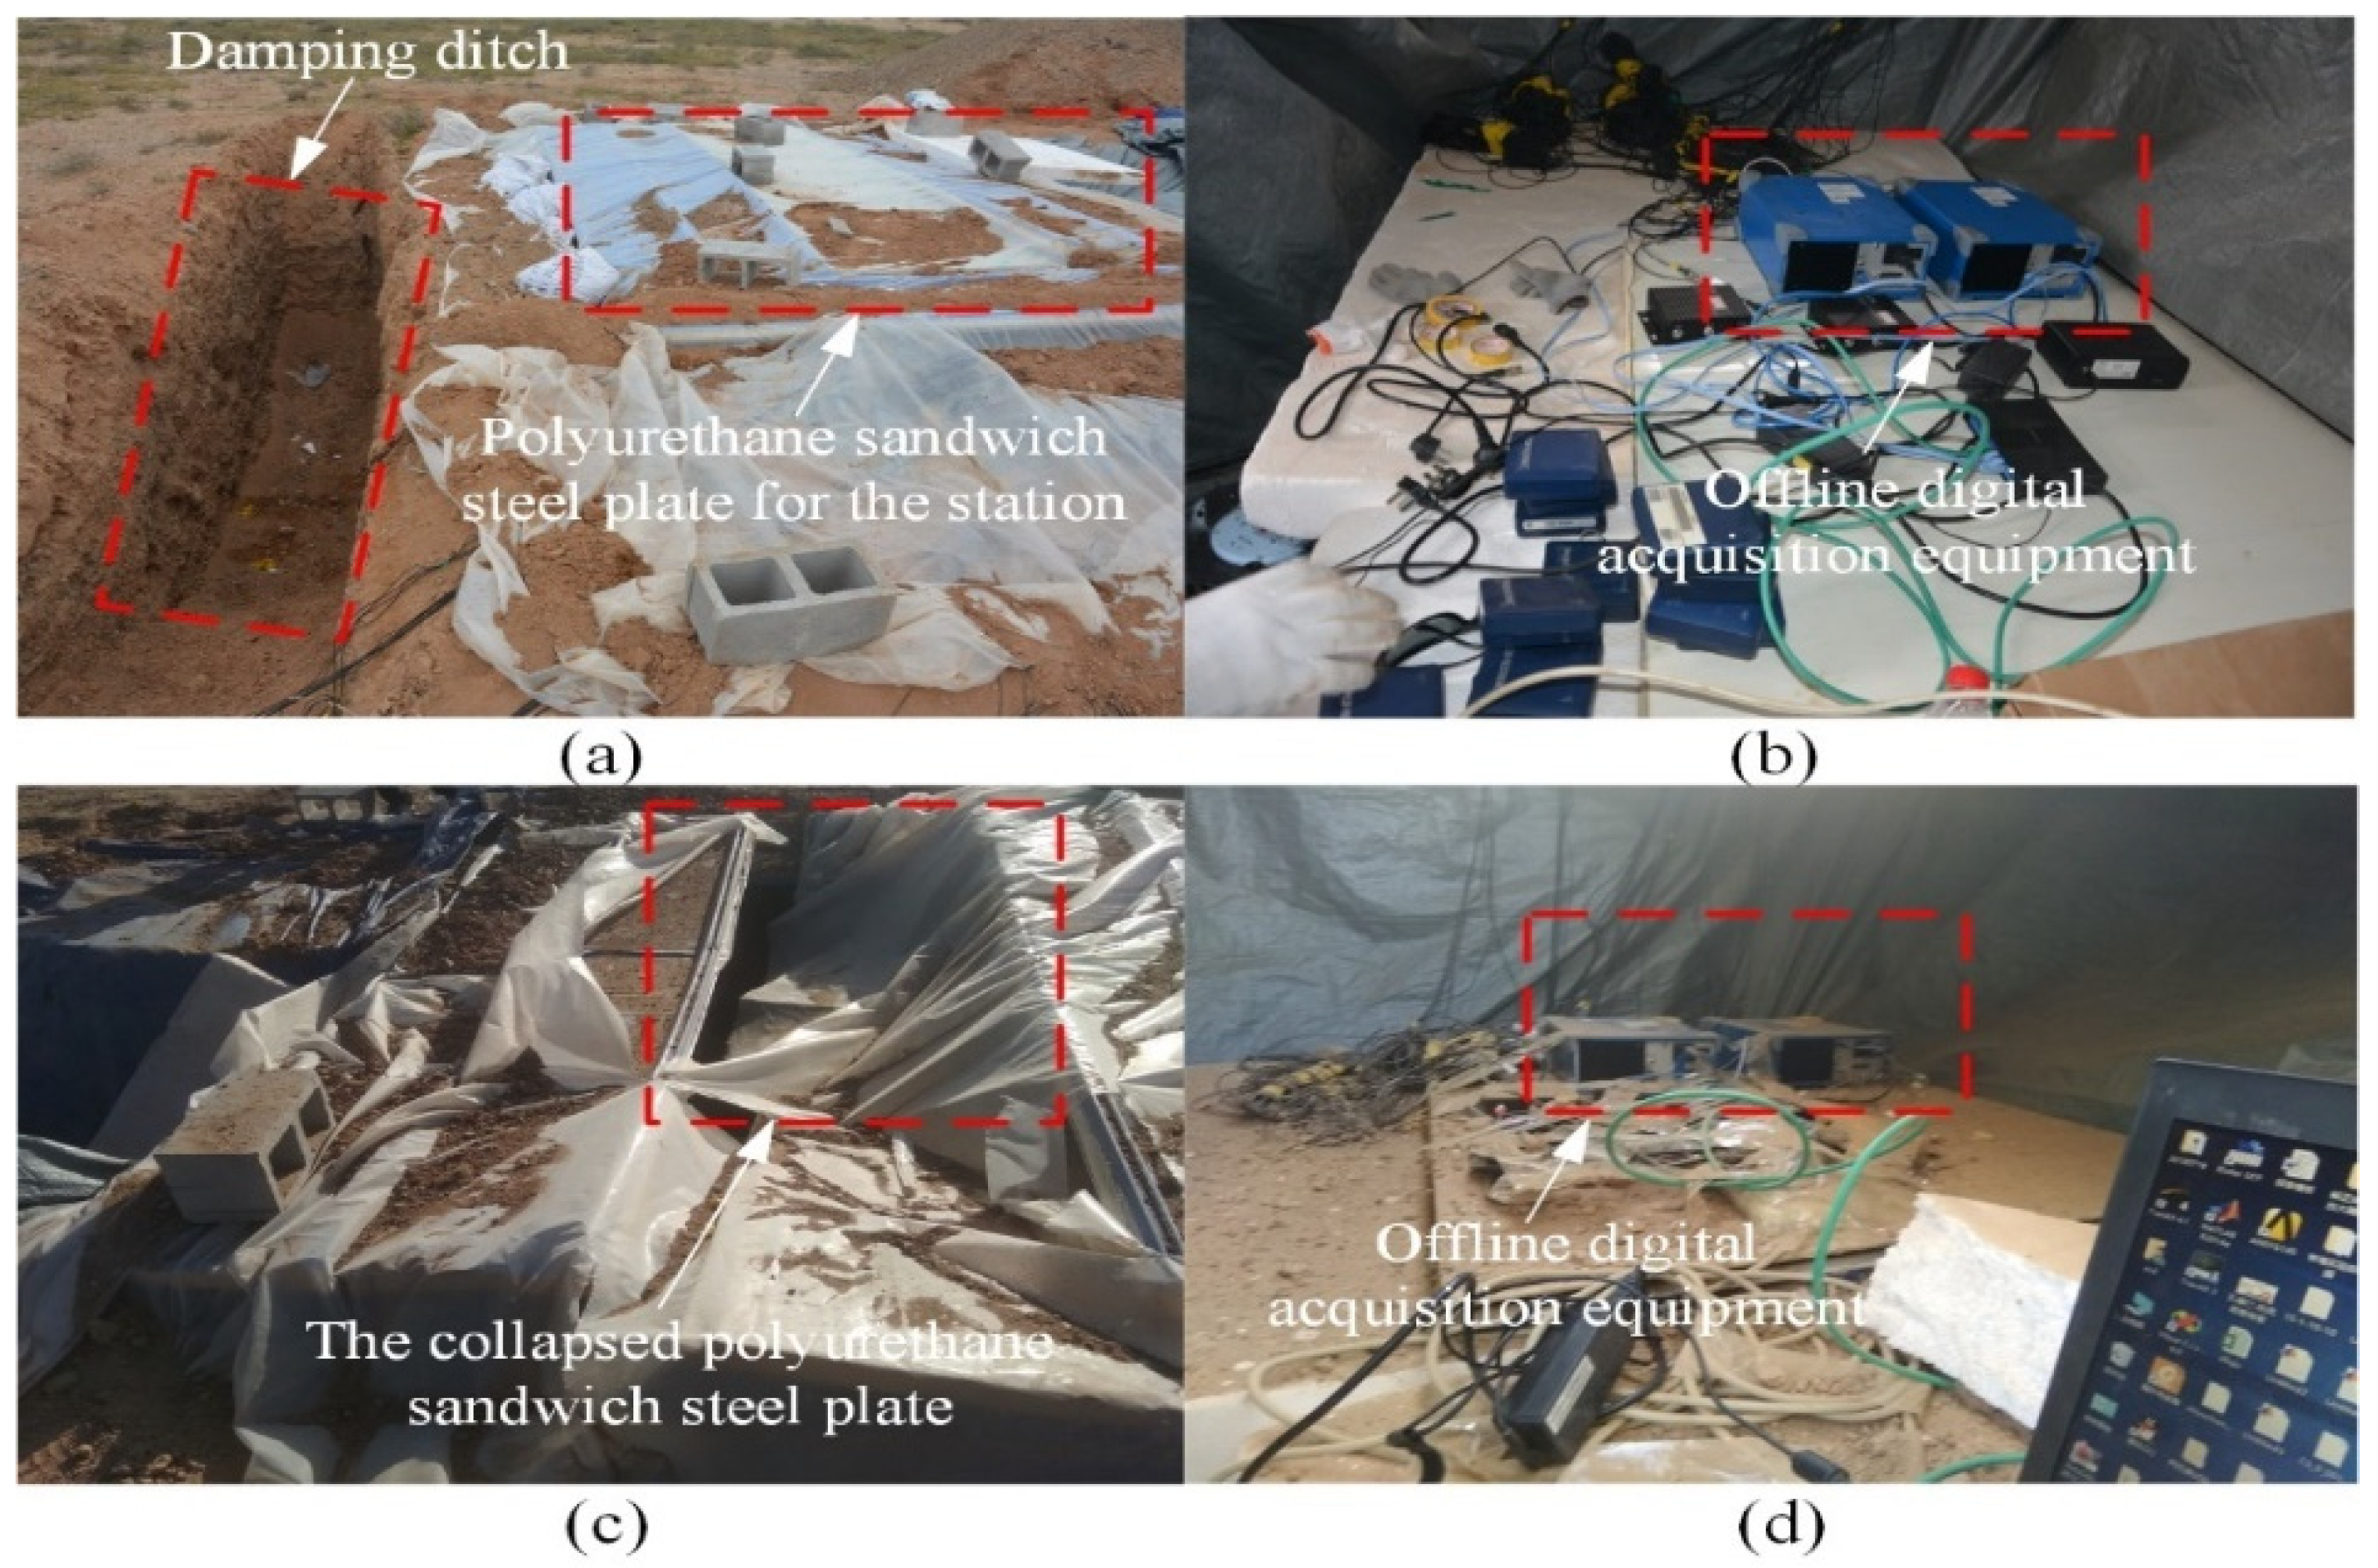
The detonation of the above explosive charges placed either above or below the ground surface resulted in the generation of a ground shock that had the potential to cause severe structural damage [3]. Structural damage by ground shocks was recorded at an observation station that was set up in a pit 100 m away from the site of the explosion. A “damping” ditch with a width of 0.5 m was dug in front of the station, and the top of the station was covered by a polyurethane-sandwiched steel panel (PSSP) and plastic sheet. The interior of the station was lined with another pair of PSSPs, and a foam board was placed on top. Photographs of the inside and outside of the station are shown in Figure 4a,b. The inside and outside of the station remained unaffected after the 1 t TNT test, but the ground shock caused by the 10 t TNT test led to the collapse of the PSSP on top of the station, and large amounts of sand entered the station. The photographs shown in Figure 4c,d show the outside and inside of the station after the 10 t TNT test.
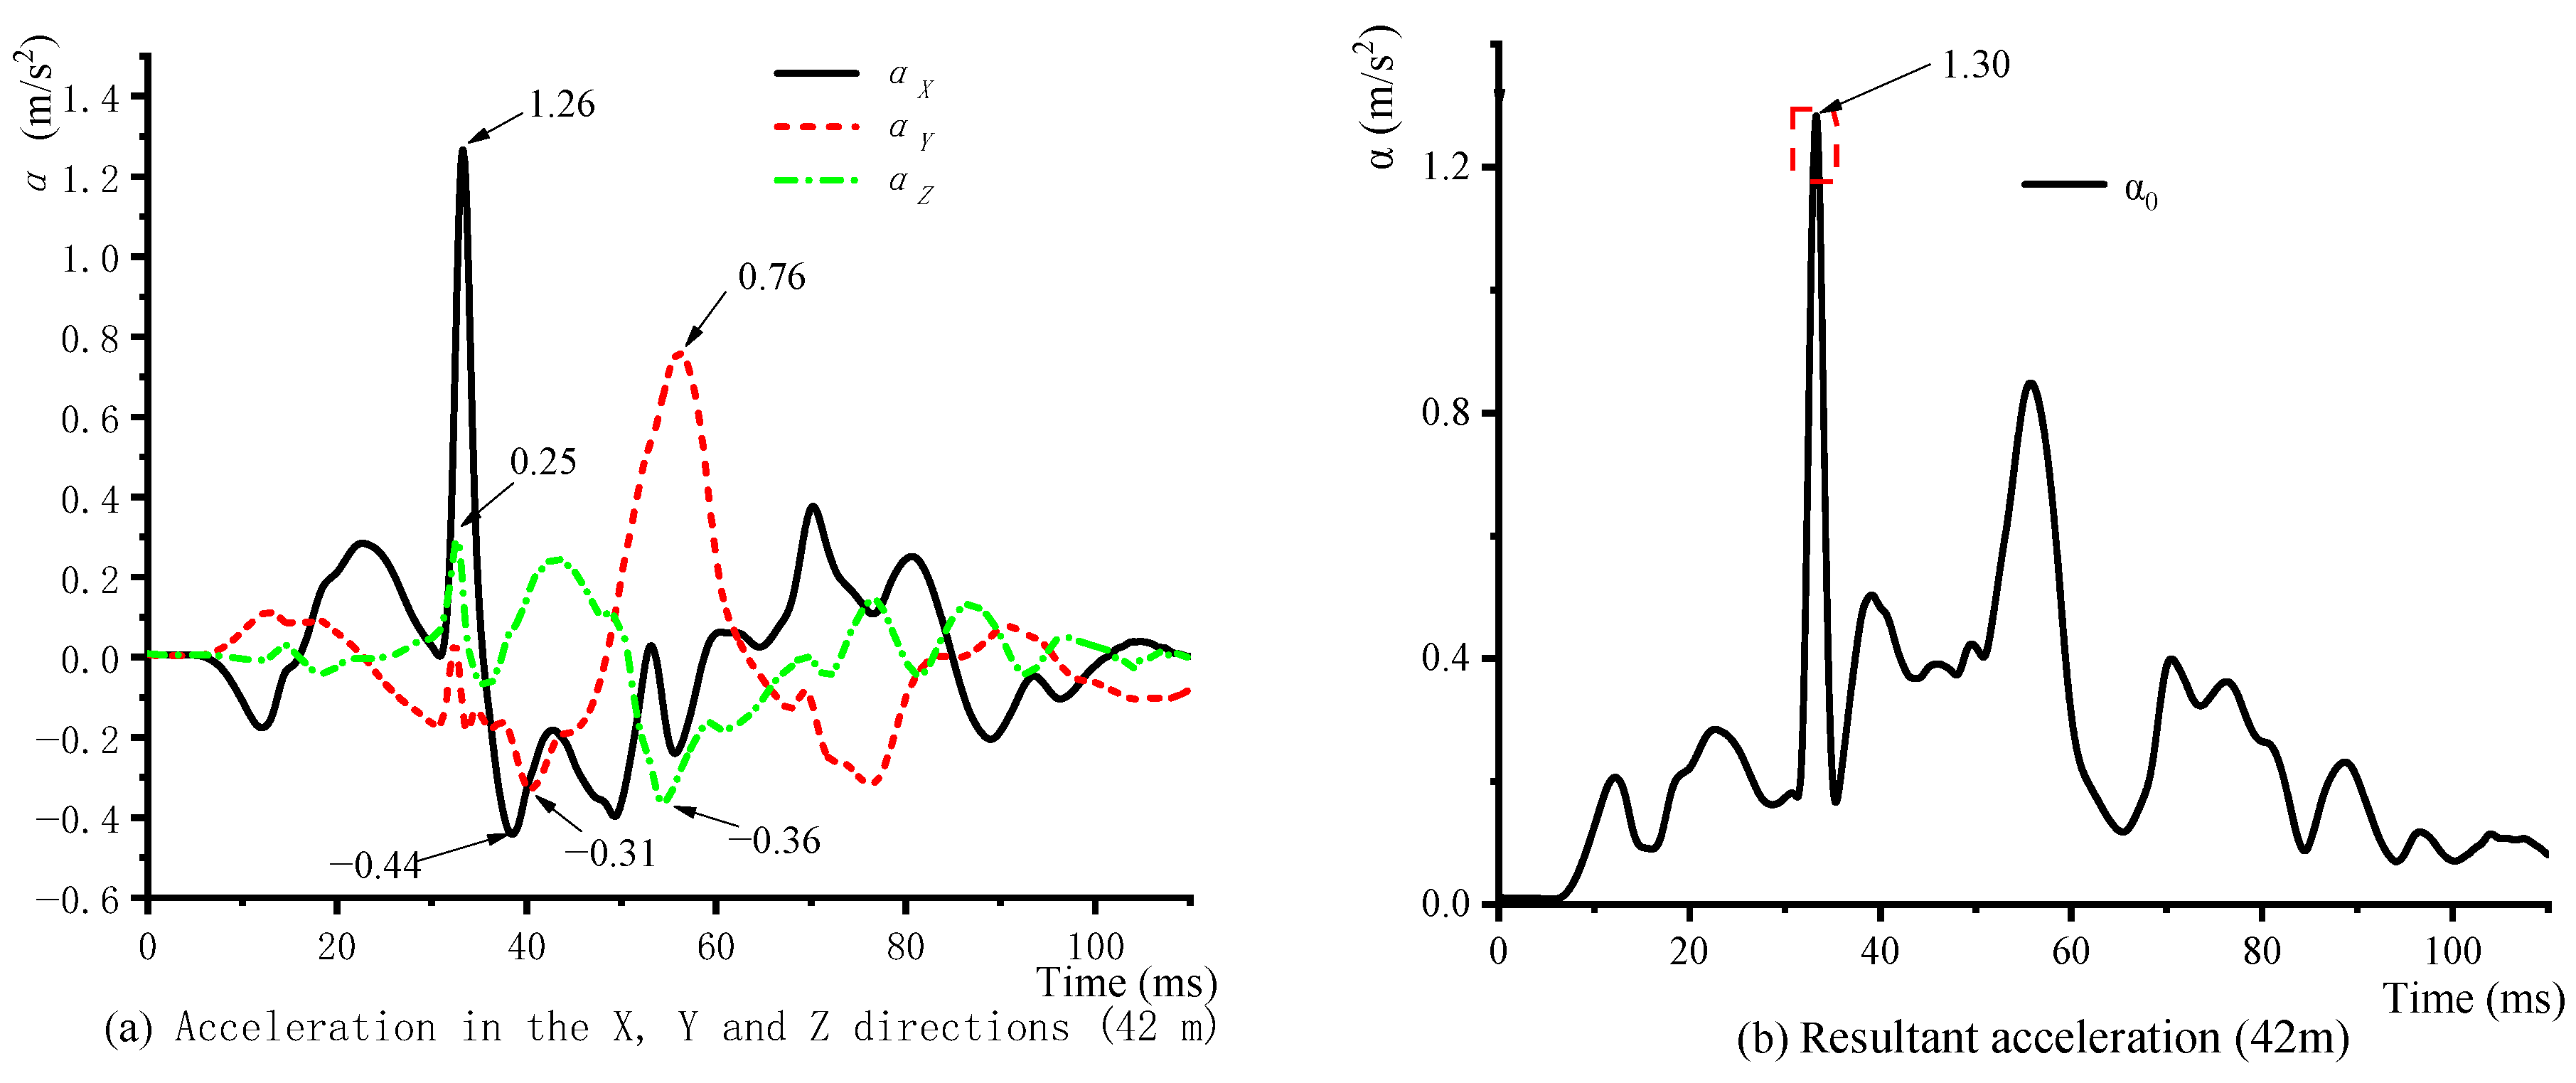
No test data could be acquired on the 10 t TNT test, because all the wires leading to the acceleration sensors and velocity sensors were snapped during the explosion. However, during the 1 t TNT test, data were acquired from the acceleration sensors at the 21 and 42 m points and from the velocity sensor at the 21 m point. The data cables of the velocity sensor at 42 m were snapped during the explosion. Figure 5a and Figure 6a present the acceleration sensor data that were acquired at the 21 and 42 m points. It can be observed that the accelerations in the X and Y directions were higher, whereas that in the Z direction was comparatively lower. Parameters αX, αY, and αZ are the accelerations that were measured in the X, Y, and Z directions, respectively, and α is the resultant acceleration ( α = α X 2 + α Y 2 + α Z 2 ). It can be observed that the maximum acceleration due to the 1 t TNT explosion at the 21 m point was 16.5 m/s2 (shown in Figure 5b), while that at the 42 m point was 1.3 m/s2 (shown in Figure 6b).
It may be observed from Figure 5a and Figure 6a that the maximum positive and negative acceleration in the X direction decreased by 88 and 91.9%, respectively, in correspondence with the increase in distance from the blast site from 21 to 42 m. The corresponding decreases were 94 and 96.8% in the Y direction and 84.1 and 90% in the Z direction, respectively. Thus, it is evident that consequent to an explosion, the accelerations induced by the ground shock in the X, Y, and Z directions decreased very significantly with the increase in distance from the blast site. At 21 m, the maximum positive accelerations in the X and Y directions were 6.65 and 8.15 times that in the Z direction. Likewise, the maximum negative accelerations in the X and Y directions were 1.52 and 2.67 times that in the Z direction. At 42 m, the maximum positive accelerations in the X and Y directions were 5.04 and 3.04 times that in the Z direction, while the maximum negative accelerations in the X and Y directions were 1.22 and 0.86 times that in the Z direction. It is apparent that the intensity of the explosion-induced ground shock decreased with the increasing distance from the blast site, and that the accelerations in the X and Y direction were both higher than that in the Z direction. The numerical dominance of the ground-shock-induced accelerations in the X and Y values implies that the structural effects of ground shocks are concentrated in the X and Y direction, while the effects in the Z direction are considerably weaker.
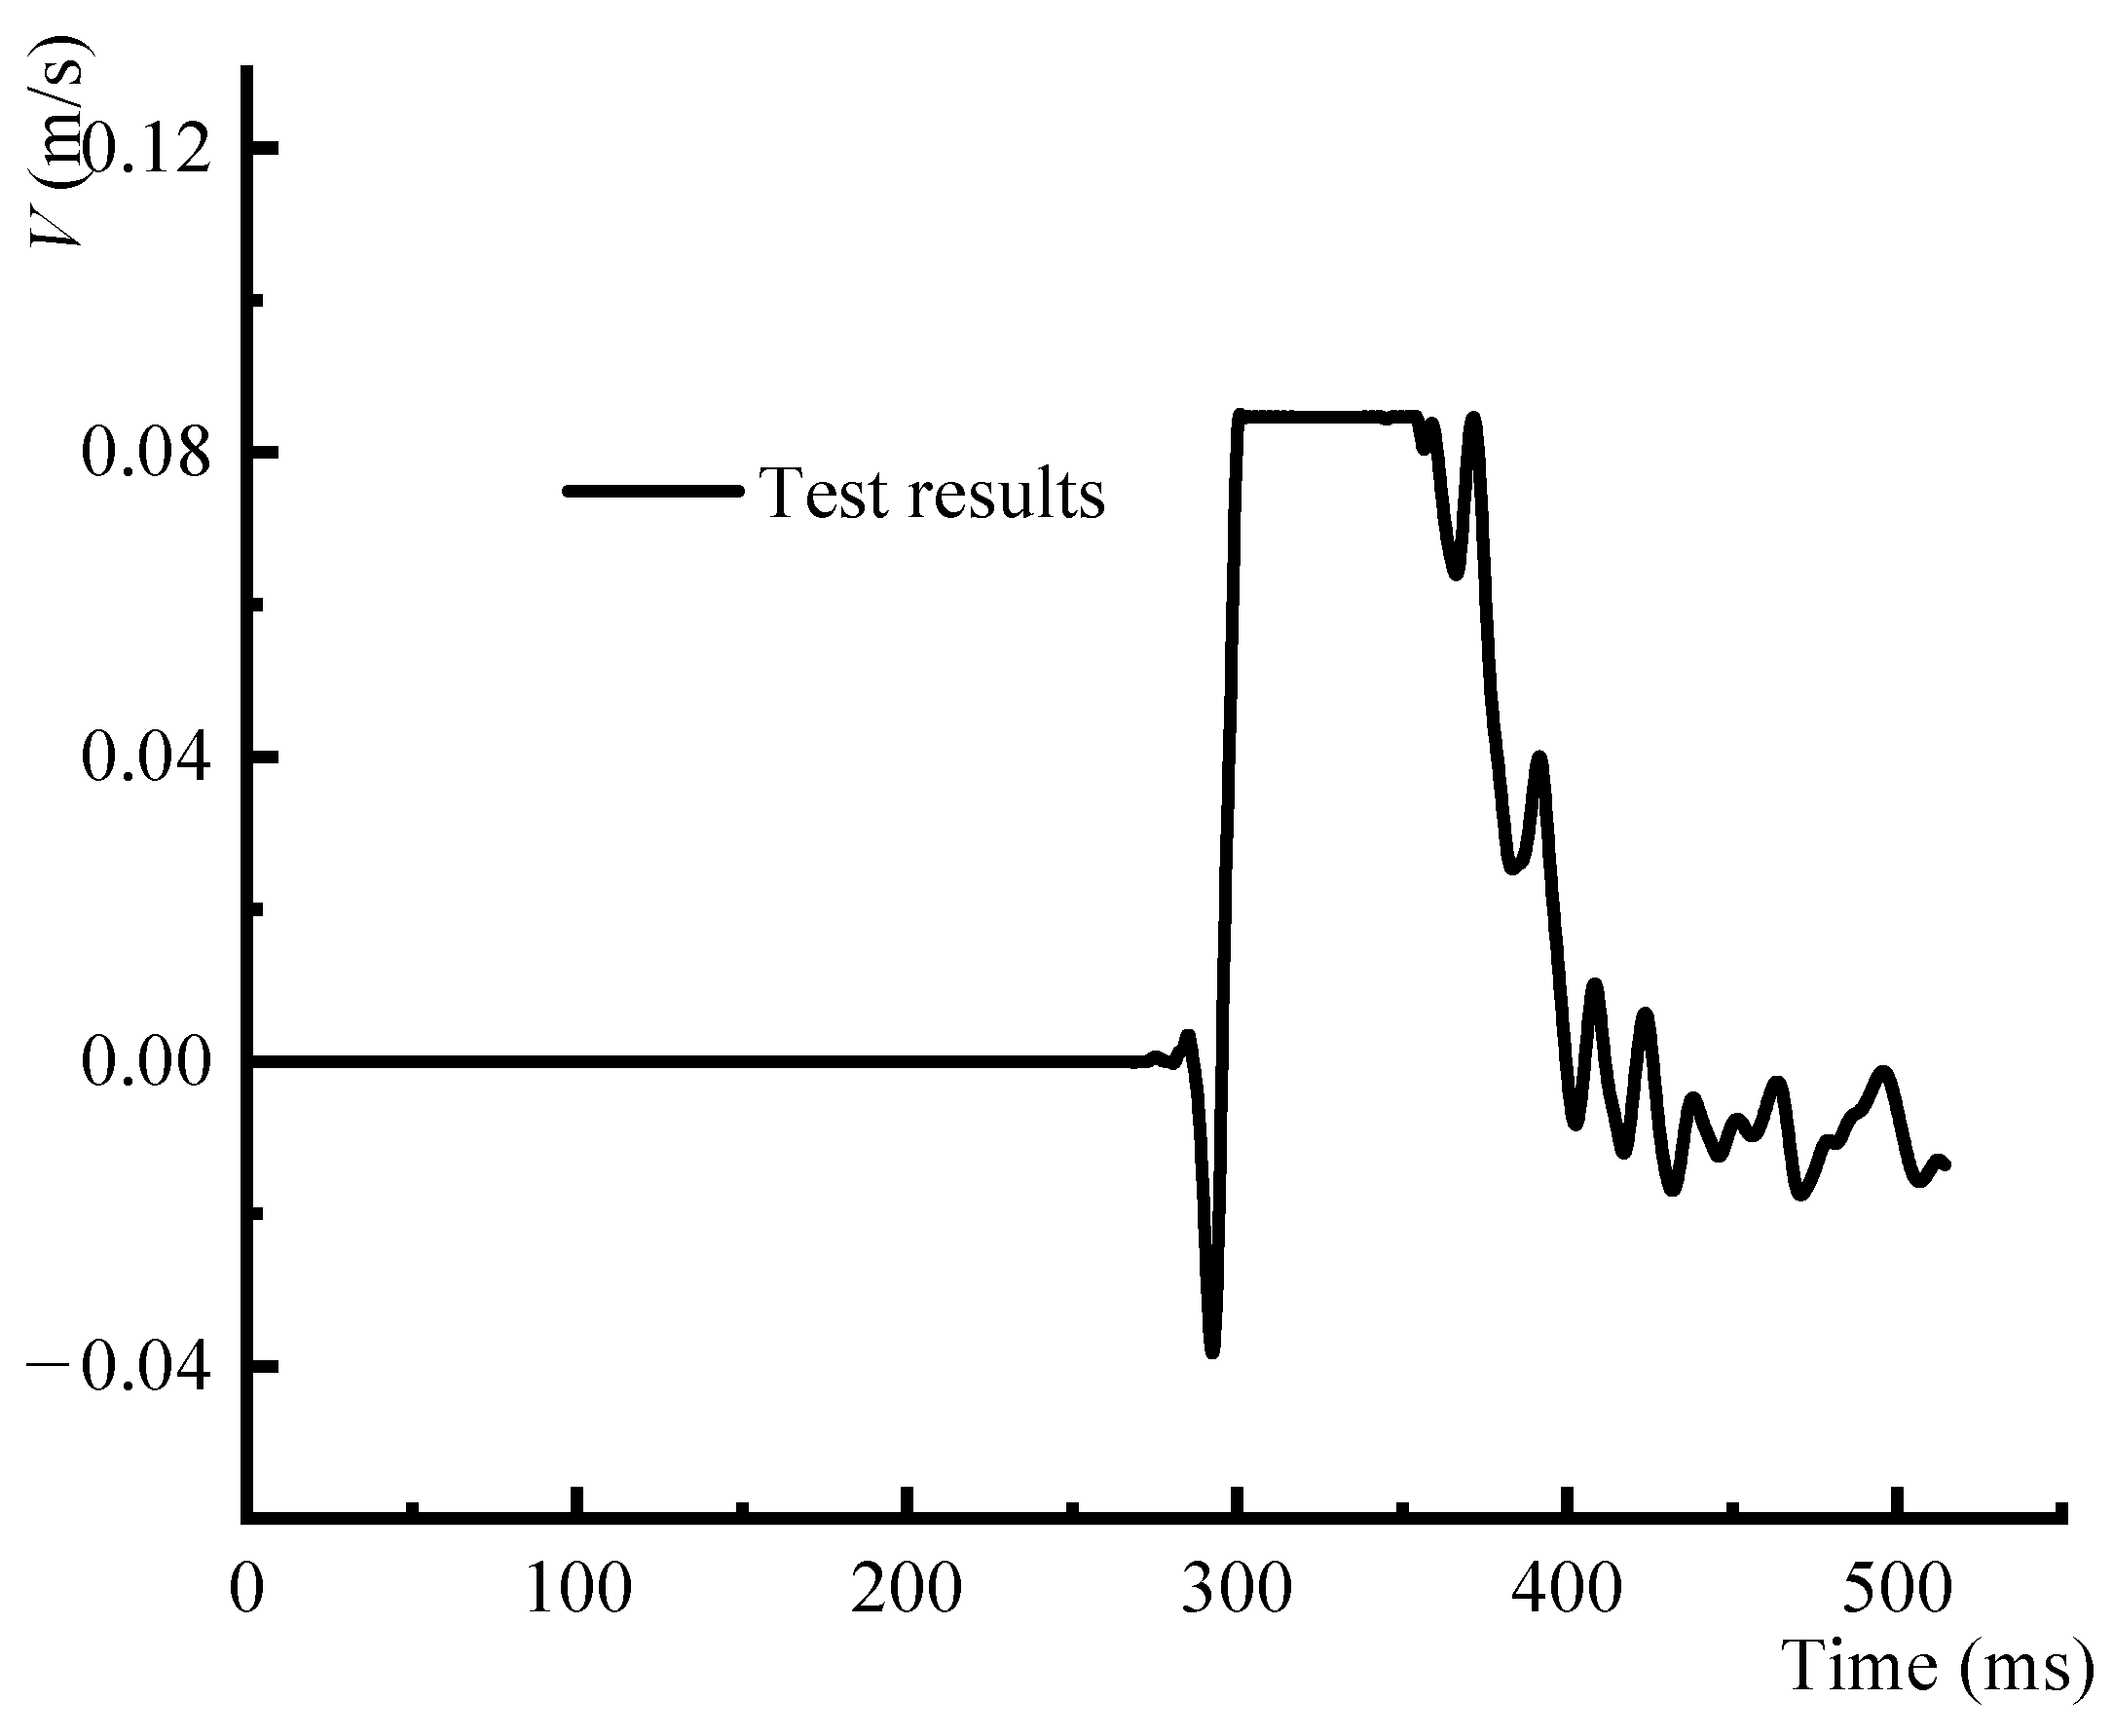
Figure 7 is the velocity–time curve of the 21 m point. It may be observed that the real particle vibration velocity exceeded the range of the velocity sensor, which caused clipping in the measured velocity–time curve.
There are many factors that affect the parameters of explosion-induced ground shocks. The Design And Analysis Of Hardened Structures To Conventional Weapon Effects [3] used by the U.S. military provides empirical equations that relate the charge weight to the propagation of the ground shock in soil. The equations for calculating the maximum ground shock acceleration and velocity are:
α 0 W 1 / 3 = f × 0 × c × ( R W 1 / 3 ) ( n + 1 )
v 0 = f × 160 × ( R W 1 / 3 ) n
where α0 is the maximum acceleration (g); v0 is the maximum velocity (ft/s); W is the C4 weight (lbs); f is the ground-shock coupling factor, which is always 0.14 for contact explosions or explosions in air, regardless of the type of ground [3]; c is the velocity of the seismic wave (ft/s); R is the distance of the measurement point from the epicenter of the explosion (ft); and n is the attenuation coefficient.
So, Equation (1) can be used for calculating the attenuation parameters, substituting the maximum acceleration measurements obtained from the 1 t TNT explosion at 21 and 42 m into Equation (1), the values of parameters c and n were obtained as follows: c = 457 m/s (1500 ft/s) and n = 2.55. Parameters c and n vary from one type of soil to another, as shown in Table 2.
Based on the velocities and attenuation coefficients shown in Table 2, the calculated c and n values resemble those for compacted sandy soil with a high relative density which matches the ground conditions at the experimental site. By substituting the calculated c and n values obtained for the 1 t TNT explosion test into Equation (2), it was determined that the maximum particle vibration velocity at the 21 m point v0–21 was equal to 0.116 m/s.
The attenuation of the ground-shock-induced particle velocities can be described using an exponential function. The ground-shock stress wave widens as it propagates, while simultaneously, the maximum particle vibration velocity decays rapidly in relation to the increasing distance from the blast site. The ground-shock wave’s arrival time ta denotes the time taken by the wave to reach some point from the epicenter of the explosion, and it may be expressed as [3]:
t a = R c
where R is the distance from the epicenter of the explosion measured in m.
The waveform of the ground shock will rise to its maximum in a very short time after arrival. The rise time tr is given by:
t r = 0.1 × t a
From Equations (3) and (4), it may be determined that the time of arrival of the shock pulse at the 21 m point was ta = 0.046 s, and the rise time was tr = 0.005 s (R = 21 m). The shock pulse subsequently decayed to 0 after 1–3 times the length of ta, as indicated by the decay equation:
v ( t ) = v 0 × ( 1 β t t a ) × e β t t a ,   t 0
where v(t) is the post-peak decay of the particle vibration velocity; β is the time constant, which changes according to the condition at the site; however, it is usually approximated as β = 0.4 [3].
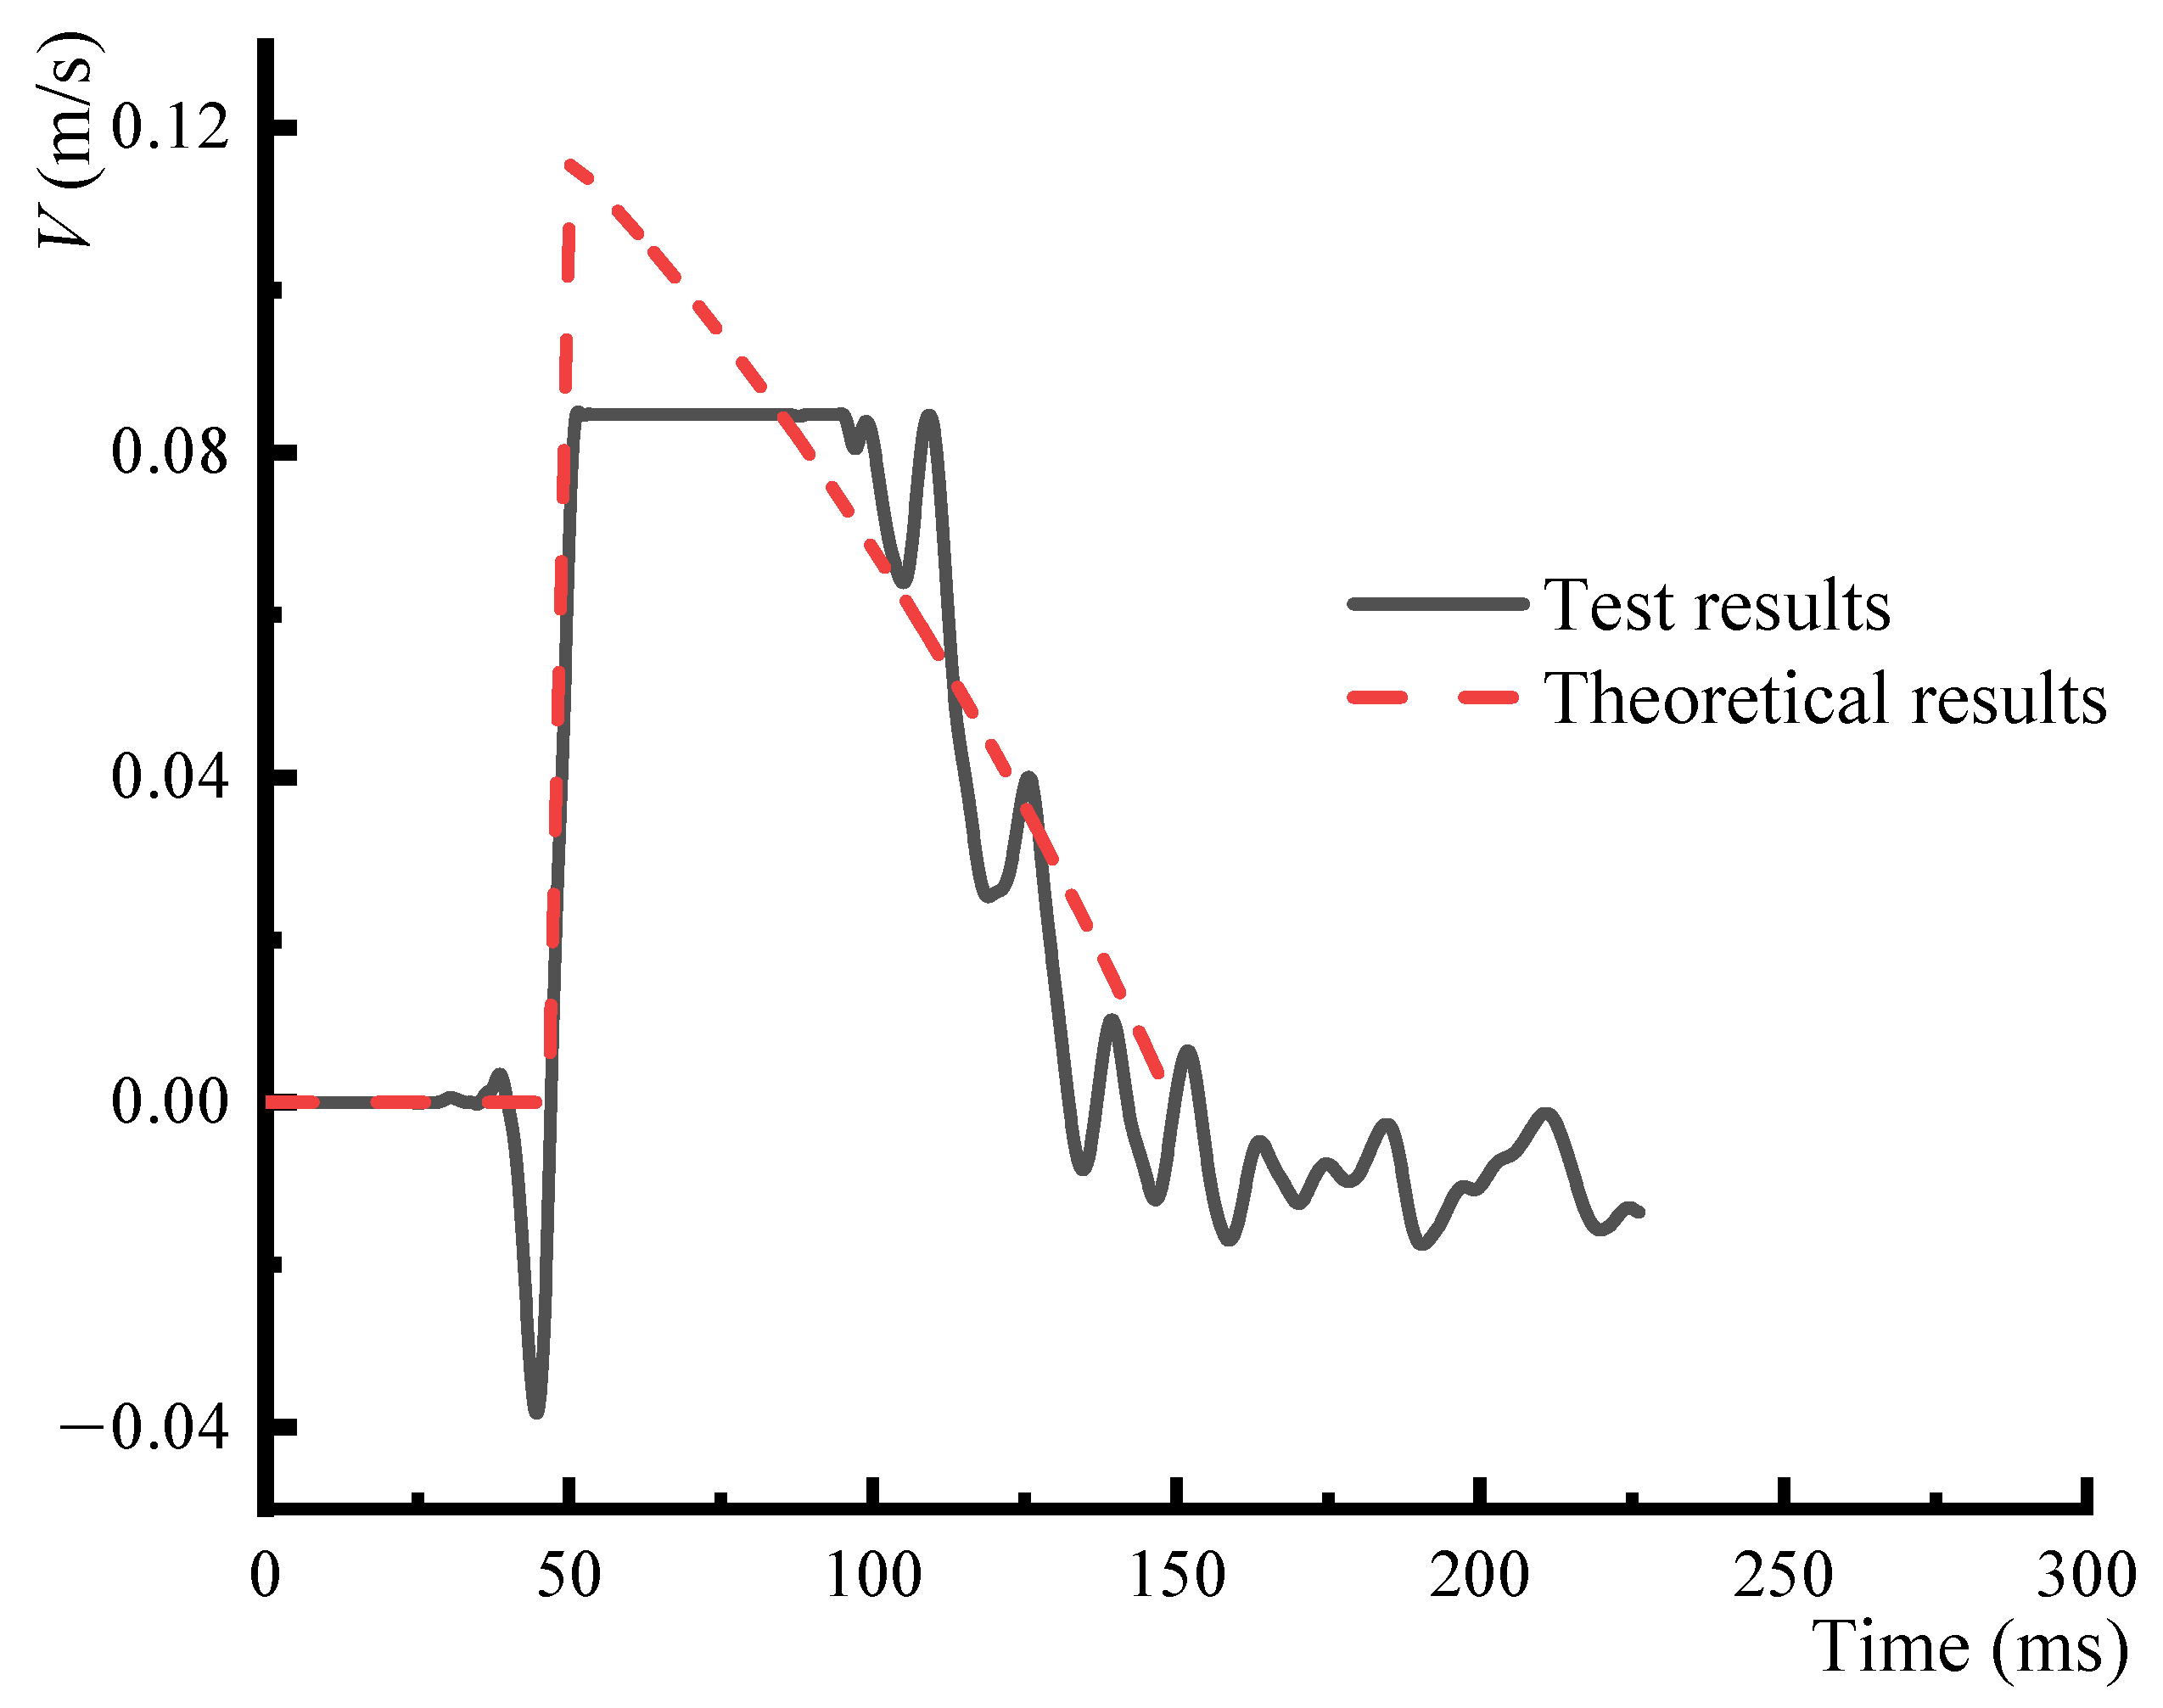
Equations (2)–(5) were used to plot the velocity–time curve of the 21 m point during the 1 t TNT explosion and compared to the experimental plot in Figure 8.
As shown in Figure 8, the duration of the ground-shock-induced vibrations was slightly shorter in the experimental result than the theoretical result. Nonetheless, it is worth noting that the theoretical and experimental results were, as a whole, in good agreement. Therefore, it can be concluded that it is possible to predict the ground-shock-induced velocity–time curve of a certain location to a reasonable level of accuracy by first calculating the seismic velocity and attenuation coefficient and subsequently applying Equations (2)–(5).

4. Finite Element Analysis

4.1. The Finite Element Model and Its Boundary Conditions

To quantify the influence of all of the key parameters on the ground shocks, a finite element model of the 1 t TNT test was constructed using the LS-DYNA finite element package.
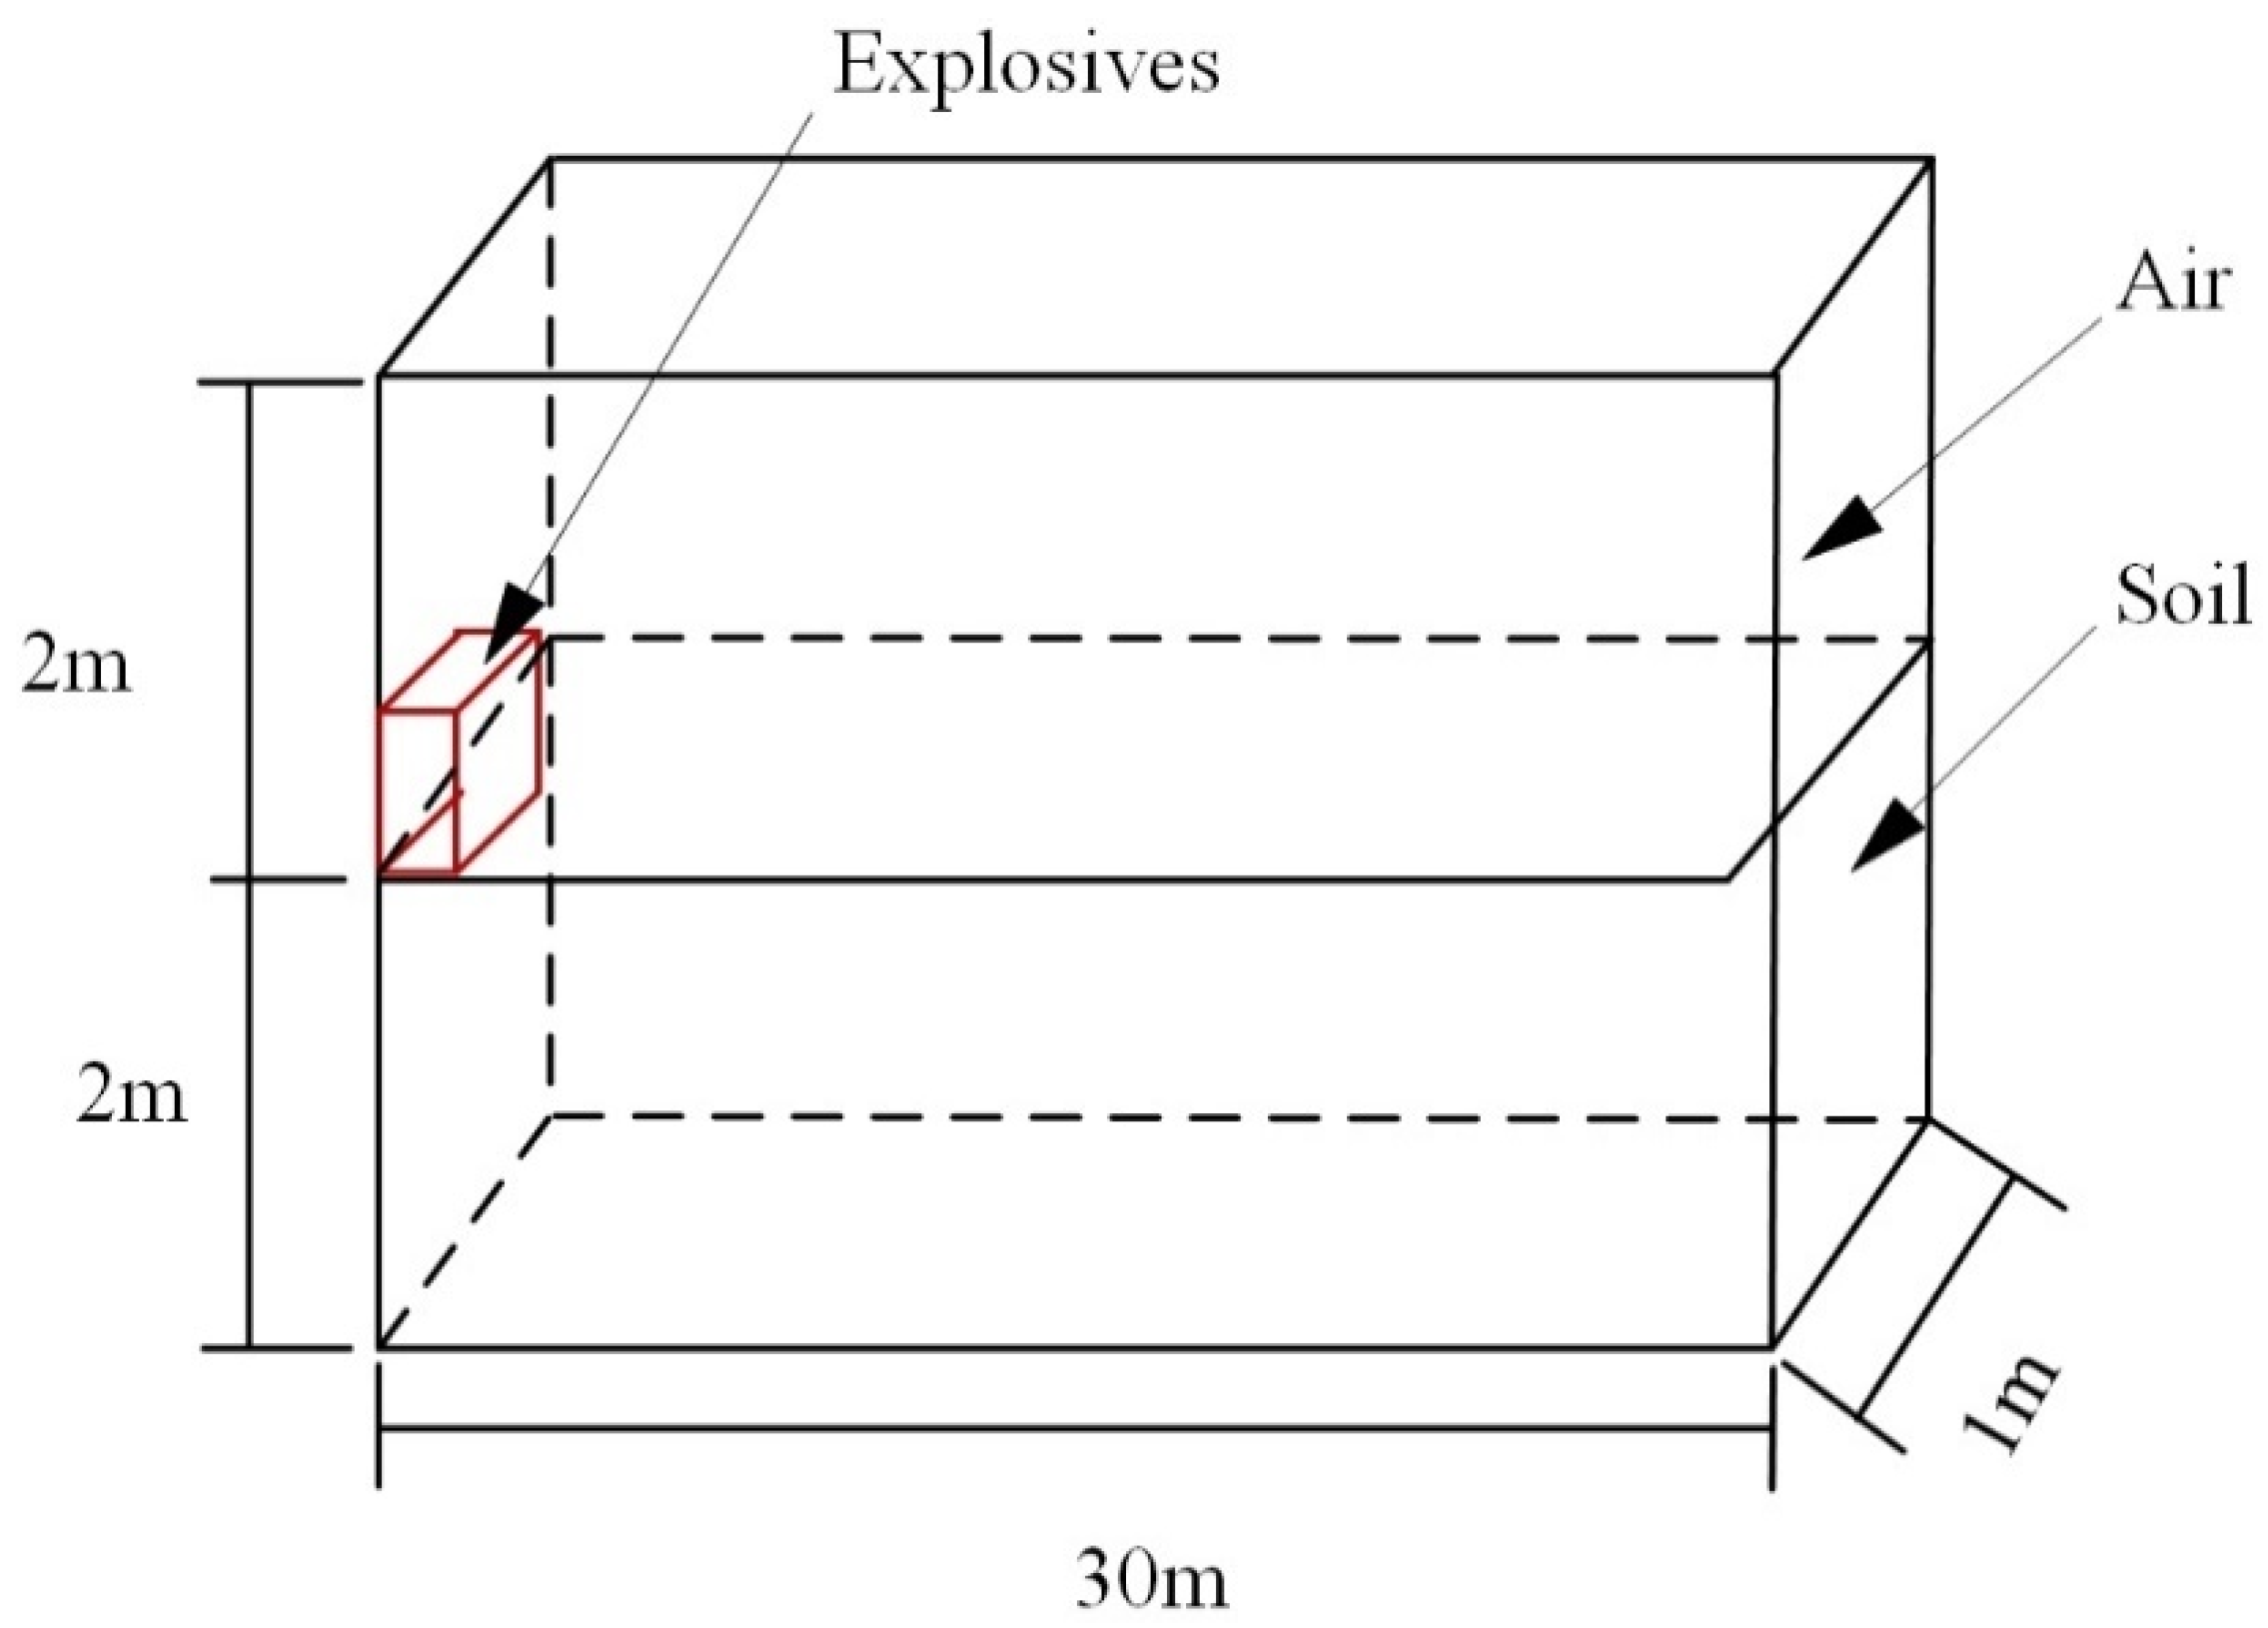
Because the model was relatively symmetric, only 1/4 of the model was used in the computations to maximize computational efficiency. To minimize the effects of the soil mass’s boundary conditions on the simulation, a few preliminary trials were performed to size the modeled volume. It was determined that a 30 × 4 × 1 m volume around the explosion should be included in the analysis (the explosives size was 0.85 × 0.85 × 0.23 m), as shown in Figure 9.
As the analyzed volume was large, a more precise model was constructed by downscaling the modeled volume. Based on the similarity theory for explosions, when the model and original systems have the same type of explosive charge, same initial atmospheric pressure, and similar explosive charge geometries, the model ratio CL may be expressed as:
C L = R 1 R 2 = W 1 3 W 2 3
Given an arbitrary pair of explosions, the ratios of their characteristic temporal quantities will be equal to the ratios of their characteristic geometric quantities. In a mass system, the dimensions for length, time, and particle vibration velocity v0 are L, T, and L/T, respectively. Consequently, the particle vibration velocities of two explosions at the same scaled blast distance would be related by the following ratio:
v 0 1 v 0 2 = 1
From the above, it may be surmised that a model ratio of CL-t = 10 could be applied when the charge weight was scaled down from 1 t to 1 kg. In other words, all characteristic temporal and geometric quantities could be contracted by a ratio of 10 in the scaled-down model. Consequently, at the same scaled blast distance, the particle vibration velocities of the scaled-down experiment would be equal to the particle vibration velocities of the original experiment, and the duration of particle vibrations in the scaled-down experiment would be 1/10 that of the original experiment.
Computational domains were constructed for the explosive charge, air, and sandy soil, while their behaviors were modeled using the Euler code. Symmetrical boundaries were used for symmetrical surfaces, and the remainder of the outer surfaces were simulated using transmitting boundaries with no reverse flows to simulate an infinitely large space (see in Figure 10). The Arbitrary Lagrangian–Eulerian code was used throughout the model, and the moving interfaces of the objects were characterized by defining appropriate forms of mesh motion that allowed the elements to retain their shape during movement. All of the input data were specified in units of kg, m, and s.

4.2. Material Model and Determination of Parameters

The Jones–Wilkins–Lee equation of state was used to describe the TNT charge, as shown below:
P = A × ( 1 ω R 1 V ) × e ( R 1 V ) + B × ( 1 ω R 2 V ) × e ( R 2 V ) + ω V × E 0
In this equation, A, B, R1, R2, and ω are constants; P is the pressure; V is the relative volume; E0 is the chemical energy of the explosive; and D is the velocity of detonation. The material parameters of the TNT charge are shown in Table 3 [25].
The overpressure at the test site was predicted using the ideal state equation, with the parameters shown in Table 4 [26].
The MAT_SOIL_AND_FOAM_FAILURE model was used to simulate the soil mass. The soil mass parameters (see Table 5) were taken from the laboratory measurements of Yang et al. [27] on high-density sandy soils.

4.3. Grid Validation

Many studies have demonstrated that grid size has a significant influence on the accuracy of the numerical explosion simulations [28]. Therefore, it is necessary to check the accuracy of the newly constructed finite element model prior to in-depth analysis. A uniform grid was used in the numerical model, and trials were performed with grid sizes of 4, 2, 1, and 0.5 cm. The velocity–time curve was computed for a point at a distance of 2.1 m from the blast site and at a burial depth of 0.05 m in each of these trials, and the computed velocity–time curves were compared to the experimental velocity–time curve. Because the numerical model was scaled down using a model ratio of CL−1 t = 10, the spatial and temporal dimensions of the computational result were magnified by a factor of 10 prior to this comparison. The results of the comparison are shown in Figure 11.
In Figure 11, it is shown that a decrease in the grid size led to corresponding increases in maximum velocity and decreases in the rise time of the velocity–time curve. However, it can be observed that the magnitude of the increase in the maximum velocity and the magnitude of decrease in the rise time reduced gradually with each successive decrease in grid size, which indicates that the computations were converging. When the grid size decreased from 1 to 0.5 cm, the maximum velocity increased by less than 5%, while no significant change was observed in the rise time and duration of the velocity–time curve. With a grid size of 1 cm, the numerical model contained 960,000 elements and 1,112,030 nodes. Although further decreases in grid size may improve the precision, computational efficiency will suffer greatly. Furthermore, the computational results were already in good agreement with the previously derived theoretical and experimental results with a grid size of 1 cm. Therefore, it was determined that the results of the numerical computations are sufficiently accurate and admissible for further discussion when they are performed with a grid size of 1 cm.

5. Discussion

By combining the experimental, theoretical, and numerical findings of the propagation behaviors of ground shocks, a relationship between the maximum particle vibration velocity and the propagation distance was derived for the 1 t TNT explosion, as shown in Figure 12a. Here, it is shown that the numerically simulated and theoretically derived maximum particle vibration velocities were in good agreement (the differences were generally within 10%), and that they both decreased exponentially with increasing propagation distance.
The first blast-resistant design standards for hazardous chemical storage facilities were based on a charge weight equivalent to 10 t TNT. Because we were unable to measure valid data from the 10 t TNT explosion experiment, the propagation behavior of the ground shock generated by the 10 t TNT charge was studied based on numerical simulation and theoretical analysis. The scaling factor for scaling a 10 t TNT explosion to a 1 t TNT explosion is C L 10 t : 1 t = 10 , 000 3 1000 3 = 2.154 . Therefore, to compute the decay in the maximum particle vibration velocity in the area near the epicenter of the 10 t TNT explosion, one simply has to multiply the temporal and spatial scales of the curve in Figure 12a by a factor of 2.154, as shown in Figure 12b.
The Blasting Safety Regulations (GB6722-2014) has defined a safety criterion for blast-induced vibrations in structures such as freshly poured large-volume concrete structures, tunnels/roadways, and high rock slopes, as shown in Table 6 [29].
Because surface explosions are similar to open-air shallow-hole blasts, which have an f between 40 and 100 Hz, it may be assumed that the f was greater than 50 Hz during the 1 t and 10 t TNT test. Based on Figure 12b and Table 6, the minimum safe distances for a variety of to-be-protected structures (in terms of vibration safety) were derived for a 1 t and 10 t TNT blast, as shown in Table 7 and Table 8.

6. Conclusions

In this study, the ground shock generated by the 1 t TNT surface explosion was successfully measured. The applicability of the empirical equations provided by the UFC 3-340-01 was discussed, and a numerical study to analyze the effects of ground shocks on buildings around an explosion was conducted. The conclusions of this study are as follows:
(1)
The intensity of ground shock decreased with the increase in distance from the blast site, and the accelerations in the X and Y direction were both higher than that in the Z direction.
(2)
The seismic wave velocity c and attenuation coefficient of the soil n at the experimental site were found to be c = 457 m/s and n = 2.55. The applicability of the empirical equations provided by the UFC 3-340-01 was validated for our experiment by the determined parameters c and n.
(3)
The attenuation behavior of the maximum particle vibration velocities around the epicenter of 1 t and 10 t TNT explosion were obtained, and the minimum safe distance was computed for a variety of structures.
The research results will be applied to the construction and planning scheme of the site selection for hazardous chemicals in a port in the near future. The safety distance of surrounding buildings will be evaluated, and a reasonable safety distance will be applied.

Author Contributions

C.X.: Data curation, Formal analysis, Investigation, Software, Writing—original draft. L.C.: Conceptualization, Data curation, Funding acquisition, Methodology, Writing—review & editing. R.X.: Investigation, Resources. M.C.: Data curation, Resources. D.C.: Formal analysis, Investigation, Software. Q.F.: Conceptualization, Funding acquisition, Project administration. All authors have read and agreed to the published version of the manuscript.

Funding

This work was supported by the National Natural Science Foundation of China (No. 51978166).

Institutional Review Board Statement

Not applicable.

Informed Consent Statement

Not applicable.

Data Availability Statement

Data sharing is not applicable to this article.

Acknowledgments

Thanks to all the authors for their comments and suggestions on the manuscript.

Conflicts of Interest

The authors declare no conflict of interest.

References

  1. Baker, W.E.; Cox, P.A.; Kulesz, J.J.; Strehlow, R.A.; Westine, P.S. Explosion Hazards and Evaluation; Elsevier: Amsterdam, The Netherlands, 1983. [Google Scholar]
  2. Henrych, J. The Dynamics of Explosion and Its Use; Elsevier: Amsterdam, The Netherlands, 1979. [Google Scholar]
  3. UFC 3-340-01; Design and Analysis of Hardened Structures to Conventional Weapon Effects. United Facilities Criteria, Department of Defense: Washington, DC, USA, 2002.
  4. Liu, H.; Wang, P.; Wei, X.; Xiao, J.; Chen, R. Longitudinal Seismic Response of Continuously Welded Track on Railway Arch Bridges. Appl. Sci. 2018, 8, 775. [Google Scholar] [CrossRef] [Green Version]
  5. Xu, W.; Yang, X.; Wang, F.; Chi, B. Experimental and Numerical Study on the Seismic Performance of Prefabricated Reinforced Masonry Shear Walls. Appl. Sci. 2018, 8, 1856. [Google Scholar] [CrossRef] [Green Version]
  6. Yao, E.; Li, W.; Miao, Y.; Ye, L.; Yang, Z. Study on the Influence of a Soft Soil Interlayer on Spatially Varying Ground Motions. Appl. Sci. 2022, 12, 1322. [Google Scholar] [CrossRef]
  7. Ju, B.-S.; Jeon, B.-G.; Kim, S.-W.; Son, H.-Y. Validation of Seismic Performance of Stainless Press-to-Connect Piping System under Cyclic Loadings. Appl. Sci. 2022, 12, 3896. [Google Scholar] [CrossRef]
  8. Martínez-Martín, F.J.; Yepes, V.; González-Vidosa, F.; Hospitaler, A.; Alcalá, J. Optimization Design of RC Elevated Water Tanks under Seismic Loads. Appl. Sci. 2022, 12, 5635. [Google Scholar] [CrossRef]
  9. Mohseni, I.; Lashkariani, H.A.; Kang, J.; Kang, T.H.-K. Dynamic Response Evaluation of Long-Span Reinforced Arch Bridges Subjected to Near- and Far-Field Ground Motions. Appl. Sci. 2018, 8, 1243. [Google Scholar] [CrossRef] [Green Version]
  10. Merkle, D.; Rochefort, M.; Tuan, C. Equipment Shock Tolerance; U.S. Air Force Civil Engineering Support Agency, Tyndall Air Force Base: Albuquerque, NM, USA, 1993. [Google Scholar]
  11. Krauthammer, T. Shallow-Buried RC Box-Type Structures. J. Struct. Eng. ASCE 1984, 110, 637–651. [Google Scholar] [CrossRef]
  12. Weidlinger, P.; Hinman, E. Analysis of underground protective structures. J. Struct. Eng. ASCE 1988, 114, 1658–1673. [Google Scholar] [CrossRef]
  13. Zhang, Y.D.; Fang, Q.; Liu, J.C. Experimental and numerical investigations into responses of buries RC frames subjected to impulsive loading. In Structures under Shock and Impact VII; Elservier: Amsterdam, The Netherlands, 2002; pp. 69–78. [Google Scholar]
  14. Nagy, N.; Mohamed, M.; Boot, J.C. A Complete Nonlinear Finite Element Analysis for the Effects of Surface Explosions on Buried Structures. In Proceedings of the Eleventh International Conference on Civil, Structural and Environmental Engineering Computing, St. Julians, Malta, 18–21 September 2007. [Google Scholar] [CrossRef]
  15. Wu, C.; Lu, Y.; Hao, H. Numerical prediction of blast-induced stress wave from large-scale underground explosion. Int. J. Numer. Anal. Methods Géoméch. 2003, 28, 93–109. [Google Scholar] [CrossRef]
  16. Wu, C.; Hao, H. Modeling of simultaneous ground shock and airblast pressure on nearby structures from surface explosions. Int. J. Impact Eng. 2005, 31, 699–717. [Google Scholar] [CrossRef]
  17. Lu, Y.; Wang, Z. Characterization of structural effects from above-ground explosion using coupled numerical simulation. Comput. Struct. 2006, 84, 1729–1742. [Google Scholar] [CrossRef]
  18. Hao, H.; Zhou, Y. Dynamic Response of Rigid Blocks to Simultaneous Horizontal and Vertical Ground Shock. Adv. Struct. Eng. 2012, 15, 1069–1082. [Google Scholar] [CrossRef]
  19. Longinow, A.; Mniszewski, K.R. Protecting Buildings against Vehicle Bomb Attacks. Pract. Period. Struct. Des. Constr. 1996, 1, 51–54. [Google Scholar] [CrossRef]
  20. Fang, Q.; Yang, S.G.; Chen, L.; Liu, J.; Zhang, Y. Analysis on the building damage, personnel casualties and blast energy of the 8 · 12 explosion in Tianjin port. China Civ. Eng. J. 2017, 50, 12–18. [Google Scholar]
  21. Xu, R.; Chen, L.; Fang, Q.; Zheng, Y.; Li, Z.; Cao, M. Analysis of the power and disaster consequences of "3.21" explosion accident in the chemical industry park of Xiangshui, Yancheng city. J. Disaster Prev. Mitig. Eng. 2019, 50, 12–18. [Google Scholar]
  22. Pasman, H.J.; Fouchier, C.; Park, S.; Quddus, N.; Laboureur, D. Beirut ammonium nitrate explosion: Are not we really learning anything? Process Saf. Prog. 2020, 39, 1–18. [Google Scholar] [CrossRef]
  23. Rigby, S.E.; Lodge, T.J.; Alotaibi, S.; Barr, A.D.; Clarke, S.D.; Langdon, G.S.; Tyas, A. Preliminary yield estimation of the 2020 Beirut explosion using video footage from social media. Shock Waves 2020, 30, 671–675. [Google Scholar] [CrossRef]
  24. Momeni, M.; Bedon, C.; Hadianfard, M.A.; Baghlani, A. An Efficient Reliability-Based Approach for Evaluating Safe Scaled Distance of Steel Columns under Dynamic Blast Loads. Buildings 2021, 11, 606. [Google Scholar] [CrossRef]
  25. Lee, E.; Finger, M.; Collins, W. JWL Equation of State Coefficients for High Explosives; Lawrence Livermore National Lab. (LLNL): Livermore, CA, USA, 1973. [CrossRef] [Green Version]
  26. Rogers, G.F.C.; Mayhew, Y.R. Thermodynamic and transport properties of fluids. Fluid Phase Equilibria 1994, 83, 85–92. [Google Scholar]
  27. Yang, Q.; Zheng, J.; Cheng, K.; Lv, D. Modified Finite-element Model to Analyze Soil Arching Effect in Piled Embankments. J. Civil. Eng. Manag. 2017, 34, 19–23. [Google Scholar]
  28. Shi, Y.; Hao, H.; Li, Z.-X. Numerical simulation of blast wave interaction with structure columns. Shock Waves 2007, 17, 113–133. [Google Scholar] [CrossRef]
  29. National Standard Writing Group of the People’s Republic of China. Blasting Safety Regulations GB6722-2014; China Standard Press: Beijing, China, 2015. [Google Scholar]
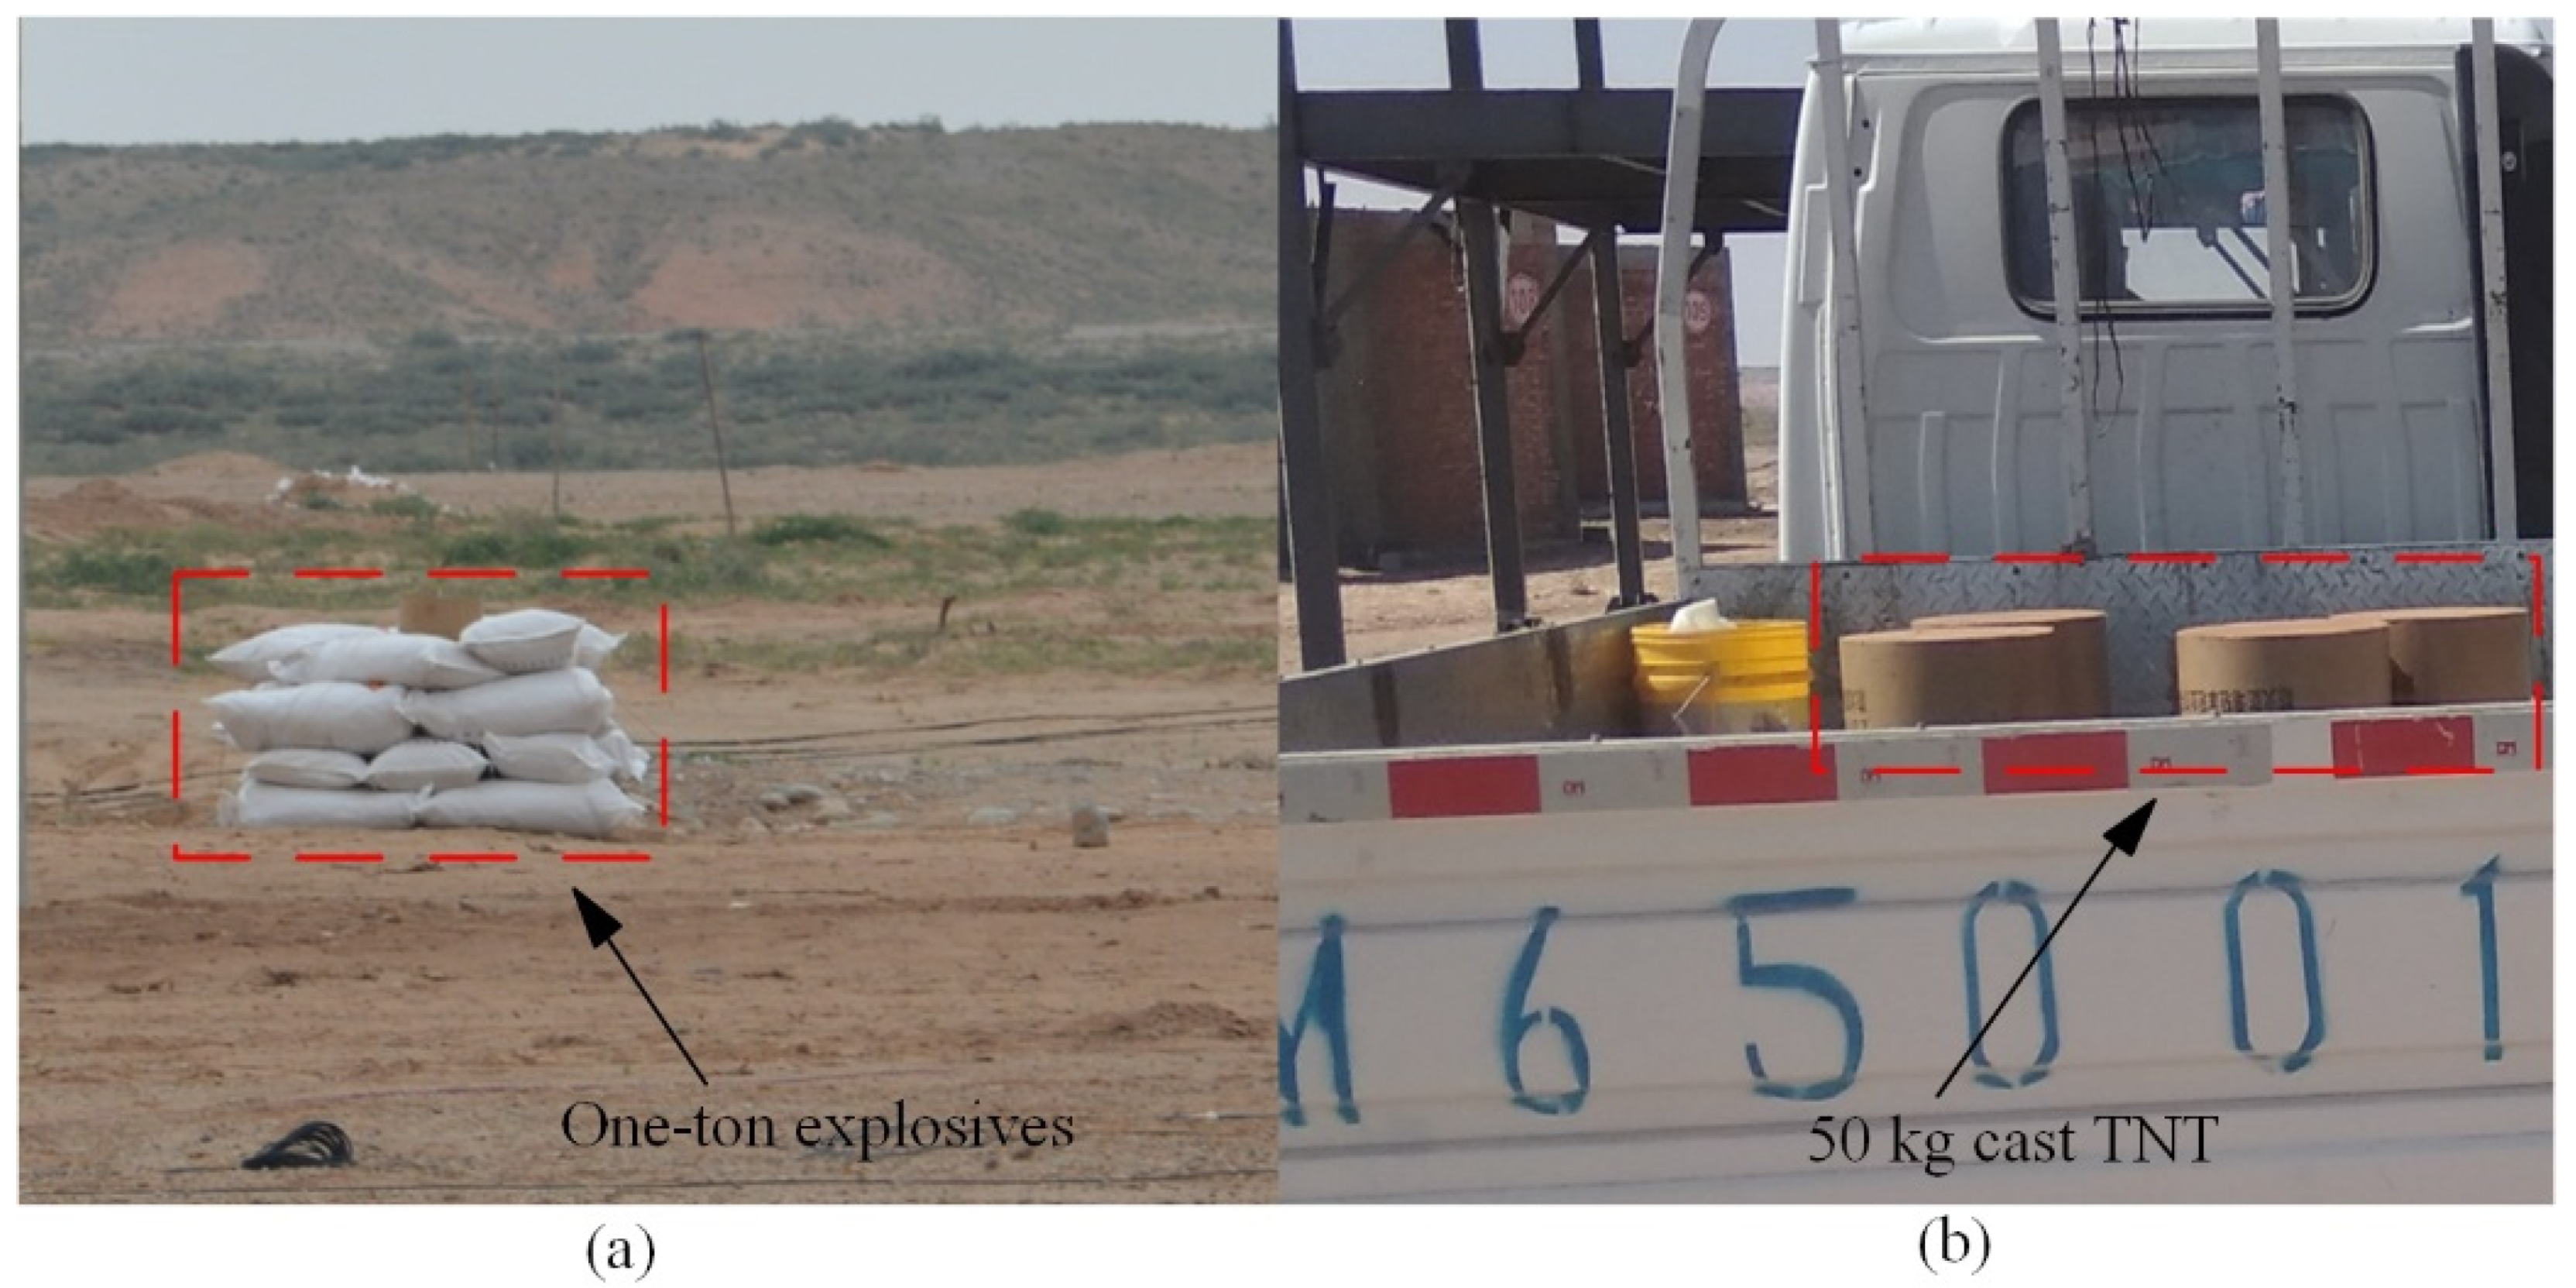
Figure 1. TNT charges for tests, (a) the explosives and (b) the cast TNT.
Applsci 12 07987 g001
Figure 2. Cross section of explosive arrangement on the ground.
Applsci 12 07987 g002
Figure 3. Sensor layout and photographs of the sensors, (a) layout of the sensors, (b) photograph of the sensors, (c,d) the pits.
Applsci 12 07987 g003
Figure 4. Photographs of the measurement station before and after the 10 t TNT test, (a,b) photographs of the inside and outside of the station before test, (c) photograph of the outside of the station after the 10 t TNT test, (d) photograph of the inside of the station after the 10 t TNT test.
Applsci 12 07987 g004
Figure 5. Acceleration data measured at 21 m in the one-ton TNT ground explosion test.
Applsci 12 07987 g005
Figure 6. Acceleration data measured at 42 m in the one-ton TNT ground explosion test.
Applsci 12 07987 g006
Figure 7. Velocity−time curve at the 21 m point.
Applsci 12 07987 g007
Figure 8. Comparison between the theoretical and experimental velocity–time curves at the 21 m point.
Applsci 12 07987 g008
Figure 9. Geometry of the simulated model.
Applsci 12 07987 g009
Figure 10. Boundaries of the simulated model.
Applsci 12 07987 g010
Figure 11. The effects of grid size on the computed velocity–time curve.
Applsci 12 07987 g011
Figure 12. The relationship between the maximum particle vibration velocity and the propagation distance, (a) 1t TNT and (b) 10t TNT.
Applsci 12 07987 g012
Table 1. Sensor specifications.
TypeModelSensitivity (mV/m∙s−2)RangeFrequency Range (Hz)
Acceleration sensors1B314E~100~500Y/Z 0.5–7000;
X 0.5–5000
Velocity sensor2A101E~412702~6000
Note: The units of the acceleration sensor range and velocity sensor range are m∙s−2 and mm∙s, respectively.
Table 2. Soil properties for calculating ground shock parameters [3].
Material DescriptionSeismic Wave Velocity c (ft/s)Acoustic Impedance (ρc) (lbs∙ft/in3∙s)Attenuation Coefficient n
Loose dry sands and gravel with a low relative density600123~3.25
Sandy loam, loess, dry sands, and backfill1000222.75
Dense sand with high relative density1600442.5
Wet sandy clay with air voids (greater than 4%)1800482.5
Saturated sandy clays and sands with small amount of air voids (less than 1%)50001302.25~2.5
Heavy saturated clays and clay shales>5000150~1801.5
Table 3. Material parameters of the TNT charge [25].
ρ (kg·m−3)D (m·s−1)PC–J (Pa)A (Pa)B (Pa)R1R2ωE0 (J·m−3)
163069302.7 × 10103.7377 × 10113.7471 × 1094.150.90.357 × 109
Table 4. Material parameters of air [26].
Air Density ρ (kg·m−3)Massic Heat Capacity at Constant
Volume cE (J·kg−1·K−1)
Initial Pressure
P0 (Pa)
Adiabatic
Exponent γ
Initial Internal Energy E0 (J·m−3)
1.225717.601.42.586 × 105
Table 5. Soil mass parameters [27].
ParameterValueParameterValueParameterValueParameterValue
ρ (kg/m2)2050PREF0VEPS70.095P4 (MPa)0.156
G (MPa)71.43VEPS10VEPS80.11P5 (MPa)0.176
B (MPa)2.2 × 10⁸VEPS20.01VEPS90.13P6 (MPa)0.189
a01.2 × 104VEPS30.02VEPS100.157P7 (MPa)0.197
a10.16VEPS40.039P1 (MPa)0P8 (MPa)0.202
a20VEPS50.058P2 (MPa)0.101P9 (MPa)0.212
PC0VEPS60.077P3 (MPa)0.128P10 (MPa)0.217
VCR0
where ρ is the density of the sandy soil, G is the shear modulus, B is the bulk modulus (when VCR = 0), VCR is the volume crushing option (turned on when VCR = 0 and turned off when VCR = 1), VEPS1~VEPS10 are the volumetric strain values, and P1~P10 are the corresponding pressure values of the volumetric strains.
Table 6. Safety criterion for blast-induced vibrations [29].
Type of To-Be-Protected StructureSafe and Permissible Particle
Vibration Velocities, v (cm/s)
f ≤ 10 Hz10 Hz < f ≤ 50 Hzf > 50 Hz
Cave dwellings, adobe houses, and rubble houses0.15~0.450.45~0.90.9~1.5
Ordinary civilian buildings1.5~22~2.52.5~3
Industrial and commercial buildings2.5~3.53.5~4.54.2~5
Ordinary historical buildings and sites0.1~0.20.2~0.30.3~0.5
Central control room equipment in operational hydropower stations and power stations0.5~0.60.6~0.70.7~0.9
Hydraulic tunnels7~88~1010~15
Traffic tunnels10~1212~1515~20
Mine roadways15~1818~2525~30
Permanent rocky high slopes5~98~1210~15
Age: Initial setting–3 days1.5~22~2.52.5~3
Age: 3–7 days3~44~55~7
Age: 7–28 days7~88~1010~12
Note: 1. The vibrational frequency refers to the dominant frequency of vibration. 2. The frequency range was determined from field measurements of the ground shock waveform or data selected based on the following criteria: cavern blasting: f < 20 Hz; open-air deep-hole blasting: 10 Hz < f < 60 Hz; open-air shallow-hole blasting: 40 Hz < f < 100 Hz; underground shallow-hole blasting: 60 Hz < f < 300 Hz.
Table 7. Minimum distance for the vibration safety of a 1 t TNT blast.
To-Be-Protected StructureMinimum Distance for Vibration Safety (m)
Cave dwellings, adobe houses, and rubble houses23.7~29.6
Ordinary civilian buildings17.5~19.0
Industrial and commercial buildings14.1~15.2
Ordinary historical buildings and sites38.3~47.8
Central control room equipment in operational hydropower stations and power stations29.6~33.1
Hydraulic tunnels8.7~10.4
Traffic tunnels7.4~8.7
Mine roadways6.5~7.0
Permanent rocky high slopes8.7~10.4
Age: Initial setting–3 days17.5~19.0
Age: 3–7 days12.2~14.1
Age: 7–28 days9.6~10.4
Table 8. Minimum distance for vibration safety of a 10 t TNT blast.
To-Be-Protected StructureMinimum Distance for Vibration Safety (m)
Cave dwellings, adobe houses, and rubble houses51.1~63.8
Ordinary civilian buildings37.8~40.9
Industrial and commercial buildings30.3~32.7
Ordinary historical buildings and sites82.4~102.9
Central control room equipment in operational hydropower stations and power stations63.8~71.2
Hydraulic tunnels18.8~22.4
Traffic tunnels16.6~18.8
Mine roadways13.9~15
Permanent rocky high slopes18.8~22.4
Age: Initial setting–3 days37.8~40.9
Age: 3–7 days26.2~30.3
Age: 7–28 days20.7~22.4
Publisher’s Note: MDPI stays neutral with regard to jurisdictional claims in published maps and institutional affiliations.