Article

Parameter Optimization and Experimental Study on Tool-Vibration-Assisted Pulsed Electrochemical Machining of γ-TiAl TNM Blades

1
College of Mechanical and Electrical Engineering, Nanjing University of Aeronautics and Astronautics, Nanjing 210016, China
2
School of Mechanical Engineering, Anhui University of Technology, Ma’anshan 243002, China
*
Author to whom correspondence should be addressed.
Appl. Sci. 2022, 12(16), 8042; https://doi.org/10.3390/app12168042
Submission received: 30 June 2022 / Revised: 28 July 2022 / Accepted: 5 August 2022 / Published: 11 August 2022

Abstract

:
Electrochemical machining (ECM) is one of the main methods for manufacturing gamma-titanium aluminum (γ-TiAl) alloy blades of new-type aero-engines. Tool-vibration-assisted pulsed electrochemical machining (VPECM) is an important method to improve the manufacturing accuracy. In order to determine the influence of processing parameters on the VPECM quality of γ-TiAl TNM alloys, multi-field simulations with different parameter combinations of peak voltage, feed rate, duty cycle, and tool vibration frequency were carried out. The influence of bubble rate and temperature increase on the conductivity distribution in the machining gap under different parameter combinations was analyzed. Then, orthogonal experiments with the above four processing parameters were carried out. The experimental results of surface roughness, replication accuracy, and average current density in the pulse width were interpreted by a grey relational analysis, and the best parameter combination was determined. Finally, four blade-shaped γ-TiAl TNM alloy specimens were processed by using the optimized parameter combination, which had good replication accuracy and surface quality.

1. Introduction

Intermetallic gamma-titanium aluminum (γ-TiAl) is a type of light superalloy with the advantages of low density, high melting temperature, high thermal conductivity, and creep resistance [1,2]. At present, the main γ-TiAl alloys that are used include second-generation TiAl 4822 and TiAl 45XD, which have been introduced as low-pressure turbine blades in aero-engines [3,4]. In the last decade, research and development activities have been focused on γ-TiAl alloys of the third generation, such as γ-TiAl TNM, which is a type of γ-TiAl alloy that is suitable for forging and potentially high-pressure compressor blade components [5,6]. However, γ-TiAl alloys are limited by a lack of ambient-temperature ductility and toughness [7]. Therefore, cracks and heat generation are common during cutting processes such as turning, milling, and drilling [8]. In addition, production costs are also significantly increased due to the serious wear of the cutting tools [9]. These fabrication difficulties severely limit the possible applications of γ-TiAl alloys.
Electrochemical machining (ECM) is a non-traditional machining technology that removes materials through a controlled electrochemical anodic dissolution reaction [10,11]. It has the advantages of non-contact, no tool wear, good surface integrity, and high processing efficiency. In addition, compared with cutting machining, ECM has significant efficiency and cost advantages. To understand the electrochemical dissolution characteristics of γ-TiAl alloys and obtain better processing results, scholars have carried out many studies on the ECM of γ-TiAl alloys. Clifton et al. studied the dissolution characteristics of Ti-45Al-2Cr-2Nb in sodium chloride (NaCl) and sodium perchlorate (NaClO4) solutions; they found that it was easier to obtain a better-quality machined surface in the sodium chloride solution, and the surface of γ-TiAl alloys processed by ECM had no obvious defects compared with the cutting process [12]. F. Klocke et al. analyzed the electrochemical dissolution characteristics of γ-TiAl with different compositions and found that, compared with traditional titanium alloys, γ-TiAl alloys have higher processing efficiency due to their increased aluminum content [13]. British company Rolls Royce processed a γ-TiAl 45XD casting blank by ECM, and, after processing the airfoil profile, the edge plate was prepared by machining, and the γ-TiAl 45XD blade was successfully obtained [4]. Wang et al. analyzed the anodic dissolution characteristics of two new light alloy materials (γ-TiAl 4822 and 45XD) in ECM experiments, and the microstructure and surface morphologies of the workpieces were examined [14]. Wang et al. investigated the electrochemical dissolution behavior of γ-TiAl 4822 to improve the machining efficiency and surface quality obtained by ECM, and the results showed that γ-TiAl 4822 had a higher material removal rate in NaCl and higher surface quality in NaNO3 [15]. Liu et al. presented a generic ECM anti-copy method with machining gap control to process γ-TiAl blades, and the test specimens showed good quality and high accuracy [16]. The processing mode of the above research mainly adopted direct-current (DC) and pulsed ECM processing. Tool-vibration-assisted pulsed ECM (VPECM) is a type of precision electrolytic processing method that creates the pulse width in small machining gaps and pulse interval in large machining gaps [17,18]. The vibration of the tools will enhance the ability of the electrolyte to discharge electrolytic products. Compared with the DC and pulsed ECM methods, VPECM can achieve a smaller machining gap and higher machining accuracy [19,20]. Therefore, VPECM is expected to improve the ECM precision of γ-TiAl alloys.
In this paper, an experimental study on parameter optimization was carried out for the VPECM of γ-TiAl TNM alloy. Through a multi-field simulation analysis of different parameter combinations in VPECM, such as peak voltage, feed rate, duty cycle, and tool vibration frequency, the influence of the bubble rate and temperature rise on the conductivity distribution in the machining gap with different parameter combinations was revealed. Then, orthogonal experiments with the above four processing parameters were carried out. The surface roughness, replication accuracy, and the average current density of the pulse width were used as evaluation indexes. The results of the orthogonal experiments were analyzed by the grey correlation analysis method, and the optimized combination of parameters was obtained. Finally, blade-shaped γ-TiAl TNM alloy specimens were processed by using the optimized combination of parameters to further verify their effectiveness.

2. Principle and Multi-Field Simulation of VPECM

The principle of VPECM is shown in Figure 1, comprising a cathode tool connected to the negative pole of a power supply and an anode workpiece connected to the positive pole. The cathode tool feeds toward the workpiece and creates a reciprocating small-amplitude vibration. When the cathode tool moves close to the workpiece, the power is turned on for processing. When the cathode tool moves away from the workpiece, the power is turned off for electrolyte scouring. During the pulse interval, the increased machining gap can increase the electrolyte flow rate and improve its ability to carry away electrolytic products, i.e., bubbles, metal ions, and insoluble products, etc. With the full removal of electrolytic products within the pulse interval, VPECM can process stably at a smaller machining gap and achieve higher machining accuracy than the DC and pulsed ECM methods.
In order to reveal the influence of machining parameters on the distribution of machined products in the machining gap, a multi-field simulation of VPECM was carried out using COMSOL Multiphysics. The two-dimensional multi-field simulation model is shown in Figure 2. In the simulation analysis, the electric field distribution in the machining gap satisfied the Laplace equation:
2 φ = 0
Taking into account the influence of hydrogen bubbles and heat, the conductivity of the electrolyte ( κ ) is defined as follows:
κ = κ 0 ( 1 + ε ( T T 0 ) ) ( 1 β ) n
where κ 0 is the initial conductivity of the electrolyte, β is the bubble rate contained in the electrolyte, T is the temperature of the electrolyte, T 0 is the initial temperature of the electrolyte, n is the influence coefficient of the bubble rate on the conductivity, and ε is the temperature-dependent gradient [21,22].
Considering the processing characteristics of VPECM, the parameters of peak voltage, feed rate, vibration frequency, and duty cycle were selected as the analysis objects, and multi-field simulations with different parameter combinations were carried out. The selected parameter combinations of the multi-field simulations are shown in Table 1, and other general parameters are shown in Table 2. Nephograms of the bubble rate and temperature distribution when the cathode tool moves to the minimum inter-electrode gap are shown in Figure 3.
In parameter combination 1, the peak voltage is 20 V, the feed rate is 0.25 mm/min, the duty cycle is 1/6, and the vibration frequency is 20 Hz. As shown in Figure 3a,b, when the machining gap is the smallest, the maximum local bubble rate is 12.6%, and the maximum temperature rise is 8.6 K. The average bubble rate and temperature of the section perpendicular to the flow in the machining gap changing with time are shown in Figure 4a,b, respectively. The maximum average bubble rate is 2.3%, and the maximum average temperature of the section is 300.4 K.
In parameter combination 2, as the voltage is set to 30 V, the product is increased slightly compared to that at 20 V. The maximum local bubble rate is 15.1%, and the maximum temperature rise is 14.0 K. As shown in Figure 4c,d, the maximum average bubble rate is 2.7%, and the maximum average temperature of the section is 304.3 K. The increase in product accumulation can lead to a decrease in machining accuracy. In addition, due to the increase in voltage, the machining gap has increased, which is not conducive to accuracy control.
In parameter combination 3, the feed rate is increased to 0.35 mm/min, and the machining gap is reduced accordingly, which helps to improve the ECM replication accuracy. Moreover, the surface quality will be improved due to the increased current density. However, this also results in an increase in product. As shown in Figure 3e,f, the maximum local bubble rate is 17.0%, and the maximum temperature rise is 11.9 K. As shown in Figure 4e,f, the maximum average bubble rate is 2.7%, and the maximum average temperature of the section is 303.3 K. These results indicate a disadvantage for processing stability.
In parameter combination 4, the duty cycle and vibration frequency are changed to 1/3 and 40 Hz at the same time. The machining gap is increased due to the increased duty cycle, while the electrolyte flushing is enhanced due to the increased vibration frequency, so the product accumulation is reduced. The maximum local bubble rate is 7.6%, and the maximum temperature rise is 4.9 K. As shown in Figure 4g,h, the maximum average bubble rate is 1.4%, and the maximum average temperature of the section is 296.8 K.
In general, the above simulation results reveal the following phenomena. By comparing parameter combinations 1 and 2, it can be found that as the voltage increases from 20 V to 30 V, the bubble rate increases to 1.20 times, and the temperature rise increases to 1.63 times. Therefore, adjusting the voltage parameters will have a certain influence on the temperature and the bubble rate, and the influence on the temperature rise will be greater than that of the bubble rate. By comparing parameter combinations 1 and 3, it can be found that as the feed rate increases from 0.25 mm/min to 0.35 mm/min, the bubble rate increases to 1.35 times, and the temperature rise increases to 1.38 times. Therefore, adjusting the feed rate will have an approximate effect on the temperature and the bubble rate. Considering that both the bubble rate and temperature rise will have an effect on the machining results, the influence of voltage and feed speed on the machining results is comparable. By comparing parameter combinations 1 and 4, it can be found that by adjusting the duty cycle and frequency, the bubble rate in parameter combination 4 decreases to 60% of that in parameter combination 1, while the temperature rise in parameter combination 4 decreases to 57% of that in parameter combination 1. Therefore, the effect of duty cycle and frequency on the machining process is also critical.
If the pulse width is increased at the same frequency, the situation will effectively be the same as increasing the peak voltage. Thus, this condition is not analyzed specifically. It can be seen that the feed rate, pulse voltage, duty cycle, and tool vibration frequency have different effects on the accumulation of products in the machining gap, which will influence the machining accuracy and surface quality [23,24]. Therefore, to further analyze the influence of the four parameters of VPECM, orthogonal experiments with the factors of peak voltage, feed rate, duty cycle, and tool vibration frequency were designed and carried out.

3. Experiments

3.1. Expreimental Equipment

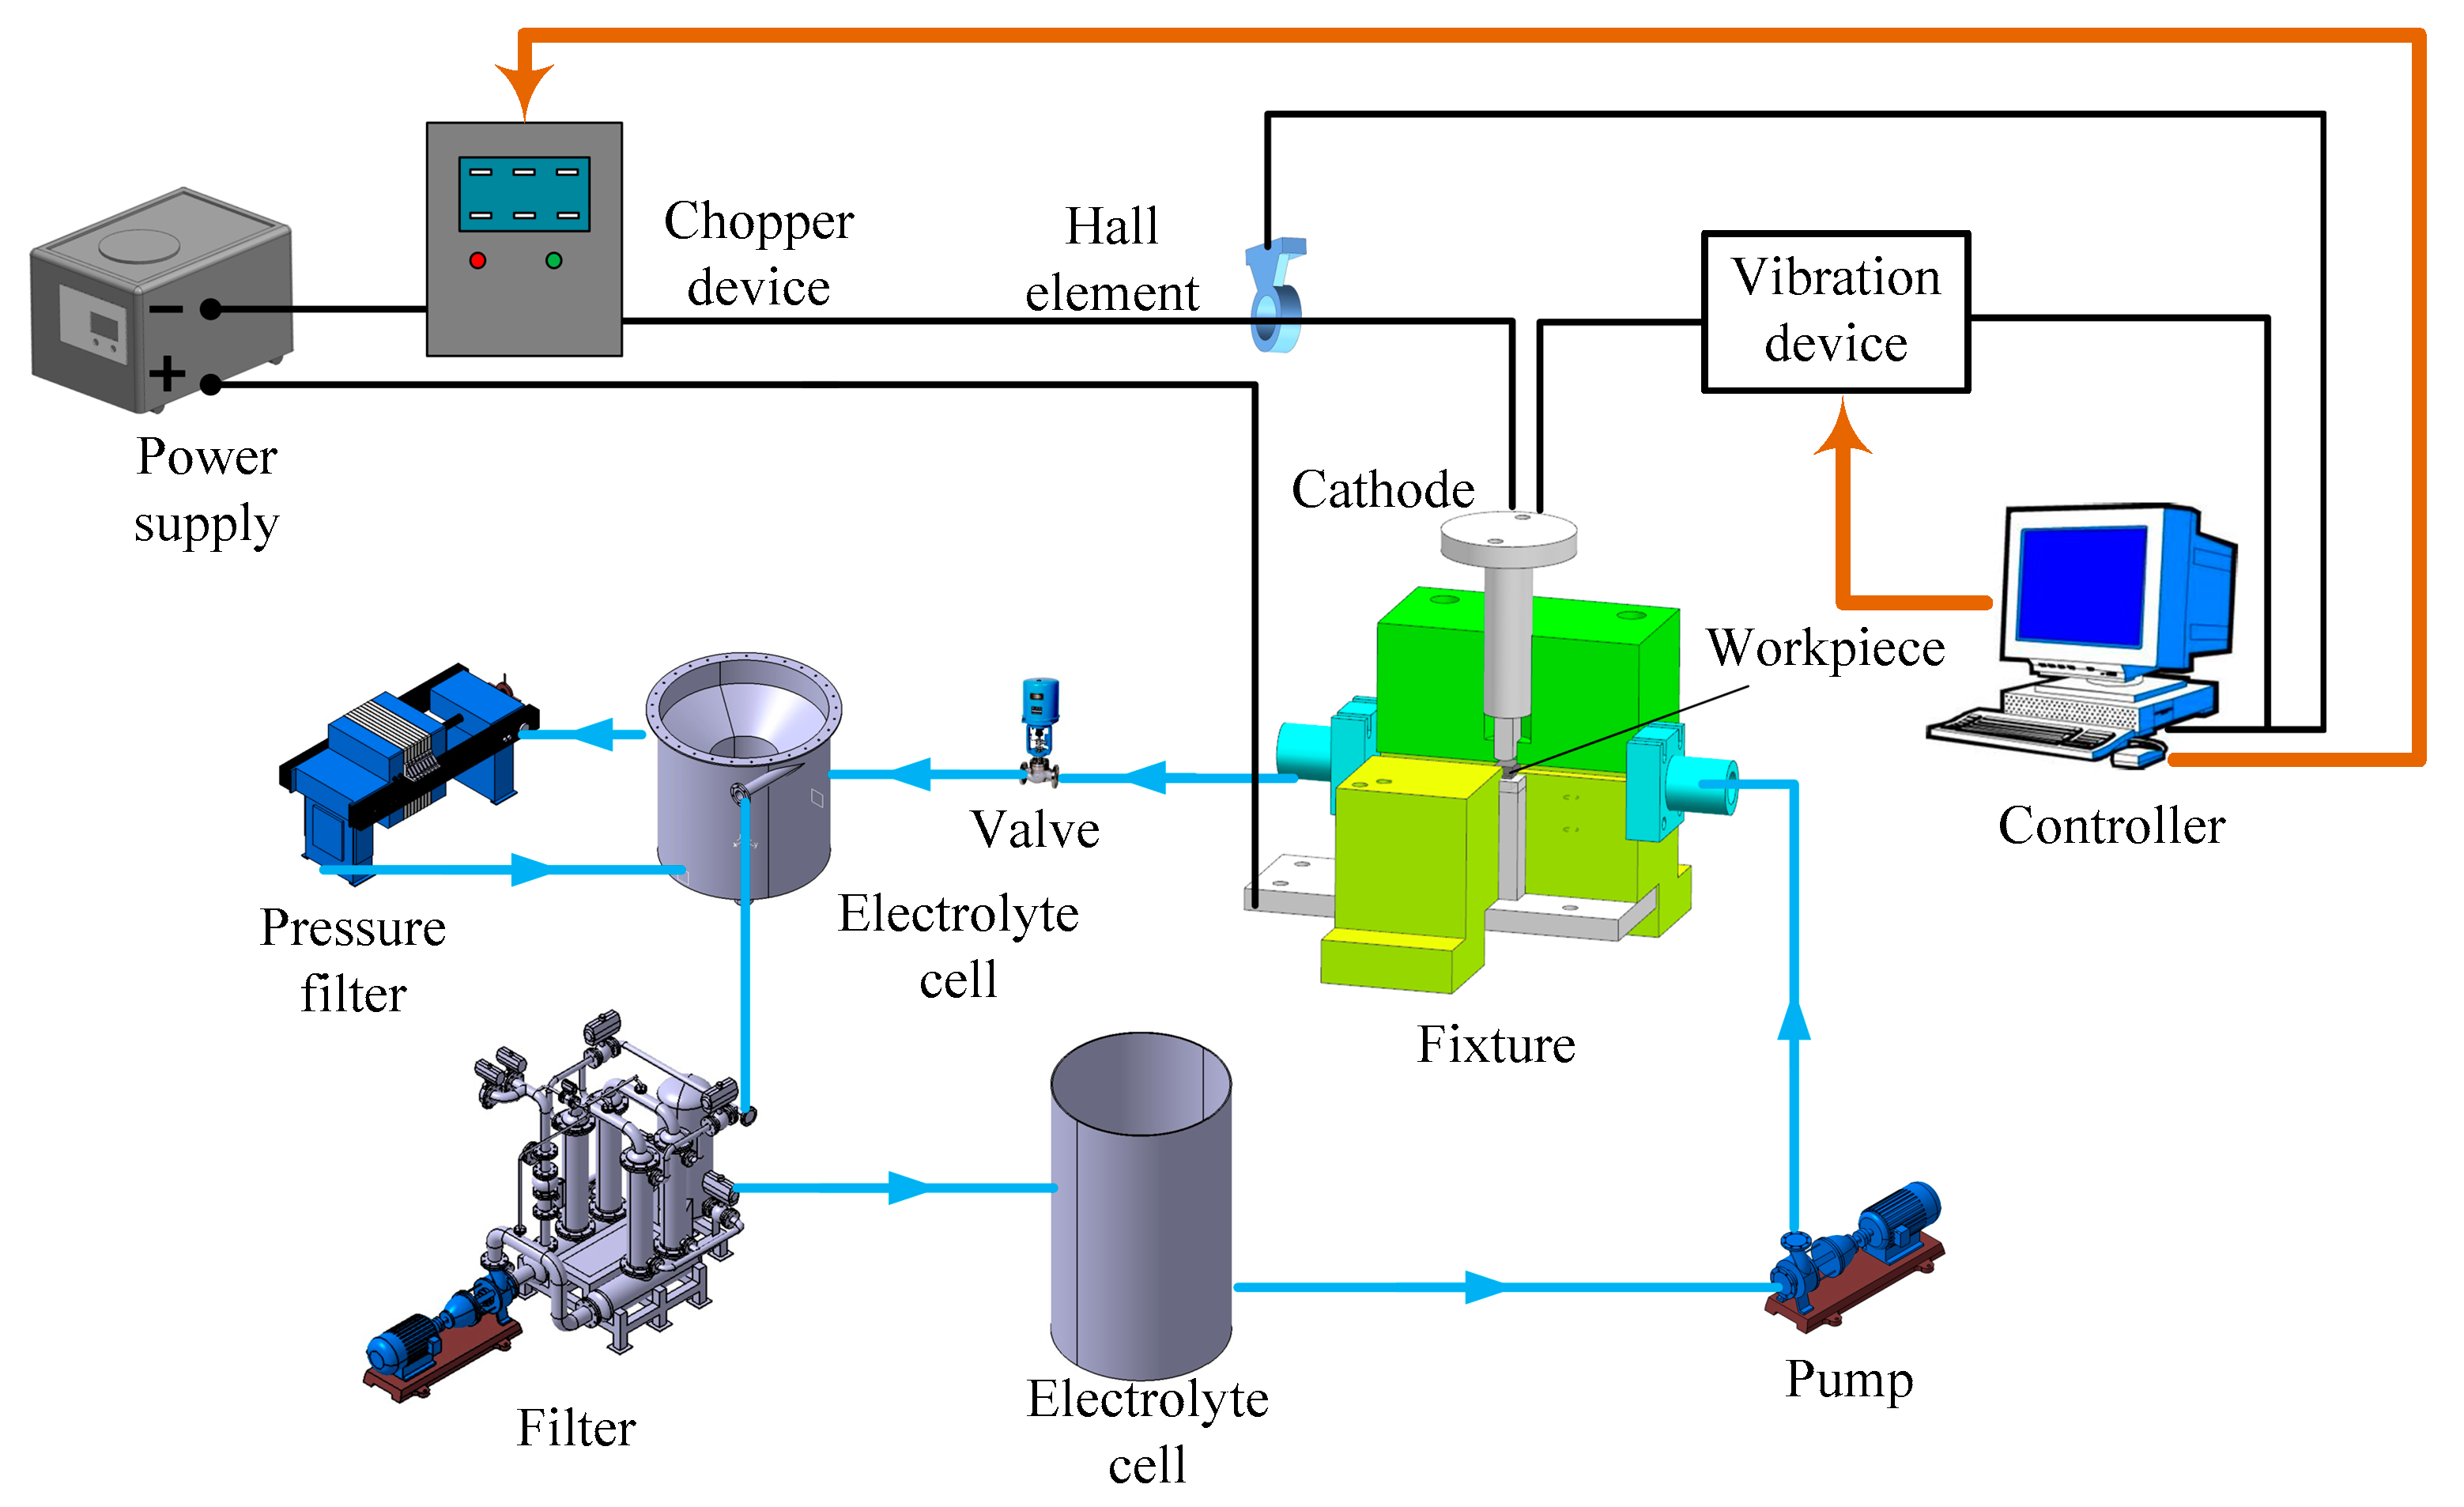
The equipment system of the orthogonal experiments is shown in Figure 5. The cathode tool was connected to the vibrating device with a 0.3-mm-amplitude feeding system and the negative pole of the power supply. There was a chopper device between the power supply and the cathode tool. The workpiece was installed in the fixture and connected to the positive pole of the power supply. High-speed and high-pressure electrolyte was pumped from the electrolyte cell to the inter-electrode gap. In the equipment system, the feeding device, vibrating device, and chopping device were all controlled by a controller. During ECM processing, the controller collected the position feedback signal of the vibration device in real time and controlled whether the chopper was ON or OFF according to the position of the cathode tool. Through this system, the pulse width and the periodic motion of the cathode tool could be accurately matched, and the VPECM mode could be realized.
A geometric model of the cathode tool and γ-TiAl TNM specimen is shown in Figure 6a,b, respectively. The surface of the cathode tool was a circular arc with a radius of 13 mm and a height of 1 mm. The specimen surface that was to be processed had dimensions of 15 mm length × 10 mm width. The chemical compositions of the alloy γ-TiAl TNM are listed in Table 3.

3.2. Orthogonal Experiment

In order to determine the influence of the processing parameters on the VPECM of γ-TiAl TNM, an experiment following a L16 (44) orthogonal array was designed. The experimental parameters are shown in Table 4, and the orthogonal experimental standard parameters are shown in Table 5.
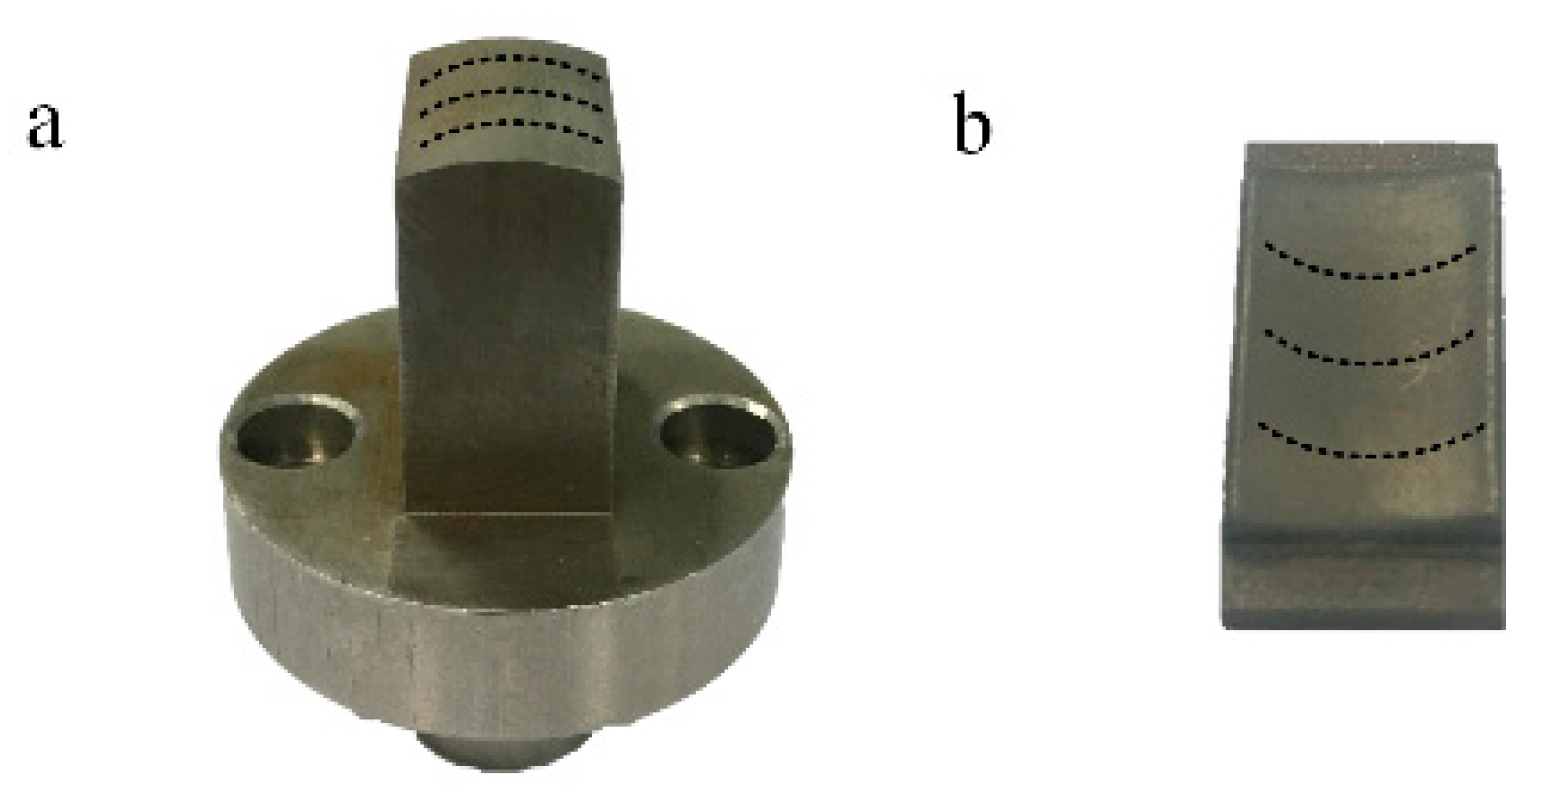
In the orthogonal experiment, the surface roughness, replication accuracy, and average current density in pulse width were used as evaluation indices. The surface roughness (SR) was determined by measuring five different positions of the machined surface and taking an average to ensure the stability and correctness of the measurement. The replication accuracy (RA) was obtained by comparing the profile differences between the tool and workpiece. By measuring contour curves on both the cathode and workpiece, the deviation between the two was taken as the criterion of replication accuracy. Measuring contour curves on both the cathode and workpiece are shown in Figure 7.
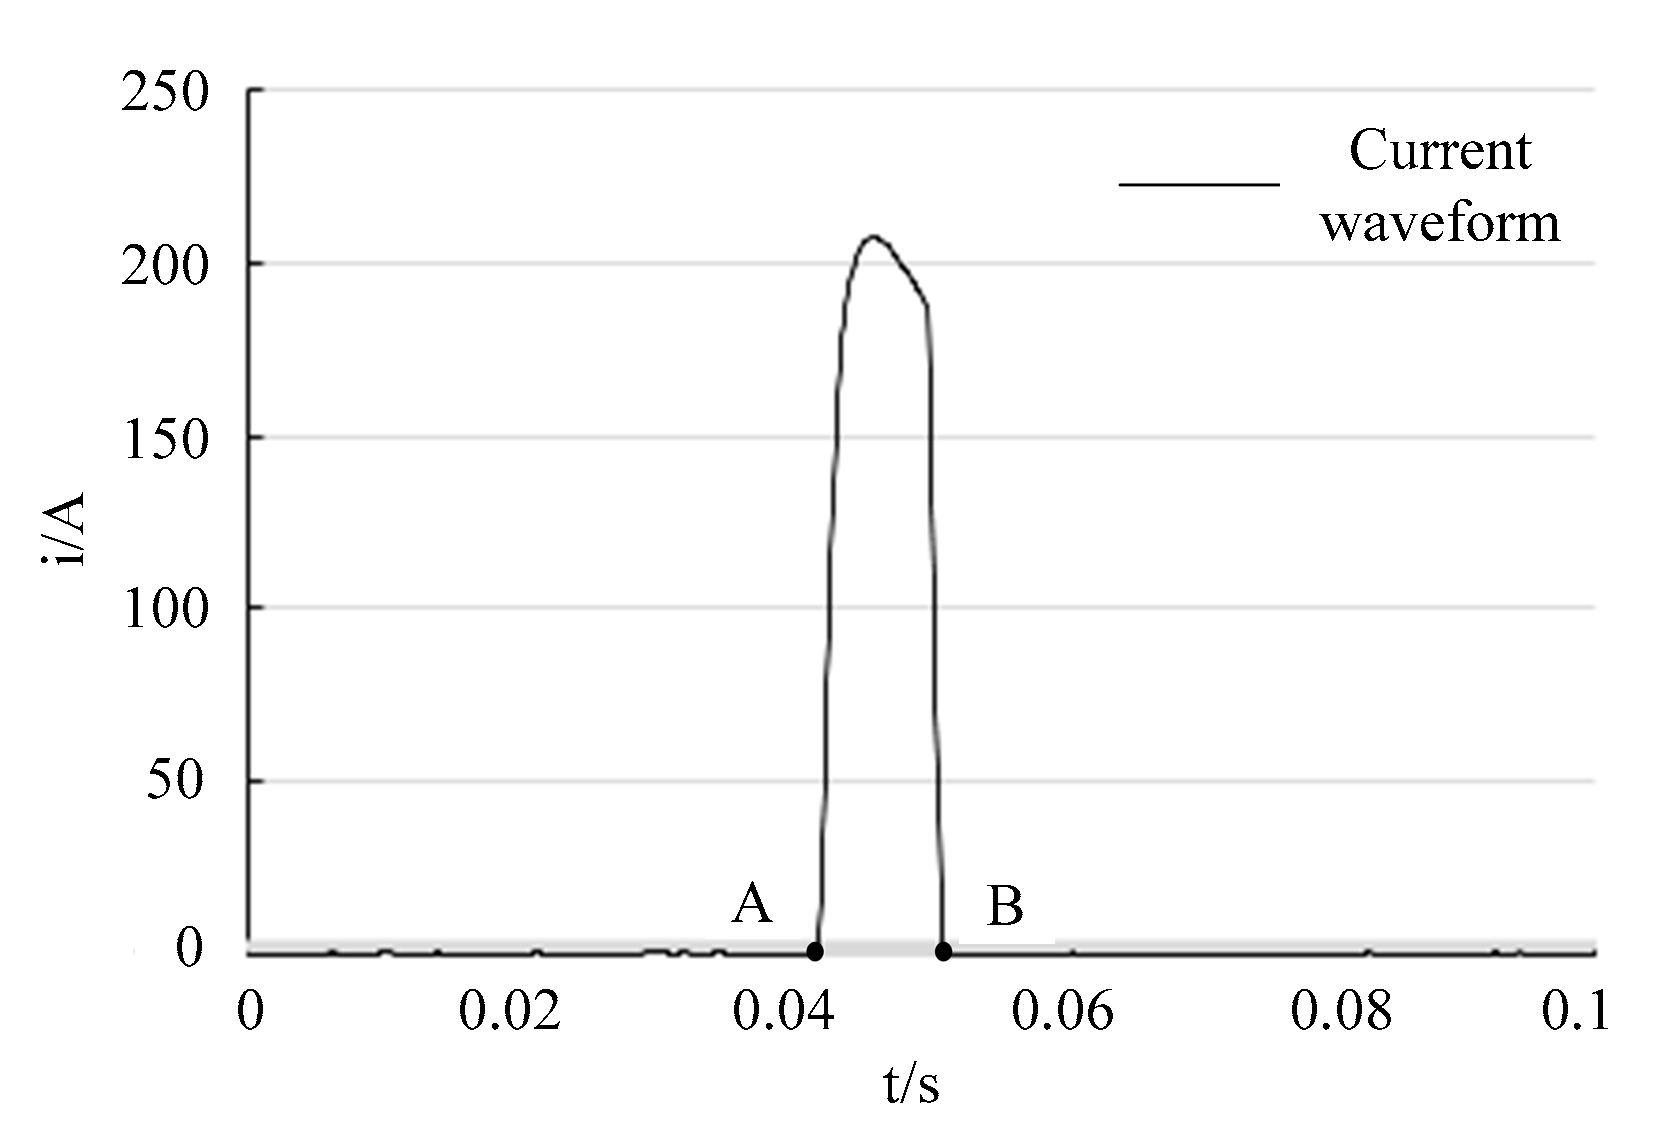
The average current density in pulse width (ACD) is calculated by averaging the current densities of five adjacent pulse widths in the final stage of processing. As shown in Figure 8, the average current density in one pulse width can be obtained by dividing the integral current value between the two points of A, B by the pulse width and the machined surface of the workpiece.

3.3. Experimental Results and Grey Relational Analysis

The experimentally processed samples are shown in Figure 9. The L16 (44) orthogonal array layout and experimental results are shown in Table 6. The experimental results were evaluated based on three processing properties: SR, RA, and ACD. Based on the discrete test result data, it was difficult to determine any connection between the parameters and observed performance. In order to determine these relationships, this paper uses the grey correlation analysis method to analyze the discrete experimental results. The analysis method requires fewer data, has lower data requirements and a simple principle, and is easy to understand and master. In this analysis method, the key is to calculate the degree of relevance, and to study discrete data by the degree of grey correlation. The steps to apply the grey correlation analysis method are as follows.
First, it is inconvenient to compare the experimental data because the different data differ in units. Therefore, the experimental results are normalized in two different ways. If the performance has the characteristic of “the higher, the better”, as seen in the average current density in one pulse width, the values can be calculated by using Equation (3):
x i * ( k ) = x i ( k ) min x i ( k ) max x i ( k ) min x i ( k )
where i = 1,2...n, k = 1,2...m; n is the number of the experimental results type, and m is the number of experiments; xi(k) is the value of the ith experimental result in the kth experiment; xi*(k) is the normalized value obtained from the grey relational analysis; max xi(k) is the maximum value of sequence xi(k); and min xi(k) is the is the minimum value of sequence xi(k).
If the performance has the characteristic of “the lower, the better,” as seen in the surface roughness and replication accuracy, the values can be calculated by using Equation (4):
x i * ( k ) = max x i ( k ) x i ( k ) max x i ( k ) min x i ( k )
The normalized data are shown in Table 7.
Second, grey relational coefficients are determined to reveal the relationship between the reference sequence and comparison sequence, which can be calculated as follows:
Δ 0 i ( k ) = min i   min k | x 0 ( k ) x i * ( k ) |
where x0(k) is the reference sequence x0(k) = 1, k = 1, 2..., m; xi*(k) is the comparison sequence; and Δ0i(k) is the deviation between the reference sequence and the comparison sequence, and
γ i ( k ) = Δ min + ζ × Δ max Δ 0 i ( k ) ζ × Δ max
where γi(k) is the grey relational coefficient; Δmin is the minimum value of sequence Δ0i; Δmax is the maximum value of sequence Δ0i; and ζ is a distinguishing coefficient, which is adjusted according to the practical needs of the system and falls within the range 0 ≤ ζ ≤ 1. In this paper, the value of ζ is 0.5.
Finally, the grey relational grade can be calculated by averaging the grey relational coefficients:
γ ¯ = 1 i i n γ i ( k )
where i is the number of comparison sequences and γ ¯ is the grey relational grade for the kth experiment. The resultant grey relational coefficients (GRCs) and grey relational grades (GRGs) are shown in Table 8.
Based on the data shown in Table 8, the sixth parameters obtained the highest grey relational grade. The parameters of A2B2C1D4 are the best combination of the 16 experiments. However, the number of combinations with four factors and four levels is 256 groups. The orthogonal experiment only provided 16 groups of parameter combinations. In the remaining 240 combination groups, there might be a better parameter combination than A2B2C1D4. Thus, it is necessary to analyze the influence of each parameter on the GRG and to find the best combination.
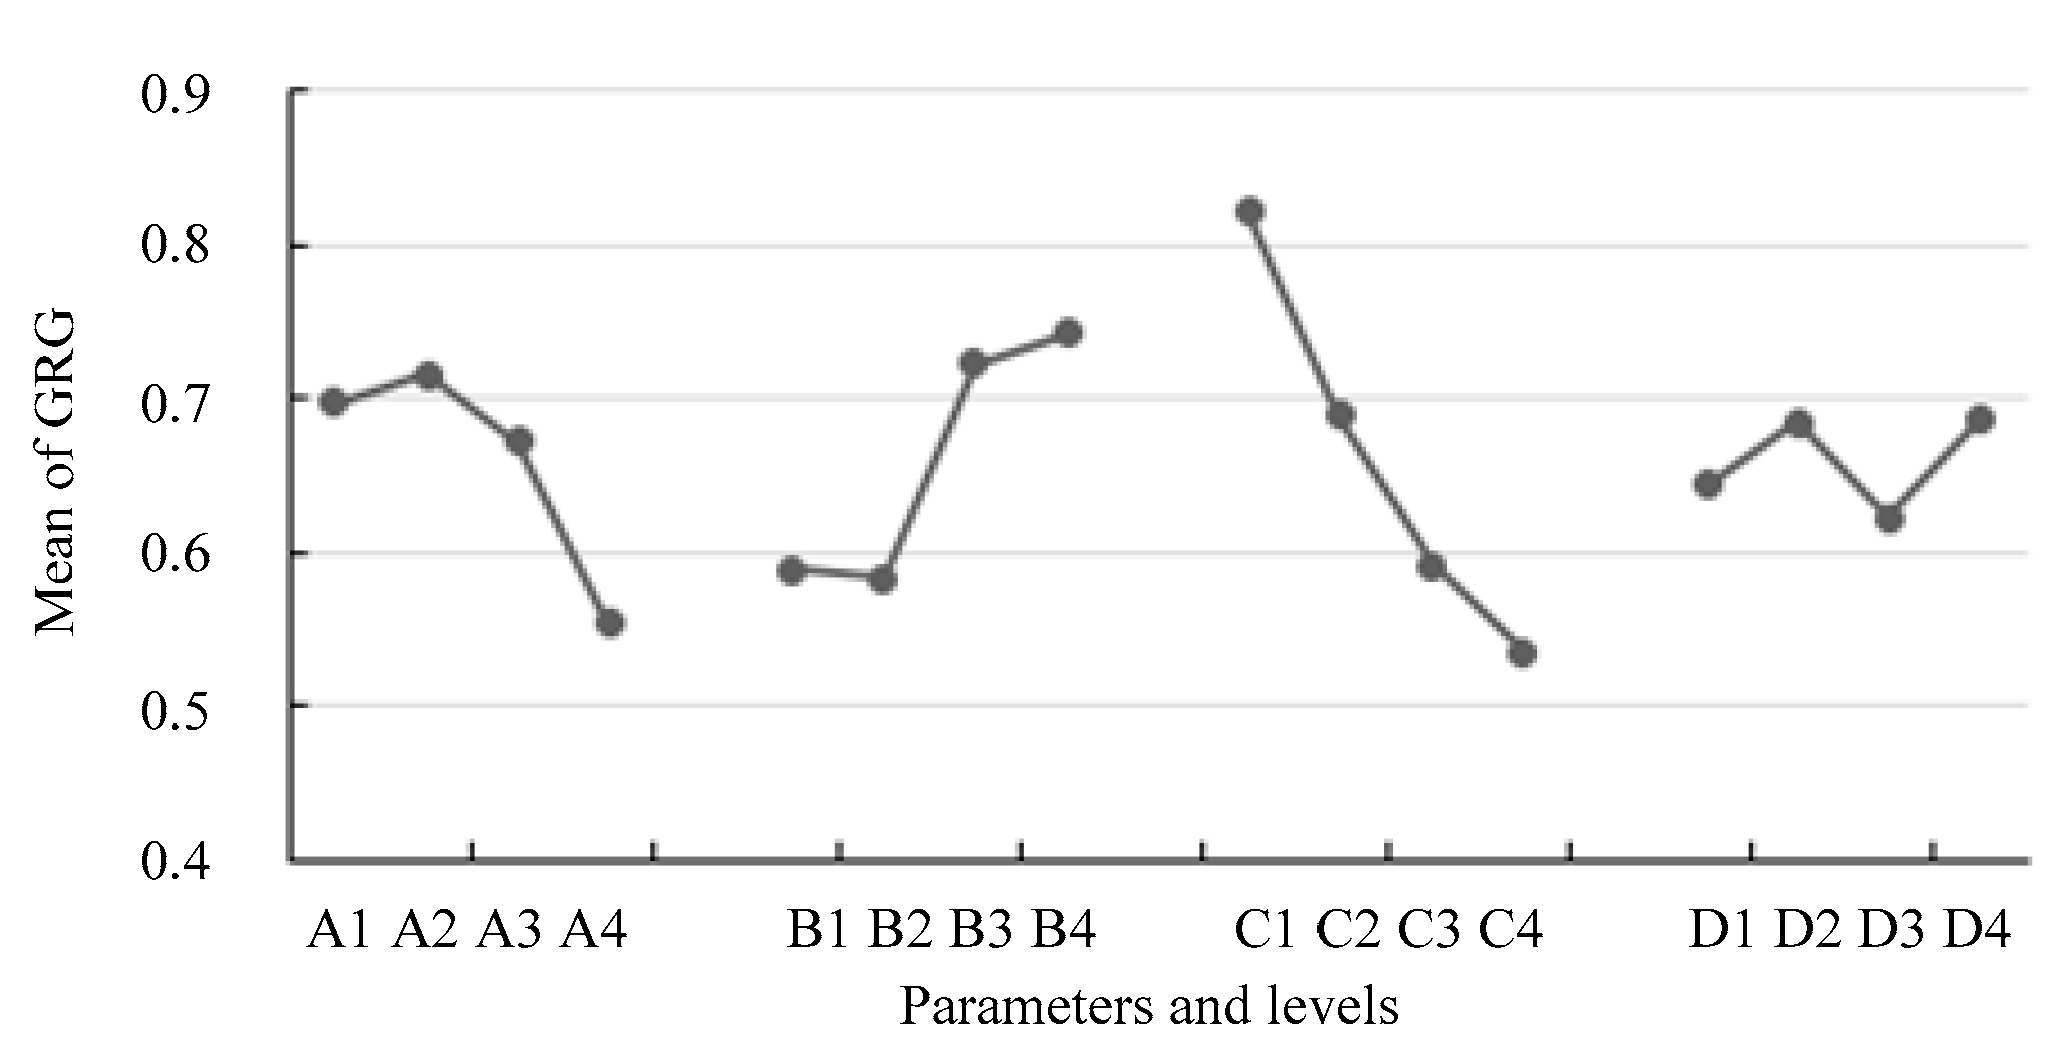
The mean GRG for the applied voltage at level 1 can be calculated using the average GRG of experiments 1, 2, 3, and 4. The mean GRG for the electrode feed rate at level 1 can be calculated using experiments 1, 5, 9, and 13. By using this method, the mean GRG for each parameter at each level is calculated.
From Figure 10, it was found that parameter combination A2B4C1D4 was the best based on the analysis of the mean GRG. Compared with the other three parameters, the duty cycle had the largest range of mean GRG, which showed that the pulse width was the key factor and had the highest relative importance to SR, RA, and ACD in the VPECM of TiAl TNM. By using the optimized parameter combination, namely an applied voltage of 25 V, an electrode feed rate of 0.35 mm/min, a duty cycle of 1/12, and a tool vibration frequency 40 Hz, the SR, RA, and ACD of the machined specimen were Ra 0.35 μm, 0.0175 mm, and 173 A/cm2, respectively.
To validate the results of the grey relational analysis, single-factor experiments were performed. The grey relational analysis above shows that the duty cycle has a relatively large influence on the VPECM results and the vibration frequency has a small influence on the machining results. Therefore, single-factor experiments with these two parameters as variables were carried out to verify the above-mentioned grey correlation analysis results. The basic parameters of the single-factor test are shown in Table 9. The parameters of the single-factor experiment and their values are shown in Table 10.
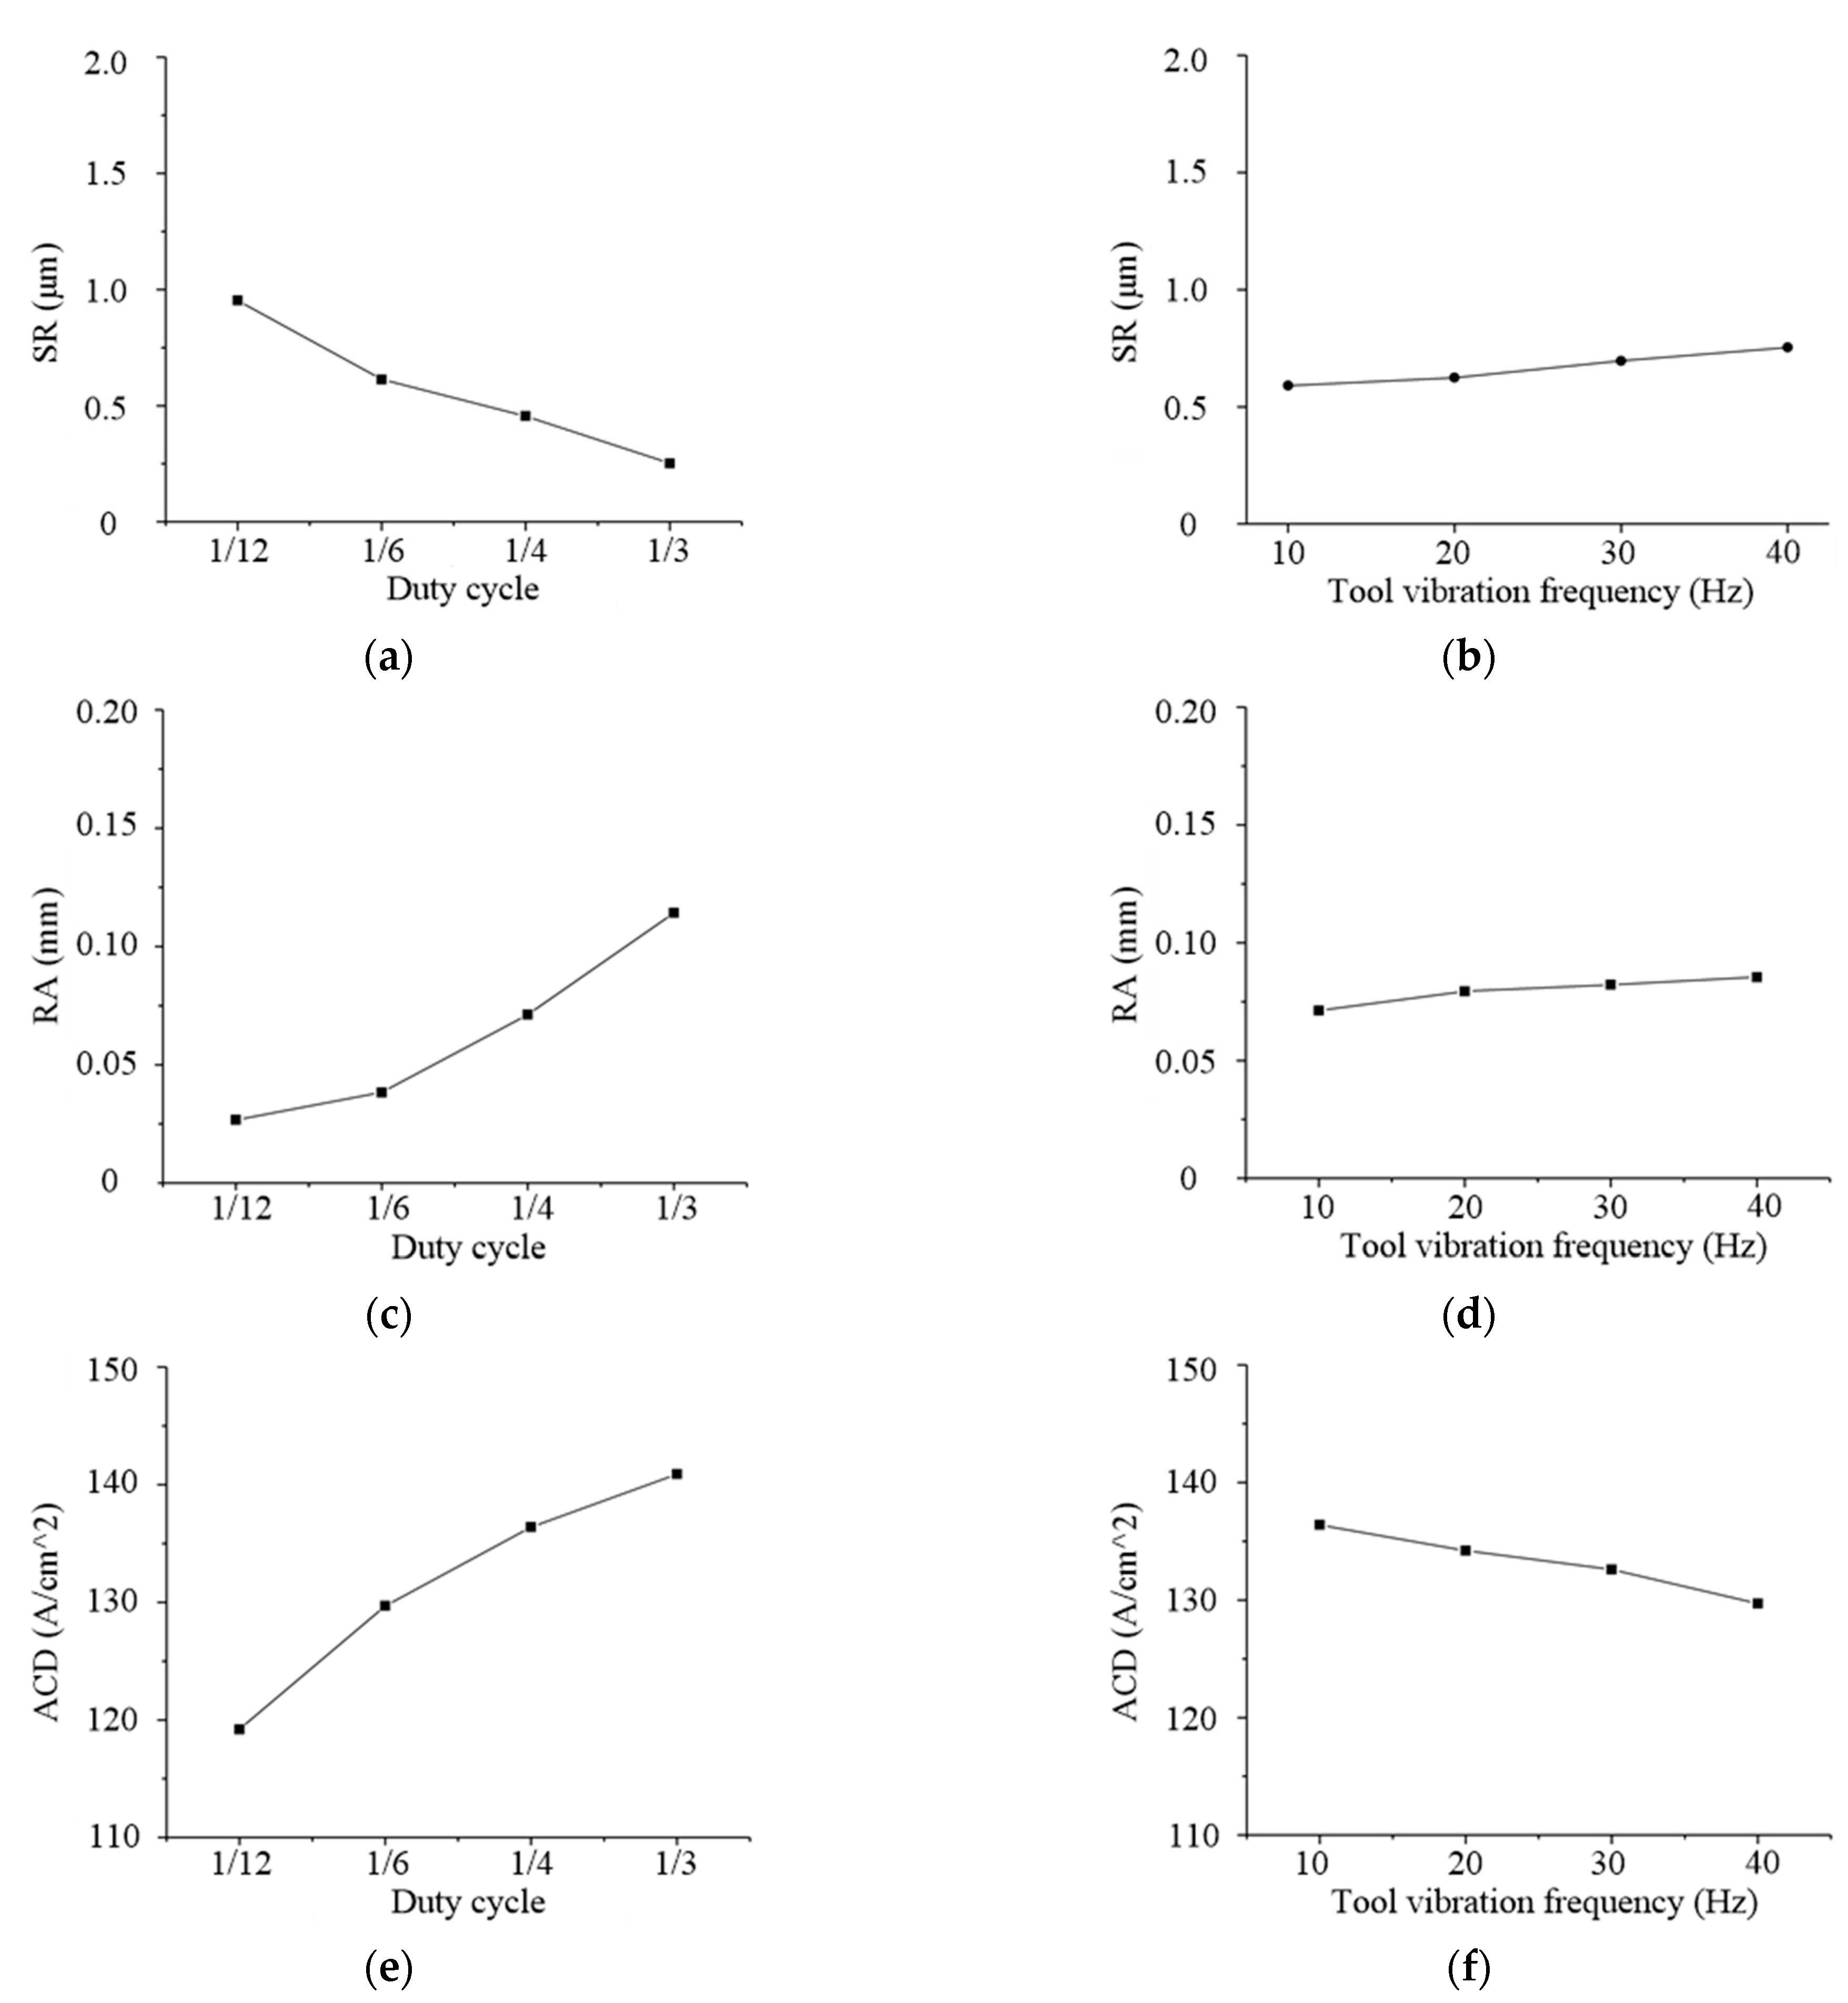
Consistent with the evaluation indicators of the orthogonal experiments, the surface roughness (SR), replication accuracy (RA), and average current density in pulse width (ACD) were selected to analyze the processing results of the single-factor experiments. The results are shown in Figure 11. It can be seen from Figure 11 that with the change in duty cycle, SR, RA, and ACD will also change significantly, while vibration frequency has little influence on SR, RA, and ACD. With the increase in the duty cycle, the average current density in a single pulse width (ACD) increases, the surface roughness (SR) decreases, the replication accuracy (RA) improves, and the surface machining quality of the workpiece is improved. However, as the vibration frequency increases, the average current density in a single pulse width (ACD) decreases slowly, the surface roughness (SR) increases slowly, and the surface replication accuracy (RA) decreases. The trend of the single-factor experiments verifies the results of the grey correlation analysis.

4. Processing Experiment of γ-TiAl TNM Blades

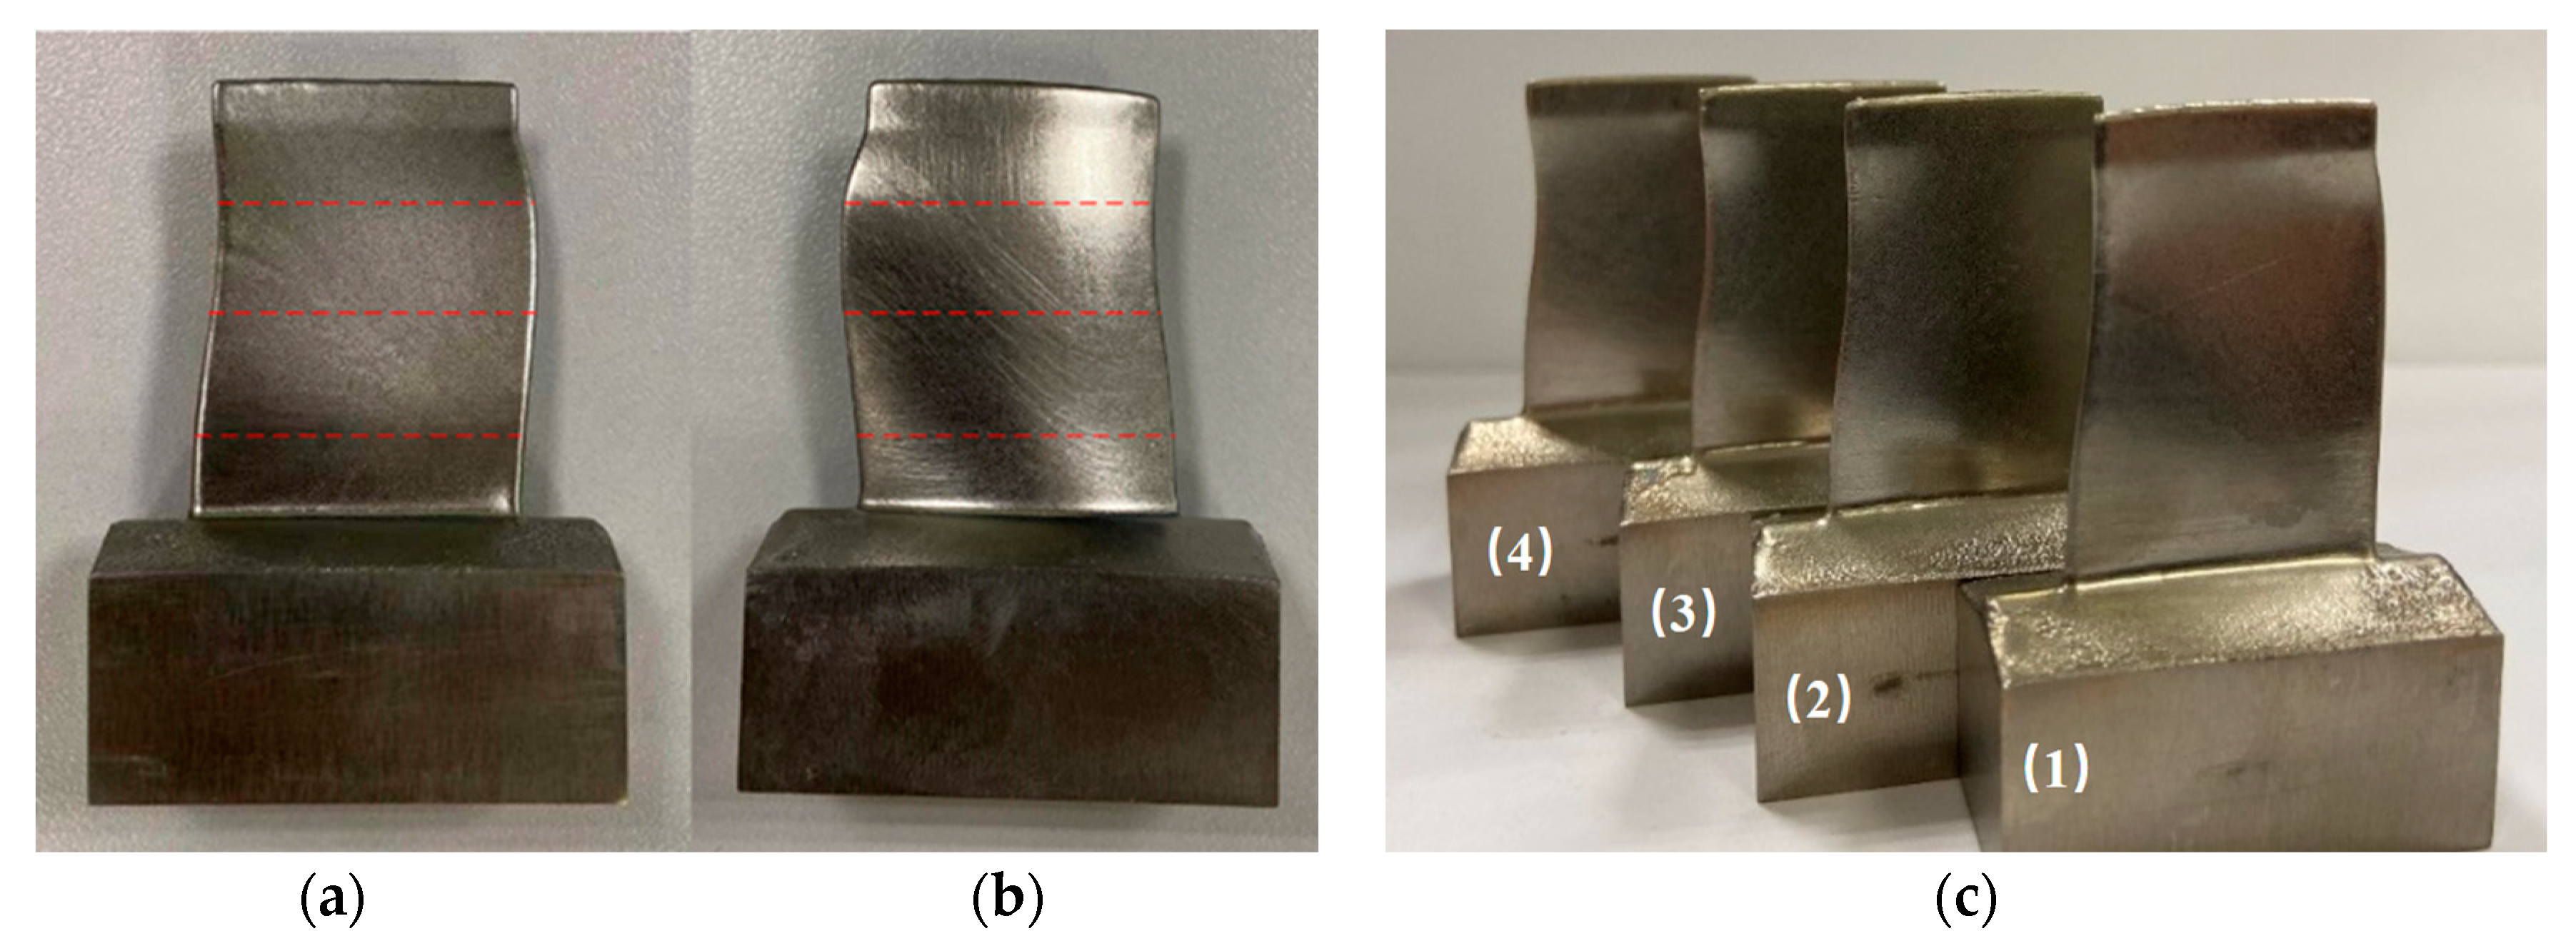
Based on the analysis results of the orthogonal experiments above, in this section, four blade-shaped γ-TiAl TNM alloy specimens were processed using the above-mentioned optimized parameters. In the ECM process, two cathode tools created a vibration-assisted feeding movement facing the basin and back surfaces of the blade, respectively. Both cathode tools had the same feed rate and vibration parameters, and the electrolyte flowed from the leading edge to the trailing edge of the blade. The fixture of the ECM blade is shown in Figure 12, and the machined blade specimens are shown in Figure 13.
By measuring the roughness and averaging five different positions on the basin and back surfaces of the blade, the roughness values of the processed basin and back surface were determined to be Ra 0.295 μm and Ra 0.313 μm. The replication accuracy was obtained by measuring three controlled lines on both the basin and back surface of blade specimen (1), as shown in Figure 13. Comparing the measured results with those of the tool and workpiece, the replication accuracy of the VPECM process was obtained. The measurement results are shown in Figure 14. The tolerance machining error range was −0.019 mm to +0.028 mm.

5. Conclusions

In the VPECM of γ-TiAl TNM, a multi-field simulation of pulse vibration electrolytic machining was carried out, and the voltage, feed rate, frequency, and duty cycle were identified as the main factors affecting the state of the machining gap, which would further affect the machining accuracy and surface quality. Then, orthogonal experiments were carried out to determine the optimized parameter combination and the main factors affecting SR, RA, and ACD. The experimental results were analyzed by the grey relational analysis method. Four process parameters, namely applied voltage, electrode feed rate, duty cycle, and tool vibration frequency, were examined in this experiment. Finally, ECM was used to process γ-TiAl TNM blades using the optimized parameter combination. Two conclusions are made:
  • Based on the grey relational analysis, the optimal parameter combination was determined. The parameters were as follows: an applied voltage of 20 V, an electrode feed rate of 0.3 mm/min, a duty cycle of 1/12, and a tool vibration frequency of 20 Hz. In the four parameters, the duty cycle was the key factor to achieve the highest mean SR, RA, and ACD.
  • Based on the analysis results of the orthogonal experiment, four γ-TiAl TNM blades were processed. The roughness values of the processed basin and back surface were determined to be Ra 0.295 μm and Ra 0.313 μm, and the tolerance machining error range was −0.019 mm to +0.028 mm. The specimens had good machining accuracy and surface quality.

Author Contributions

Conceptualization, J.L.; Data curation, Y.L.; Formal analysis, Z.Z.; Funding acquisition, J.L.; Investigation, H.W.; Writing—original draft, J.L.; Writing—review and editing, J.L. All authors have read and agreed to the published version of the manuscript.

Funding

This work was supported by the National Natural Science Foundation of China (Grant 52075253) and the National Science and Technology Major Project (Grant 2017-VII-0004-0097).

Institutional Review Board Statement

Not applicable.

Informed Consent Statement

Not applicable.

Data Availability Statement

Data sharing not applicable.

Conflicts of Interest

The authors declare no conflict of interest.

References

  1. Liu, J.; Zhu, D.; Zhao, L.; Xu, Z.Y. Experimental investigation on clectrochemical machining of γ-TiAl intermetallic. Procedia CIRP 2015, 35, 20–24. [Google Scholar] [CrossRef]
  2. Klocke, F.; Klink, A.; Veselovac, D.; Aspinwall, D.K.; Soo, S.L.; Schmidt, M.; Schilp, J.; Levy, G.; Kruth, J.-P. Turbo machinery component manufacture by application of electrochemical, electro-physical and photonic processes. CIRP Ann. Manuf. Technol. 2014, 63, 703–726. [Google Scholar] [CrossRef]
  3. Beddoes, J.C.; Wallace, W.; Malherbe, M.C.D. The technology of titanium aluminides for aerospace applications. Adv. Manuf. Process. 1992, 7, 527–559. [Google Scholar] [CrossRef]
  4. Voice, W. The future use of gamma titanium aluminides by Rolls-Royce. Aircr. Eng. Aerosp. Technol. 1999, 71, 337–340. [Google Scholar] [CrossRef]
  5. Helmut, C.; Svea, M. Advanced intermetallic TiAl alloys. Mater. Sci. Forum 2016, 879, 113–118. [Google Scholar]
  6. Wallgram, W.; Schmölzer, T.; Cha, L.; Das, G.; Güther, V.; Clemens, H. Technology and mechanical properties of advanced γ-TiAl based alloys. Int. J. Mater. Res. 2009, 100, 1021–1030. [Google Scholar] [CrossRef]
  7. Chen, Y.Y.; Chen, Y.F.; Kong, F.T.; Xiao, S.L. Fabrication and processing of gamma titanium aluminides—A Review. Mater. Sci. Forum 2010, 638–642, 128–1287. [Google Scholar] [CrossRef]
  8. Aspinwall, D.; Dewes, R.; Mantle, A. The machining of gamma-TiAl intermetallic alloys. CIRP Ann. Manuf. Technol. 2005, 54, 99–104. [Google Scholar] [CrossRef]
  9. Priarone, P.C.; Stefania, R. Drilling experiments on a gamma titanium aluminide obtained via electron beam melting. Int. J. Adv. Manuf. Technol. 2013, 69, 483–490. [Google Scholar] [CrossRef]
  10. Rajurkar, K.P.; Zhu, D.; McGeough, J.A. New development of electrochemical machining. CIRP Ann. Manuf. Technol. 1999, 48, 48–56. [Google Scholar] [CrossRef]
  11. Klocke, F.; Zeis, M.; Klink, A.; Veselovac, D. Technological and economical comparison of roughing strategies via milling, EDM and ECM for titanium- and nickel-based blisks. Procedia CIRP 2012, 2, 98–101. [Google Scholar] [CrossRef]
  12. Clifton, D.; Mount, A.R.; Jardine, D.J.; Roth, R. Electrochemical machining of gamma titanium aluminide intermetallics. J. Mater. Process. Technol. 2001, 108, 338–348. [Google Scholar] [CrossRef]
  13. Klocke, F.; Herrig, T.; Zeis, M.; Klink, A. Experimental research on the electrochemical machinability of selected γ-TiAl alloys for the manufacture of future aero engine components. Procedia CIRP 2015, 35, 50–54. [Google Scholar] [CrossRef]
  14. Wang, Y.D.; Xu, Z.Y.; Zhang, A. Anodic characteristics and electrochemical machining of two typical gamma-TiAl alloys and its quantitative dissolution model in NaNO3 solution. Electrochim. Acta 2020, 331, 135429. [Google Scholar] [CrossRef]
  15. Wang, H.; Liu, J.; Gu, D.W.; Zhu, D. Electrochemical dissolution behavior of Ti-48A1-2Nb-2Cr in NaNO3 and NaCl electrolytes. Int. J. Electrochem. Sci. 2020, 15, 9313–9324. [Google Scholar] [CrossRef]
  16. Liu, J.; Wang, H.; Zhu, D. Electrochemical machining of γ-TiAl intermetallic blades by using the stainless steel anti-copied tool electrodes. Procedia CIRP 2018, 68, 757–761. [Google Scholar] [CrossRef]
  17. Feng, Z.; Granda, E.; Hung, W. Experimental investigation of vibration-assisted pulsed electrochemical machining. Procedia Manuf. 2016, 5, 798–814. [Google Scholar] [CrossRef]
  18. Xu, Z.Y.; Wang, Y.D. Electrochemical machining of complex components of aero-engines: Developments, trends, and technological advances. Chin. J. Aeronaut. 2019, 34, 28–53. [Google Scholar] [CrossRef]
  19. Schaarschmidt, I.; Zinecker, M.; Hackert-Oschätzchen, M.; Meichsner, G.; Schubert, A. Multiscale multiphysics simulation of a pulsed electrochemical machining process with oscillating cathode for microstructuring of impact extrusion punches. Procedia CIRP 2017, 58, 257–262. [Google Scholar] [CrossRef]
  20. Zhao, J.S.; Feng, W.; Zhang, X.; Yang, Z.; Lv, Y.; He, Y. Experimental research on improving ECM accuracy and stability for diamond-hole grilles. Procedia CIRP 2018, 68, 684–689. [Google Scholar] [CrossRef]
  21. Wang, H.; Zhu, D.; Liu, J. Improving the accuracy of the blade leading/trailing edges by electrochemical machining with tangential feeding. CIRP Ann. 2019, 68, 165–168. [Google Scholar] [CrossRef]
  22. Zong, Y.W.; Liu, J.; Zhu, D. Study of voltage regulation strategy in electrochemical machining of blisk channels using tube electrodes. Int. J. Adv. Manuf. Technol. 2021, 114, 3489–3501. [Google Scholar] [CrossRef]
  23. Tomoyuki, S.; Masanori, K. Study on influences of bubbles on ECM gap phenomena using transparent electrode. CIRP Ann. 2016, 65, 225–228. [Google Scholar]
  24. Hackert-Oschätzchen, M.; Paul, R.; Kowalick, M.; Kuhn, D.; Meichsner, G.; Zinecker, M.; Schubert, A. Characterization of an Electrochemical Machining Process for Precise Internal Geometries by Multiphysics Simulation. Procedia CIRP 2017, 58, 175–180. [Google Scholar] [CrossRef]
Figure 1. Principle of pulse vibration ECM.
Applsci 12 08042 g001
Figure 2. Two-dimensional multi-field simulation model.
Applsci 12 08042 g002
Figure 3. Nephograms of the bubble rate and temperature of four parameter combinations.
Applsci 12 08042 g003
Figure 4. Graph of bubble rate and temperature in machining gap versus time for four parameter combinations.
Applsci 12 08042 g004aApplsci 12 08042 g004b
Figure 5. Experimental system diagram.
Applsci 12 08042 g005
Figure 6. Geometric models of (a) cathode tool and (b) γ-TiAl specimen.
Applsci 12 08042 g006
Figure 7. Contour curves on (a) cathode tool and (b) machined specimen.
Applsci 12 08042 g007
Figure 8. Current waveform.
Applsci 12 08042 g008
Figure 9. Machined specimens.
Applsci 12 08042 g009
Figure 10. Mean GRGs of parameters.
Applsci 12 08042 g010
Figure 11. The results of the single-factor experiments. (a) SR varies with duty cycle; (b) SR varies with tool vibration frequency; (c) RA varies with duty cycle; (d) RA varies with tool vibration frequency; (e) ACD varies with duty cycle; (f) ACD varies with tool vibration frequency.
Applsci 12 08042 g011
Figure 12. The fixture of blade processing.
Applsci 12 08042 g012
Figure 13. Machined blade specimens: (a) basin surface, (b) back surface, and (c) γ-TiAl TNM blades.
Applsci 12 08042 g013
Figure 14. Blade replication accuracy measurement results of (a) basin surface and (b) back surface.
Applsci 12 08042 g014
Table 1. Selected parameter combinations of the multi-field simulation.
Parameters1234
Applied peak voltage (V)20302020
Feed rate (mm/min)0.250.250.350.25
Duty cycle1/61/61/61/3
Vibration frequency (Hz)20202040
Table 2. Other general parameters of the multi-field simulation.
ParametersSimulation Parameters
Vibration amplitude (mm)0.3
Electrolyte temperature (°C)30
Electrolyte200 g/L NaNO3
Inlet pressure (MPa)0.8
Outlet pressure (MPa)0.2
Table 3. The compositions of the alloy γ-TiAl TNM.
CompositionTiAlNbMoBFeCNHO
At.%Bal.43.34.020.960.210.030.020.030.110.16
Table 4. L16 (44) orthogonal experiment plan.
SymbolParametersLevels
1234
AApplied voltage (V)15202530
BFeed rate (mm/min)0.20.250.30.35
CDuty cycle1/121/61/41/3
DTool vibration frequency (Hz)10203040
Table 5. Orthogonal experimental standard parameters.
Parameter TypeProcessing Parameters
Feed length2 mm
Initial gap0.15 mm
Electrolyte temperature30 °C
Electrolyte200 g/L NaNO3
Inlet pressure0.8 MPa
Table 6. Orthogonal array layout and experimental results.
ExperimentParametersObserved
Performance
ABCDSR
(μm)
RA
(mm)
ACD
(A/cm2)
111110.590.0233117.8
212221.430.030472.8
313330.270.031258.5
414440.520.040551.6
521230.580.065358.9
622140.230.0187136.2
723410.770.072948.6
824320.210.030670.7
931340.700.172243.7
1032430.860.258240.1
1133120.630.0208153
1234210.160.0226109.1
1341420.860.188235.9
1442312.680.185254.9
1543240.700.040191.4
1644130.540.037582.4
Table 7. Normalized data results.
No.Normalized Value for SRNormalized Value for RANormalized Value for ACD
10.82940.98080.6994
20.49600.95110.3151
30.95630.94780.1930
40.85710.90900.1341
50.83330.80540.1964
60.97221.00000.8565
70.75790.77370.1085
80.98020.95030.2972
90.78570.35910.0666
100.72220.00000.0359
110.81350.99121.0000
121.00000.98370.6251
130.72220.29230.0000
140.00000.30480.1623
150.78570.91060.4740
160.84920.92150.3971
Table 8. Results of GRC and GRG.
No.Grey Relational CoefficientsGrey Relational Grades
SRRAACDAverage ValueOrder
10.74560.96300.62450.77774
20.49800.91090.42200.610311
30.91960.90550.38260.73596
40.77770.84600.36610.66339
50.75000.71980.38360.617810
60.94731.00000.77700.90811
70.67380.68840.35930.573812
80.96190.90960.41570.76245
90.70000.43830.34880.495713
100.64280.33330.34150.439215
110.72830.98271.00000.90372
121.00000.96840.57150.84663
130.64280.41400.33330.463414
140.33330.41830.37380.375116
150.70000.84830.48730.67858
160.76830.86430.45330.69537
Table 9. Basic parameters of the single-factor experiments.
Parameter TypeProcessing Parameters
Applied voltage (V)20
Feed rate (mm/min)0.2
Duty cycle1/4
Tool vibration frequency (Hz)10
Electrolyte temperature30 °C
Inlet pressure0.8 MPa
Table 10. Parameter values of single-factor experiments.
ParametersParameter Values
1234
Duty cycle1/121/61/41/3
Tool vibration frequency (Hz)10203040
Publisher’s Note: MDPI stays neutral with regard to jurisdictional claims in published maps and institutional affiliations.