Review

Comparison of Functional Connectivity Analysis Methods in Alzheimer’s Disease

Department of Electronic Engineering, Daegu University, 201 Daegudae-ro, Jillyang-eup, Gyeongsan-si 38453, Gyeongsangbuk-do, Korea
*
Author to whom correspondence should be addressed.
Appl. Sci. 2022, 12(16), 8096; https://doi.org/10.3390/app12168096
Submission received: 1 July 2022 / Revised: 10 August 2022 / Accepted: 10 August 2022 / Published: 12 August 2022
(This article belongs to the Special Issue Multimodal Imaging in Neurosciences)

Abstract

:
This paper intends to present a comparative review of functional connectivity (FC) analysis methods and their computational methodologies measured through functional magnetic resonance imaging (fMRI). The fMRI technique has been established as a powerful tool for identifying and visualizing the active brain areas in response to certain stimuli and tasks. FC is a metric for the interaction between various brain regions. The synchronization of the functional activity between non-adjacent brain regions is reflected in FC, and changes in FC occur earlier than changes in the physical brain structure. The functionally active brain area can be identified by detecting signal changes caused by blood oxygen levels during the corresponding neuronal activity. The fMRI technique can assess these physiological signals, which can be utilized for further study and research. FC is therefore crucial in identifying a variety of brain disorders, including Alzheimer’s (AD). AD is a neurodegenerative disease that primarily affects the elderly, and previous studies have reported that patients with AD seem to have impaired FC between different brain areas. Henceforth, AD patients’ clinical diagnosis and prediction depend significantly on the practical and precise classification of symptoms using fMRI. We have first reviewed the existing FC analysis methods, such as model/seed-based methods and data-driven methods, and further compared them based on the reduced FC observed in AD patients compared to normal controls (NC). The goal is to provide an overview of the benefits, challenges, and limitations of FC analysis methods in the context of medical imaging for AD.

1. Introduction

Functional magnetic resonance imaging (fMRI) is an effective tool for mapping brain functions and their analysis. Several functional neuroimaging techniques have been introduced, including positron emission tomography (PET), magnetoencephalography (MEG), local field potential (LFP), and electroencephalography (EEG). These techniques measure regional interactions between brain regions at the macro level, which is essential for investigating various brain diseases [1]. The fMRI provides higher spatial and temporal resolution as compared with other techniques. In addition, the specialty of fMRI over other techniques is to allow the investigation of the brain without adding ionizing radiation or radiopharmaceutical injections used in many other techniques such as Positron Emission Tomography (PET), computed tomography (CT or CAT) scan, X-ray imaging, and angiography. The fMRI study can refer to the comparative analysis of increased blood flow during neural activity with basal state activity. The fMRI measures blood oxygen level-dependent (BOLD) signal to find a temporal correlation between multiple brain regions defined as FC. Many studies have found that multiple intrinsic activities happen in the brain at rest. These activities have a low frequency which was first discovered in 1995 [2]. The analysis of the spontaneous BOLD signal when there is no explicit task or the brain is at rest is called resting-state fMRI (rs-fMRI). When the modulation in the BOLD signal is analyzed during a particular activity or given task, such as eye-blinking, speaking, memorizing, finger or hand movement, etc. is called task-based fMRI (ts-fMRI).
Sometimes, resting-state brain activity is far more significant than task-based activity in total brain functioning because separate task-based analyses require different protocols and experiments, such as motor function and language function analysis. Therefore, in this study, we solely focus on rs-fMRI analysis methods. The analysis of the undirected association of two or more functionally connected brain regions has become a cutting-edge research topic in the neuroimaging field. This paper focuses on methods for assessing the FC through correlations with BOLD signals. However, many other approaches utilize another additional component for assessing connectivity.
AD is a kind of brain disease similar to coronary artery disease (CAD) in the heart. It is a degenerative disorder as well, which means it becomes worse with time. AD is believed to begin 20 years or more before visible symptoms develop. Symptoms arise when nerve cells (neurons) in the brain involved in thinking, reasoning, and memory (cognitive function) have been harmed or damaged. One of the known causes of AD is the accumulation of β-amyloid protein between neurons that disrupts cell functions. A brief description of the pathophysiology behind this process is shown in Section 2. In neuroimaging, AD pathogenesis can analyze utilizing magnetic resonance imaging (MRI) to examine structural changes, fMRI to assess functional activation patterns, and PET can investigate functional and metabolic alterations utilizing radiotracers. Multi-modal neuroimaging seems to be the most successful method, but it is also the most expensive one. In past years, non-invasive and non-irradiating fMRI has become a popular tool in investigations of mild cognitive impairment and AD [3]. The FC, temporal and spatial connections between distinct brain areas and connectivity-based brain disorders may be investigated using the fMRI technique. The fMRI approach is a reliable tool for studying FC, temporal and spatial correlations among brain areas, and connectivity-based brain disorders such as AD, schizophrenia, bipolar disorder, traumatic brain injury, depression, addiction, etc.
There are several prominent methods of assessing FC (using the BOLD signal): seed-based, decomposition methods: principal component analysis (PCA) and independent components analysis (ICA), graph theory, etc. [4]. Another assumption to differentiate these methods is model-based and data-driven (Figure 1). Model/seed-based methods, for example, coherence and cross-correlation analysis and statistical parametric mapping, require prior knowledge of processing and are easy to implement hence widely used in neuroimaging [5]. Data-driven methods require no prior knowledge and investigate the multivariate structure of data using decomposition and clustering [6]. Recently, a wide variety of different machine learning algorithms for rs-fMRI analysis have been focused on unsupervised learning approaches.

1.1. Model/Seed Based Methods

In seed-based methods, seed voxels or regions of interest (ROI) are chosen. Further, their correlation with the rest of the brain’s ROIs is calculated by measuring spontaneous BOLD signals. The ROIs that have a strong positive correlation with the seed are referred to as functionally coupled ROIs [7]. A study utilizing two seeds positioned in the posterior cingulate cortex (PCC) and ventromedial prefrontal cortex (vmPFC) demonstrated that age-related alterations in the default mode network (DMN) were observed [8]. A decrease in FC in subjects with AD has been found by placing the seed in bilateral hippocampi [9,10]. However, it is quite usual for multiple seeds to result in different connectivity detection. Furthermore, the prior knowledge criteria constrain the study of possible FC.

1.2. Data Driven Methods

To overcome the flaws of model/seed-based methods, certain other methods that are independent of prior knowledge or assumed models have been introduced [11]. Based on decomposition techniques, PCA and ICA are widely used in FC analysis. These types attempt to represent the original fMRI dataset as a base vector linear combination (in PCA) or statistically independent component (in ICA). Instead, the complete four-dimensional fMRI data may be divided into time courses and related spatial maps that describe the temporal and spatial features of the data’s components [12]. Using ICA, a decrease in FC has been found in older subjects while examining the components in DMN (PCC and anterior cingulate cortex (ACC)) [13]. A significant difference in the connectivity of patterns between AD patients and mild cognitive impairment (MCI) subject have been found using ICA [14]. However, determining how many data components are decomposed into and how ICNs are differentiated from noise is equally challenging in ICA.
Graph theory is a widely used method to assess the relationships in data [15]. When graph theory is used for FC assessment utilizing fMRI time series, the fMRI data become spatially parceled as per an anatomical map of the brain, and the correlations are calculated across all pairs of activated regions. If the active regions indicate correlations, they are linked together as a network. The group of these regions and their relationships may be represented as a graph with nodes and edges. Both model/seed-based techniques and ICA approaches attempt to collect temporally coherent networks. Graph theory-based methods, by contrast, are more commonly used to explain functional relationships across all the brain nodes (regions). A study focusing on the modularity of functionally active networks shows the topological correlation of regions using graphs and shows the aging effect on FC [16].
The paper is divided into four parts: the first section starts with an introduction to fMRI, its analysis methods, and the role of fMRI in the diagnosis of AD. The second section explains AD pathophysiology and its effect on FC in the brain. The third section discusses the conceptual details of methods for FC assessment, such as their principles, as well as their challenges and limitations with experimental results. Finally, the fourth section presents the conclusion, which points out the significance of FC analysis in fMRI study.

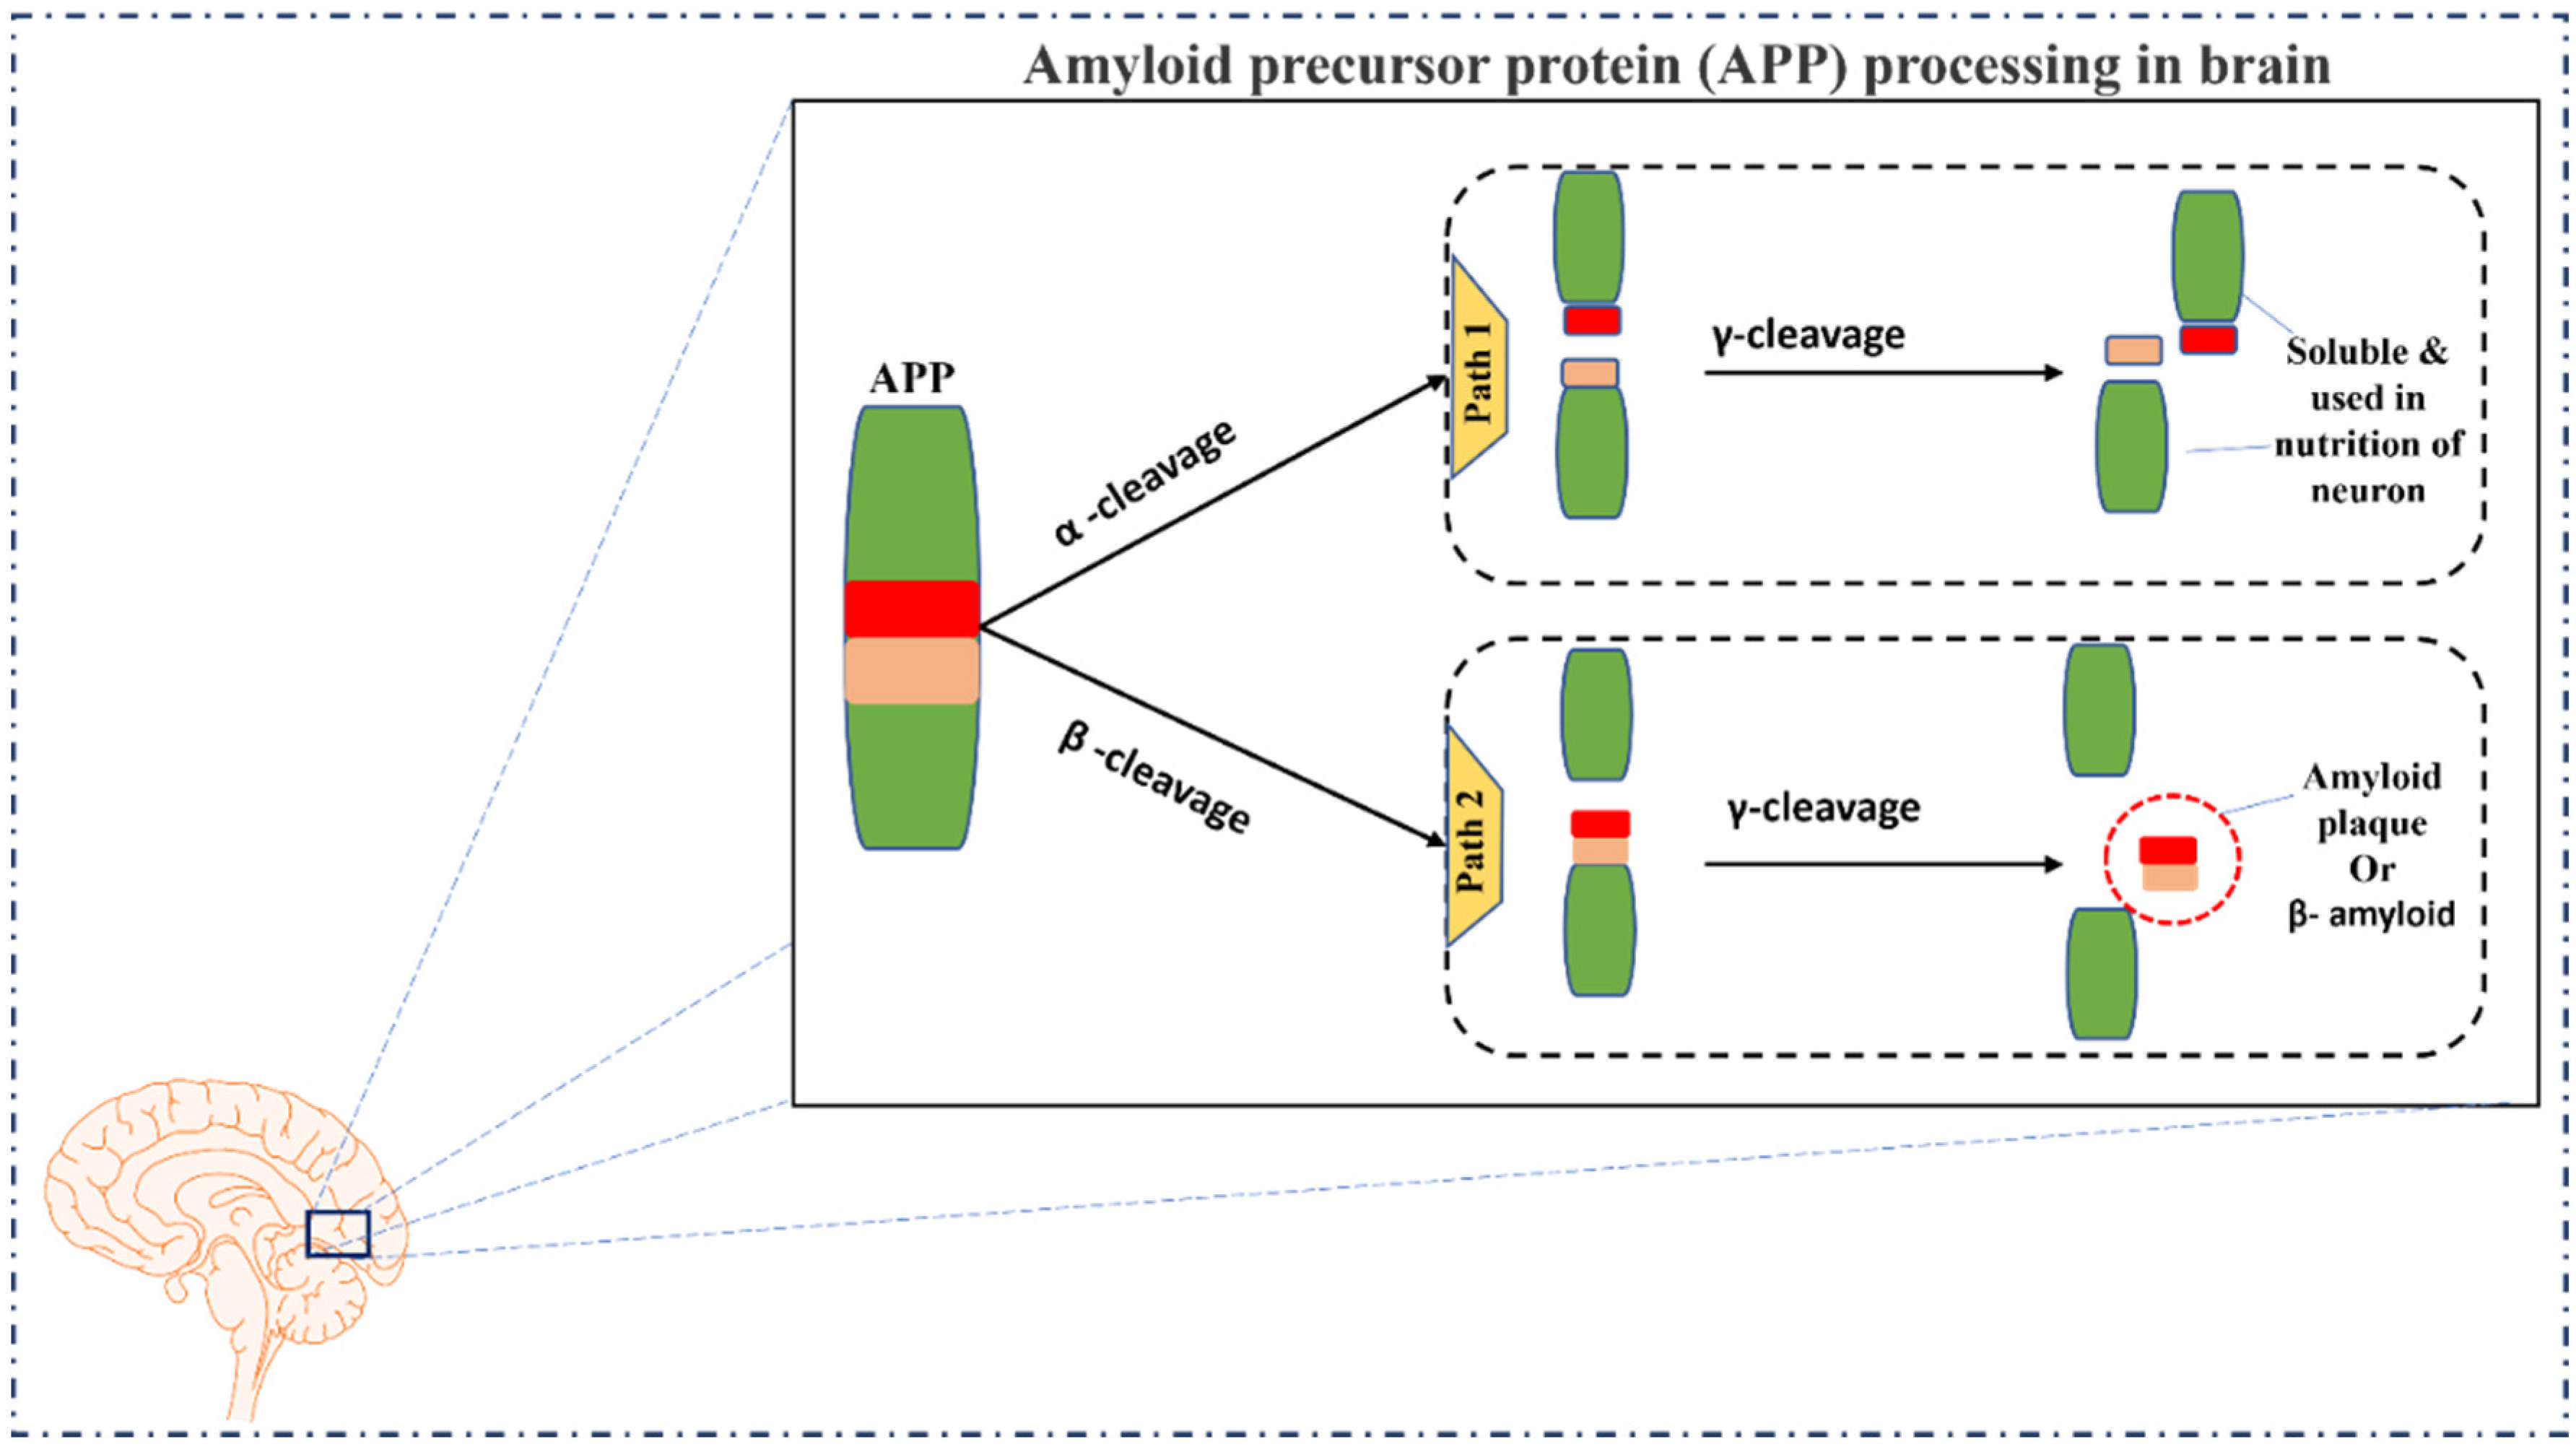
2. The Pathophysiology of Alzheimer’s Disease

The basic working unit of the brain is a neuron, a specialized cell designed to transmit and receive information from other nerve cells. The brain consists of approximately one hundred billion such neurons that can have more than 15,000 connections via synapses (contact points of neurons for communication). Neurons are known to communicate with each other using electrical and chemical signals that can be lost in some instances due to certain conditions, and neurodegenerative diseases are one of them. These diseases are characterized by having such nerve cells either die or stop working. The cause of such neurodegenerative diseases can be either genetic or due to some medical condition such as a tumor, injury, or stroke. Other causes may include exposure to viruses, toxins, chemicals, or high alcoholism. Some of the common symptoms of neurodegenerative diseases include memory loss, forgetfulness, anxiety, mood, and behavioral changes. AD is the most common type of neurodegenerative disorder, first reported by Alois Alzheimer in 1906 while analyzing an autopsy report of a 55-year-old woman [17,18]. Later, Emil Kraepelin called this disorder Alzheimer’s Disease in his book published in 1910 [19].
Amyloid precursor protein (APP) is a type I membrane protein whose metabolism plays a crucial role in AD pathogenesis. After its translocation to the cell surface, it either follows a non-amyloidogenic pathway or an amyloidogenic pathway depending on its cleavage via several membrane-associated proteolytic enzymes (Figure 2). The non-amyloidogenic pathway is considered to be expected, where APP is cleaved by α-secretase. This cleavage generates three non-harmful fragments, namely AICD, a p53 fragment, and a secreted soluble AAP alpha (APPα). On the contrary, APP is cleaved via β-site APP cleaving enzyme 1 (BACE1) in the amyloidogenic pathway. This pathway results in the generation of a soluble β-cleaved ectodomain (sAPPβ) and toxic proteins termed amyloid-beta peptides. These toxic proteins are reported to be deposited as amyloid and neuritic plaques, thus leading to the loss of FC, resulting in memory loss and cognitive impairments. Several studies claim that this is one of the primary causes of AD. However, aging and genetic factors also contribute to the decreased FC in AD brains. In the upcoming sections of this review, we have discussed previous research showing improvements in measuring FC using fMRI and studies exploring resting-state fMRI results in clinical AD patients relative to healthy older patients.

3. Functional Connectivity Analysis Methods

After intensive research for more than a decade, scientists have developed many methods for measuring FC using fMRI. In general, these methods can be divided into two groups: model-based methods and data-driven methods (Figure 1). Each group has its benefits and drawbacks, which will be the subject of our discussion in the following.

3.1. Model/Seed Based Methods

Brain FC analysis among a priori regions of interest (ROIs) or voxels (11) is the most widely applied model-driven method. There are three significant steps in these methods:
Step 1: Assessment of positions and shapes of ROIs or locations of voxels.
Step 2: Measurement of ROI or voxel representative time series.
Step 3: Connectivity evaluations for different ROIs or connecting seeds (ROI or voxel) to other voxels in the brain.
The FC strengths that arise represent the temporal fluctuation relationships between the chosen voxels or regions. These ROIs are also referred to as seeds. As the starting step, a “seed” area is chosen. It is usually a precise area of interest in the brain to which we wish to measure connectivity or a collection of regions whose time courses reflect the closest resemblance to an experiment’s protocol (e.g., box-car waveform). Then, a functionally-linked network is defined as regions correlating with the seed time course that surpasses a predefined threshold. For a waveform s of seed region under time course t, the correlation coefficient r can be calculated as [20]:
r =   ( t t ¯ ) ( s s ¯ ) ( t t ¯ ) 2 ( s s ¯ ) 2
Here, t ¯ are the means of individual time course and s ¯ means of their respective waveform. If the value of r is 1, then it shows the perfect correlation, and the 0 value shows no correlation. The negative value (−1) of r means a perfect anti-correlation among the referenced regions.
There are two critical aspects of seed-based analysis. First, this technique needs previous knowledge of the seed area or an external reference function (not necessarily from inside the brain), which typically requires knowledge of an experiment’s methodology. The second characteristic is selecting the threshold for correlations directly connected to the significance level for correlation values. Obtaining a significant correlation coefficient depends on the signal of interest having the most significant variability when compared to experimental noise, as well as the number of time samples utilized. When conducting group analysis/multiple participants, the seed sections and threshold values should be carefully considered. Model/Seed based analysis approaches, though straightforward and easy to understand, are restricted since they are highly influenced by manual seed selection and, in their most basic form, can only show one functional system at a time. The selection of the seed region is user-dependent. However, there are several methods to measure the FC, such as cross-correlation analysis (CCA), coherence analysis (CA), and statistical parametric mapping.

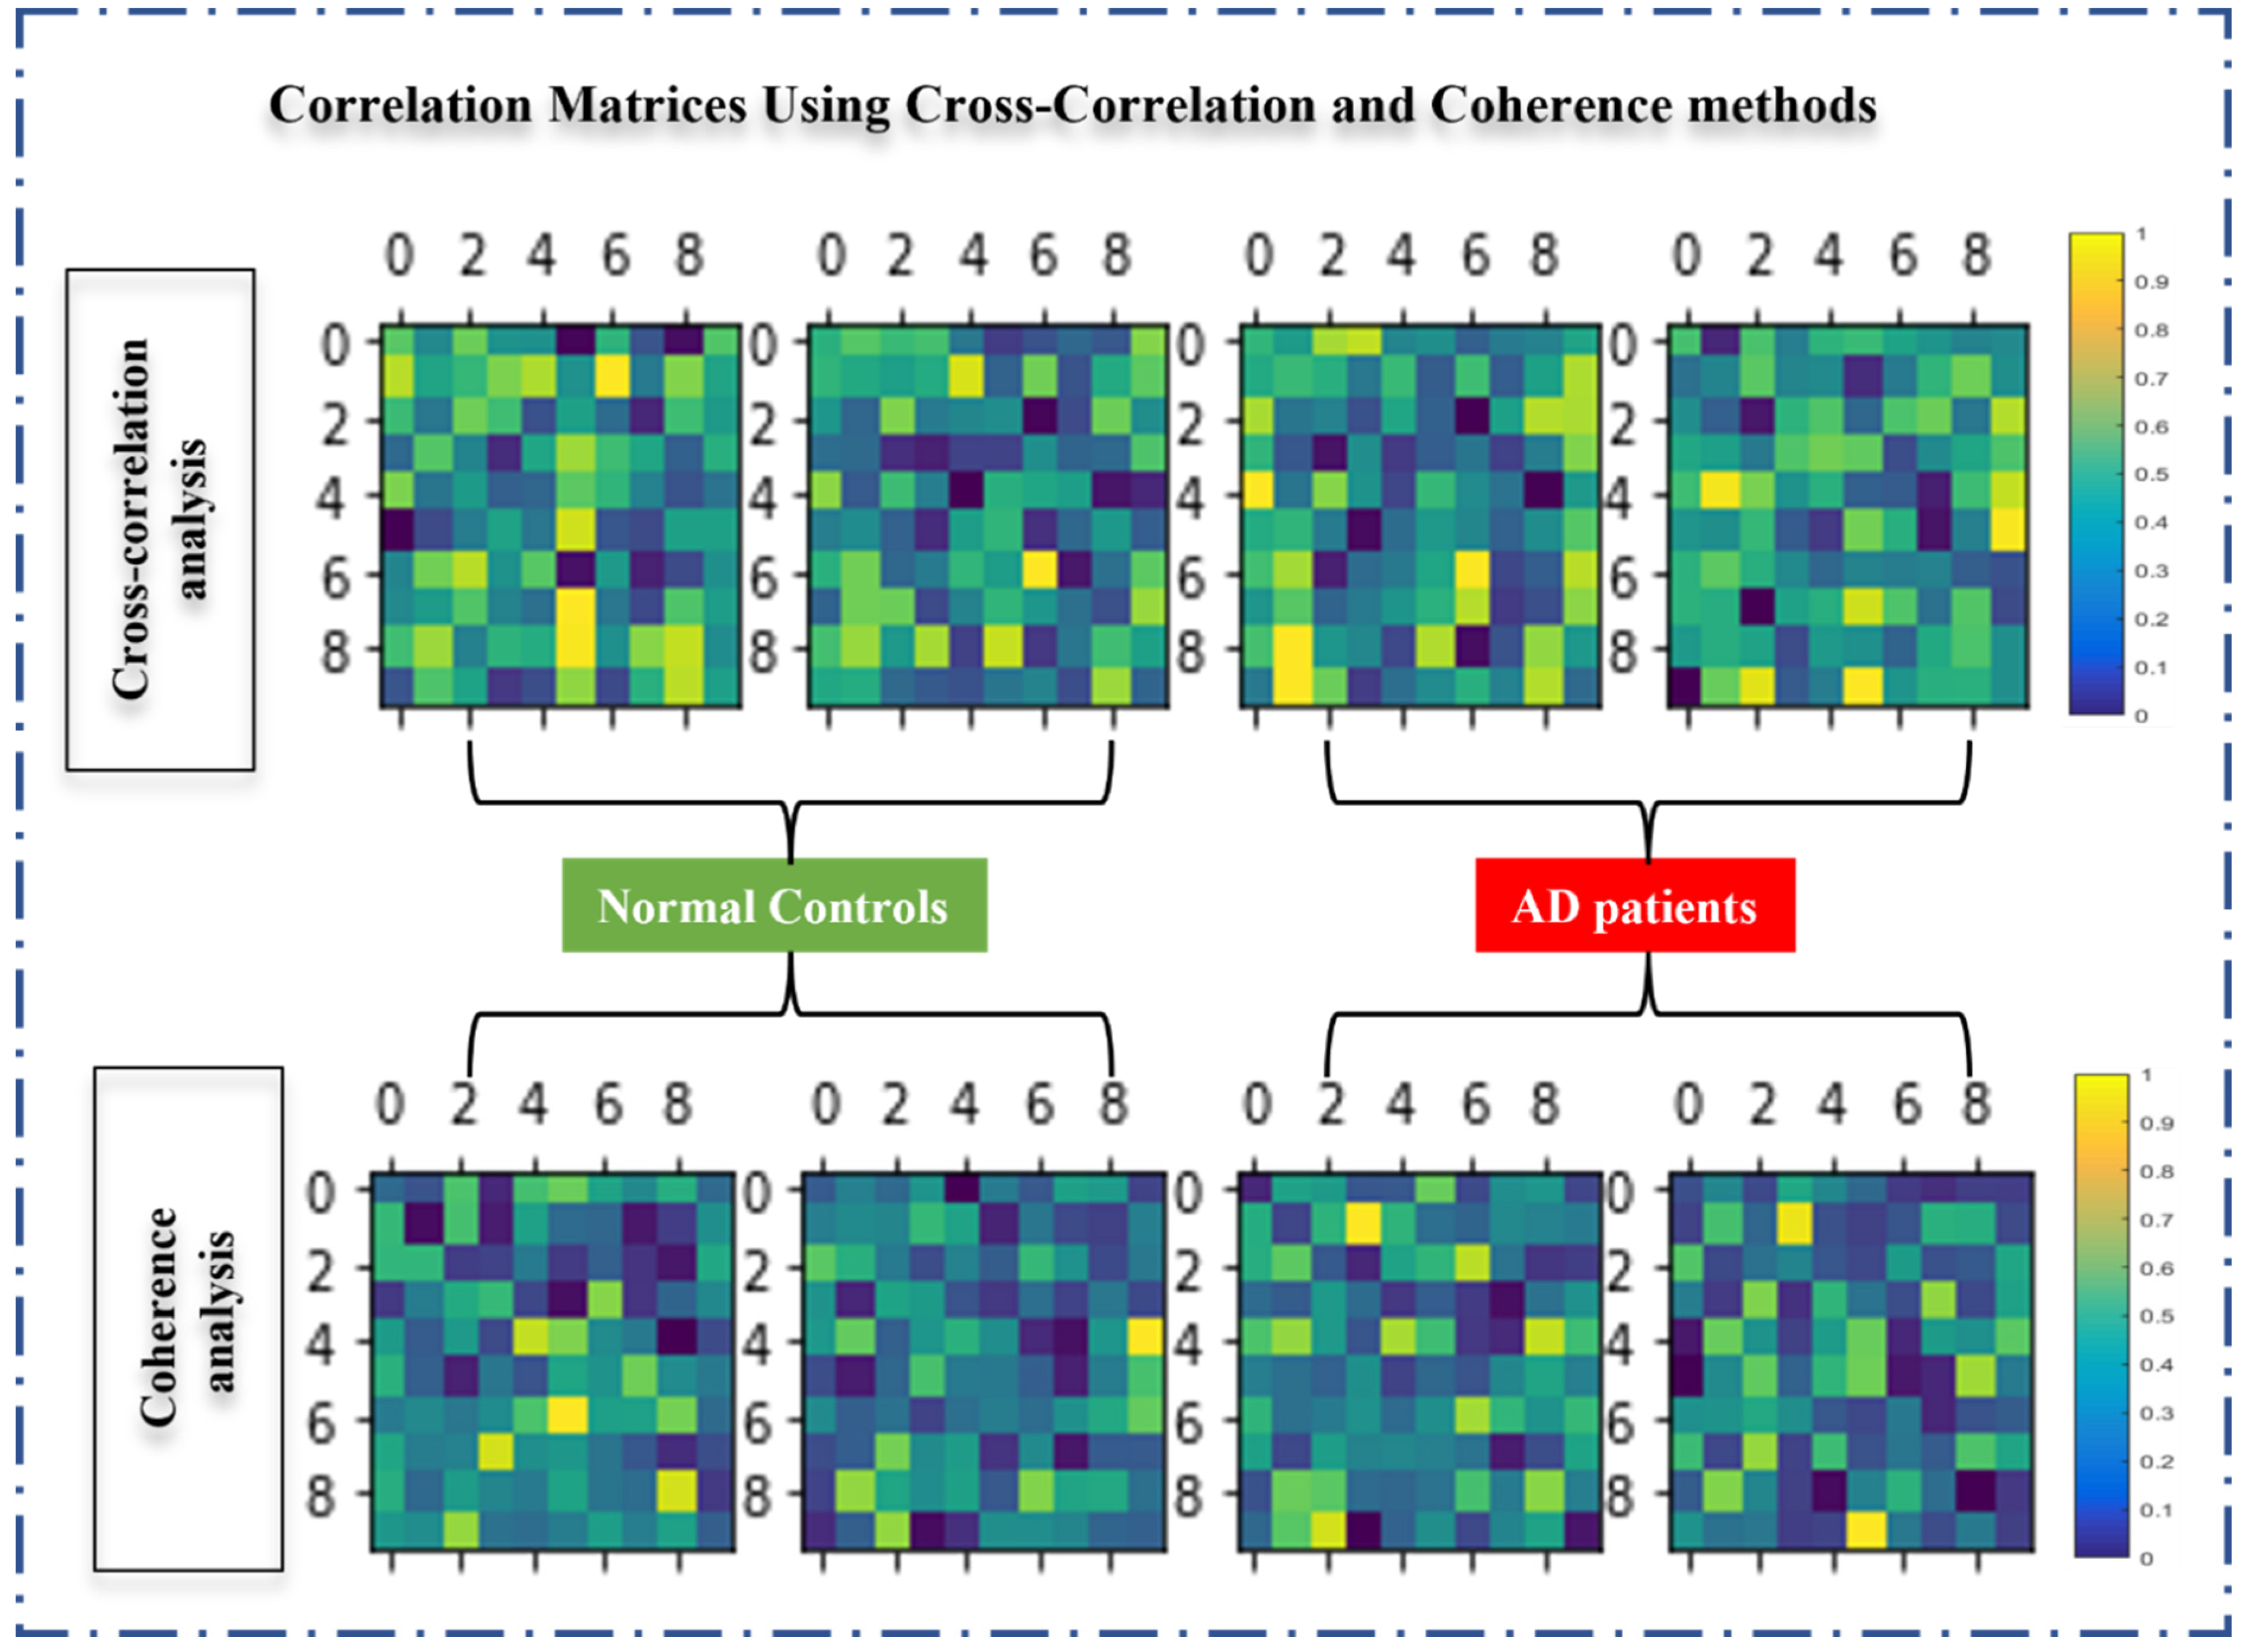
3.1.1. Cross-Correlation Analysis (CCA)

This approach, first presented in 1999, was proposed using the BOLD time series to detect a correlation across each pair of functionally connected brain regions [21]. For a BOLD fMRI time course f x (i) with a seed f y (i) (referenced time course), the correlation at lag µ can be calculated using CCA using equation [22]:
µ = C o v x , y ( μ ) V a r ( x )   X   V a r ( y )
Here, V a r ( x )   and   V a r ( y ) is the variance of f x (i) and f y (i), respectively.
Cross covariance C o v x , y ( μ ) can be calculated using mean values (E) of f x (i) and f y (i) respectively using the following equation [23]:
C o v x , y ( μ ) = E { ( f x ( i ) E ( f x ) ) × ( f y ( k ) E ( f y ) ) }
The conceptual explanation of this method is that if one region of the brain is functionally-linked to a specific seed, there must be a correlation between their BOLD time courses.

3.1.2. Coherence Analysis (CA)

Despite its wide usage in fMRI analysis, the CCA approach has several drawbacks. The estimation of the correlation at zero lag demanded complex computations when considering all available lags in two brain areas [24]. Some studies have found a strong correlation between regions with no blood flow fluctuations [25]. The correlation is dependent on the characteristics of HRF, which differs from one individual to another from one region to another. A new metric named coherence, which is the spectral representation of correlation in the frequency domain, was introduced [26]. This method demonstrated a more practical technique to assess BOLD time series communication utilizing frequency domain features. For a BOLD fMRI time course f x (i) with a seed f y (i) (referenced time course), the coherence can be calculated as:
C o h ( ʎ ) = | F x , y ( ʎ ) | 2 F x , x ( ʎ ) . F y , y ( ʎ )
Here,   F x , y ( ʎ ) is the cross-spectrum calculated by Fourier transformation of cross-covariance using the following equation:
F x , y ( ʎ ) = μ C o v x , y ( μ )   X   e j ʎ u
and   F x , x ( ʎ ) and F y , y ( ʎ )   are the power spectrum can be calculated by the below equations:
F x , x ( ʎ ) = μ C o v x , x ( μ )   X     e j ʎ u
F y , y ( ʎ ) = μ C o v y , y ( μ )   X   e j ʎ u
Some researchers investigated FC interactions between resting-state networks in AD patients and NCs and found that the interactions between resting-state networks in AD patients and NCs differed [27]. Here we present a visualization of cross-correlation and coherence matrices of AD subjects and NCs (Figure 3). The data utilized in this study were acquired from the Alzheimer’s Disease Neuroimaging Initiative (ADNI) database [28]. The ADNI’s focus is to explore the pathogenesis and prevention of AD by analyzing a wide variety of medical imaging data. This review analyzed the rs-fMRI data of 29 patients with AD and 30 NC subjects. The demographic and clinical details of the participants have been shown in Table 1.
The fMRI data have been preprocessed using the SPM 12 software package [29,30]. Using the FC module integrated with the DPARSF toolbox and SPM12, correlation matrices of the FC between white and gray matter have been derived (Figure 3). This analysis was carried out by detecting variations in the correlation.
In Figure 3, the colored small square boxes represent regions that correlated to rs-fMRI for NC and AD patients. Each box shows the average correlation coefficient. Both CCA and CA methods have a different approach to calculating the correlation between regions, which is why the number of yellow and dark blue boxes are different in both methods. In CCA, the number of yellow blocks is higher than in AD patients, which indicates a strong correlation in NC. Furthermore, the dark-blue and light-blue blocks are more frequent in AD patients, which shows a weakened or missing correlation. Although the yellow and blue blocks seem similar in CA, the intensity of blue is higher in AD patients, which indicates the weak correlation between white and grey matter regions.

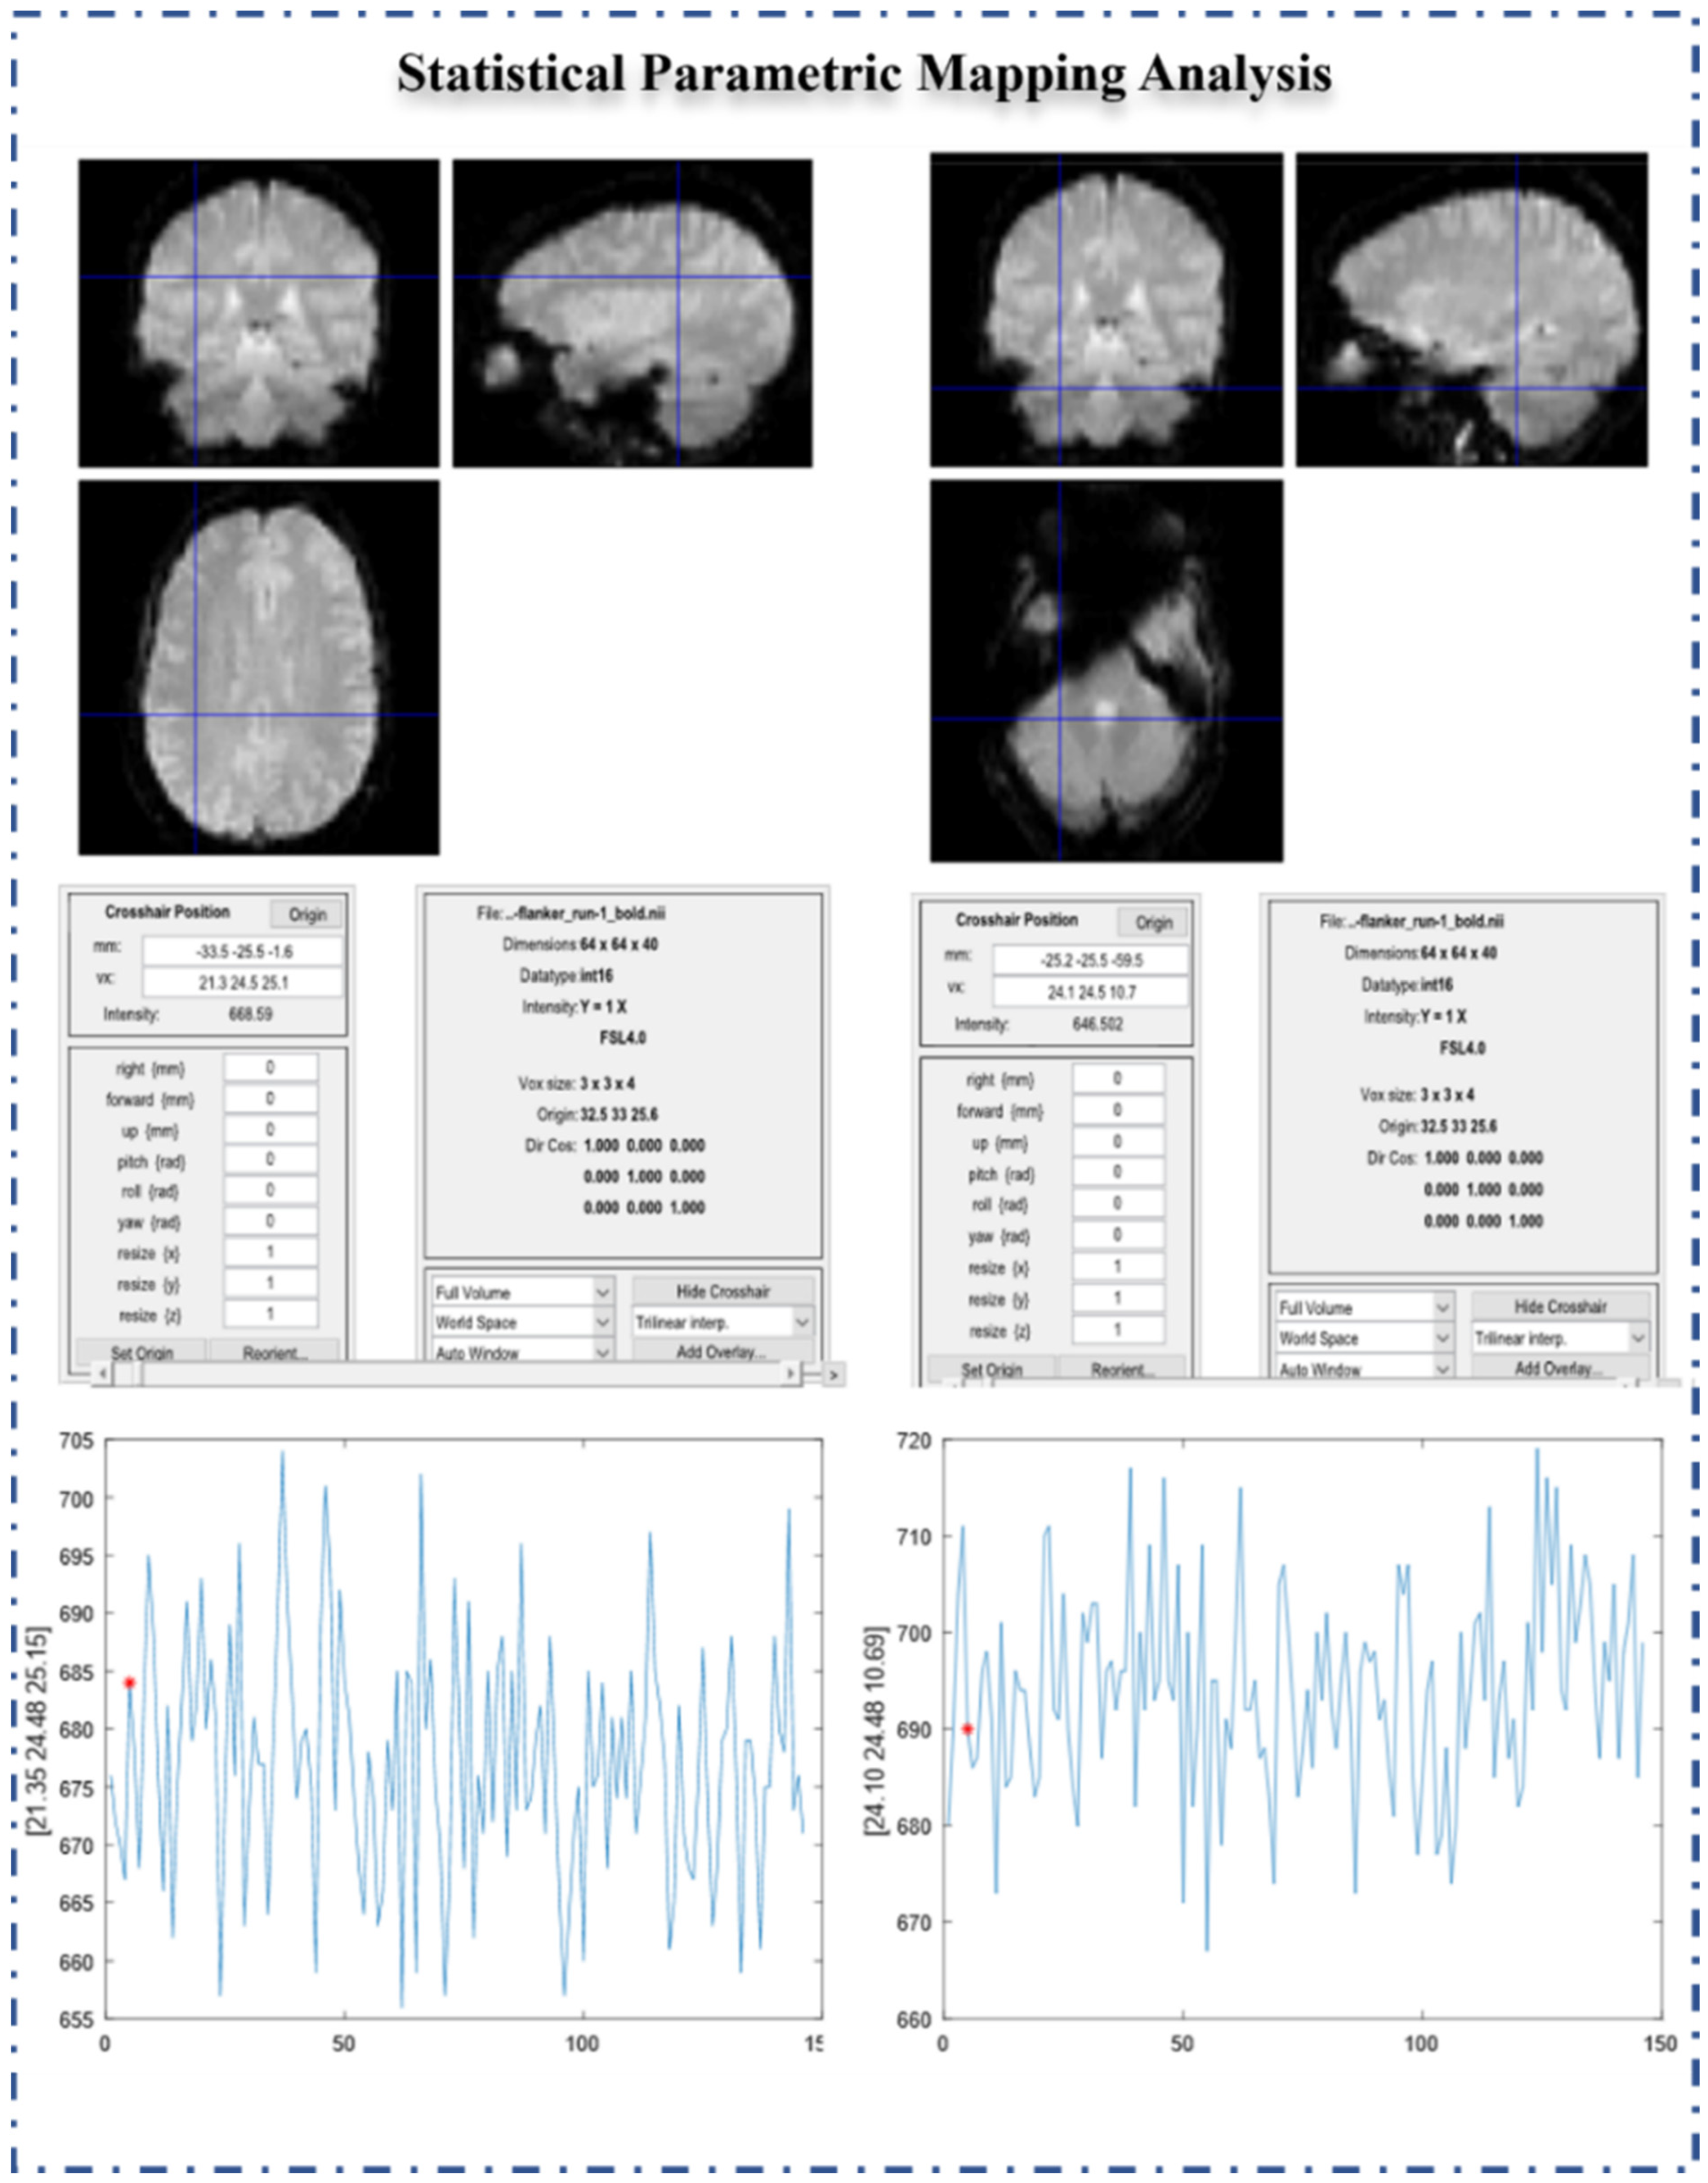
3.1.3. Statistical Parametric Mapping (SPM)

SPM refers to the application of the general linear model (GLM) and Gaussian random field (GRF) theory in combination to produce classical inferences about spatially extended data using statistical parametric maps. SPM utilizes GLM to estimate the parameters that potentially explain the data and GRF to overcome the multiple comparison difficulties. Following scaling and filtering processes of the overall brain voxels, this technique averages the voxels in a specific seed. It uses it as a variable of interest in the first-level analysis, followed by a deeper analysis utilizing the random effect. MATLAB (2017b) and SPM12 are used to preprocess the fMRI data [30,31], and some sample fMRI images of random subjects and the volume (age-wise) time series are shown in Figure 4.
Some studies have employed a variant of the model/seed-based methods. Rather than analyzing time-series correlations voxel by voxel, they parceled the brain by using an AAL atlas, averaging the time-series inside each ROI, and examined correlations across them [32]. They discovered a substantial drop in anterior-posterior positive correlations in AD. In contrast, rises in positive correlations in AD were often limited to intra-lobe connections. There was also a substantial reduction in the volume of negative connections in the parietal lobe in AD.

3.2. Data-Driven Methods

Analysis methods independent of prior knowledge or presumed models have been developed to address the limitations of model-based methods. This paper will explore decomposition techniques such as principal component analysis (PCA) and independent component analysis (ICA).

3.2.1. Principal Component Analysis (PCA)

PCA is a statistical approach for linearly transforming many correlated variables into a smaller number of uncorrelated variables that capture the majority of the variation in the original set of variables. It is also known as the Karhunen–Loeve transform [33]. One of the main goals of PCA is to reduce the dimensionality of the original data set. A limited number of uncorrelated variables is considered to reflect the underlying sources for observations. A smaller set of correlated variables is more computationally efficient in subsequent analysis. As a result, PCA is usually applied as a preprocessing step before applying other data-driven analysis methods such as clustering and ICA. For the investigation of FC, principal component analysis is helpful.

3.2.2. Independent Components Analysis (ICA)

ICA is a well-known technique for detecting FC using fMRI. ICA is ideally suited for resting-state fMRI studies since it requires no prior knowledge of the source signals’ spatial or temporal patterns. As a result, there is growing interest in using the ICA method to discover FC in resting-state fMRI studies. ICA, similar to PCA, seeks a linear combination of components. The difference is that ICA would look for components that are as statistically independent as possible.
In some studies, the DMN and its anti-correlated network, such as the executive control network (ECN) in MCI, were explored [34]. They discovered decreased connectivity in MCI in main DMN hubs such as the PCC and mPFC and the angular gyrus. They also measured decreased connectivity in the superior parietal lobule (SPL) and prefrontal cortex (PFC) in MCI, both hubs of those networks, in the ECN. The ICA studies of AD connectivity indicate unique reductions, particularly in the DMN, consistent with seed-based studies. The results in the ECN appear to be less consistent, which might be due to analytical decisions or the intensity of the subject’s symptoms.
Regions of the default mode network similar to the PCC, ventral, precuneus and dorsal medial prefrontal cortex display more significant activity during rest, indicating that this network reflects the human brain’s baseline or default functioning [35]. The DMN has gained a great deal of attention in the rs-fMRI field [36,37]. Several studies have examined alterations in DMN resting-state connectivity in neurocognitive and mental disorders such as AD [38]. For fMRI data F having n voxels and t time points, the ICA model can be expressed as:
  F   = i = 1 n A i . C i
Here, C i is the ith IC component of the signal source, and A is the mixing matrix of the dimension of n × t [39].
In ICA, two widely used approaches are the Infomax and the Fixed-Point. Both approaches operate by reducing component mutual information C i . Fixed-Point utilized the negentropy concept, whereas Infomax used adaptive entropy maximization of a neural network with as many outputs as the number of ICs evaluated. In terms of spatial and temporal accuracy, Fixed-Point surpasses Infomax. In contrast, Infomax outperforms Fixed-Point in terms of global model estimation and noise reduction.
ICA, similar to PCA, decomposes the original time sources into statically independent components and related IC maps that evaluate the correlation. ICA can be split into spatial ICA (ICA) and temporal ICA (tICA) depending on whether the data are decomposed into spatially-independent components and spatially-independent time course or temporarily-independent components and temporarily-independent time course. If the underlying signals are spatially linked but only temporarily, this may be preferable to sICA since sICA will almost certainly not give the proper activation pattern if the null spatial correlation is significantly broken, and vice versa for tICA.
To visualize the independent component or ROI, we used ADNI datasets and performed decomposition. The decomposed ROIs in the resting state are plotted on DMN, and all of the independent components are shown in Figure 5.

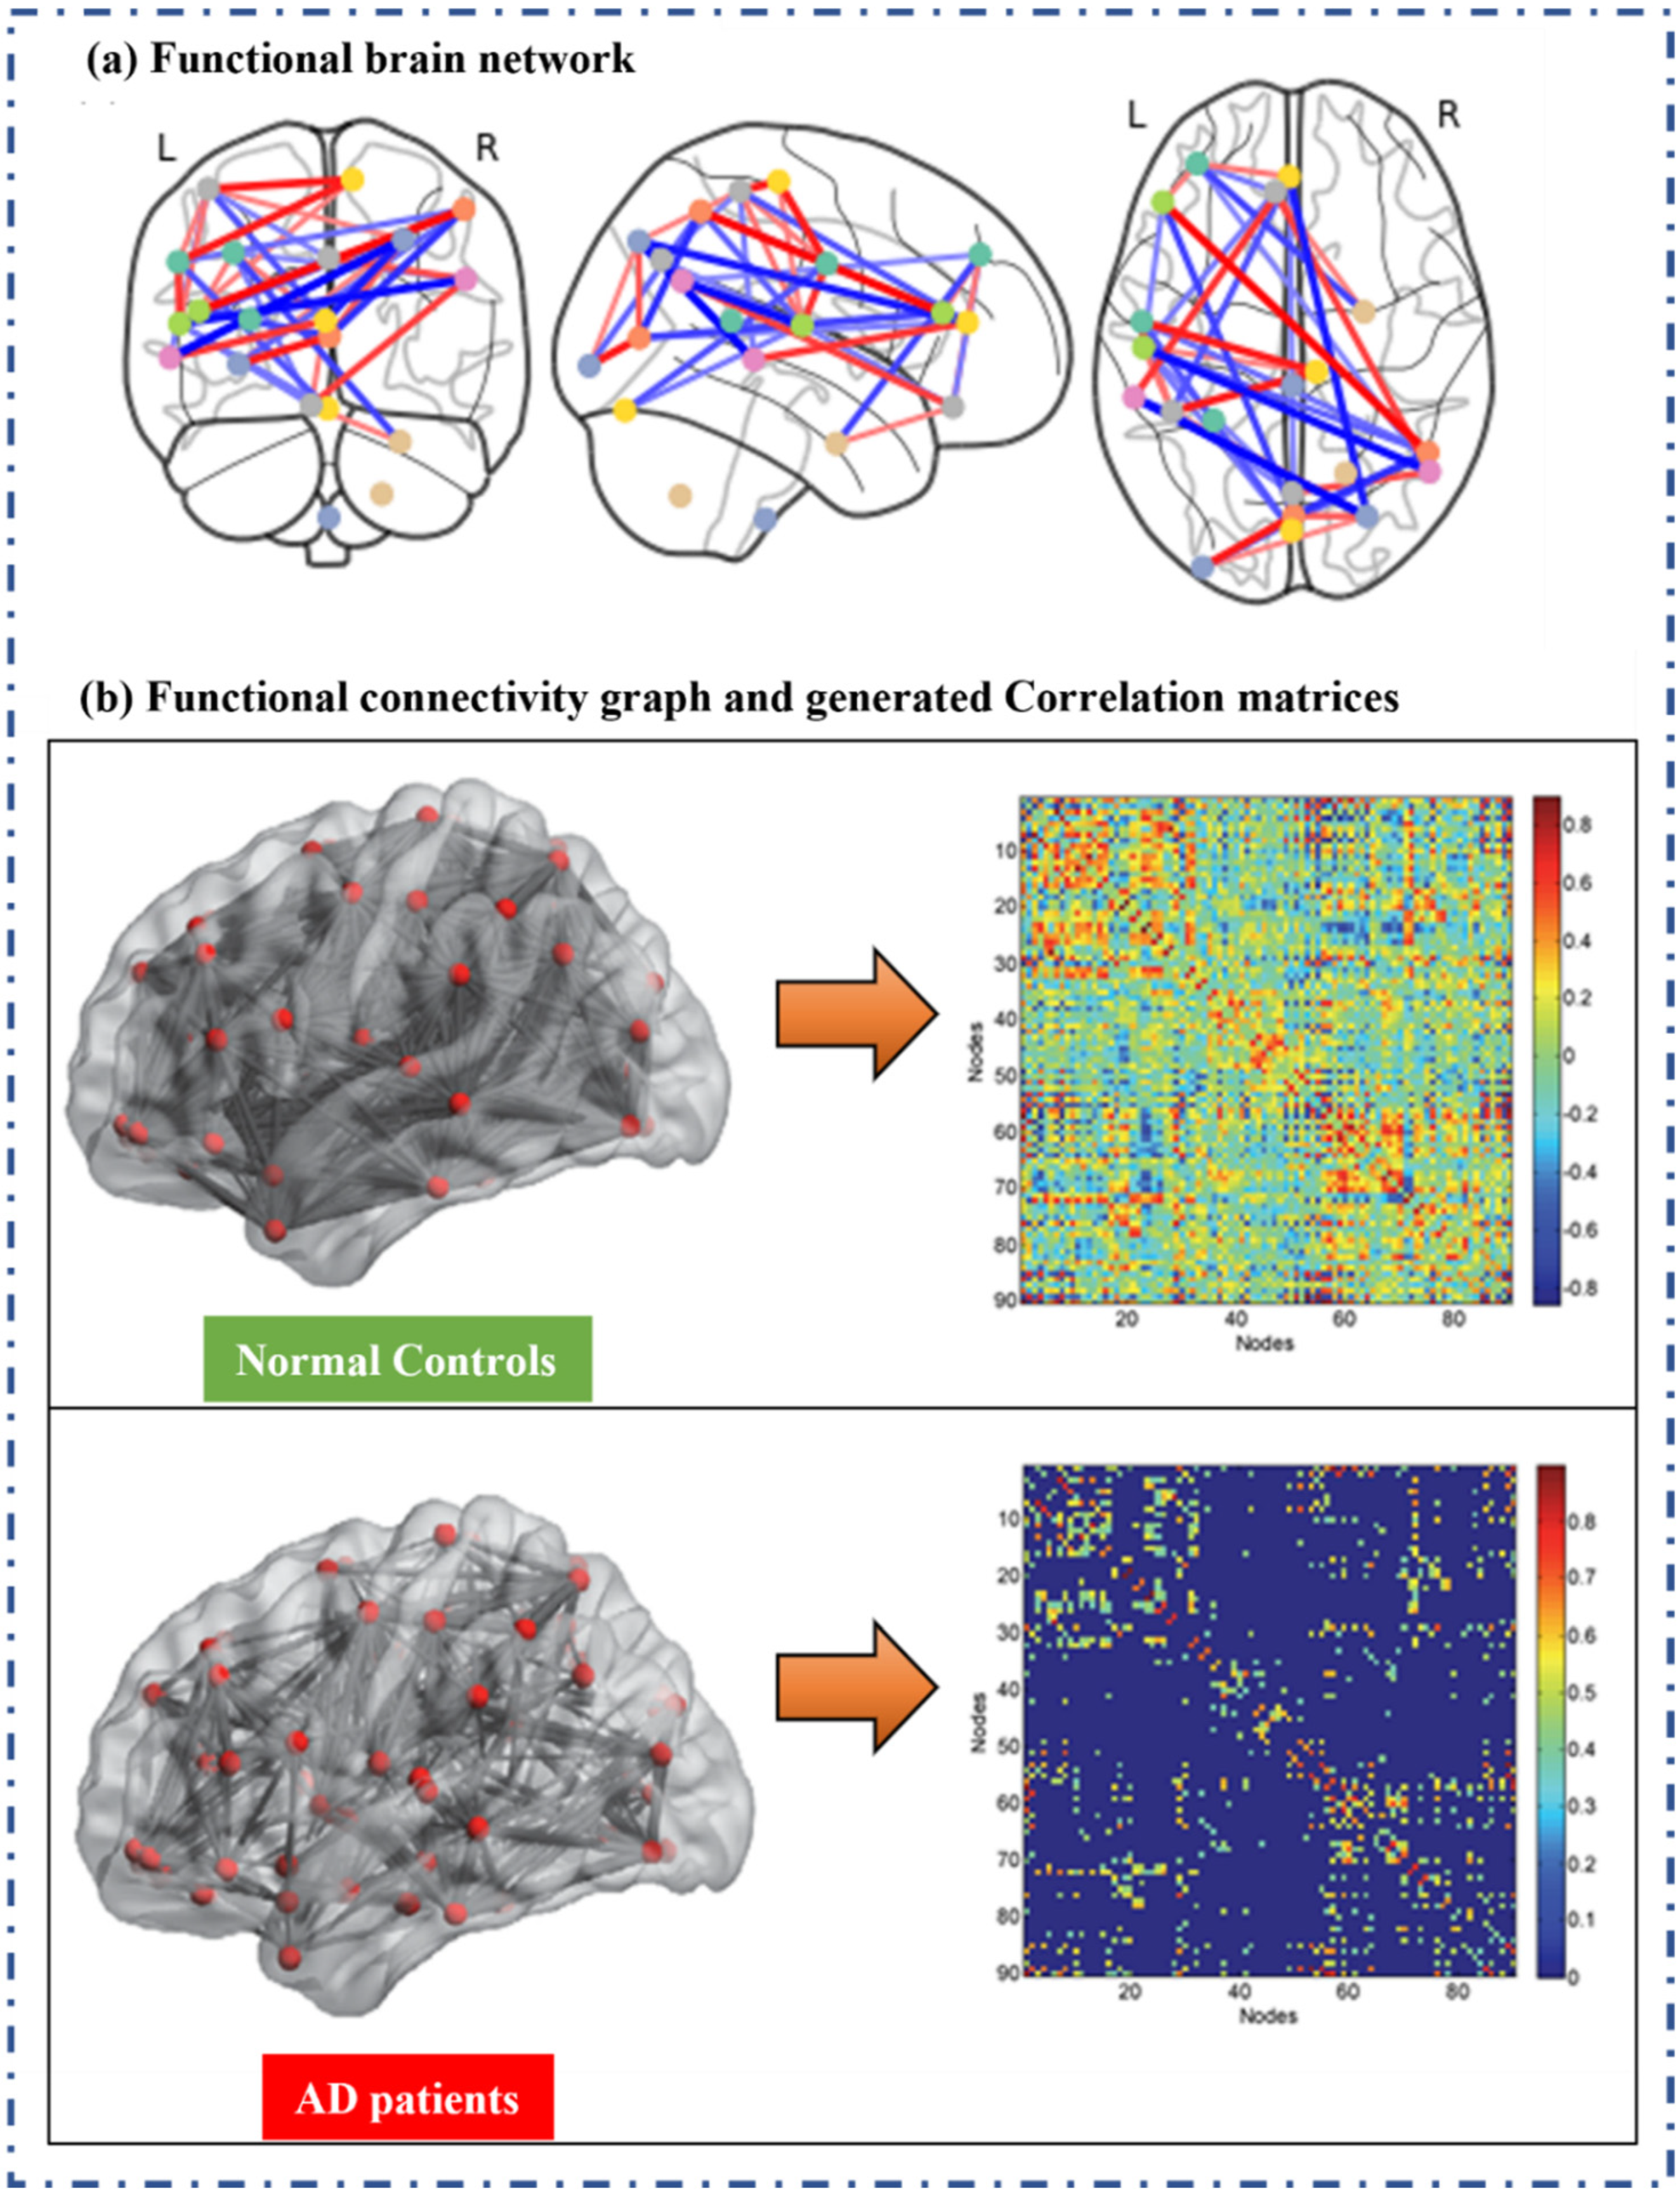
3.2.3. Graph Theory based Method (GT)

The seed-based and ICA methods are similar in that they both aim to extract temporally coherent networks. On the other hand, graph-theoretical methods are more commonly employed to characterize functional connections across all nodes (regions) of the brain. Assessing the topology of the functional connectome, a significant loss was measured in the small-world organization of the functional brain network in AD [40]. A study employed graph theory to identify network hubs before using PET imaging to reveal that β-amyloid deposition was substantially higher in certain areas. They speculated that there might be an activity-dependent mechanism that causes the accumulation of β-amyloid in highly active areas, such as the hubs (synapse) [41].
Graph theory is a mathematical technique capable of defining the characteristics of complicated systems concisely and modeling interrelationships (expressed by edges) between brain regions (expressed by nodes). Graph theory can expose the topological features of a complex network and assess the status of the brain network using metrics such as node degrees, clustering coefficient, typical path length, and correlations.
Here, ADNI data have been used for the experiment to measure FC using the graph theory method. All functional and structural MRI scans used in this study were collected using 3-T Philips scanners. The Data Processing Assistant for Resting-State fMRI (DPARSF) toolbox and the SPM12 toolbox were used to preprocess the images. The brain is divided into 90 different areas by the automated anatomical labeling (AAL) atlas. Averaging the signals of all voxels inside the region generated the representative signal of each node (Figure 6a). Using Pearson’s correlation coefficient (p), the brain network’s edges were defined as FC between all pairs of AAL areas. A high p-value contains more graph edges, resulting in a denser graph by retaining the weaker connections, which correspond to less significant and noisier correlations. A small value of p, on the other hand, may eliminate many edges from the graph, generating a disconnected graph that cannot be utilized in the calculation of the graph metrics.
Once the graphs were constructed, we computed different graph metrics to describe the brain’s functional state. To examine the characteristics of 90 AAL brain areas, three local nodal measures (degree, participation coefficient, and betweenness centrality) and one network small-wordless measure were calculated. Using the Brain Connectivity Toolbox, the graph measures were computed based on weighted adjacency matrices (Figure 6b).
The brain’s functional network was generated using the correlation between the resting-state fMRI signals from different brain areas (Figure 6). Graph theory-based metrics were used to assess the change in FC of the brain network caused by AD. The graph theory findings in AD are more consistent than those in seed-based and ICA methods, most likely because of methodological differences. Considering the variations in data type and analysis, graph theory looks to be a promising technique for analyzing FC in NCs and AD.

3.2.4. Machine Learning-Based Methods

Recently, the efficacy of brain FC network-based classification has been proven a great help in diagnosing and detecting brain disorders [42]. FC characterizes the brain’s functional network structure and can be conveniently extracted from fMRI data classifications. In addition, the FC between pairs of ROIs is one of the most common feature representations of fMRI data under the machine learning framework [43]. Machine learning approaches, which are generally data-driven, give an explicit characterization of rs-fMRI [44]. Unsupervised learning approaches in rs-fMRI are primarily concerned with understanding the functional organization and dynamics of the healthy brain [45]. Methods such as matrix decomposition or clustering, for example, can disclose numerous functional networks inside the brain while also revealing the underlying structure of dynamic FC [46,47].
On the other hand, supervised learning approaches may use resting-state FC (RSFC) to produce individual-level predictions [48,49]. Substantial effort has been devoted to using rs-fMRI to classify patients versus controls or to predict disease prognosis and guide treatments [50,51]. The detailed conceptual explanation of ML methods and their limitations are shown in Table 2.
Many advanced approaches for rs-fMRI analysis are based on machine learning. Both unsupervised and supervised learning approaches have significantly expanded the application fields of rs-fMRI. With the acquisition of vast amounts of neuroimaging data and advancements in learning algorithms, an even more significant impact is predicted in the future. Despite machine learning’s practical advantages, it is essential to understand the challenges faced in its present application to rs-fMRI.

4. Challenges and Limitations

Despite their abilities to infer correlation and coupling, adaptation, and variation analysis on fMRI data, these methods experience several challenges and limitations. Table 3 addresses the challenges and limitations of all of the methods described above.

5. Concluding Remarks

We focused on FC studies utilizing fMRI in this work. However, here we quickly review the various modalities researchers have utilized to provide some examples for future reading. The research reported here suggests that altered brain anatomy, functioning, cognition, healthy aging, and AD are connected to alterations in FC. Furthermore, the FC research utilizing fMRI has delivered several accomplishments in fundamental neuroscience research and clinical applications. FC investigations in fMRI may have more critical discoveries and clinical implications in brain diseases such as AD if complex network theory and graph theory are used in combination with other imaging techniques such as EEG and diffusion-weighted MRI. In terms of statistical validation, approaches such as SPM and ICA inherit the excellent statistical properties of neuroimaging data. The ICA method uses a statistical approach to optimize statistical independence between its components during the process of finding resting state networks (RSNs). It is capable of extracting DMNs and different RSNs with great efficiency. Statistical parametric mapping (SPM) can categorize regionally distinct effects in structural and functional neuroimaging data.
The choice of model-based versus data-driven techniques varies depending on the circumstance and research. There is no need to abandon prior expertise and experience in favor of data-driven approaches when both types of methods would do; nonetheless, employing CCA instead of ICA to discover broad areas of correlated voxels appears less favorable. Informative graph measurements were linked to brain cortical areas utilizing edges and nodes in the graph-based technique. They gave information regarding impaired brain functional nodes in AD. These studies move us closer to an overall objective in AD research: determining when and how to treat to prevent or stop the decline, as well as determining the early indications of decline and treatment responsiveness.

Funding

This research was supported by Korea Institute of Advancement of Technology (KIAT) grant funded by the Korean government (MOTIE) (P0012724, The Competency Development program for Industry Specialist).

Institutional Review Board Statement

Not applicable.

Informed Consent Statement

Not applicable.

Data Availability Statement

Not applicable.

Conflicts of Interest

The authors declare no conflict of interest.

References

  1. Sun, J.; Wang, B.; Niu, Y.; Tan, Y.; Fan, C.; Zhang, N.; Xue, J.; Wei, J.; Xiang, J. Complexity analysis of EEG, MEG, and fMRI in mild cognitive impairment and Alzheimer’s disease: A review. Entropy 2020, 22, 239. [Google Scholar] [CrossRef] [PubMed]
  2. Biswal, B.; Yetkin, F.Z.; Haughton, V.M.; Hyde, J.S. F1000Prime recommendation of: Functional connectivity in the motor cortex of resting human brain using echo-planar MRI. Magn. Reson. Med. 2012, 34, 537–541. [Google Scholar] [CrossRef] [PubMed]
  3. Chételat, G. Multimodal Neuroimaging in Alzheimer’s Disease: Early Diagnosis, Physiopathological Mechanisms, and Impact of Lifestyle. J. Alzheimer’s Dis. 2018, 64, S199–S211. [Google Scholar] [CrossRef] [PubMed]
  4. Farahani, F.V.; Karwowski, W. Computational methods for analyzing functional and effective brain network connectivity using fMRI. In Proceedings of the International Conference on Applied Human Factors and Ergonomics, Orlando, FL, USA, 21–25 July 2018; Springer: Cham, Switzerland, 2018; Volume 775, pp. 101–112. [Google Scholar]
  5. Margulies, D.S.; Kelly, A.M.C.; Uddin, L.Q.; Biswal, B.B.; Castellanos, F.X.; Milham, M.P. Mapping the functional connectivity of anterior cingulate cortex. Neuroimage 2007, 37, 579–588. [Google Scholar] [CrossRef] [PubMed]
  6. Iraji, A.; Calhoun, V.D.; Wiseman, N.M.; Davoodi-Bojd, E.; Avanaki, M.R.N.; Haacke, E.M.; Kou, Z. The connectivity domain: Analyzing resting state fMRI data using feature-based data-driven and model-based methods. Neuroimage 2016, 134, 494–507. [Google Scholar] [CrossRef] [PubMed]
  7. Fox, M.D.; Raichle, M.E. Spontaneous fluctuations in brain activity observed with functional magnetic resonance imaging. Nat. Rev. Neurosci. 2007, 8, 700–711. [Google Scholar] [CrossRef]
  8. Wu, J.T.; Wu, H.Z.; Yan, C.G.; Chen, W.X.; Zhang, H.Y.; He, Y.; Yang, H.S. Aging-related changes in the default mode network and its anti-correlated networks: A resting-state fMRI study. Neurosci. Lett. 2011, 504, 62–67. [Google Scholar] [CrossRef] [PubMed]
  9. Wang, K.; Jiang, T.; Liang, M.; Wang, L.; Tian, L.; Zhang, X.; Li, K.; Liu, Z. Discriminative analysis of early alzheimer’s disease based on two intrinsically anti-correlated networks with resting-state fMRI. Lect. Notes Comput. Sci. (Incl. Subser. Lect. Notes Artif. Intell. Lect. Notes Bioinform.) 2006, 4191 LNCS, 340–347. [Google Scholar] [CrossRef]
  10. Allen, G.; Barnard, H.; McColl, R.; Hester, A.L.; Fields, J.A.; Weiner, M.F.; Ringe, W.K.; Lipton, A.M.; Brooker, M.; McDonald, E.; et al. Reduced hippocampal functional connectivity in Alzheimer disease. Arch. Neurol. 2007, 64, 1482–1487. [Google Scholar] [CrossRef] [PubMed]
  11. Li, K.; Guo, L.; Nie, J.; Li, G.; Liu, T. Review of methods for functional brain connectivity detection using fMRI. Comput. Med. Imaging Graph. 2009, 33, 131–139. [Google Scholar] [CrossRef] [PubMed]
  12. Beckmann, C.F.; DeLuca, M.; Devlin, J.T.; Smith, S.M. Investigations into resting-state connectivity using independent component analysis. Philos. Trans. R. Soc. B Biol. Sci. 2005, 360, 1001–1013. [Google Scholar] [CrossRef] [PubMed]
  13. Koch, W.; Teipel, S.; Mueller, S.; Buerger, K.; Bokde, A.L.W.; Hampel, H.; Coates, U.; Reiser, M.; Meindl, T. Effects of aging on default mode network activity in resting state fMRI: Does the method of analysis matter? Neuroimage 2010, 51, 280–287. [Google Scholar] [CrossRef] [PubMed]
  14. Binnewijzend, M.A.A.; Schoonheim, M.M.; Sanz-Arigita, E.; Wink, A.M.; van der Flier, W.M.; Tolboom, N.; Adriaanse, S.M.; Damoiseaux, J.S.; Scheltens, P.; van Berckel, B.N.M.; et al. Resting-state fMRI changes in Alzheimer’s disease and mild cognitive impairment. Neurobiol. Aging 2012, 33, 2018–2028. [Google Scholar] [CrossRef] [PubMed]
  15. Yu, Q.; Du, Y.; Chen, J.; Sui, J.; Adali, T.; Pearlson, G.D.; Calhoun, V.D. Application of Graph Theory to Assess Static and Dynamic Brain Connectivity: Approaches for Building Brain Graphs. Proc. IEEE 2018, 106, 886–906. [Google Scholar] [CrossRef] [PubMed]
  16. Meunier, D.; Lambiotte, R.; Fornito, A.; Ersche, K.D.; Bullmore, E.T. Hierarchical modularity in human brain functional networks. Front. Neuroinform. 2009, 3, 37. [Google Scholar] [CrossRef] [PubMed]
  17. Stelzmann, R.A.; Norman Schnitzlein, H.; Reed Murtagh, F. An english translation of alzheimer’s 1907 paper, “über eine eigenartige erkankung der hirnrinde”. Clin. Anat. 1995, 8, 429–431. [Google Scholar] [CrossRef]
  18. Hippius, H.; Neundörfer, G. The discovery of Alzheimer’s disease. Dialogues Clin. Neurosci. 2003, 5, 101. [Google Scholar] [CrossRef]
  19. Kraepelin, E. Vol I: Allgemeine Psychiatrie; Vol II: Klinische Psychiatrie. In Psychiatrie, 8th ed.; Barth: Leipzig, Germany, 1910. [Google Scholar]
  20. Kim, Y.B. Comparison of Data-Driven Analysis Methods for Identification of Functional Connectivity in fMRI; Massachusetts Institute of Technology: Cambridge, MA, USA, 2005. [Google Scholar]
  21. Cao, J.; Worsley, K. The geometry of correlation fields with an application to functional connectivity of the brain. Ann. Appl. Probab. 1999, 9, 1021–1057. [Google Scholar] [CrossRef]
  22. Hyde, J.S.; Jesmanowicz, A. Cross-correlation: An fMRI signal-processing strategy. Neuroimage 2012, 62, 848–851. [Google Scholar] [CrossRef]
  23. Smirnova, E. Statistical Analysis of Large Cross-Covariance and Cross-Correlation Matrices Produced by fMRI Images. J. Biom. Biostat. 2013, 5, 1–8. [Google Scholar] [CrossRef]
  24. Cecchi, G.A.; Rao, A.R.; Centeno, M.V.; Baliki, M.; Apkarian, A.V.; Chialvo, D.R. Identifying directed links in large scale functional networks: Application to brain fMRI. BMC Cell Biol. 2007, 8, S5. [Google Scholar] [CrossRef] [PubMed]
  25. Miezin, F.M.; Maccotta, L.; Ollinger, J.M.; Petersen, S.E.; Buckner, R.L. Characterizing the hemodynamic response: Effects of presentation rate, sampling procedure, and the possibility of ordering brain activity based on relative timing. Neuroimage 2000, 11, 735–759. [Google Scholar] [CrossRef] [PubMed]
  26. Sun, F.T.; Miller, L.M.; D’Esposito, M. Measuring interregional functional connectivity using coherence and partial coherence analyses of fMRI data. Neuroimage 2004, 21, 647–658. [Google Scholar] [CrossRef] [PubMed]
  27. Poldrack, R.A. Region of interest analysis for fMRI. Soc. Cogn. Affect. Neurosci. 2007, 2, 67–70. [Google Scholar] [CrossRef] [PubMed]
  28. Jack, C.R.; Bernstein, M.A.; Fox, N.C.; Thompson, P.; Alexander, G.; Harvey, D.; Borowski, B.; Britson, P.J.; Whitwell, J.L.; Ward, C.; et al. The Alzheimer’s Disease Neuroimaging Initiative (ADNI): MRI methods. J. Magn. Reson. Imaging 2008, 27, 685–691. [Google Scholar] [CrossRef] [PubMed]
  29. Zhao, J.; Du, Y.H.; Ding, X.T.; Wang, X.H.; Men, G.Z. Alteration of functional connectivity in patients with Alzheimer’s disease revealed by resting-state functional magnetic resonance imaging. Neural Regen. Res. 2020, 15, 285–292. [Google Scholar] [CrossRef] [PubMed]
  30. Flandin, G.; Novak, M.J.U. fMRI Data Analysis Using SPM. In fMRI; Springer International Publishing: New York, NY, USA, 2020; pp. 89–116. [Google Scholar]
  31. Statistical Parametric Mapping—File Exchange—MATLAB Central. Available online: https://www.mathworks.com/matlabcentral/fileexchange/68729-statistical-parametric-mapping?s_tid=srchtitle (accessed on 1 July 2021).
  32. Thomas Yeo, B.T.; Krienen, F.M.; Sepulcre, J.; Sabuncu, M.R.; Lashkari, D.; Hollinshead, M.; Roffman, J.L.; Smoller, J.W.; Zöllei, L.; Polimeni, J.R.; et al. The organization of the human cerebral cortex estimated by intrinsic functional connectivity. J. Neurophysiol. 2011, 106, 1125–1165. [Google Scholar] [CrossRef]
  33. Wang, S.; Simon, B.P.; Bennett, D.A.; Schneider, J.A.; Malter, J.S.; Wang, D.S. The significance of Pin1 in the development of Alzheimer’s disease. J. Alzheimer’s Dis. 2007, 11, 13–23. [Google Scholar] [CrossRef]
  34. Amico, E.; Goñi, J. The quest for identifiability in human functional connectomes. Sci. Rep. 2018, 8, 8254. [Google Scholar] [CrossRef]
  35. Sorg, C.; Riedl, V.; Mühlau, M.; Calhoun, V.D.; Eichele, T.; Läer, L.; Drzezga, A.; Förstl, H.; Kurz, A.; Zimmer, C.; et al. Selective changes of resting-state networks in individuals at risk for Alzheimer’s disease. Proc. Natl. Acad. Sci. USA 2007, 104, 18760–18765. [Google Scholar] [CrossRef]
  36. Greicius, M.D.; Krasnow, B.; Reiss, A.L.; Menon, V. Functional connectivity in the resting brain: A network analysis of the default mode hypothesis. Proc. Natl. Acad. Sci. USA 2003, 100, 253–258. [Google Scholar] [CrossRef] [PubMed]
  37. Wu, X.; Li, R.; Fleisher, A.S.; Reiman, E.M.; Guan, X.; Zhang, Y.; Chen, K.; Yao, L. Altered default mode network connectivity in Alzheimer’s disease-A resting functional MRI and Bayesian network study. Hum. Brain Mapp. 2011, 32, 1868–1881. [Google Scholar] [CrossRef] [PubMed]
  38. Khoo, H.M.; Kishima, H.; Tani, N.; Oshino, S.; Maruo, T.; Hosomi, K.; Yanagisawa, T.; Kazui, H.; Watanabe, Y.; Shimokawa, T.; et al. Default mode network connectivity in patients with idiopathic normal pressure hydrocephalus. J. Neurosurg. 2016, 124, 350–358. [Google Scholar] [CrossRef] [PubMed]
  39. Grieder, M.; Wang, D.J.J.; Dierks, T.; Wahlund, L.O.; Jann, K. Default Mode Network Complexity and Cognitive Decline in Mild Alzheimer’s Disease. Front. Neurosci. 2018, 12, 770. [Google Scholar] [CrossRef] [PubMed]
  40. Li, Y.O.; Adali, T.; Calhoun, V.D. Estimating the number of independent components for functional magnetic resonance imaging data. Hum. Brain Mapp. 2007, 28, 1251–1266. [Google Scholar] [CrossRef] [PubMed]
  41. Supekar, K.; Menon, V.; Rubin, D.; Musen, M.; Greicius, M.D. Network analysis of intrinsic functional brain connectivity in Alzheimer’s disease. PLoS Comput. Biol. 2008, 4, e1000100. [Google Scholar] [CrossRef]
  42. Buckner, R.L.; Sepulcre, J.; Talukdar, T.; Krienen, F.M.; Liu, H.; Hedden, T.; Andrews-Hanna, J.R.; Sperling, R.A.; Johnson, K.A. Cortical hubs revealed by intrinsic functional connectivity: Mapping, assessment of stability, and relation to Alzheimer’s disease. J. Neurosci. 2009, 29, 1860–1873. [Google Scholar] [CrossRef]
  43. Du, Y.; Fu, Z.; Calhoun, V.D. Classification and prediction of brain disorders using functional connectivity: Promising but challenging. Front. Neurosci. 2018, 12, 525. [Google Scholar] [CrossRef]
  44. Shi, Y.; Zeng, W.; Deng, J.; Nie, W.; Zhang, Y. The Identification of Alzheimer’s Disease Using Functional Connectivity between Activity Voxels in Resting-State fMRI Data. IEEE J. Transl. Eng. Health Med. 2020, 8, 1–11. [Google Scholar] [CrossRef]
  45. Khazaee, A.; Ebrahimzadeh, A.; Babajani-Feremi, A. Application of advanced machine learning methods on resting-state fMRI network for identification of mild cognitive impairment and Alzheimer’s disease. Brain Imaging Behav. 2016, 10, 799–817. [Google Scholar] [CrossRef]
  46. Vidaurre, D.; Smith, S.M.; Woolrich, M.W. Brain network dynamics are hierarchically organized in time. Proc. Natl. Acad. Sci. USA 2017, 114, 12827–12832. [Google Scholar] [CrossRef] [PubMed]
  47. Dongiovanni, D.; Vaina, L.M. Select and Cluster: A Method for Finding Functional Networks of Clustered Voxels in fMRI. Comput. Intell. Neurosci. 2016, 2016, 4705162. [Google Scholar] [CrossRef] [PubMed]
  48. Dennis, E.L.; Thompson, P.M. Functional brain connectivity using fMRI in aging and Alzheimer’s disease. Neuropsychol. Rev. 2014, 24, 49–62. [Google Scholar] [CrossRef] [PubMed]
  49. Khosla, M.; Jamison, K.; Ngo, G.H.; Kuceyeski, A.; Sabuncu, M.R. Machine learning in resting-state fMRI analysis. Magn. Reson. Imaging 2019, 64, 101–121. [Google Scholar] [CrossRef]
  50. Fox, M.D.; Greicius, M. Clinical applications of resting state functional connectivity. Front. Syst. Neurosci. 2010, 4, 19. [Google Scholar] [CrossRef]
  51. Takamura, T.; Hanakawa, T. Clinical utility of resting-state functional connectivity magnetic resonance imaging for mood and cognitive disorders. J. Neural Transm. 2017, 124, 821–839. [Google Scholar] [CrossRef]
  52. Moreno-Dominguez, D.; Anwander, A.; Knösche, T.R. A hierarchical method for whole-brain connectivity-based parcellation. Hum. Brain Mapp. 2014, 35, 5000–5025. [Google Scholar] [CrossRef]
  53. Schoffelen, J.M.; Gross, J. Source connectivity analysis with MEG and EEG. Hum. Brain Mapp. 2009, 30, 1857–1865. [Google Scholar] [CrossRef]
  54. Power, J.D.; Fair, D.A.; Schlaggar, B.L.; Petersen, S.E. The development of Human Functional Brain Networks. Neuron 2010, 67, 735. [Google Scholar] [CrossRef]
Figure 1. Functional connectivity analysis methods.
Applsci 12 08096 g001
Figure 2. Pathophysiology of Alzheimer’s disease (AD) in the brain. The metabolism of APP follows either a non-amyloidogenic pathway through α-secretase cleavage or an amyloidogenic pathway through cleavage mediated by β-site APP cleaving enzyme 1 (BACE1).
Applsci 12 08096 g002
Figure 3. Correlation matrices were generated using CCA and CA for NCs and AD patients. Both methods measure the FC between white and grey matter at resting-state. The intensity of FC is highest at yellow blocks (strong correlation) and lowest at dark blue blocks (weak correlation).
Applsci 12 08096 g003
Figure 4. Functional images generated from SPM viewer for both NC (left) and AD patients(right). The interpretation of generated images requires extensive knowledge of fMRI and neurological disorders. Voxel time series for both subjects are displayed using signal graphs (down).
Applsci 12 08096 g004
Figure 5. DMN and ICA components and Correlation matrices using ICA for NC and AD patients.
Applsci 12 08096 g005
Figure 6. (a) Brain Network graph where nodes denote the voxel/ROI across the brain and edges denotes their functional connections (b) Graph-based estimation of correlation matrices for NCs and AD patients. The correlation matrices demonstrate the weaker/absent correlation in AD patients compared to NC.
Applsci 12 08096 g006
Table 1. Demographic and clinical details of the participants.
GroupNC (30 Total)AD (29 Total)
( Age )   a 74.20 ± 5.9672.01 ± 7.26
Sex(M/F)11/1911/18
( MMSE )   b 28.9 ± 1.721.0 ± 3.5
( FAQ )   c 0.14 ± 0.4415 ± 7.47
( CDR )   d 00.84 ± 0.23
a,b,c,d values show the mean ± standard deviation. MMSE: Mini-Mental State Examination; FAQ: Functional Assessment Questionnaire; CDR: Clinical Dementia Rating.
Table 2. ML-based methods for functional connectivity analysis.
ML-Based MethodConceptual Explanation and Limitations
Supervised Learning:
  • Regularized linear models
  • Support Vector Machines (SVMs)
  • Decision trees and random forest
  • Deep neural networks (DNN)
  • All algorithms have advantages and disadvantages. The algorithm selection should be guided by various criteria such as the prediction objective, sample size, and type of input data.
  • The greater the number of features, the more training data are needed to describe their distribution. In general, the minimal training amount for an ML algorithm training is a complicated function of input dimensionality, model complexity, data quality, data heterogeneity, class differentiation, and so on. To address the limitations of small sample sizes, one possible technique is to use unlabeled dataset in a semi-supervised way to improve the performance of supervised learning algorithms.
  • Given the small sample sizes in most neuroimaging research, K-fold cross-validation is the preferred method since it uses all data points for both training and validation via repeated holdout, resulting in error estimates with significantly lower variance than traditional holdout.
  • Some applications of supervised learning in rs-fMRI are:
    • Brain development and aging;
    • Neurological and Psychiatric Disorders;
    • Cognitive abilities and personality traits;
    • Vigilance fluctuations and sleep studies;
    • Heritability;
    • Other neuroimaging modalities.
Unsupervised Learning:
  • Clustering (K-means, Gaussian mixture model, Hierarchical, Graph-based)
  • Latent variable models (Decomposition: {PCA, ICA, Sparse dictionary learning, non-negative factorization (NMF)}, Hidden Markov models)
  • Nonlinear embeddings
  • Promising results for the analysis of multi-dimensional data with complicated structures.
  • These methods seek to partition the brain into separate functional components, similar to atlases. Clustering techniques do not necessarily support spatial contiguity, but boundary-based approaches do. The basic assumption is that FC data show similar patterns among individuals. These global parcellations represent similar organizing principles.
  • A critical issue in this approach is the capacity to relate independent spatial maps to a group template in order to create connections across subjects. There is no consistent framework for understanding such brain parcellations. However, various taxonomic categories may be applied to explain the formation of these parcellations, such as machine learning or border detection, clustering or decomposition, multi-model or unimodel approaches.
  • Some studies have supported the notion that there is no optimum functional partition of the brain but rather a vast array of relevant brain parcellations [52].
  • Some applications of supervised learning in rs-fMRI are:
  • Discovering spatial patterns with coherent fluctuations
  • Learning sparse spatial maps
  • K-means clustering and mixture models
  • Identifying the hierarchical spatial organization
Table 3. Challenges and limitations of functional connectivity methods.
Method NameChallenges and Limitations
CCAThe hemodynamic response function (HRF) differs between subjects and even between brain areas within the same subject due to the full-lag space of blood’s hemodynamic response, which makes CCA unnecessary. It would be computationally expensive to calculate cross-correlation at all lags. To overcome this problem, many researchers compute correlation with zero lag.
CAThe low spatial and temporal resolution limits the analysis of FC using CA. The distribution of the electric current over the surface of the skull can be inaccurate, which is one of the challenges with this traditional method of mapping coherence in sensor space [53]. The exact amplitudes of the connections are not equivalent to region-to-region coherence amplitudes; therefore, the directionality of the network interaction cannot be identified by only considering coherence. Apart from this limitation, coherence provides a global assessment of all critical regions of network activity irrespective of source amplitudes, making it unsuitable for assessing rapid temporal changes in synchronized activity.
SPMThe model/seed-based method allows one to concentrate just on brain regions associated with prior knowledge while neglecting other brain sections or functions. As a result, complete brain exploration is beyond the scope of this method. It may necessitate data-driven approaches such as decomposition analysis and clustering analysis.
PCAThe challenge of determining the dimensionality of the primary space upon which we project the original data, or the number of principal components, remains unsolved. Initially, PCA was applied to fMRI datasets in several studies and helped the researcher explore helpful information related to FC. However, for lower contrast to noise ratio, PCA shows poor performance.
ICAAlthough the ICA method for FC research is becoming increasingly popular, particularly with resting-state fMRI data, several problems need to be noted. Firstly, ICA is based on the premise that components (signal sources) are independent of one another, whether geographically or temporally. Violation of this premise would significantly reduce ICA’s efficacy. Second, the topic of how to select the number of independent components and how to threshold the IC maps remain unclear.
GTGraph theory gives valuable information on the development of functional neural networks. However, it has limitations that need to be addressed. In graph theory research, conclusions can be reached when nodes are well defined as voxels or regions of interest. Node definition is quite tricky in developmental research since the nodes are likely to be identical across various subjects or sessions. Hence graphs may be considerably distorted [54]. As a result, employing graph theory necessitates a careful approach to node selection and a piece of knowledge that constructed graphs are only reliable when nodes are adequately defined.
Publisher’s Note: MDPI stays neutral with regard to jurisdictional claims in published maps and institutional affiliations.

