Article

Land Cover Mapping Using GIS and Remote Sensing Databases for Al Baha Region Saudi Arabia

by
Raid Yahia Shrahily
1,*,
Mohammad Ambarak Alsharif
1,
Babikir Ahmed Mobarak
2 and
Abdulrhman Ali Alzandi
3
1
Department of Architecture, College of Engineering, Al-Baha University, Prince Mohammad Bin Saud Road, Al-Baha 65527, Saudi Arabia
2
Department of Civil Engineering, College of Engineering, Al-Baha University, Prince Mohammad Bin Saud Road, Al-Baha 65527, Saudi Arabia
3
Biology Department, Faculty of Arts and Science in Qilwah, Al-Baha University, Qilwah P.O. Box 1988, Saudi Arabia
*
Author to whom correspondence should be addressed.
Appl. Sci. 2022, 12(16), 8115; https://doi.org/10.3390/app12168115
Submission received: 21 June 2022 / Revised: 4 August 2022 / Accepted: 5 August 2022 / Published: 13 August 2022

Abstract

:
Land cover assessment plays a vital role in both current and future planning and use of natural resources for sustainable development for any country. For the good practice of the vision 2030 in Al Baha region (south-western Saudi Arabia), land cover was assessed, classified, and analyzed using remote sensing databases and time series analysis combined with spatial analysis in geographic information system (GIS) based on high-resolution Landsat 8 OLI, Sentinel-2 satellite imagery between the period of study 2017/2018 and 2021/2022. Based on both an accuracy assessment and kappa test, the results indicate that Esri Sentinel-2 imagery gives the highest performance compared to Landsat 8 OLI with accuracy and kappa test equal to 87% and 84%, respectively. On the other hand, the land cover classification revealed that the large area of water bodies is localized on Alaqiq (1.45 km2), Baljurish (0.94 km2), and Elmelkhwah (1.57 km2). Furthermore, the built area of the Al Baha region between 2017 and 2021 was estimated to increase by 144 km2 (from 516.5 to 661.07 km2), which is especially significant for the Qelwah district (from 16.97 to 44.16 km2) which demonstrated a decrease in bare ground area of approximately 320 km2. The crop lands have been increased by 162.74% in the 2017–2021 period from 10.39 km2 to 16.90 km2, particularly at Qelwah and Elmelkhwah. Finally, the results obtained by this research can help decision-makers and managers for better natural resources management in the Al Baha region.

1. Introduction

Land use involves modifying human beings’ natural or wild environment to an urban environment, e.g., converting forests to cultivated land or pastures and settlements or other management practices [1]. According to FAO [2], land where crops have been planted and irrigated has increased due to the great demand for food, while the land allocated to permanent meadows and pastures has declined significantly. The rapid growth of urban areas has negatively changed all kinds of agricultural land uses, which has led to changes in current ecosystems and the water cycle/micro-climate [3,4,5,6]. This is why climate change (CC), land use, and land change (LULC) are among the most current research topics that international environment, food and agriculture program organizations are working on [7,8].
Several studies have been carried out in the framework of remote sensing for land cover and vegetation assessment at scale worldwide [9,10,11,12,13,14,15,16,17,18]. In Central Puget Sound, Morawitz et al. [19] used the normalized difference vegetation index (NDVI) to assess vegetative land cover change. The results indicate that the green-up from logging linked to human use and development and seasonal weather patterns were the main reason for an increase in NDVI values. Using LANDSAT8 time series land cover for classification based on NDVI, Jeevalakshmi et al. [20] observed that there is not much or any significant change in dense vegetation at Tirupati region (India) since most of it is covered with settlements and built-up area. Using hyper-temporal MODIS NDVI databases, Aredehey et al. [21] analyzed land-use land-cover (LULC) classification at the Giba catchment (northern Ethiopia). The analysis indicates that that the MODIS NDVI image is applicable for mapping large areas with an overall accuracy of 87.7%. In the northwest Hexi region of China, Han et al. [14] characterized land cover and elevation using trends analysis of NDVI variation for the 1982–2015 period. The results revealed an increase in the vegetable class, especially on grass land and forest areas due to their adaptation to climate change. Moreover, the NDVI values were sensitive to rainfall trend variability, where the crop was mostly influenced by human activities. In the Rio de la Plata Grasslands, Baeza and Paruelo [16] analyzed LULC change during the 2000–2014 period using MODIS NDVI Time Series. The results indicate an increase of 23% in the agricultural area, which added over 50,000 km2 of new crops that replaced grassland concentrated on both sides of the western portion of Inland Pampa and the Uruguay river. In many regions of Saudi Arabia, numerous studies and researches have elaborated, Dafalla et al. [22] used remote sensing and GIS for the assessment and mapping of land use/land cover in Al-Qassim region, central Saudi Arabia. The analysis revealed that the plant lands are surrounded by sand dunes, which will lead to the loss of some producing lands. In the desert cities of Makkah and Al-Taif (Saudi Arabian), land use and land cover change were analyzed using Landsat satellite data [23]. The results show that built areas have augmented over the period from 1986 to 2013 by approximately 174% and 113% in Makkah and Al-Taif, respectively. In addition, an increasing vegetation cover has been observed due to rising afforestation in the urban areas. At the scale of Al-Khobar region in Saudi Arabia, Rahman [24] used multi-temporal remote sensing data (Landsat TM, ETM+, and OLI data) for change detection of land use/land cover and urban sprawl. The results indicate that built-up areas augmented by 117% and 43.51% between 1990 and 2001 and from 2001 to 2013, respectively. Where the vegetation increased by 110% and by 52% for the same periods, respectively. Rahman et al. [25] investigated the effects of LULC changes on the land surface temperatures (LST) for the eastern coastal city of Dammam (Saudi Arabia) using Landsat imagery and cellular automata Markov (CAM) model for the years 1990, 2002, and 2014 and also 2026. The analysis shows that the built-up area increased by 28.9% between 1990 and 2014, when the built-up area had the maximum LST. According to CAM, by 2026, may have average LSTs over 41 °C. Attributes and land cover types have been mapped and classified in Al-Ahsaa Oasis, (eastern region of Saudi Arabia) by Salih [26] using Landsat-7 Data. The study revealed that the sand dunes are the dominant land cover class with an area of around ±70% and that the sand movement has long affected the study area. Abdallah et al. [27] studied the impact of land use/land cover changes induced by Jizan Dam (Saudi Arabia) on soil organic carbon using Landsat MSS, ETM+, and OLI images for the years 1972, 2000, and 2017. The results indicate an increase in the vegetation area of Jizan Basin during 1972–2017 which could be linked to Jizan Dam construction, where the bare area (sand) has decreased by 9% (42 km2). In the northwestern coastal land of the red sea (Saudi Arabia), vegetation cover has been analyzed by Alharthi et al. [28] using remote sensing for 10 years based on a set of SPOT-5 images for the years 2004 and 2013. The analysis revealed that the vegetation cover has reduced by nearly 19% over the period 2004 to 2013 causing an increase in sediments class by the same magnitude (12%).
One of the most environmental and agriculture programs launched in the face of the triple threat of climate change, nature loss and pollution is the United Nations Decade for Ecosystem Restoration 2021–2030 [29]. One of the best objectives of this program is the restoration of degraded lands in the next decade, where the area is estimated to be almost the size of India and its costs were estimated to be around $200 billion annually by the year 2030 [30].
The continued use of the natural vegetation cover may lead to a deepening of the degradation of agricultural land and its productivity, as well as affect sustainable tourism [31]. Recently, tourism has been linked to the environment in the term so-called ecotourism. It was appeared in the early eighties of the twentieth century to express a new type of environmentally friendly tourism activity practiced by man, preserving the natural and cultural heritage of the environment in which he lives. In 2012, the largest number of pilgrims in history at Mecca (Saudi Arabia) was recorded, reaching 3 million and 161 thousand pilgrims [32] This is why decision makers in the Kingdom see that reliance on seasonal pilgrimage returns and a rentier economy based on oil export is not enough to achieve future plans [33]. This is why the Kingdom of Saudi Arabia plans to attract 100 million visitors annually in 2030 [34]. This latter can raise the contribution of tourism to the economy from 5 to 18%. This can make ecotourism one of the future projects that will be achieved, especially with the geographical location and the different natural environment and climate features of the Kingdom. The Green Kingdom’s efforts are working to restore ecosystems by launching campaigns and initiatives such as “Let’s Make It Green”, “Saudi Green Initiative” and “Middle East Green Initiative”, as a contribution to promoting biodiversity, combating climate change, reducing carbon emissions and improving the quality of life, due to the Kingdom’s environmental and natural capabilities [35].
Saudi Vision 2030 aims to protect and enhance the natural environment in the Kingdom by adopting a holistic vision of precious ecosystems [36]. It also works to encourage sustainable agricultural practices throughout the Kingdom, which helps in providing safe and high-quality local foodstuffs to citizens and residents, with maintaining the water balance and restore biodiversity [37]. The Al-Baha region is the most important district of the Kingdom of Saudi Arabia in terms of geography and tourism, where the most important and most prominent features of the Al-Baha region are the distribution of vegetation cover. According to author’s knowledge, there are no comprehensive and sufficient studies that shows the distribution of surface and vegetation cover that can provide decision-makers sufficient information to make good progress for the planned vision of 2030. The aim of the present study is to provide an analysis of land cover using remote sensing databases and time series analysis combined with spatial analysis in geographic information system (GIS) based on high-resolution Landsat 8 OLI, Sentinel-2 satellite imagery of the period of study (i.e., 2017–2022).

2. Study Area

The Al-Baha region is located in the southwestern part of the Arabian Peninsula, on the Hijaz Mountain range. It is localized between longitudes and latitudes 41/42 E N. 19/20 (Figure 1). It is bordered on the north and west by the Makkah region, and on the south and east by the Asir region. It was established as an administrative region in 1964, and it is here that the administrative and commercial weight of the region is concentrated. The Emirate of the region is located in which government departments and commercial centers gather, and it is considered one of the best regions of the Kingdom in the field of tourism. Al Baha region borders the Makkah region from the north, west and south, and the Asir region from the east. The region is made up of mountains, valleys, hills, plains, and desert areas. It is divided by rocky escarpments into two main sectors:
  • To the west, a coastal plain, the Tihama;
  • To the east, the mountain range of al-Sarawat, or al-Sarat, with an altitude of 1500 to 2450 m (Figure 1b,c). where the low altitude and high slope were observed in Buljurshi, AlMandaq and Al Bahah or in the southern part regions.
The general climate is that of an arid zone. The relative humidity varies between 52% and 67% (especially in Buljurshi, to 54% and 60% in alMandaq). with maximum temperatures of 23 °C and minimum of 12 °C, where the topography determines the peculiarities. Al Bahah and Balijureshi are located among these steep cliffs. The area receives relatively high rainfall and has a temperate climate, which gives this area dense vegetation cover. Qilwah and Al Mikhwah are located in this region. Heading towards the eastern part of the province, you will find the Eastern Hills that rise to an altitude of 1500 to 1900 m (Figure 1e,f). The climate of this region is an average of the two previous regions. It has cool winters, hot summers, and sparse ground cover.

3. Materials and Methods

3.1. NDVI Time Series Analysis Using PROBA-V

PROBA-V is an ESA microsatellite from the PROBA (Project for On-Board Autonomy), where V is the abbreviation of the VEGETATION series. It was developed mainly by a Belgian consortium (Qinetiq Space, OIP, and VITO) with a small contribution notably from Luxembourg and Canada via the GSTP program of the ESA [38]. The main mission of PROBA-V is to take over from the VEGETATION instrument on board the Spot 4 and 5 satellites. It analyses a time series of low-resolution images and characterization of vegetation seasons using the “Time series viewer” developed by VITO available at this link [39]. For more detail about PROBA-V, the reader cordially invited to consult the paper of [40,41,42].

3.2. Trend Analysis Methods

Before assessing land cover using NDVI based on Landsat 8 and Sentinel-2 imagery, the nonparametric statistics tests as Man Kendall (MK) [43,44] and Sen Slope estimator [45] have been applied on long terms time series of NDVI for each year of VITO that obtained from ESA microsatellite of PROBA, wherein the observations of NDVI reach 37 values each year.

3.2.1. Man Kendall Test

The Mann-Kendall test (MK) is a nonparametric statistic test [43,44] that used to examine whether a time series has a monotonic rising or descending trend. It does not require that the data be normally distributed.

3.2.2. Sen Slope Estimator Test

Sen (1968) [45] developed the non-parametric method that can be used to detect trends in univariate time series and estimating the slope of trend in the sample of N pairs of data.
The MK and Sen’s tests does not require that the data be normally distributed.

3.3. Land Cover Classification

During this study, a methodology based on the calculation of NDVI from raster images using Landsat 8 and Sentinel-2 images of the same period (2021/2022) in order to compare the precision of the supervised classification of each one and choose the best images for the mapping of the vegetation cover and land use.
The Landsat program was developed in the mid-1960s by the American space agency, NASA at the instigation of the United States Geological Survey (USGS) and the Department of Agriculture. LANDSAT 8 OLI (Operational Land Imager) was Launched in 2013. Is part of a family of high-resolution satellites to better identify developing environments. The satellite covers the earth every 16 days and produces 2 to 4 images every month with 30 m spatial resolution. The databases of LANSAT 8 OLI used in this paper were downloaded from [46].
Sentinel-2 is a series of satellites of the European Space Agency and is part of the Earth observation and monitoring program developed under the Copernicus program, the first two satellites circulate with the phasing of 180° to allow a revisit frequency of 5 days at the equator which offers rich collections of geographical content around the world. The Sentinel-2 satellite incorporates a range of technologies, including radar and multispectral imaging instruments for land, oceans and atmospheres, enabling it to monitor vegetation, land and water cover, pathways inland waterways, and coastal areas. For land classification, the National Geographic Society used billions of human-labeled pixels to train a deep learning model.
The databases of Sentinel-2 from Esri’s beta Sentinel-2 image service for the last five year from 2017 used in this paper are with 10 m spatial resolution were downloaded from ArcGIS Living Atlas of the World [47]. The map values of the 11 classes were coded as: 0: No Data, 1: Water, 2: Trees, 3: Grass, 4: Flooded vegetation, 5: Crops, 6: Scrub/shrub, 7: Built area, 8: Bare ground, 9: Snow/ice, and 10: Clouds.

3.4. The Normalized Difference Vegetation Index

The normalized difference vegetation index (NDVI) is a vegetation index which is defined as the normalized difference of the spectral reflectance measurements acquired in the “Near Infra-Red” (“NIR”) and “Red” wavelength zones. It makes it possible to discriminate the pixels, which represent the vegetation. The NDVI calculation is given as follow:
N D V I = ( P I R R o u g e ) ( P I R + R o u g e )
In the present case, the NDVI for Landsat 8 were computed by the following equation:
N D V I = ( B a n d   5 B a n d   4 ) ( B a n d   5 + B a n d   4 )  
Which explain that band 4 correspond to RED and NIR correspond to band 5.
The theoretical NDVI value varies between −1 and 1. In practice, a surface of open water (ocean, lake, etc.) will take NDVI values close to 0, bare ground will take values of 0.1 to 0.2, whereas a dense vegetation will have values ranging from 0.5 to 0.8.

3.5. Accuracy Assessment of the Supervised Classification

The most used method to assess the accuracy supervised classification map is to generate a set of random of user points (Figure 2) from the ground truth data and compare these data to the classified data in a confusion matrix. The user point is a point that is randomly selected from the obtained land cover classification of Arcgis, and it is compared with what is actually (really or producer point) present by Google earth. In the present study, they were used 70 randomly user points to assess the supervised classification. The user accuracy, producer accuracy, overall accuracy and kappa coefficient calculated by the Equations (3)–(6), respectively. The producer accuracy is based on experimenter classification point of view (obtained from the software or the algorithm) and user accuracy shows the reality on ground, for example, if user accuracy is 100% means the experimenter classified item is 100% of mapped area in actually that items other may not referred to that item.
Users   accuarcy = Number   of   correctly   classified   pixels   in   each   category Total   number   of   classified   pixels   in   that   category   ( the   row   total ) × 100
Producer   accuarcy = Number   of   correctly   classified   pixels   in   each   category Total   number   of   classified   pixels   in   that   category   ( the   column   total ) × 100
The overall accuracy is calculated by summing the number of correctly classified values and dividing by the total number of values. It is givens as follows:
Overall   accuarcy = Number   of   correctly   classified   pixels   ( Diagonal ) Total   number   of   refrence   pixels   × 100
The kappa coefficient is given by the Equation (6). If the kappa coefficient equals to 1, then the classified image and the ground truth image are totally identical.
Kappa   coefficient   ( T ) = ( TS × TCS )   ( c o l u m n   t o t a l r a w   t o t a l ) ( TS 2 )   ( c o l u m n   t o t a l r a w   t o t a l )   × 100
where, TCS is the total number of correctly classified pixels (Diagonal) and TS is the number of user points (sampled points) used for the validation process.
Figure 2 indicates the flowchart diagram used for assessing land and vegetation cover and more understanding the hydro-morphological (topographic features) of the basin or the study area (Figure 1), by downloading the digital elevation model (DEMs) from SRTM, where, the spectral bands and indices features were obtained from Landsat and Sentinel-2 images. After this, at the image processing stage, the fast line-of-sight atmospheric analysis of spectral hypercubes (FLAASH) algorithm were applied as a tool to remove the effects of the atmosphere and correct purposes from remote sensing databases imageries. The next stage is the composite analysis and computing of the spectral indices using ArcGIS to obtain the land use classification, where, the supervised classification has been applied by comparing the obtained results of land and that obtained from Google earth (ground truth data). Finally, the validation of classification accuracy was obtained using the error matrix and kappa test, which are discussed in the next section.

4. Results

The results of MK and Sen’s slope tests indicate negative trends of NDVI for the years 2014, 2015, 2016, 2017, and 2021, and a positive trend of NDVI in 2018, 2019, 2020, where the trend is significant in the years 2014, 2018, and 2021 (Table 1). Figure 3a illustrates the monthly temporal fluctuations of NDVI and rainfall in the study area between 31 September 2013 and 1 July 2020, while Figure 3b indicates the relationship between NDVI and rainfall. Figure 3a revealed positive values of NDVI values at the scale of Al Baha region with high positive fluctuation observed in 2014, 2016 and 2020, which may indicate the increase of vegetation cover in these years. The rainfall in Al Baha region is very low, and does not exceed 25 mm/month. On the other hand, the relationship between NDVI and rainfall indicates a poor relationship with a low determination coefficient of 0.0022.
In this section, high-resolution 30 m Landsat 8 OLI and Esriv10 m Sentinel-2 satellite imagery downloaded on 5 March 2022 and 1 January 2022, respectively, were assessed using GIS, Google Earth pro, error matrix and kappa test, where the best satellite imagery will use for land cover classification and assessment of the Al Baha region. User accuracy, producer accuracy, overall accuracy, and kappa test were calculated based on error matrix (Figure 4 and Figure 5; Table 2 and Table 3) using 70 supervised random points from Google Earth professional.
The use points were selected from the various locations representing various land cover/use classes (Figure 4a,b). The Error matrix was elaborated for each land cover class, where the classification accuracies were assessed using total, user, and producer accuracy values.
The results of the error matrix of Landsat 8 and Sentinel 2 imagery are shown on Table 3, respectively. Figure 5a,b and Figure 5b,c explain in detail producer accuracy, overall accuracy and kappa test for Landsat 8 and Esri Sentinel 2, respectively.
The overall accuracy using the supervised Google earth method for Landsat-8 data was found to be 100, 93.75, 83.33, 100 and 75% for water bodies, desert grassland, small trees/flooded vegetation, built area/roads/dry wadi, and vegetation/grass, respectively, where the lowest accuracy value was obtained at bare ground/Mountain by 31% (Figure 5a). Which are influences on overall accuracy and Kappa test values by 64% and 55%, respectively (Figure 5b).
For Esri Sentinel-2, data was found as 88.89, 100, 100, 88.24, and 100% for water bodies/river, trees, flooded vegetation, built area, and road and bare ground/rocky mountain, respectively. Moreover, crops and desert rangeland are observed as good with an acceptable accuracy equal to 84.62 and 75%, respectively (Figure 5c). The overall accuracy was 87%, whereas the Kappa test value reached 0.84, respectively (Figure 5d). From the obtained results, the Esri Sentinel-2 imagery will be used in the next sections for land cover change and assessment for the Al Baha region.
Based on existing artificial intelligence (AI) and a massive and large training dataset of billions of human-labeled image pixels, these models were applied to the entire Sentinel-2 scene collection for each year from 2017 to 2021. A 9-class map of the surface was elaborated including water, vegetation types, cropland, barre surface and built areas. In addition, to Figure 4b of the land cover for the year 2021/2022, Figure 6 explains the land cover classification change based Esri Sentinel-2 imagery for the year 2017/2018 (Figure 6a), 2018/2019 (Figure 6b), 2019/2020 (Figure 6c) and 2020/2021 (Figure 6d). Thus, in this section, land cover change will be assessed using databases of five years.
Figure 7 explains the general change at the scale of all Al Baha region in km2 from 2017 to 2021. Where the mapping of area in (km2) for each land cover class at the scale of each district of Al Baha was represented in Figure 8a–g. The change in the area (km2) of each class by the district for the years 2018/2019, 2019/2020, 2020/2021, and 2021/2022 compared to the year 2017/2018 are explained in Figure 9a–f. According to Figure 7, the area of water bodies in the year 2017/2018 was 5.74 km2, mostly localized only on Alaqiq, Baljurish, and Elmelkhwah, which accounted for 37, 36, and 21% (2.15, 2.07 and 1.23 km2) of the water bodies area (Figure 8a). This is linked to a large water reservoir dam. Moreover, the analysis indicates that there are no water bodies at Alatawlah, ELBahah, and Elmandaq. Between the year 2018/2019 to 2021/2022 the water bodies area of the study region have been increased from 0.73 to 1.75 km2 most observed at Baljurish by 1.13 km2 (50%) in the year 2021/2022, where the water bodies have shown some increase was observed in 2019/2020 (Figure 7, Figure 8a and Figure 9a). Between 2018/2019 and 2021/2021 small area of water bodies has been observed at Alatawlah ELBahah, Elmandaq, and Qelwah (Figure 8a and Figure 9a).
The built area at a scale of Al Baha region is estimated in the year 2017–2018 to be 516.5 km2, wherein the most built areas have been concentrated in ELBahah, Baljurish and Alaqiq by 30, 26, and 20% (159, 135.8 and 104.9 km2), respectively. In addition, the built areas in Alatawlah, Elmelkhwah, Qelwah, Elmandaq are 63.69, 24.26, 16.97, 12.01 km2, respectively (Figure 7 and Figure 8b). The evolution analysis of the built area in Al Baha region indicates a great increase during the study period (2017–2021) (Figure 7, Figure 8b, and Figure 9b). The maps of Figure 8b indicate a small increase in built areas at the scale of the study area of 2.02 km2. In 2018/2019, a very remarkable decrease in the built area of Alaqiq and Baljurish district by 2.98 km2 (from 135.80 to 101.97 km2) and 5.94 km2 (from 104.9 to 129.86 km2) (Figure 8b and Figure 9b). This decrease may be a result of the demolition of buildings and fragile villages and planned reconstruction in the future for the sake of economic visions. According to Figure 7, a great increase in built area in Al Baha region from the year 2019 to 2021 or between 2017 and 2021 was estimated at 144 km2 (from 516.5 to 661.07 km2). For example, Qelwah district has known an increase by 160% (from 16.97 to 44.16 km2), followed by Elmelkhwah by 93% (from 24.25 to 44.87 km2) (Figure 8b and Figure 9b). Moreover, at Alaqiq, Alatawlah, Baljurish, ELBahah, and Elmandaq, an increase of built area was observed between 16 and 32%.
In the year 2017/2018, the desert rangeland was estimated at approximately 9812.3 km2 at scale of Al Baha region, with a small increase in the next year by 43 km2, which reached 9856.32 km2 (Figure 7, Figure 8c and Figure 9c). After 2018–2019, the desert rangeland has augmented approximately by 213 km2, with a total growth of 256 km2 (Figure 7, Figure 8c and Figure 9c). This increase in 2019/2020 was observed in Alaqiq, Alatawlah, Baljurish, Elmelkhwah, and Qelwah by 50.69, 55.25, 25.46, 40.92, and 103.66 km2, respectively (Figure 8c). Conversely, ELBahah has known a diminution on desert rangeland with 17.91 km2 from 2017/2018 (Figure 7, Figure 8c and Figure 9c). In 2019/2020, the area of desert rangeland was 10,068.59 km2, and it decreased to 10,048.98 km2 by 20 km2 in 2020–2021. In the 2021–2022, the area of desert rangeland also has been declined from 10048.98 km2 to 9972.92 km2 by 76 km2, which indicates a decrease in desert rangeland by 160.5 km2 between 2017 and 2021 (Figure 7, Figure 8c and Figure 9c).
The analysis of the obtained results revealed that the area of bare ground/rocky mountain in 2017/2018 was 759.6 km2. After one year (2018/2019), the area bare ground/rocky mountains has decreased by 42.63 (from 759.6 to 716.99 km2) (Figure 7, Figure 8d and Figure 9d). The year 2019/2020 was known as an exceptional and remarkable year where the bare ground/rocky mountain area has been decreased significantly by 326.68 km2 from 716.99 km2 (2018/2019) to 432.95 km2 (2019/2020), where the total area continued declining to 394.52 km2 for 2020/2021 (Figure 7, Figure 8d and Figure 9d). On the other hand, the bare ground/rocky mountain area augmented by 44.23 km2 in 2021/2022 from 394.52 km2 to 438.74 km2. Overall, the bare ground/rocky mountain area has decreased by approximately 40% at scale of Al Baha region in the 2017–2021 period (Figure 7, Figure 8d and Figure 9d).
Moreover, at the scale of the district of Al Baha region as Qelwah, Elmelkhwah, Elmandaq Baljurish and Alaqiq, the bare ground/rocky mountain area has been reduced by 80.61, 68.23, 56.26, 36.57 and 23.28%, where the year 2019/2020 is the most impacted year (Figure 7, Figure 8d and Figure 9d).
The crop area was estimated at 10.39 km2 in the 2017/2018 year. According to the obtained results, the crops lands have increased by 162.74% in the 2017–2021 period from 10.39 km2 to 16.90 km2 at the scale of all Al Baha region (Figure 7, Figure 8e and Figure 9e). Where Qelwah and Elmelkhwah are the most districts that contributes to this increase in cropland by 862.48 % (from 1.96 km2 to 18.86 km2) and 118.05 % (from 2.960 km2 to 6.45 km2), respectively (Figure 7, Figure 8e and Figure 9e). On the contrary, Alatawlah and ELBahah have known a diminution in crops area by 88.59% (from 1.19 km2 to 0.14 km2) and 87.31% (from 3.00 km2 to 0.38 km2), respectively (Figure 7, Figure 8e and Figure 9e). On the other hand, the analysis of the obtained results indicates that trees area are very small at the scale of study region, where the trees area is estimated at approximately 0.05 km2 in 2017 with an increase of 328% (0.22 km2), most of which is localized in Qelwah (Figure 7, Figure 8f and Figure 9f).

5. Discussion

The low relationship between rainfall and NDVI indicates that there is no direct relationship between them and that rainfall does not influence vegetation cover directly. This result agrees with Ding et al. [48], who explains that the effect of rainfall on vegetation was small and low in desert areas and forests. Moreover, Guan et al. [49] reported that NDVI negatively correlated with rainfall in the oasis area. Conversely, for high rainfall, Davenport, and Nicholson [50] reported that there is a good relationship between rainfall and the NDVI that may be observed when rainfall is below about 1000/year and does not exceed ~200 mm/month.
From the analysis, the accuracy results obtained from Esri Sentinel-2 data are higher than the accuracy results of Landsat-8 data. This can be explained by the high resolution of Sentinel 2 data compared to Landsat 8 data. These results agree with results obtained by Topaloğlu et al. [51], which assessed the classification accuracies of Landsat-8 and Sentinel-2 data for land cover / use mapping using support vector machine (SVM) and maximum likelihood (MLC) classification. The results of classification accuracy indicate that the Landsat-8 image gives an accuracy of 70.60% and 81.67% for MLC and SVM, respectively. While Sentinel-2 image -8 image gives 76.40% and 84.17% for MLC and SVM, respectively. Sánchez-Espinosa and Schröder [52] studied Sentinel-2 and Landsat 8 images for land cover and land use mapping in wetlands areas. The results revealed that for most LULC classes that the overall accuracy was around 87–88% with slightly enhanced results when using Sentinel-2. In the Brazilian Amazon, Lima et al. [53] compared Landsat 8 OLI and Sentinel-2 MSI imagery for monitoring selective logging. In terms of accuracy, both indicates the same performances for detecting the area-adjusted of selective logging by approximately 95.7% and 96.7% for Landsat 8 and Sentinel-2, respectively. In a Mediterranean pine ecosystem in Greece, Mallinis et al. [54] assessed and compared Landsat-8 OLI and Sentinel 2A spectral indices for estimating fire severity. The comparison results show a slightly greater classification accuracy for Sentinel 2A (73.33%) than Landsat-8 OLI (71.11%), which indicates the adequacy of Sentinel 2A for forest fire severity mapping and assessment in Mediterranean pine ecosystems.
According to results obtained from the land cover assessments, the area of water bodies in the 2017/2018 period was 5.74 km2 most localized only on Alaqiq, Baljurish and Elmelkhwah, this may be linked to water reservoir dam that exceeds 17 dams as Madhas and Beedah dams with a capacity of 1,500,000 and 3,000,000 m3 respectively, where 86% of these water storage are addressed to irrigation purposes [55]. In addition, more than 14 dams in El Baha region with years of construction between 2008–2012 have been reported in the paper of El-Hazek [56]. This explains the great efforts that have be carried out by the Kingdom of Saudi Arabia in the framework of sustainable water resources management.
The urban environment of the Middle East and North Africa (MENA) countries is today under great pressure due to the very rapid rate of urbanization recorded over the past 10 years. The Al Baha region is one of the large part of Saudi Arabia that has been known by its great development in the last ten years. In the Al Baha region, the development analysis of the built area during the study period (2017/2021) shows a great increase exceeding 650 km2. This increase can be explained by Figure 1c and Figure 4, which indicate that most of the built area is localized in the mountain area of high altitude, confirming that the decrease in bare ground/rocky mountain area and desert rangeland area can be interpreted by growing urbanization. According to Elzamil and ElQarni [57], the urban expansion had negative effects on agricultural areas and vegetation cover in forests. The random urban sprawl was represented by irregular encroachments on natural sites and open lands, which led to the emergence of many villages and the scattering of small urban communities. Many mountainous sites and natural agricultural terraces have also been transformed into housing schemes due to the increasing demand for built-up lands. Similarly, Alqurashi and Kumar [23] observed that built areas have increased from 1986 to 2013 by approximately 174% and 113% in Makkah and Al-Taif, respectively.
The crop lands have increased by 162.74% in the 2017–2021 period from 10.39 km2 to 16.90 km2 at the scale of the entire Al Baha region. This increase is part of the establishment of the Coffee Development Cities plan on a total area of 1.6 km2, with an operational capacity aimed at providing 1000 job opportunities, planting 300,000 coffee trees, and rehabilitating agricultural terraces and harvesting rainwater, contributing to the rehabilitation of 114 coffee farms in the Al Baha region. Here, 17,000 seedlings were distributed free of charge, which will raise the standard of living of small farmers and increase efficiency and productivity [58].
The flooded vegetation was observed only at Elmelkhwah and Qelwah from 2020/2021 with a total area of 0.08 km2 (Figure 7 and Figure 8g), Where, the increasing vegetation cover has been observed due to rising afforestation in the urban areas, this is also reported by Alqurashi and Kumar [23] at the desert cities of Makkah and Al-Taif.

6. Conclusions

In this paper, the land cover of Al Baha region (south-western Saudi Arabia) was assessed, classified, and analyzed using remote sensing databases and time series analysis combined with spatial analysis in a geographic information system (GIS) based on high-resolution Landsat 8 OLI, Sentinel-2 satellite imagery between the period of study 2017/2018 and 2021/2022. The obtained results are summarized as follows:
  • Esri Sentinel-2 imagery gives the highest performance compared to Landsat 8 OLI with accuracy and kappa test equal to 87% and 84%, respectively.
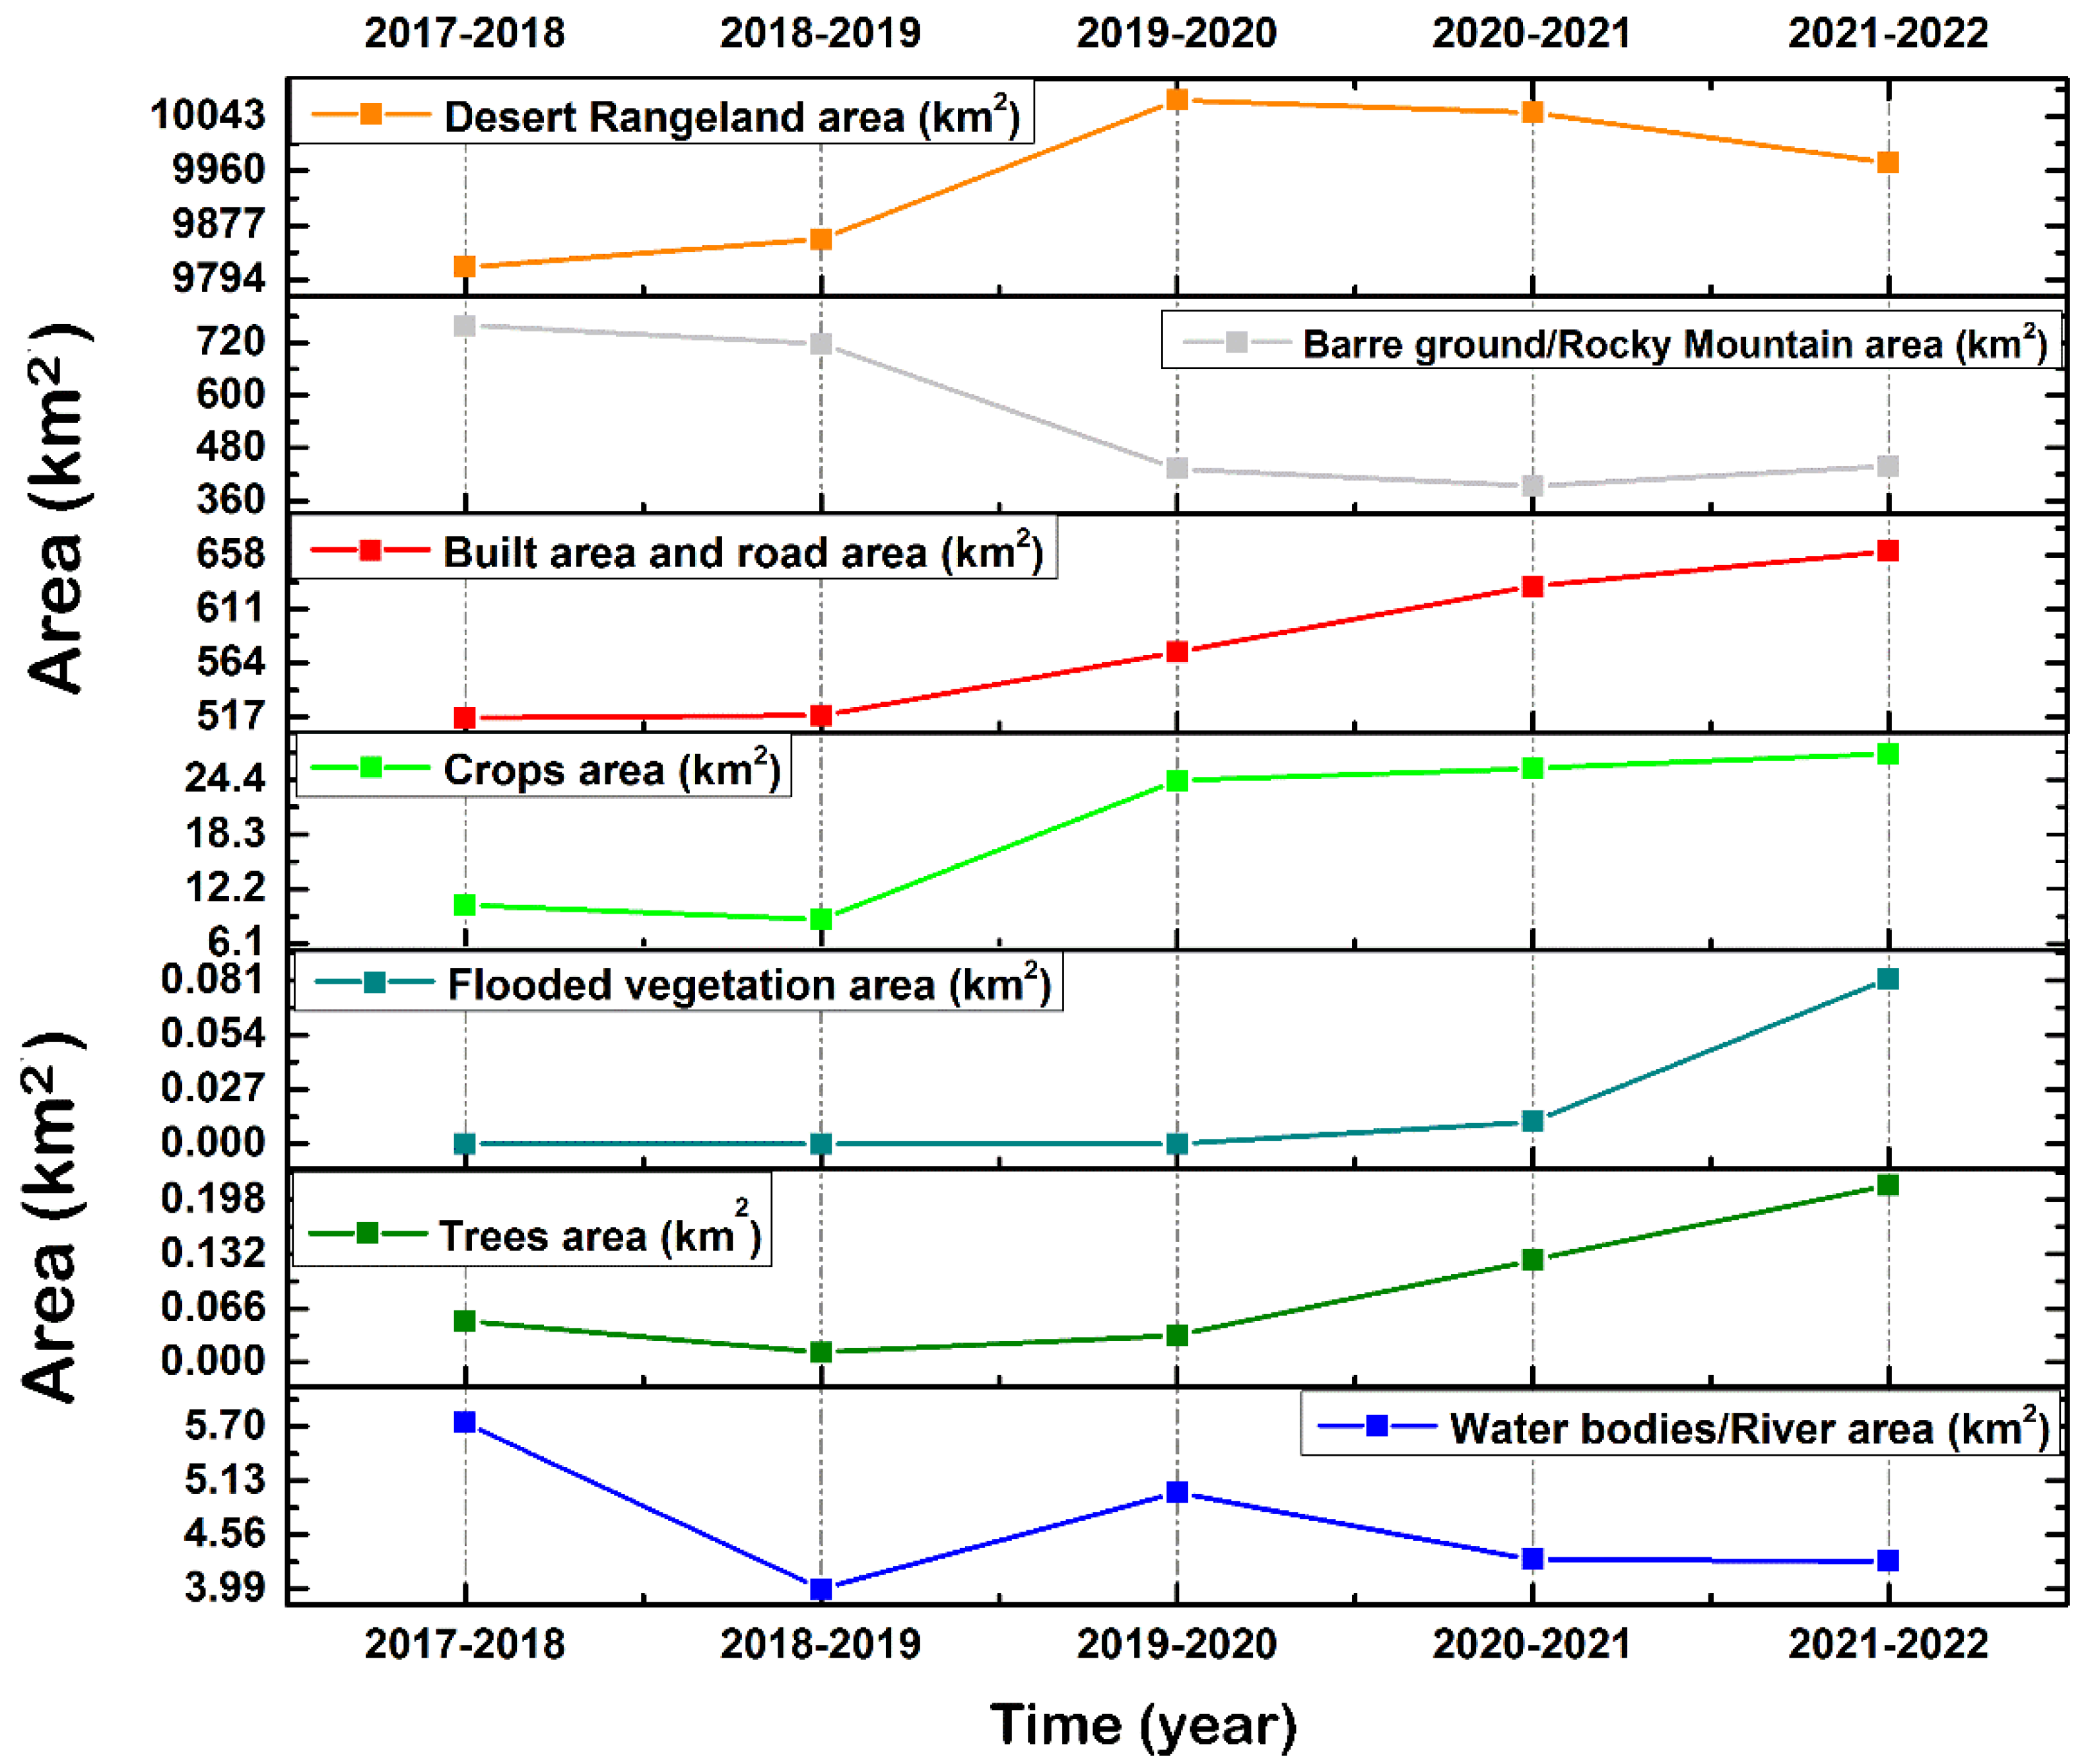
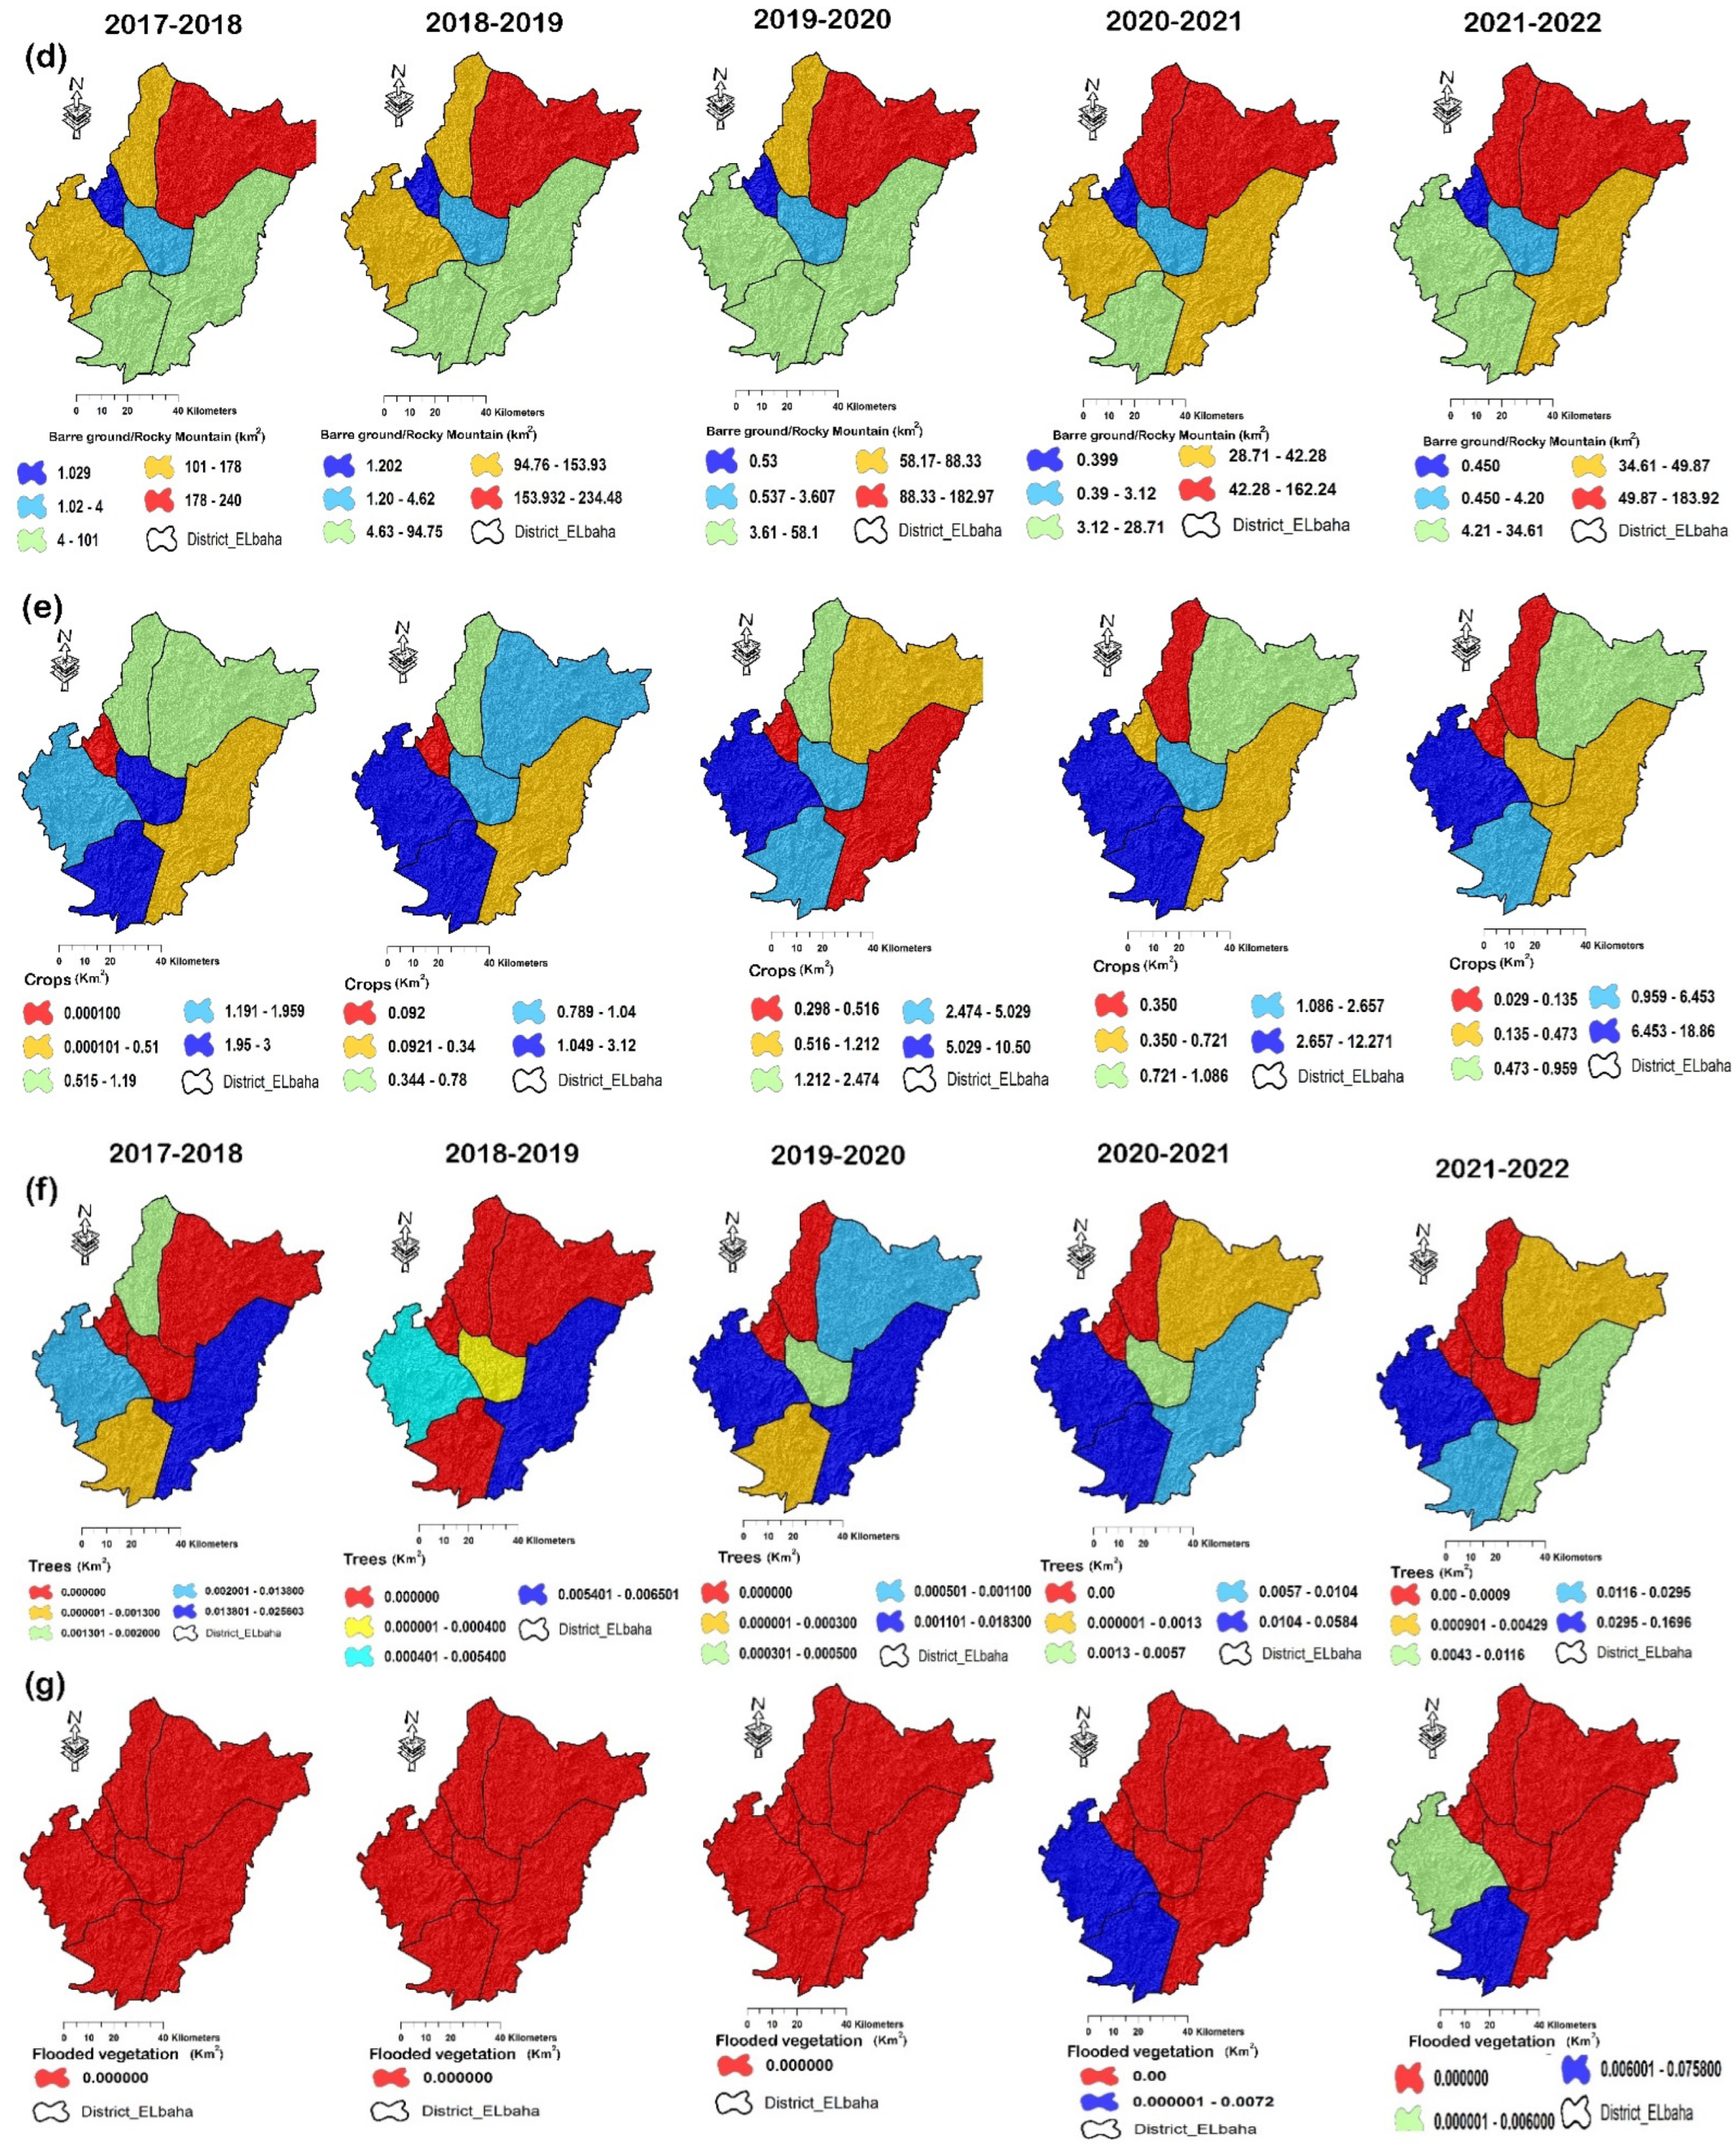
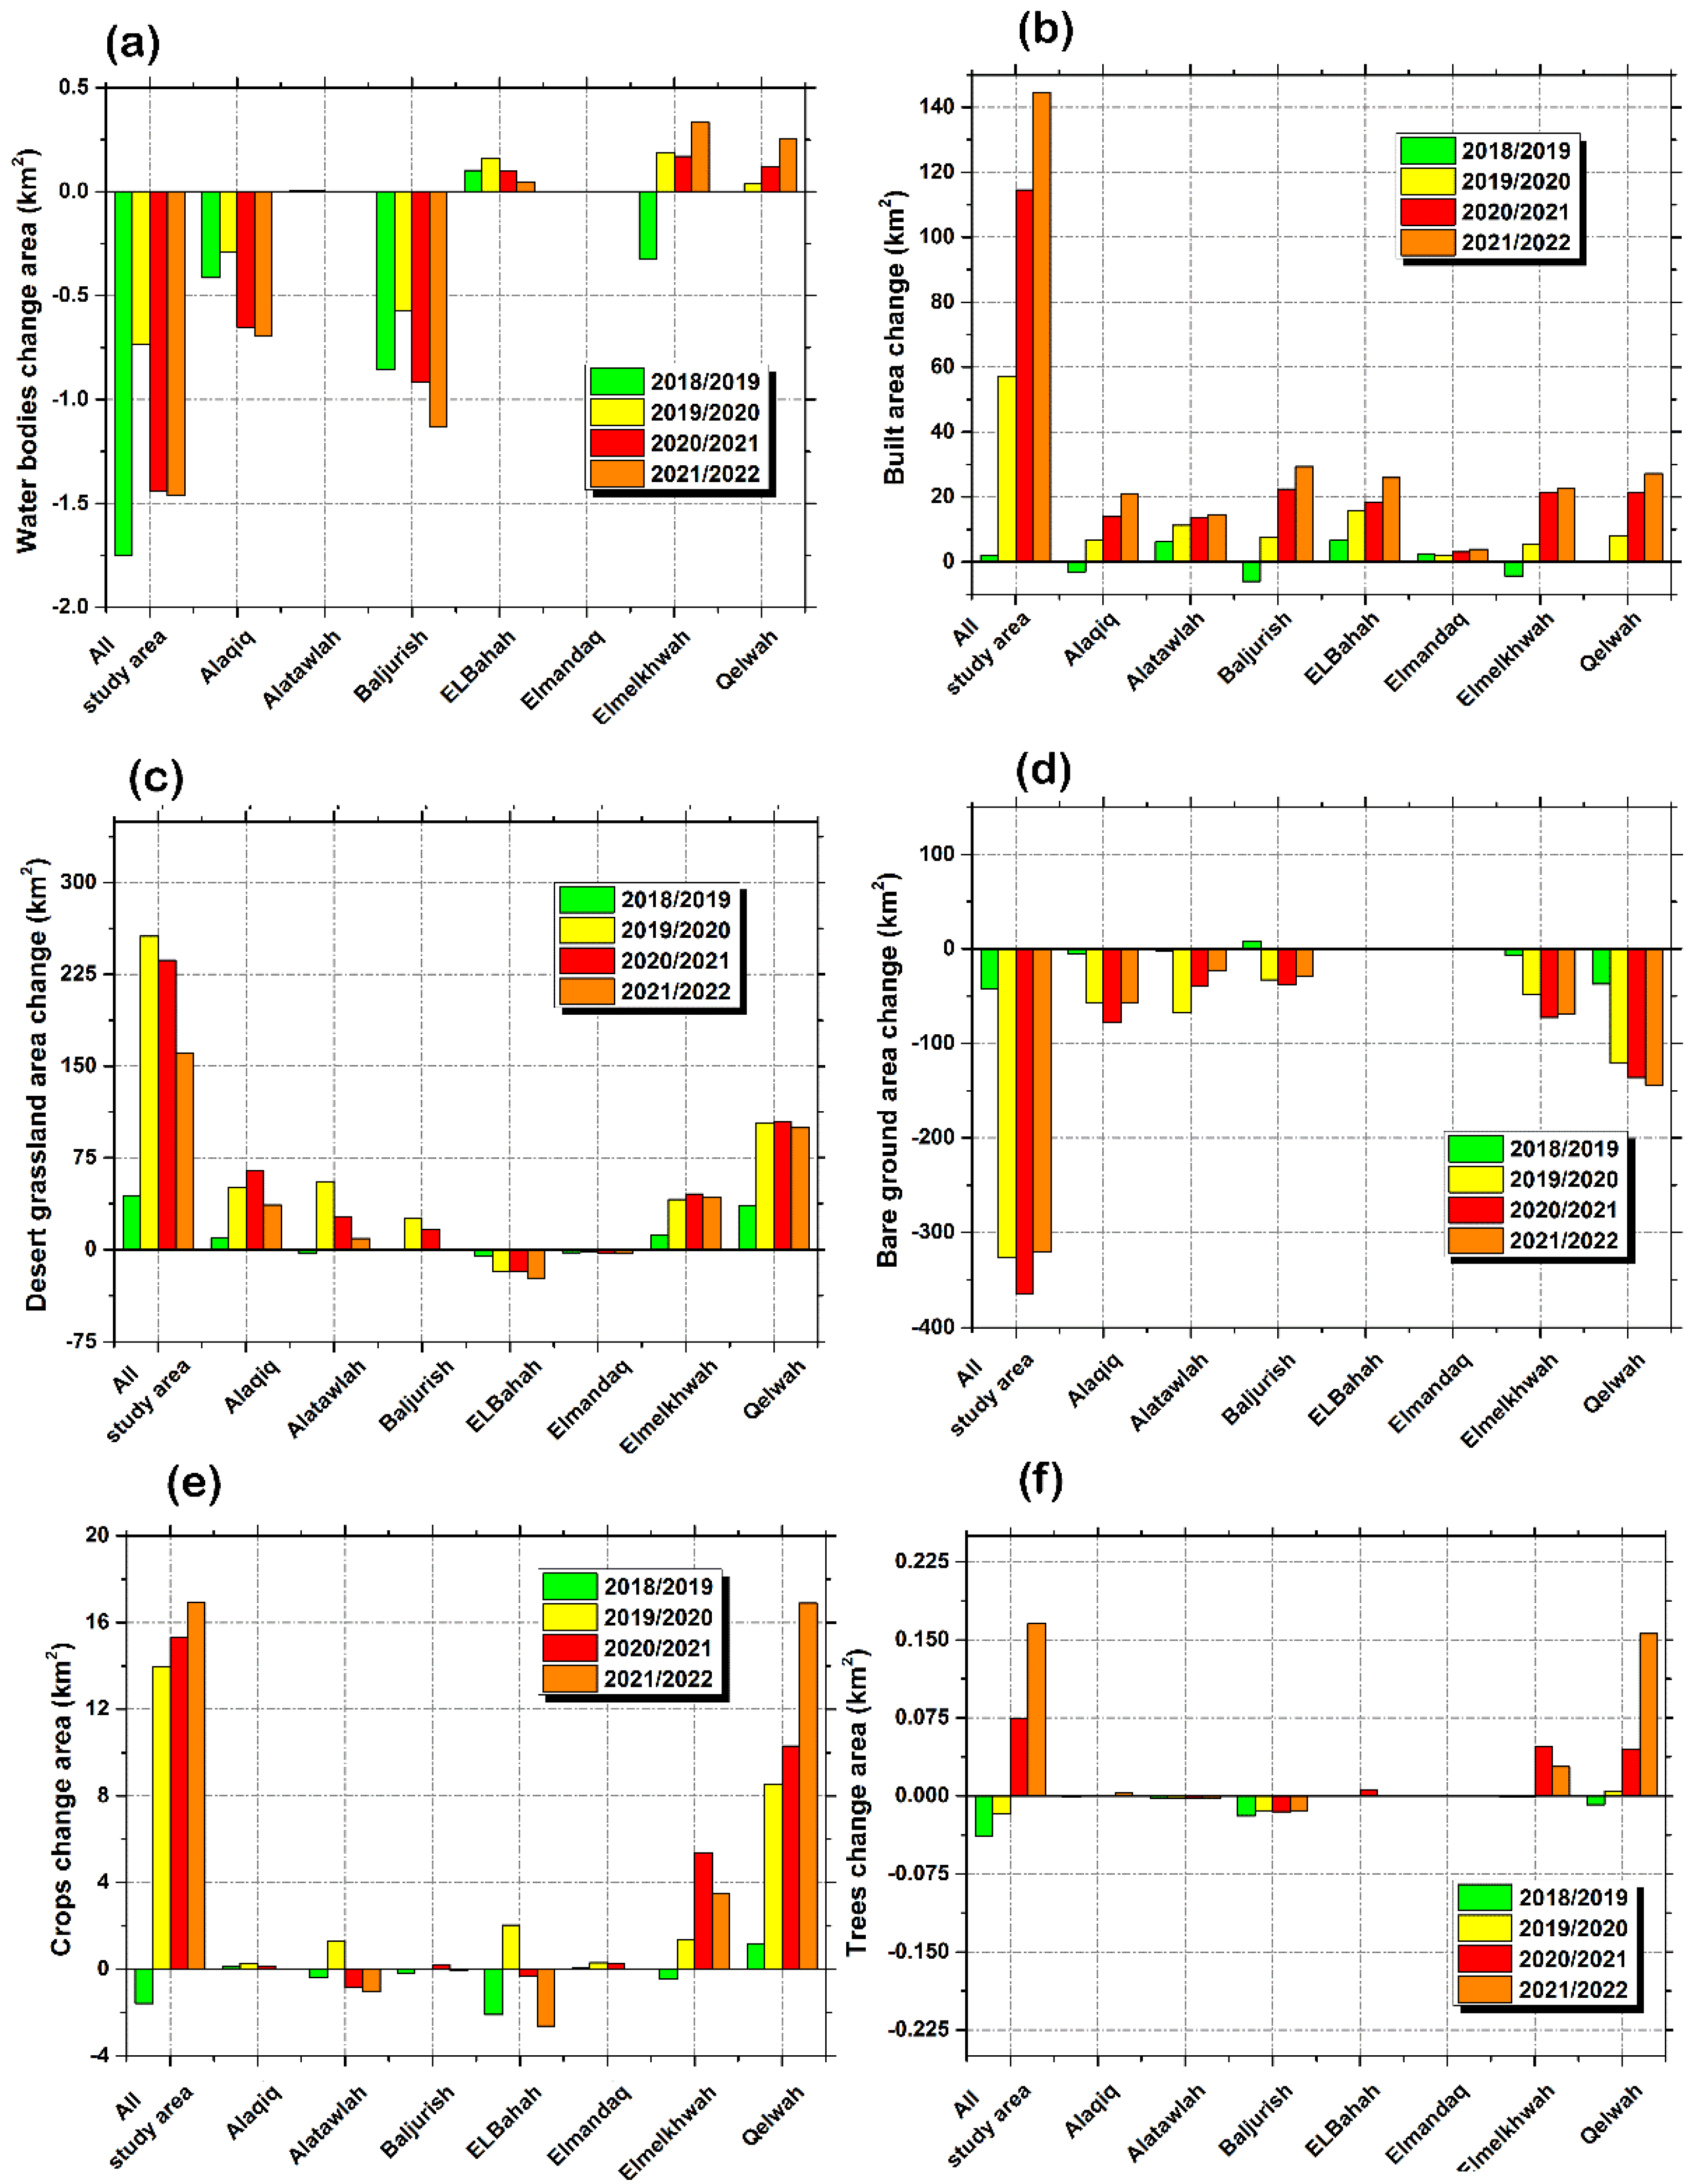
  • The land cover classification revealed that the large area of water bodies is localized on Alaqiq (1.45 km2), Baljurish (0.94 km2), and Elmelkhwah (1.57 km2).
  • The analysis indicates a great increase in built area between 2017 and 2021 estimated approximately 144 km2 or 28% (from 516.5 to 661.07 km2), especially for Qelwah district by 160% (from 16.97 to 44.16 km2) and Elmelkhwah by 93.06% (from 24.25 to 46.97 km2).
  • Overall, the bare ground/rocky mountain area has decreased by approximately 40% at the scale of Al Baha region in the 2017–2021 period most observed in Qelwah (−85%), Elmelkhwah (−68%) and Baljurish (−36%).
  • By an area of 9812.3 km2, the desert rangeland area was increased by 160 km2 between 2017/2018 and 2021/2022. For example, Elmelkhwah has been augmented by 3.38% (from 1256 to 1299 km2) and Qelwah by 5.90% (from 1686 to 1785 km2). Conversely, ELBahah has experienced decline in desert rangeland by 4.26% (from 558 to 534 km2), which can be explained by urban growth.
Finally, the results obtained by this research can help decision-makers and managers of the Al Baha region better understand the cover land of the study area for better natural resources management, especially with the insufficiency and limited number of elaborated papers in this context. This represents the main strength of this paper. However, it is worth noting that the main weakness of this paper was the use of short period of study with the advantage of Esri high-resolution imagery, where the long-term period of databases can improve the analyses of the cover land.

Author Contributions

R.Y.S. and M.A.A. conceived the framework of this research, processed data, designed the experiments, plots, and map preparation, validated the processing results, and wrote the manuscript. B.A.M. and A.A.A. gave feedback on the written manuscript and helped to analyze and edit the manuscript for proper English language, grammar, punctuation, spelling, and technical improvements. All authors have read and agreed to the published version of the manuscript.

Funding

There is a fund of 200,000 Saudi Riyal. This research is funded by Ministry of High education and Al-Baha University (Kingdom of Saudi Arabia). The contract number is MOE-BU-11-2020.

Institutional Review Board Statement

Not applicable.

Informed Consent Statement

Not applicable.

Data Availability Statement

The data that support the findings of this study are available from the corresponding author, [RS], upon reasonable request.

Acknowledgments

We would like to thank the Ministry of High education and Al-Baha University (Kingdom of Saudi Arabia) for sponsoring this research which is a part of the research agreement of the Institutional Funding Program for Research and Development conducted in 2022 under the project title of Developing Digital Mapping for Al-Baha Region Using information systems (GIS). The contract number is MOE-BU-11-2020.

Conflicts of Interest

The authors declare no conflict of interest.

References

  1. Fischlin, A.; Midgley, G.F.; Price, J.T.; Leemans, R.; Gopal, B.; Turley, C.; Rounsevell, M.D.A.; Dube, O.P.; Tarazona, J.; Velichko, A.A. Ecosystems, their properties, goods, and services. In Climate Change: Impacts, Adaptation and Vulnerability; Contribution of Working Group II to the Fourth Assessment Report of the Intergovernmental Panel on Climate Change; Parry, M.L., Canziani, O.F., Palutikof, J.P., van der Linden, P.J., Hanson, C.E., Eds.; Cambridge University Press: Cambridge, UK, 2007; pp. 211–272. [Google Scholar]
  2. Food and Agriculture Organization of the United Nations. Land Use in Agriculture by the Numbers. Available online: https://www.fao.org/sustainability/news/detail/en/c/1274219/ (accessed on 1 May 2022).
  3. Nath, B.; Ni-Meister, W.; Choudhury, R. Impact of urbanization on land use and land cover change in Guwahati city, India and its implication on declining groundwater level. Groundw. Sustain. Dev. 2021, 12, 100500. [Google Scholar] [CrossRef]
  4. Galleguillos, M.; Gimeno, F.; Puelma, C.; Zambrano-Bigiarini, M.; Lara, A.; Rojas, M. Disentangling the effect of future land use strategies and climate change on streamflow in a Mediterranean catchment dominated by tree plantations. J. Hydrol. 2021, 595, 126047. [Google Scholar] [CrossRef]
  5. Zerouali, B.; Chettih, M.; Alwetaishi, M.; Abda, Z.; Elbeltagi, A.; Santos, C.A.G.; Hussein, E.E. Evaluation of Karst Spring Discharge Response Using Time-Scale-Based Methods for a Mediterranean Basin of Northern Algeria. Water 2021, 13, 2946. [Google Scholar] [CrossRef]
  6. Dimple, D.; Rajput, J.; Al-Ansari, N.; Elbeltagi, A.; Zerouali, B.; Santos, C.A.G. Determining the Hydrological Behaviour of Catchment Based on Quantitative Morphometric Analysis in the Hard Rock Area of Nand Samand Catchment, Rajasthan, India. Hydrology 2022, 9, 31. [Google Scholar] [CrossRef]
  7. Stavi, I.; de Pinho, J.R.; Paschalidou, A.K.; Adamo, S.B.; Galvin, K.; de Sherbinin, A.; Even, T.; Heaviside, C.; van der Geest, K. Food security among dryland pastoralists and agropastoralists: The climate, land-use change, and population dynamics nexus. Anthr. Rev. 2021, 20530196211007512. [Google Scholar] [CrossRef]
  8. Fonseca, C.A.B.D.; Al-Ansari, N.; Silva, R.M.D.; Santos, C.A.G.; Zerouali, B.; Oliveira, D.B.D.; Elbeltagi, A. Investigating Relationships between Runoff–Erosion Processes and Land Use and Land Cover Using Remote Sensing Multiple Gridded Datasets. ISPRS Int. J. Geo-Inf. 2022, 11, 272. [Google Scholar] [CrossRef]
  9. DeFries, R.S.; Townshend, J.R.G. NDVI-derived land cover classifications at a global scale. Int. J. Remote Sens. 1994, 15, 3567–3586. [Google Scholar] [CrossRef]
  10. Lunetta, R.S.; Knight, J.F.; Ediriwickrema, J.; Lyon, J.G.; Worthy, L.D. Land-cover change detection using multi-temporal MODIS NDVI data. Remote Sens. Environ. 2006, 105, 142–154. [Google Scholar] [CrossRef]
  11. Julien, Y.; Sobrino, J.A.; Mattar, C.; Ruescas, A.B.; Jimenez-Munoz, J.C.; Soria, G.; Hidalgo, V.; Atitar, M.; Franch, B.; Cuenca, J. Temporal analysis of normalized difference vegetation index (NDVI) and land surface temperature (LST) parameters to detect changes in the Iberian land cover between 1981 and 2001. Int. J. Remote Sens. 2011, 32, 2057–2068. [Google Scholar] [CrossRef]
  12. Li, W.; Saphores, J.D.M.; Gillespie, T.W. A comparison of the economic benefits of urban green spaces estimated with NDVI and with high-resolution land cover data. Landsc. Urban Plan. 2015, 133, 105–117. [Google Scholar] [CrossRef]
  13. Shao, Y.; Lunetta, R.S.; Wheeler, B.; Iiames, J.S.; Campbell, J. B An evaluation of time-series smoothing algorithms for land-cover classifications using MODIS-NDVI multi-temporal data. Remote Sens. Environ. 2016, 174, 258–265. [Google Scholar] [CrossRef]
  14. Han, J.C.; Huang, Y.; Zhang, H.; Wu, X. Characterization of elevation and land cover dependent trends of NDVI variations in the Hexi region, northwest China. J. Environ. Manag. 2019, 232, 1037–1048. [Google Scholar] [CrossRef] [PubMed]
  15. Novillo, C.J.; Arrogante-Funes, P.; Romero-Calcerrada, R. Recent NDVI trends in mainland Spain: Land-cover and phytoclimatic-type implications. ISPRS Int. J. Geo-Inf. 2019, 8, 43. [Google Scholar] [CrossRef]
  16. Baeza, S.; Paruelo, J.M. Land use/land cover change (2000–2014) in the Rio de la Plata grasslands: An analysis based on MODIS NDVI time series. Remote Sens. 2020, 12, 381. [Google Scholar] [CrossRef]
  17. Palafox-Juárez, E.B.; López-Martínez, J.O.; Hernández-Stefanoni, J.L.; Hernández-Nuñez, H. Impact of urban land-cover changes on the spatial-temporal land surface temperature in a tropical city of Mexico. ISPRS Int. J. Geo-Inf. 2021, 10, 76. [Google Scholar] [CrossRef]
  18. Verhoeven, V.B.; Dedoussi, I.C. Annual satellite-based NDVI-derived land cover of Europe for 2001–2019. J. Environ. Manag. 2022, 302, 113917. [Google Scholar] [CrossRef]
  19. Morawitz, D.F.; Blewett, T.M.; Cohen, A.; Alberti, M. Using NDVI to Assess Vegetative Land Cover Change in Central Puget Sound. Environ. Monit. Assess. 2006, 114, 85–106. [Google Scholar] [CrossRef]
  20. Jeevalakshmi, D.; Reddy, S.N.; Manikiam, B. Land cover classification based on NDVI using LANDSAT8 time series: A case study Tirupati region. In Proceedings of the International Conference on Communication and Signal Processing (ICCSP), Chennai, India, 6–8 April 2016; pp. 1332–1335. [Google Scholar]
  21. Aredehey, G.; Mezgebu, A.; Girma, A. Land-use land-cover classification analysis of Giba catchment using hyper temporal MODIS NDVI satellite images. Int. J. Remote Sens. 2018, 39, 810–821. [Google Scholar] [CrossRef]
  22. Dafalla, M.S.; Ibrahim, I.S.; Abdel Magid, H.M.; Ibrahim, M.M.M.; Elhag, A.M.H. Mapping and Assessment of Land Use/ Land Cover Using Remote Sensing and GIS. Case study: Potential Area for Dates Palm in Al-Qassim Region, Central Saudi Arabia. Int. J. Sci. Res. Publ. 2013, 3, 5. [Google Scholar]
  23. Alqurashi, A.A.; Kumar., L. Land Use and Land Cover Change Detection in the Saudi Arabian Desert Cities of Makkah and Al-Taif Using Satellite Data. Adv. Remote Sens. 2014, 3, 106–119. [Google Scholar] [CrossRef]
  24. Rahman, M.T. Detection of Land Use/Land Cover Changes and Urban Sprawl in Al-Khobar, Saudi Arabia: An Analysis of Multi-Temporal Remote Sensing Data. ISPRS Int. J. Geo-Inf. 2016, 5, 15. [Google Scholar] [CrossRef]
  25. Rahman, M.T.; Aldosary, A.S.; Mortoja, M.G. Modeling Future Land Cover Changes and Their Effects on the Land Surface Temperatures in the Saudi Arabian Eastern Coastal City of Dammam. Land 2017, 6, 36. [Google Scholar] [CrossRef]
  26. Salih, A. Classification and Mapping of Land Cover Types and Attributes in Al-Ahsaa Oasis, Eastern Region, Saudi Arabia Using Landsat-7 Data. J. Remote Sens. GIS 2018, 7, 228. [Google Scholar] [CrossRef]
  27. Abdallah, S.; Elmohemen, M.A.; Hemdan, S.; Ibrahem, K. Assessment of land use/land cover changes induced by Jizan Dam, Saudi Arabia, and their effect on soil organic carbon. Arab. J. Geosci. 2019, 12, 350. [Google Scholar] [CrossRef]
  28. Alharthi, A.; El-Sheikh, M.A.; Elhag, M.; Alatar, A.A.; Abbadi, G.A.; Abdel-Salam, E.M.; Arif, I.A.; Baeshen, A.A.; Eid, E.M. Remote sensing of 10 years changes in the vegetation cover of the northwestern coastal land of Red Sea, Saudi Arabia. Saudi J. Biol. Sci. 2020, 27, 3169–3179. [Google Scholar] [CrossRef]
  29. Waltham, N.J.; Elliott, M.; Lee, S.Y.; Lovelock, C.; Duarte, C.M.; Buelow, C.; Simenstad, C.; Nagelkerken, I.; Claassens, L.; Wen, C.K.; et al. UN Decade on Ecosystem Restoration 2021–2030—What chance for success in restoring coastal ecosystems? Front. Mar. Sci. 2020, 7, 71. [Google Scholar] [CrossRef]
  30. Unep. 2022. Available online: https://www.unep.org/ar/alakhbar-walqss/alnshrat-alshfyt/alamm-almthdt-tdw-albldan-aly-alwfa-baltzamatha-lastadt-mlyar (accessed on 3 April 2022).
  31. de AL-Sheikh, A.B.Y. The degradation of vegetation, and its impact on eco-tourism in the Jazan Province. Geogr. Res. 2013, 100–102, 1–61. [Google Scholar]
  32. Oumoudden, S.; Zahrani, K.A. “Tourisification” of the Spiritual and/or spiritualization of the Cultural. Between Pilgrimage and Consumerism. The emergence of religious tourism in Saudi Arabia. Tour. Rev. 2021, 20. [Google Scholar]
  33. Nurunnabi, M. Transformation from an oil-based economy to a knowledge-based economy in Saudi Arabia: The direction of Saudi vision 2030. J. Knowl. Econ. 2017, 8, 536–564. [Google Scholar] [CrossRef]
  34. Khan, S.I. Saudi Vision 2030: New Avenue of Tourism in Saudi Arabia. Stud. Indian Place Names 2020, 70, 2394–3114. [Google Scholar]
  35. Abubakar, I.R.; Dano, U.L. Sustainable urban planning strategies for mitigating climate change in Saudi Arabia. Environ. Dev. Sustain. 2020, 22, 5129–5152. [Google Scholar] [CrossRef]
  36. AlArjani, A.; Modibbo, U.M.; Ali, I.; Sarkar, B. A new framework for the sustainable development goals of Saudi Arabia. J. King Saud Univ. Sci. 2021, 33, 101477. [Google Scholar] [CrossRef]
  37. Alatawi, A.S. Conservation action in Saudi Arabia: Challenges and opportunities. Saudi J. Biol. Sci. 2022, 29, 3466–3472. [Google Scholar] [CrossRef] [PubMed]
  38. Proba-v. Belgian Platform on Earth Observation. Available online: https://eo.belspo.be/fr/proba-v/ (accessed on 1 May 2022).
  39. Proba-v. Belgian Platform on Earth Observation. Available online: https://proba-v-mep.esa.int/applications/time-series-viewer/app/app.html/ (accessed on 1 May 2022).
  40. Dimitrov, P.; Dong, Q.; Eerens, H.; Gikov, A.; Filchev, L.; Roumenina, E.; Jelev, G. Sub-pixel crop type classification using PROBA-V 100 m NDVI time series and reference data from Sentinel-2 classifications. Remote Sens. 2019, 11, 1370. [Google Scholar] [CrossRef]
  41. Hameid, N.A.; Bannari, A. The relationship between vegetation and rainfall in central Sudan. Int. J. Remote Sens. Appl. 2016, 6, 30–40. [Google Scholar]
  42. Zhang, X.; Zhang, M.; Zheng, Y.; Wu, B. Crop mapping using PROBA-V time series data at the Yucheng and Hongxing farm in China. Remote Sens. 2016, 8, 915. [Google Scholar] [CrossRef]
  43. Mann, H.B. Non-parametric tests against trend. Econometrica 1945, 13, 163–171. [Google Scholar] [CrossRef]
  44. Kendall, M.G. Rank Correlation Methods, 4th ed.; Charles Griffin: London, UK, 1975. [Google Scholar]
  45. Sen, P.K. Estimates of the regression coefficient based on Kendall’s tau. Am. Stat. Assoc. Bull. 1968, 63, 1379–1389. [Google Scholar] [CrossRef]
  46. United States Geological Survey. Available online: https://earthexplorer.usgs.gov/ (accessed on 1 October 2021).
  47. Esri and Cover. Available online: https://livingatlas.arcgis.com/landcover/ (accessed on 1 October 2021).
  48. Ding, M.; Zhang, Y.; Liu, L.; Zhang, W.; Wang, Z.; Bai, W. The relationship between NDVI and precipitation on the Tibetan Plateau. J Geogr. Sci. 2007, 17, 259–268. [Google Scholar] [CrossRef]
  49. Guan, Q.; Yang, L.; Guan, W.; Wang, F.; Liu, Z.; Xu, C. Assessing vegetation response to climatic variations and human activities: Spatiotemporal NDVI variations in the Hexi Corridor and surrounding areas from 2000 to 2010. Theor. Appl. Climatol. 2019, 135, 1179–1193. [Google Scholar] [CrossRef]
  50. Davenport and Nicholson. On the relation between rainfall and the Normalized Difference Vegetation Index for diverse vegetation types in East Africa. Int. J. Remote Sens. 1993, 14, 2369–2389. [CrossRef]
  51. Topaloğlu, R.H.; Sertel, E.; Musaoğlu, N. Assessment of classification accuracies of sentinel-2 and landsat-8 data for land cover/use mapping. Int. Arch. Photogramm. Remote Sens. Spat. Inf. Sci. 2016, 41, 1055–1059. [Google Scholar] [CrossRef]
  52. Sánchez-Espinosa, A.; Schröder, C. Land use and land cover mapping in wetlands one step closer to the ground: Sentinel-2 versus landsat 8. J. Environ. Manag. 2019, 247, 484–498. [Google Scholar] [CrossRef] [PubMed]
  53. Lima, T.A.; Beuchle, R.; Langner, A.; Grecchi, R.C.; Griess, V.C.; Achard, F. Comparing Sentinel-2 MSI and Landsat 8 OLI imagery for monitoring selective logging in the Brazilian Amazon. Remote Sens. 2019, 11, 961. [Google Scholar] [CrossRef]
  54. Mallinis, G.; Mitsopoulos, I.; Chrysafi, I. Evaluating and comparing Sentinel 2A and Landsat-8 Operational Land Imager (OLI) spectral indices for estimating fire severity in a Mediterranean pine ecosystem of Greece. Gisci. Remote Sens. 2018, 55, 1–18. [Google Scholar] [CrossRef]
  55. El-Hazek, A.N. Cost of dams in Al-Baha Province, Kingdom of Saudi Arabia. J. Environ. Eng. Sci. 2013, 2, 77. [Google Scholar]
  56. El-Hazek, A.N. Optimum water storage in Al-Baha, Kingdom of Saudi Arabia. Am. J. Environ. Sci. 2014, 4, 19–24. [Google Scholar]
  57. Alzamil, W.; AlQarni, A.A. Urban sprawl on the natural environment in Al-Baha region in the Kingdom of Saudi Arabia. In The Geographical Environment Forum with Vision 2030, (Arabic version); El Aimra University: Riyadh, Saudi Arabia, 2019. (In Arabic) [Google Scholar]
  58. SPA. General/Environment Signing an Agreement to Establish a Coffee Development City in Al-Baha Region. 2021. Available online: https://www.spa.gov.sa/2299787/ (accessed on 1 December 2021).
Figure 1. Representation of (a) area in km2 of each district; (b) Hillshade map; (c) DEM map; (d) Slop map; (e,f) aspect map and contour map of Al Baha region.
Applsci 12 08115 g001
Figure 2. Flowchart diagram used.
Applsci 12 08115 g002
Figure 3. Evolution of (a) rainfall and NDVI of Al Baha region and (b) relationship between them.
Applsci 12 08115 g003
Figure 4. Land cover classification using (a) Landsat 8 OLI and (b) Esri Sentinel-2 for the year 2022.
Applsci 12 08115 g004
Figure 5. Land cover classification assessment based on producer accuracy, overall accuracy, and kappa test for (a,b) Landsat 8 and (c,d) Esri Sentinel-2.
Applsci 12 08115 g005
Figure 6. Land cover classification assessment based on producer accuracy, overall accuracy, and kappa test for (a,b) Landsat 8 and (c,d) Esri Sentinel-2.
Applsci 12 08115 g006
Figure 7. Change in area (km2) of each class of land cover of Al Baha region.
Applsci 12 08115 g007
Figure 8. Change in area of (a) water bodies/river; (b) built area and road; (c) desert rangeland; (d) bare ground/rocky mountain; (e) crops; (f) trees and (g) flooded vegetation.
Applsci 12 08115 g008aApplsci 12 08115 g008b
Figure 9. The change in area (km2) of each class by district for the years 2018–2019, 2019–2020, 2020–2021, and 2021–2022 compared to the year 2017–2018 (for example, the change area of 2018–2019 = the area of 2018–2019—the area of 2017–2018).
Applsci 12 08115 g009
Table 1. Application of Man Kendall (MK) and Sen Slope estimator tests on monthly NDVI of Al Baha region.
Time SeriesNTest ZSignific.QQmin95Qmax95BBmin95Bmax95
20138 *0.006--0.10--
201436−2.17*−0.001−0.0020.0000.130.150.11
201536−0.07 0.0000.0000.0000.100.100.10
201636−0.96 0.000−0.0010.0000.110.130.11
201735−1.38 0.0000.0000.0000.110.120.11
2018372.60**0.0010.0000.0020.090.100.08
2019361.76+0.0010.0000.0010.100.120.09
2020361.59 0.0010.0000.0010.110.120.10
202116−2.08*−0.003−0.0060.0000.150.170.12
Table 2. Error matrix for Landsat-8 classification using user and producer accuracy based on Google earth.
Water BodiesDesert GrasslandBare Ground/MountainSmall Trees/Flooded VegetationBuilt Area/Roads/Dry WadiVegetation/GrassTotal User
Water bodies2000002
Desert grassland0151600031
Bare ground/Mountain0090009
Small Trees/Flooded vegetation003100114
Built area/roads/Dry Wadi0112318
Vegetation/Grass0000066
Total producer21629123870
Table 3. Error matrix for Esri Sentinel-2 classification using user and producer accuracy based on Google earth.
Water Bodies and RiverTreesFlooded VegetationCropsBuilt Area and RoadBare Ground MountainDesert RangelandTotal User
Water bodies and river81000009
Trees03000003
Flooded vegetation00100001
Crops0001111013
Built area and road0001150117
Bare ground Mountain0000011011
Desert Rangeland0000041216
Total producer8411216161370
Publisher’s Note: MDPI stays neutral with regard to jurisdictional claims in published maps and institutional affiliations.

