
Study on a Transparent Similar Rock-Anchoring Structure under Impact Tests and Numerical Simulation Tests

Abstract
:1. Introduction
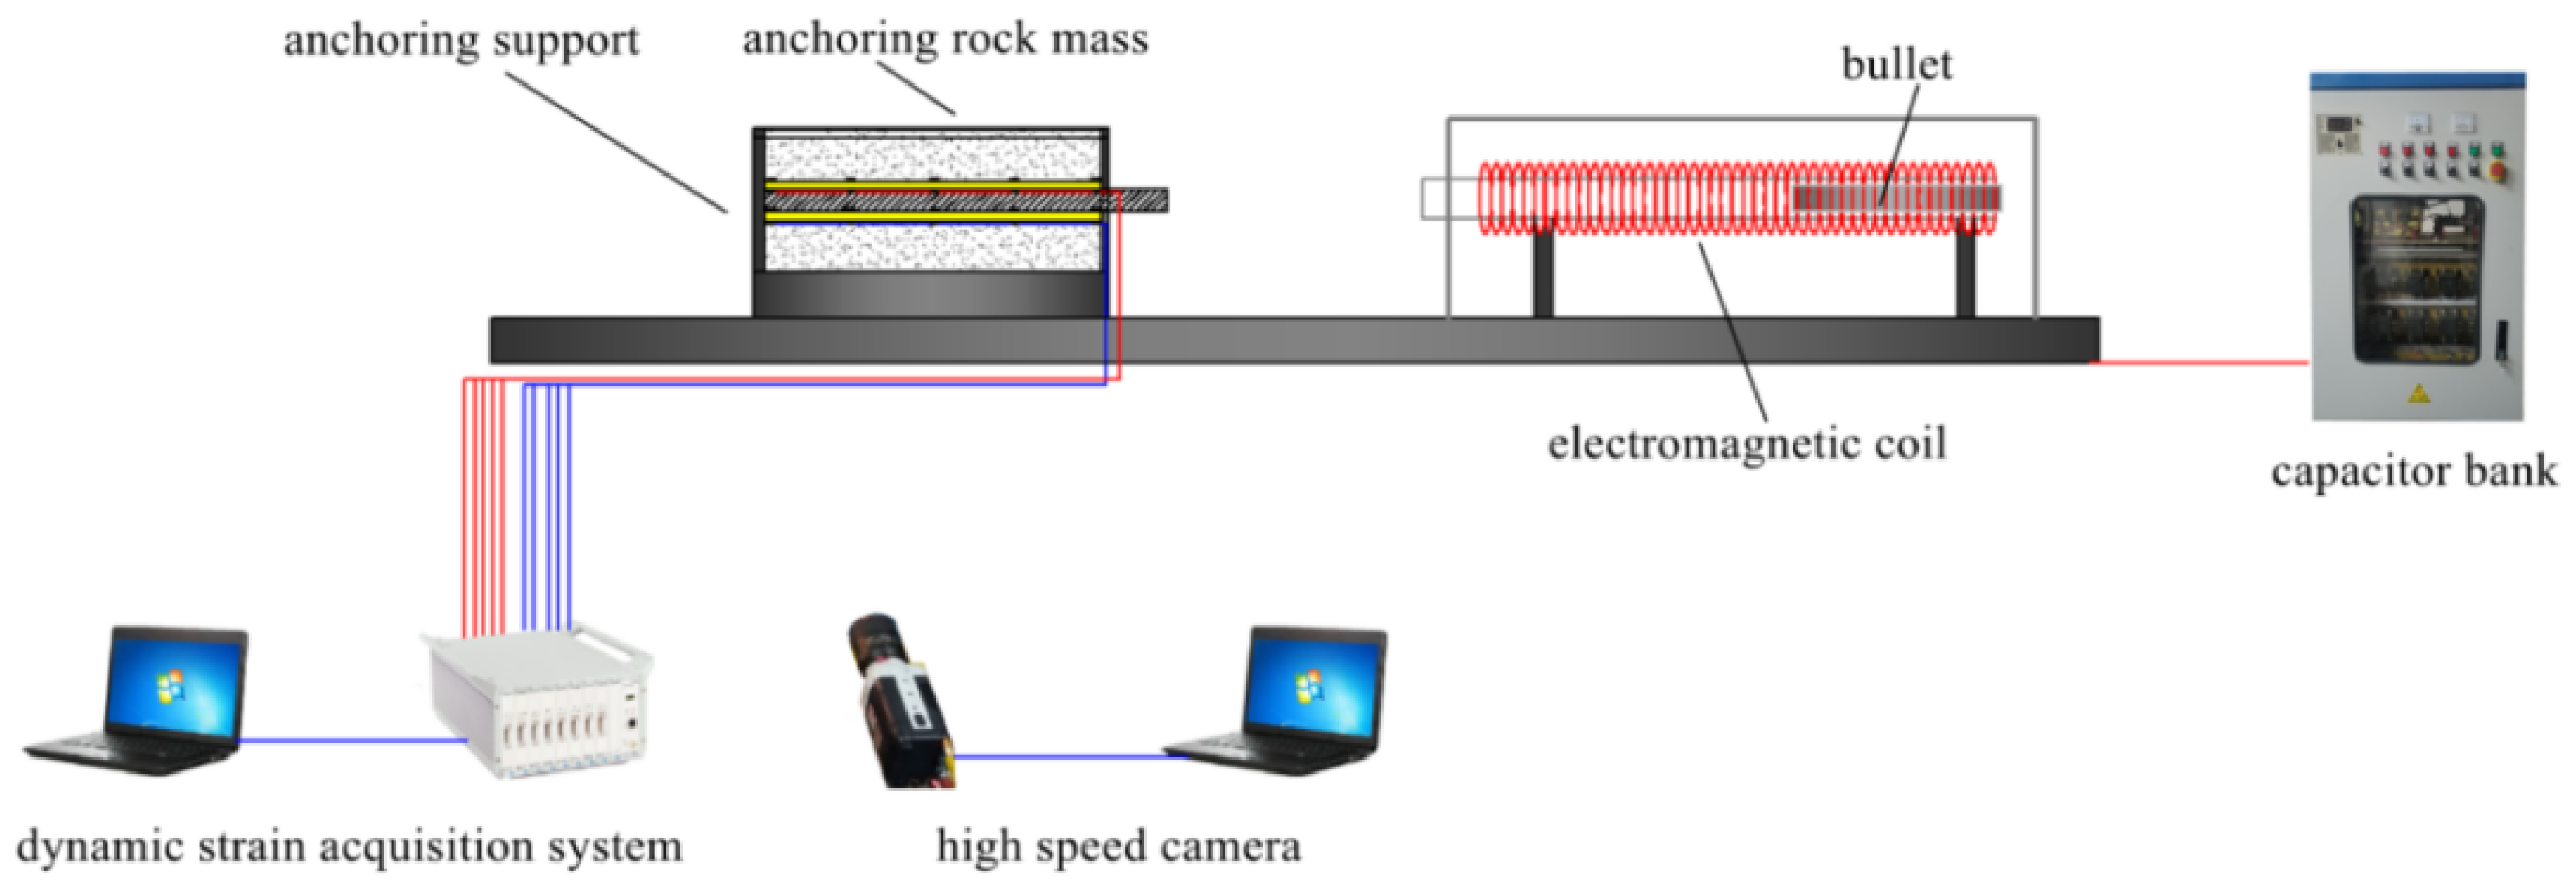
2. Impact Load Test System of Transparent Similar Rock-Anchoring Structure
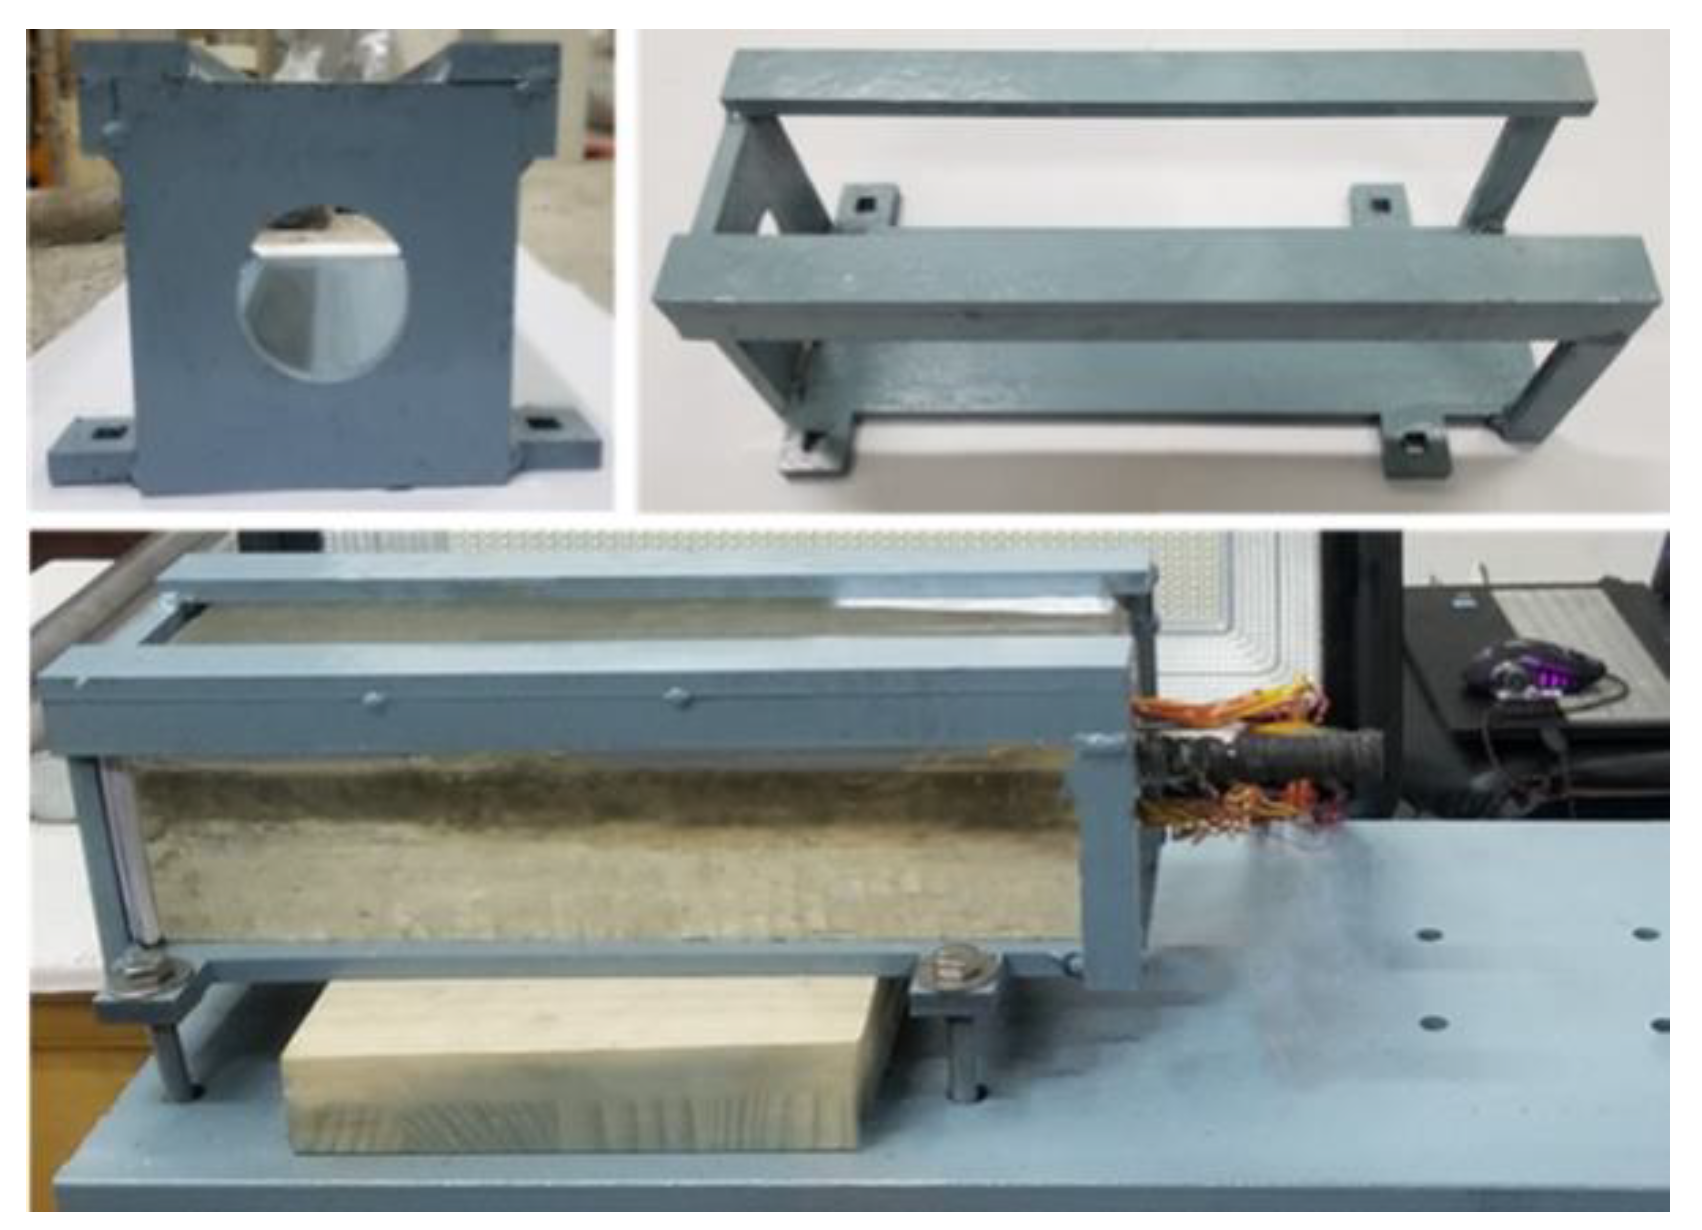
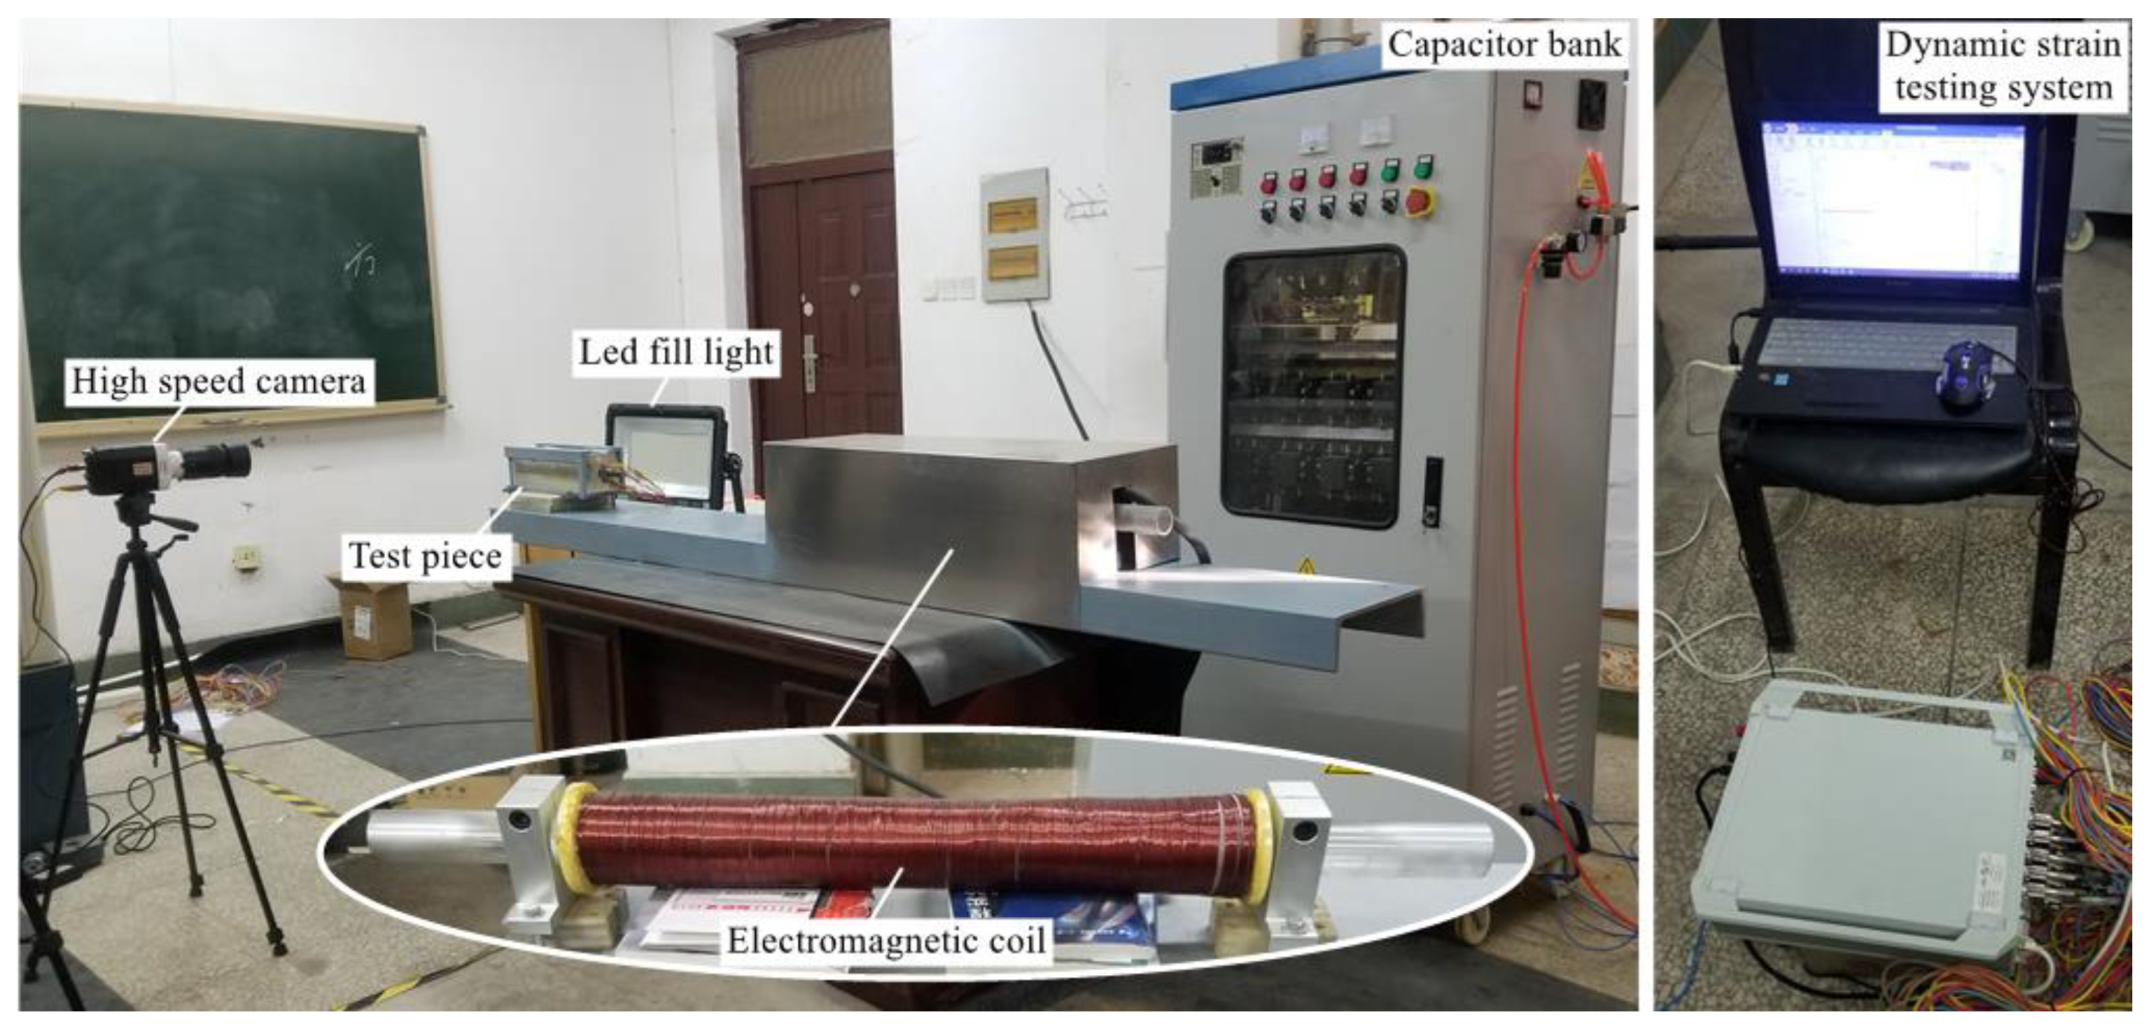
2.1. Test Device and Working Principle
- 1.
- Test device
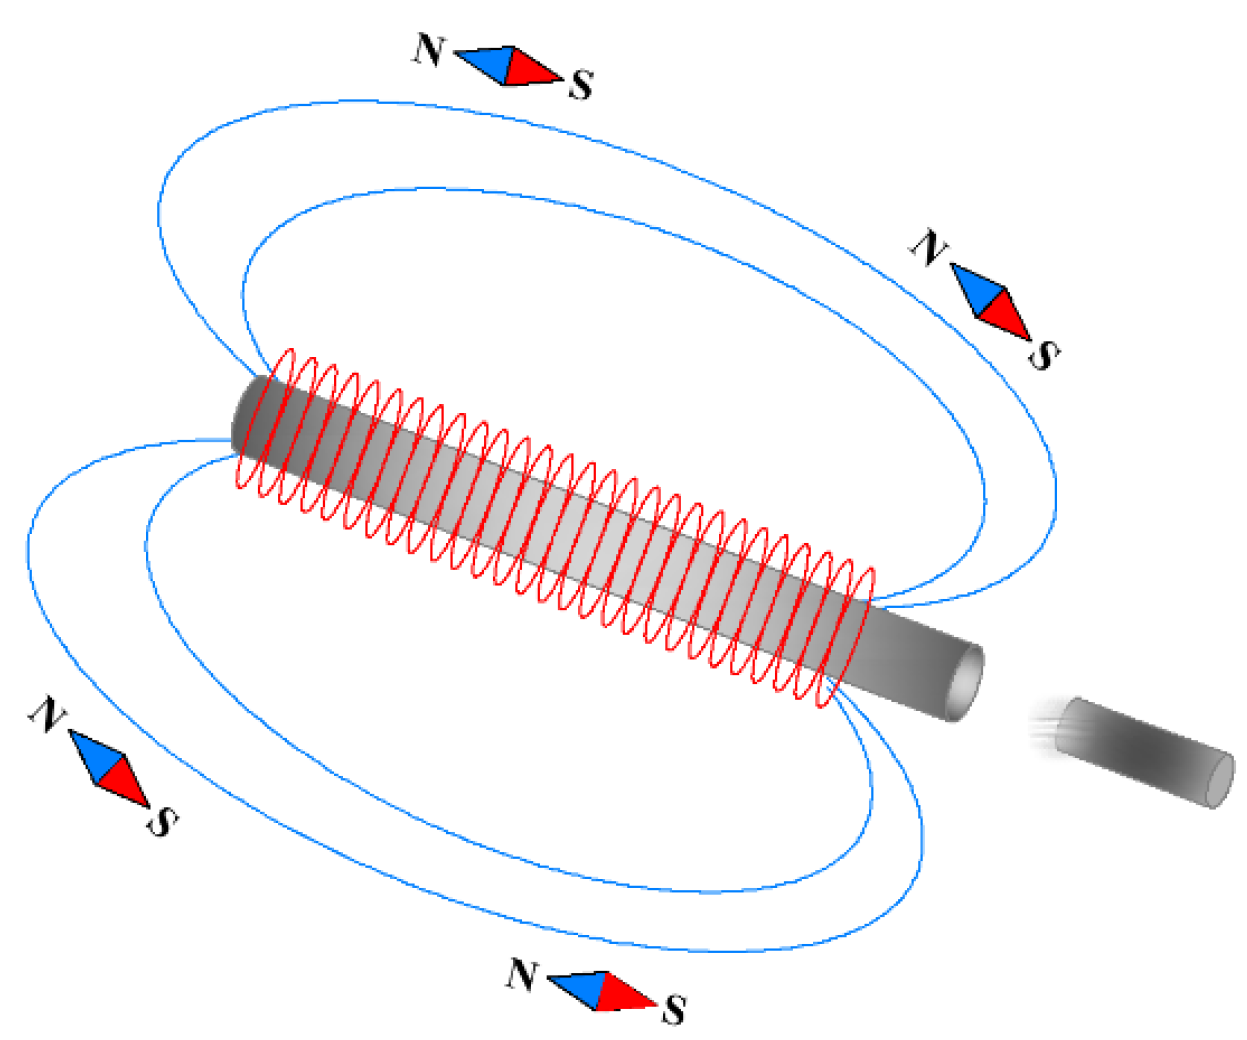
- 2.
- Working principle
2.2. Test Scheme
- (1)
- Production process of the measuring force rockbolt
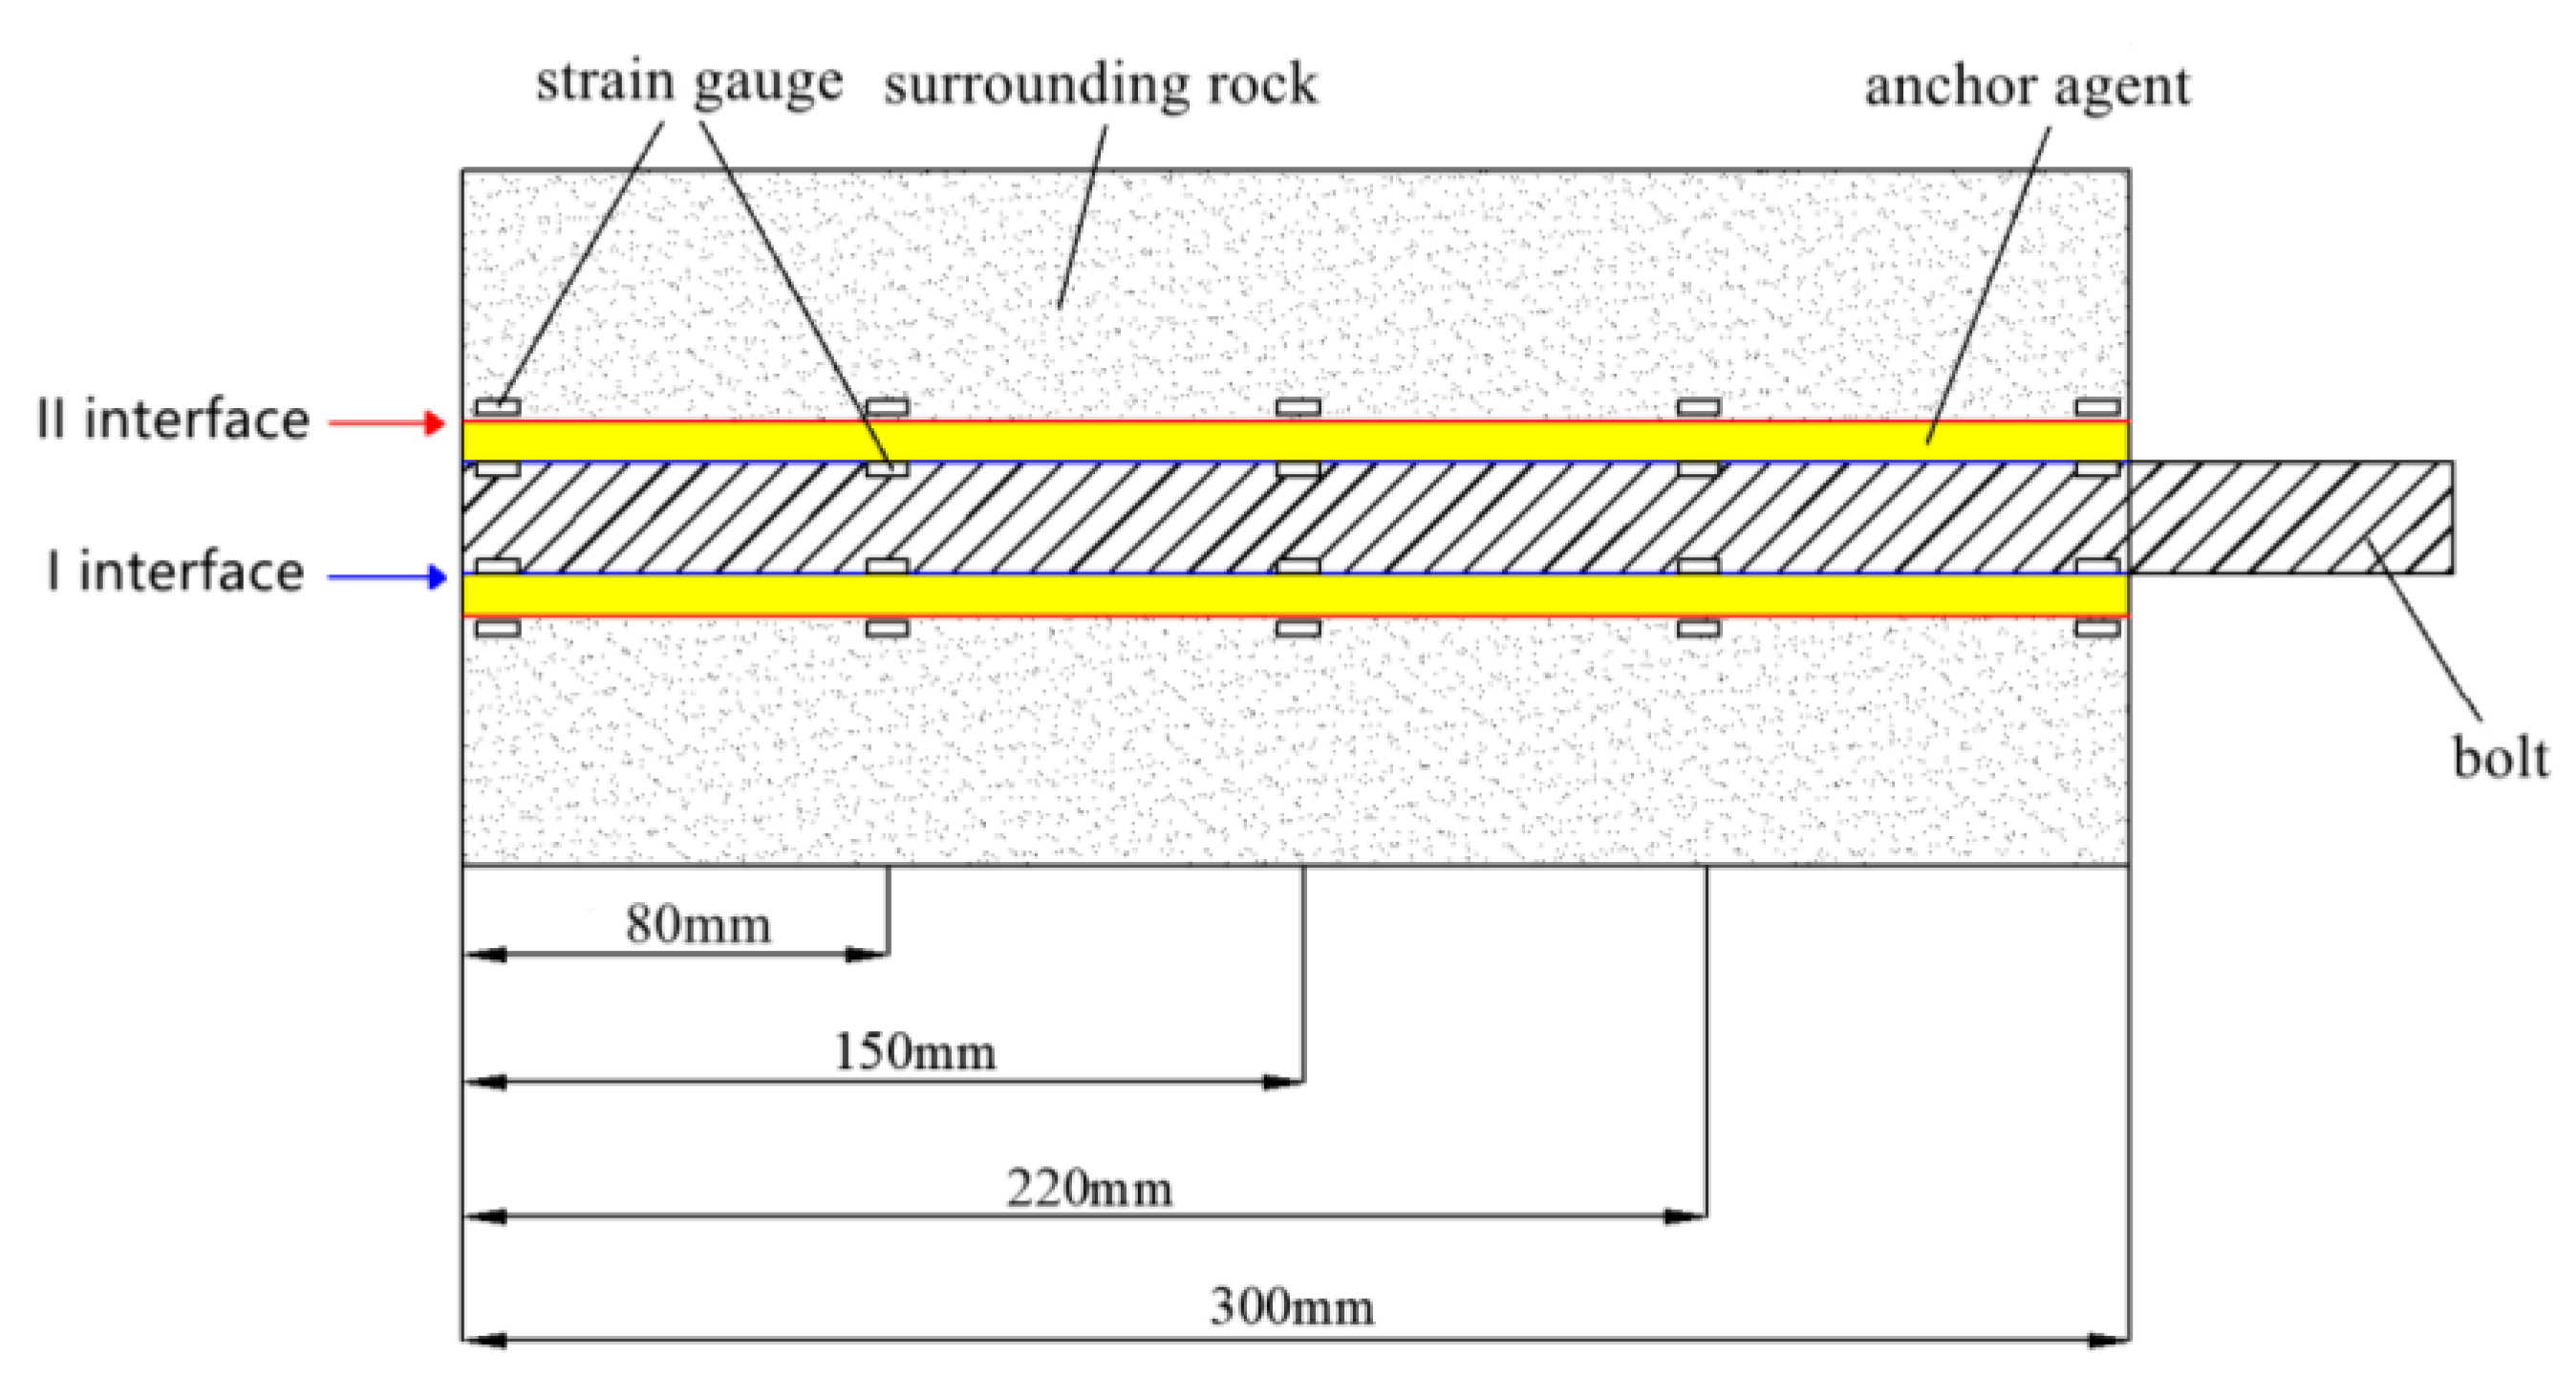
- Notched rockbolts with a diameter of 20 mm and yield strength of 335 MPa of a left-handed rebar anchor are selected, symmetric slots are made along the length of the rockbolt direction; its size is 8 mm in width and 3 mm in depth, and the grooves must be straight and without obvious steps, as shown in Figure 5.
- Measuring point Weld-free strain gauge of BF120-3AA type is adopted. Ten strain gauges are pasted in the slot of the rockbolt. Ten strain gauges are pasted 3 mm away from the II interface, as shown in Figure 6.
- (2)
- Production process of a similar transparent rock sample
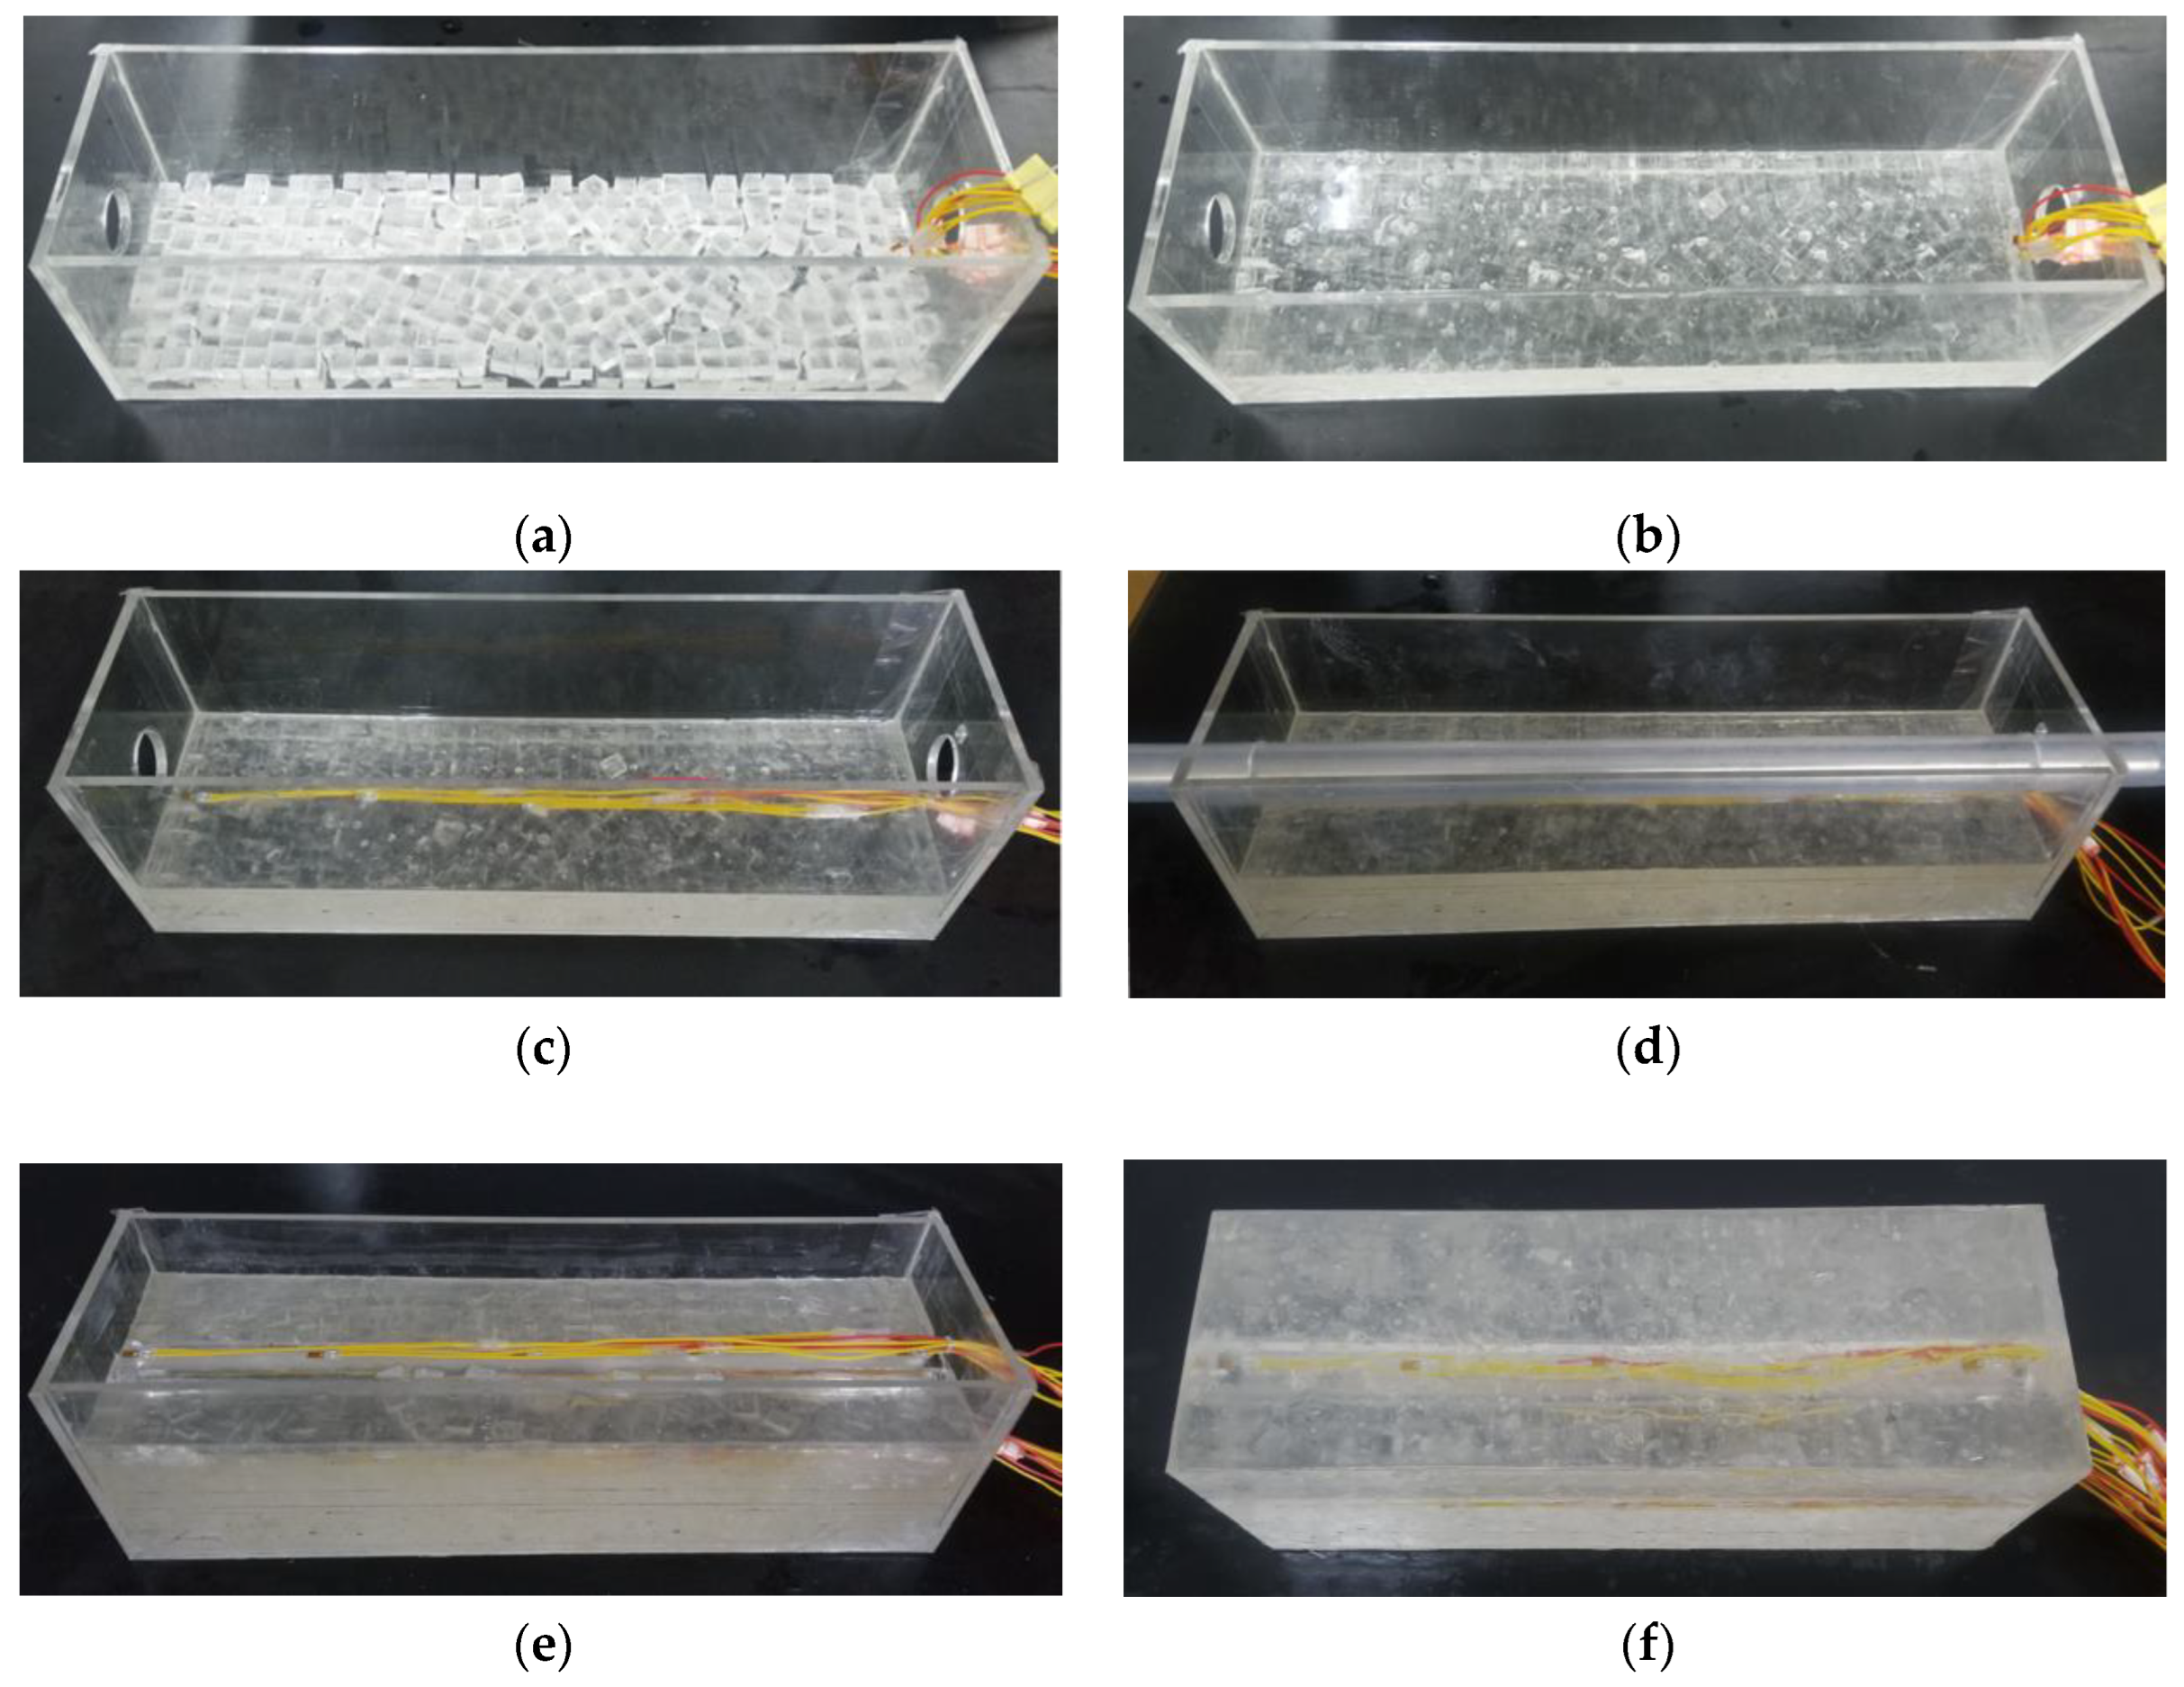
- Before initial pouring, a 10 mm transparent glue block is prepared and randomly poured into the mold to the height of the sticking strain gauge, and vacuumed transparent glue is slowly drained into the mold with a glass rod until the small glue block is submerged. Then, it is left to stand for 24 h, as shown in Figure 7a,b.
- After initial setting, the strain gauges are pasted and numbered in the predetermined position. A silica gel tube with an outer diameter of 26 mm is inserted into the reserved hole of the mold, as shown in Figure 7c,d. Then, some 10 mm transparent blocks are poured to the height of the strain gauge on the second layer.
- After the second strain gauge is laid, the mold is filled with small rubber blocks and then the transparent glue is poured. After standing for 24 h and removing the silica, the gel tube is left to stand for another 24 h. Then, it can be removed from the mold, as shown in Figure 7e,f.
- Repeating the above steps three times, as shown in Figure 7, 48 h before the test, the model without the anchoring agent is placed in −40 °C cryogenic refrigerator. Then, 24 h before the test, the specimen is taken out and the anchoring agent and rockbolt are installed.
3. Analysis of Test Results
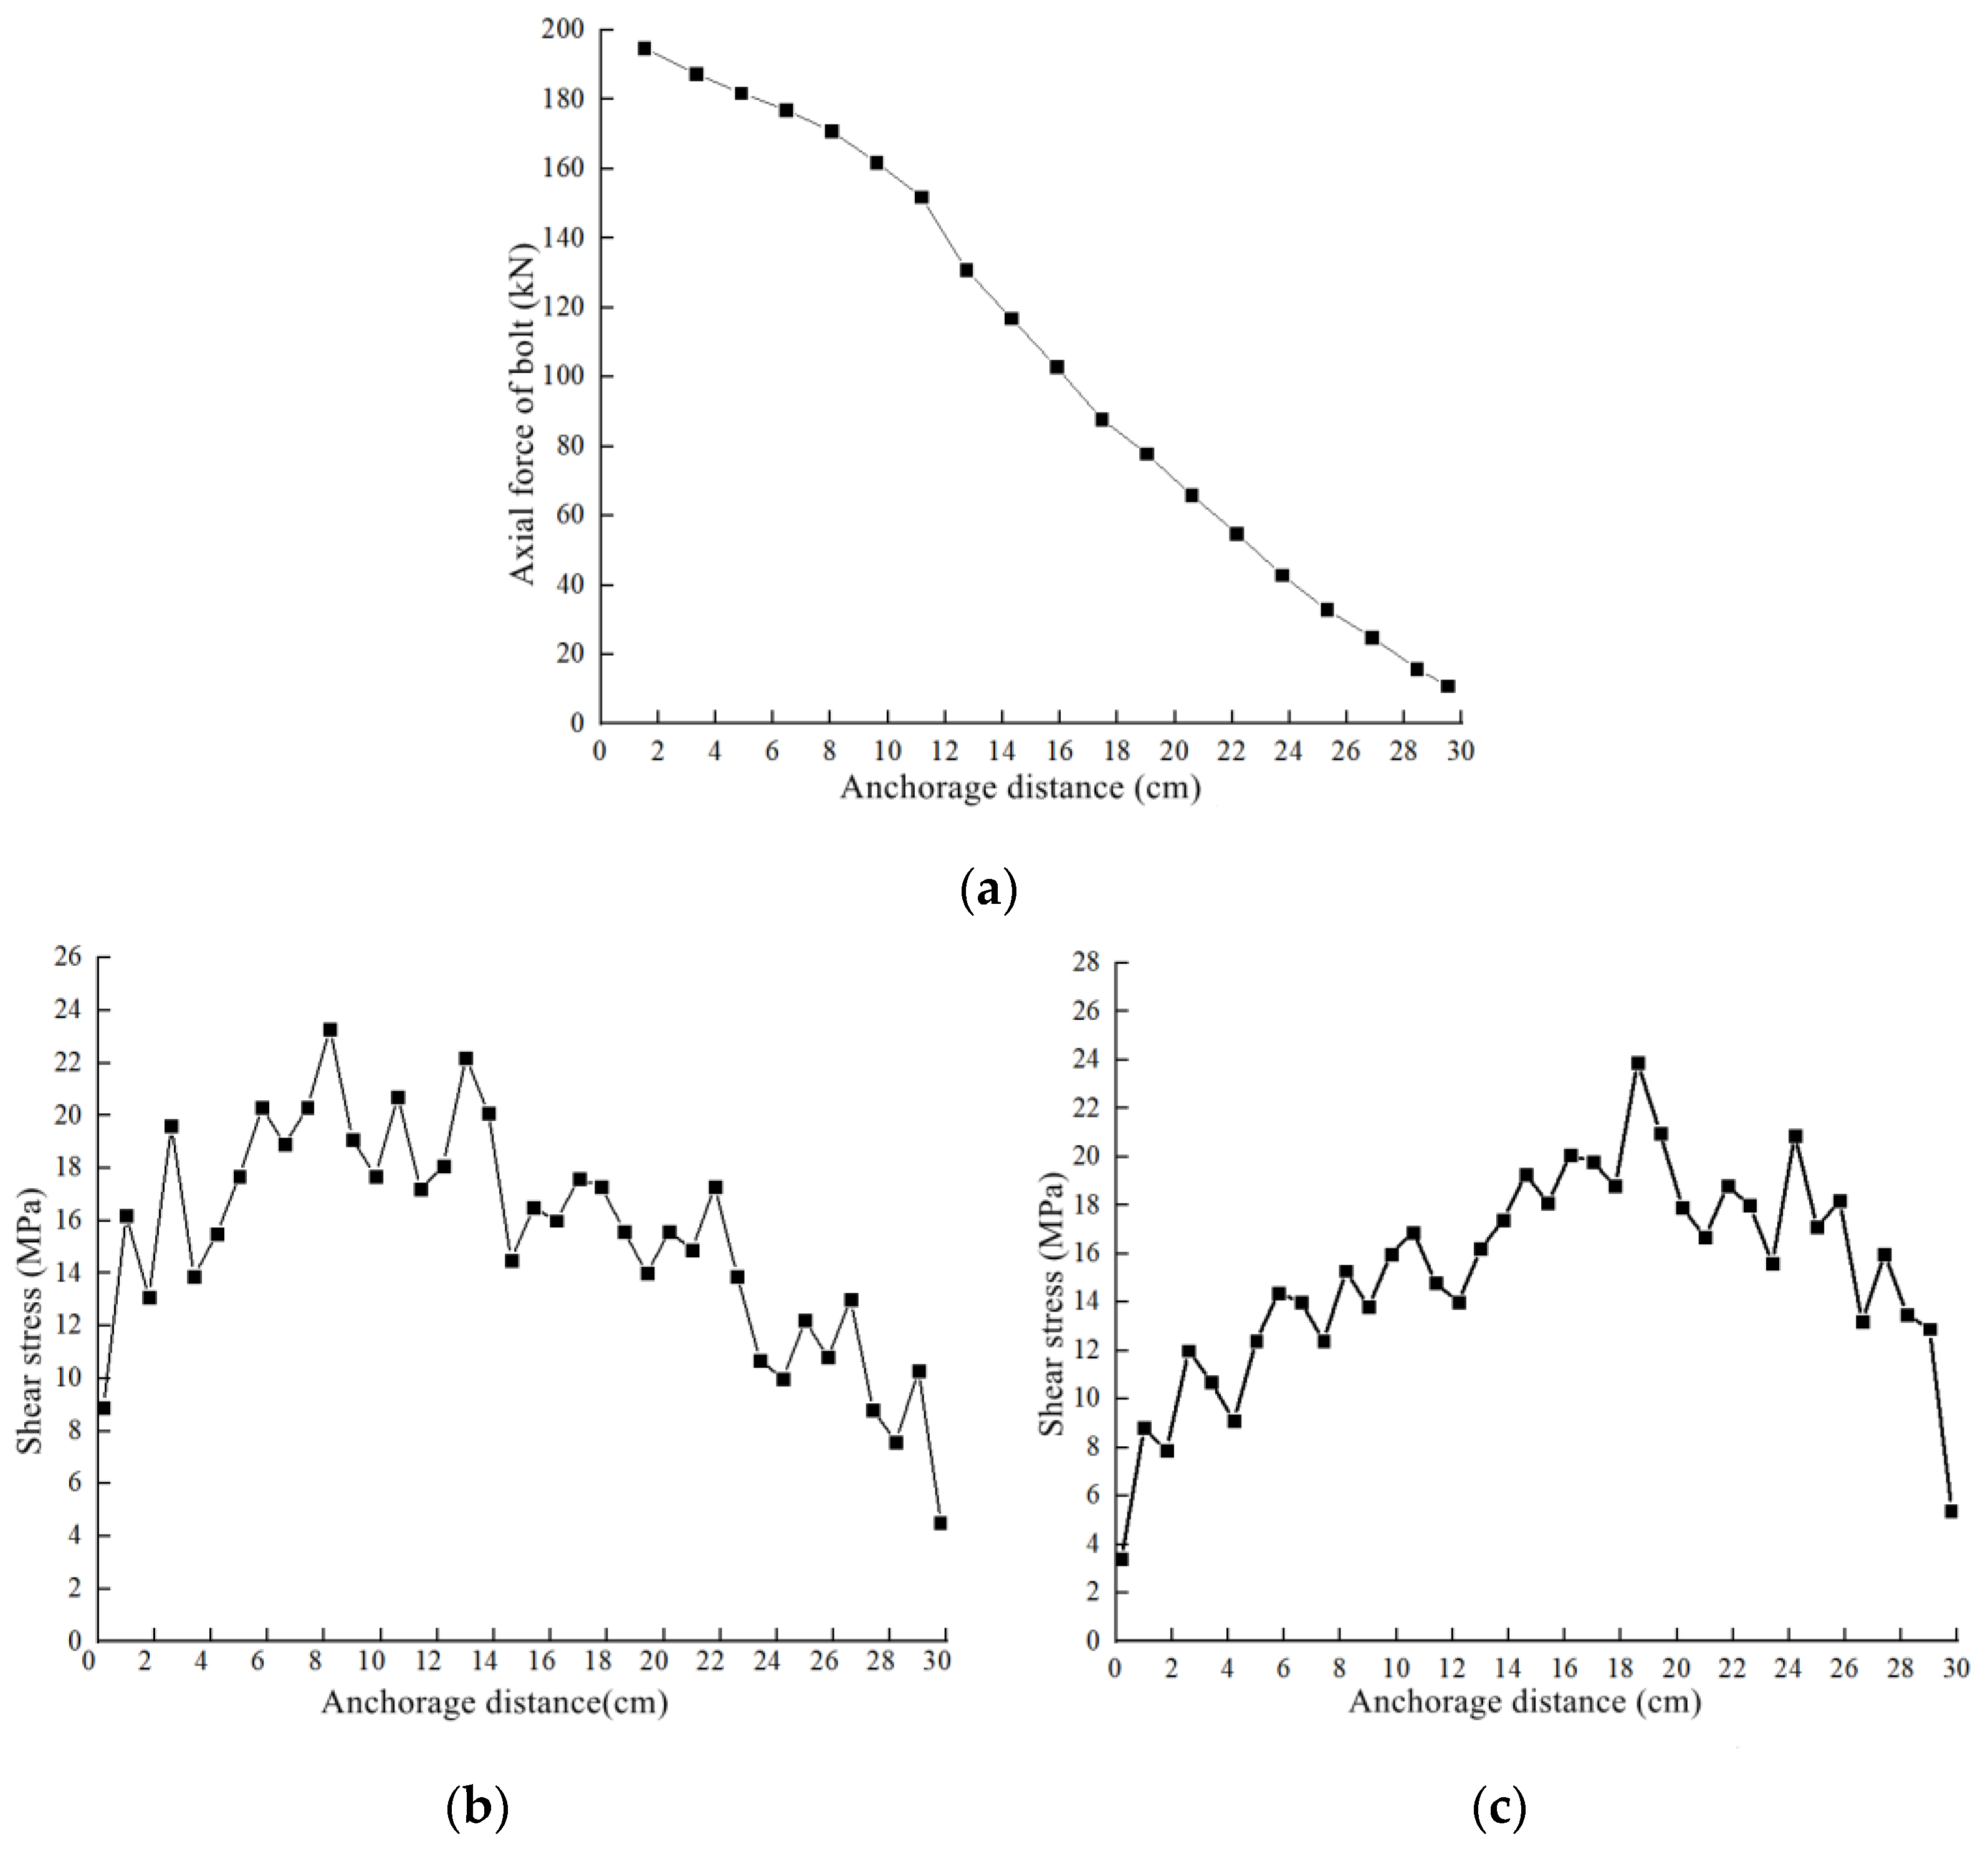
3.1. Distribution Law of Rockbolt Axial Force and Interface Shear Stress
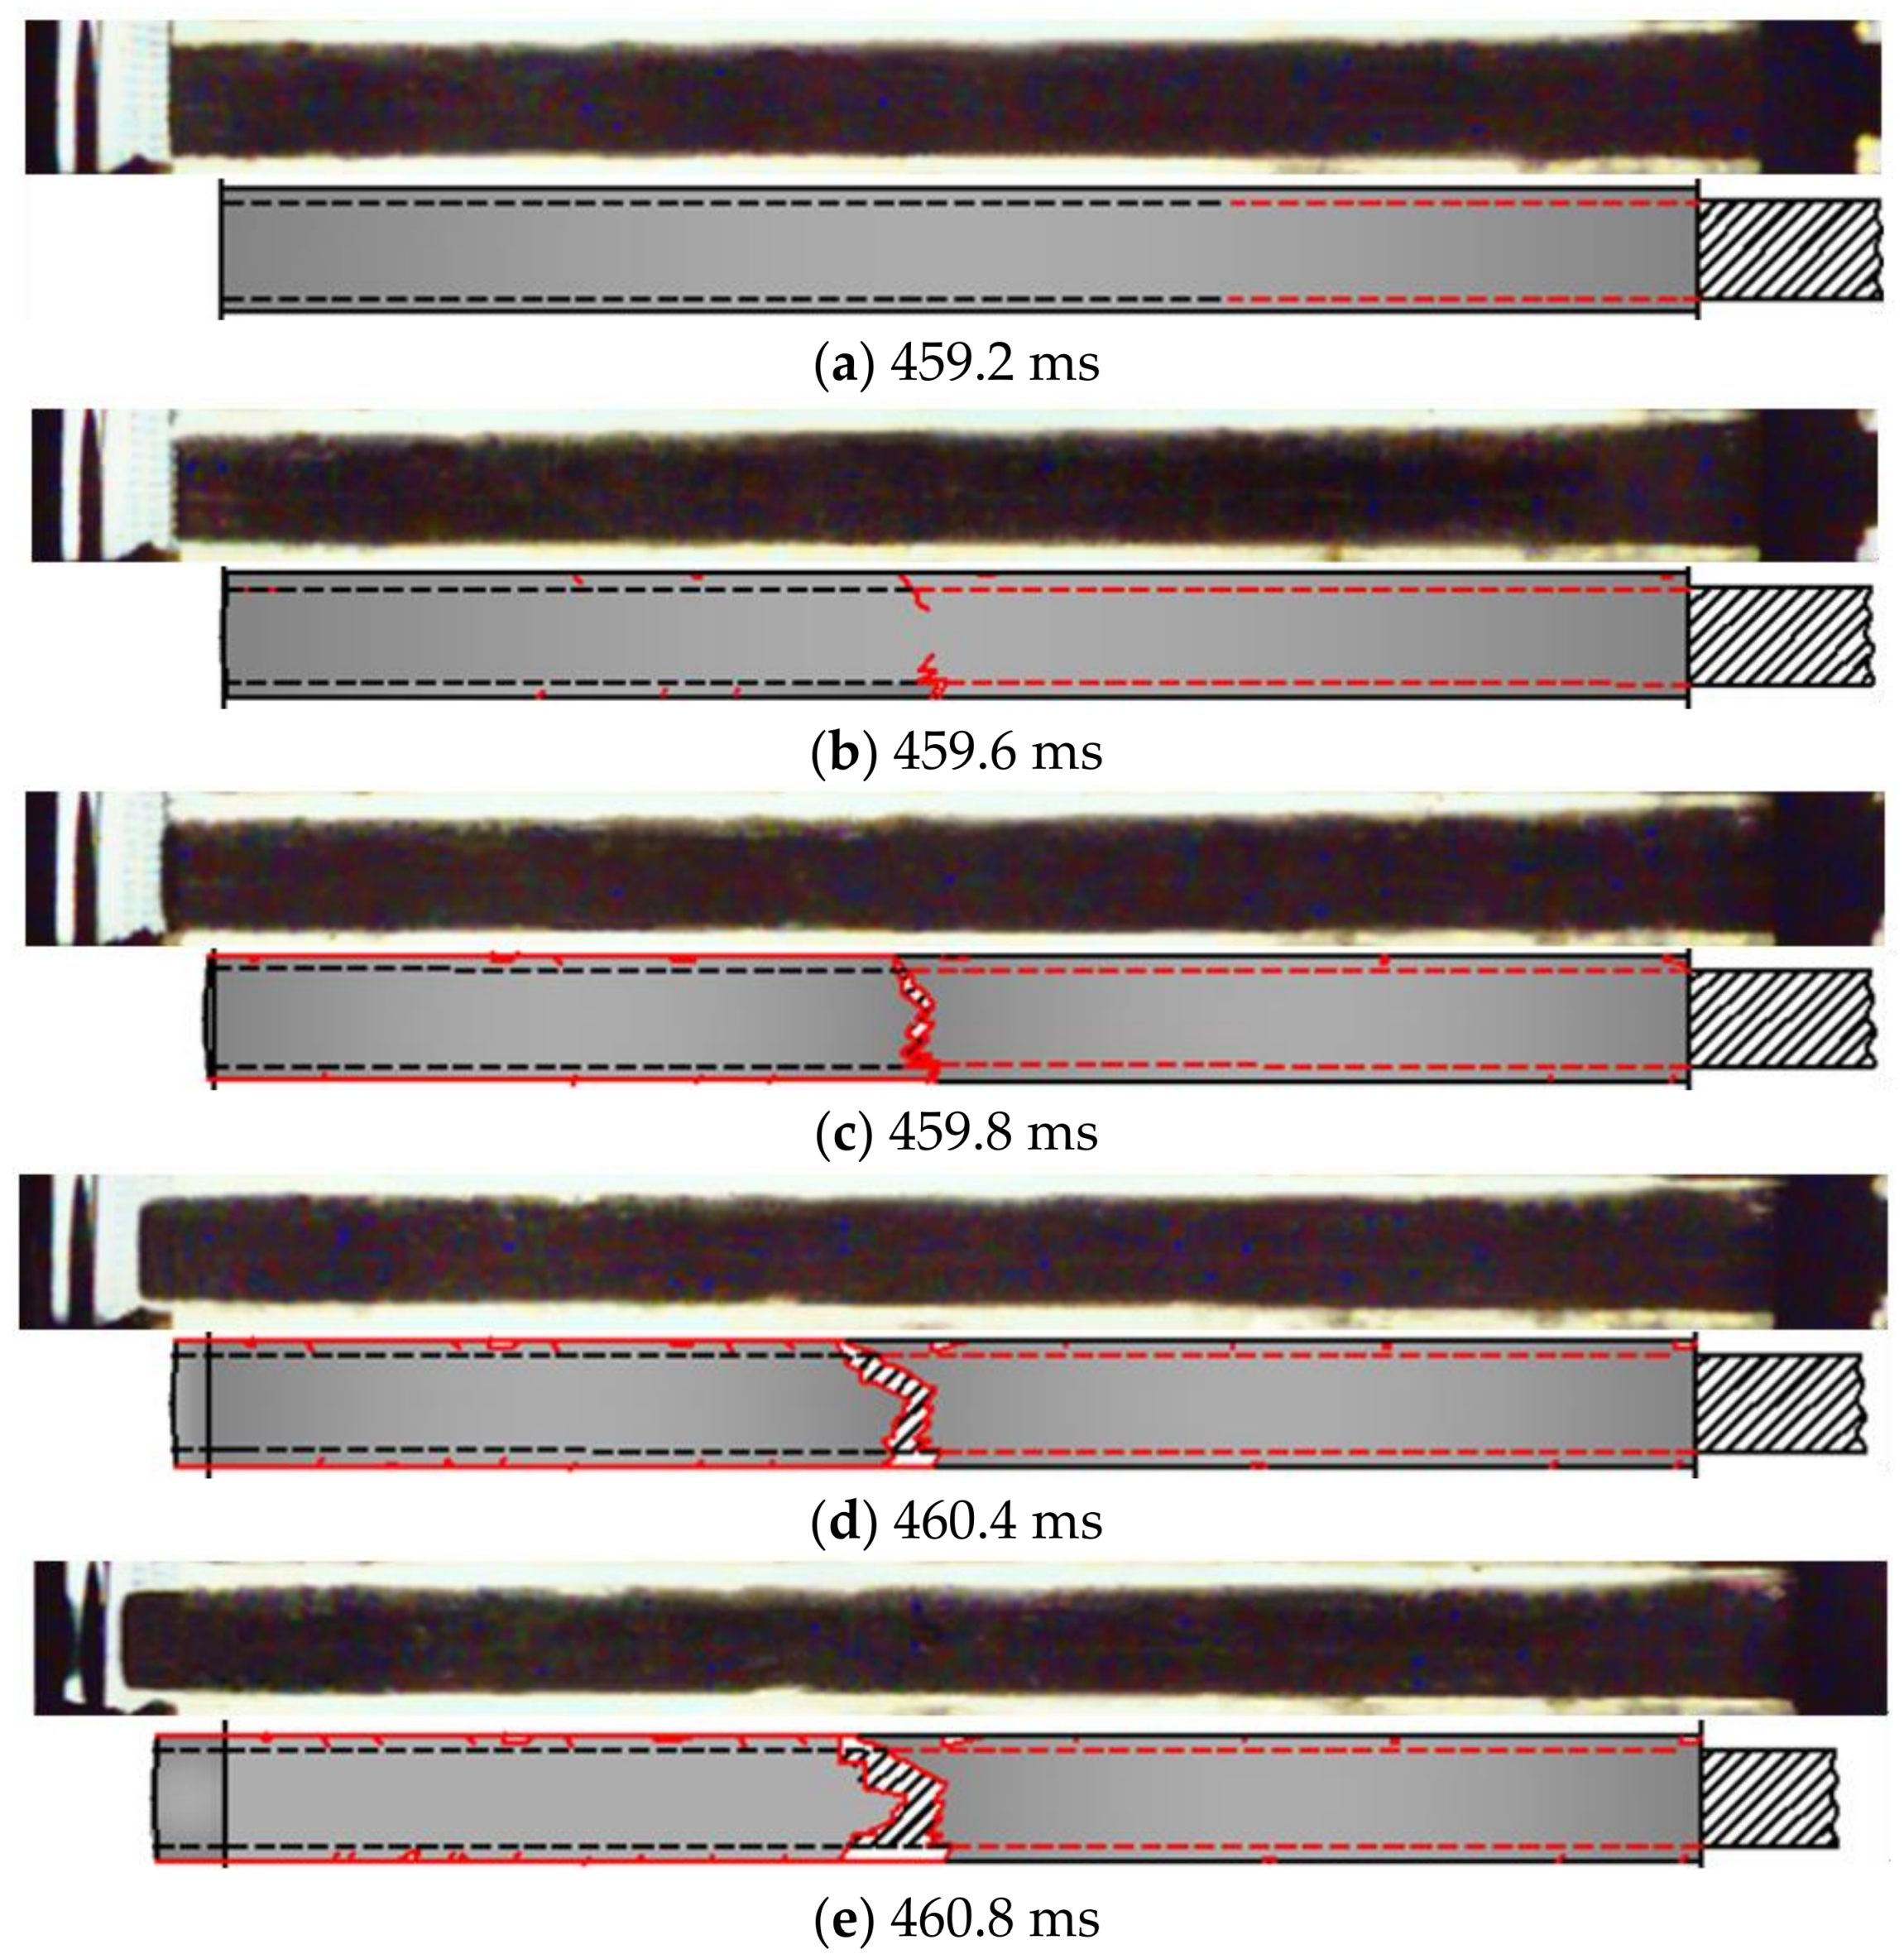
3.2. Failure Mode Analysis
4. Numerical Simulation
4.1. PFC Brief
4.2. Numerical Modeling
4.3. Comparative Analysis of Numerical Simulation and Impact Test Results
5. Conclusions
- (1)
- Through the impact load test of the transparent anchoring structure, the axial force of rockbolt shows a downward trend, and the maximum and minimum values occur at the load end and the other end, respectively. Shear stress at two interfaces first increases and then decreases; the shear stress at I interface is more than shear stress at II interface.
- (2)
- There are obvious serrated slip traces of the anchorage agent in the latter half of transparent sample. There is no large slip surface in the former half of I interface, and only local positions have scattered scratches. In the former half of I interface, debonding failure occurs and in the latter half of II interface, debonding failure also occurs. The final debonding failure mode is dual-interface mixed.
- (3)
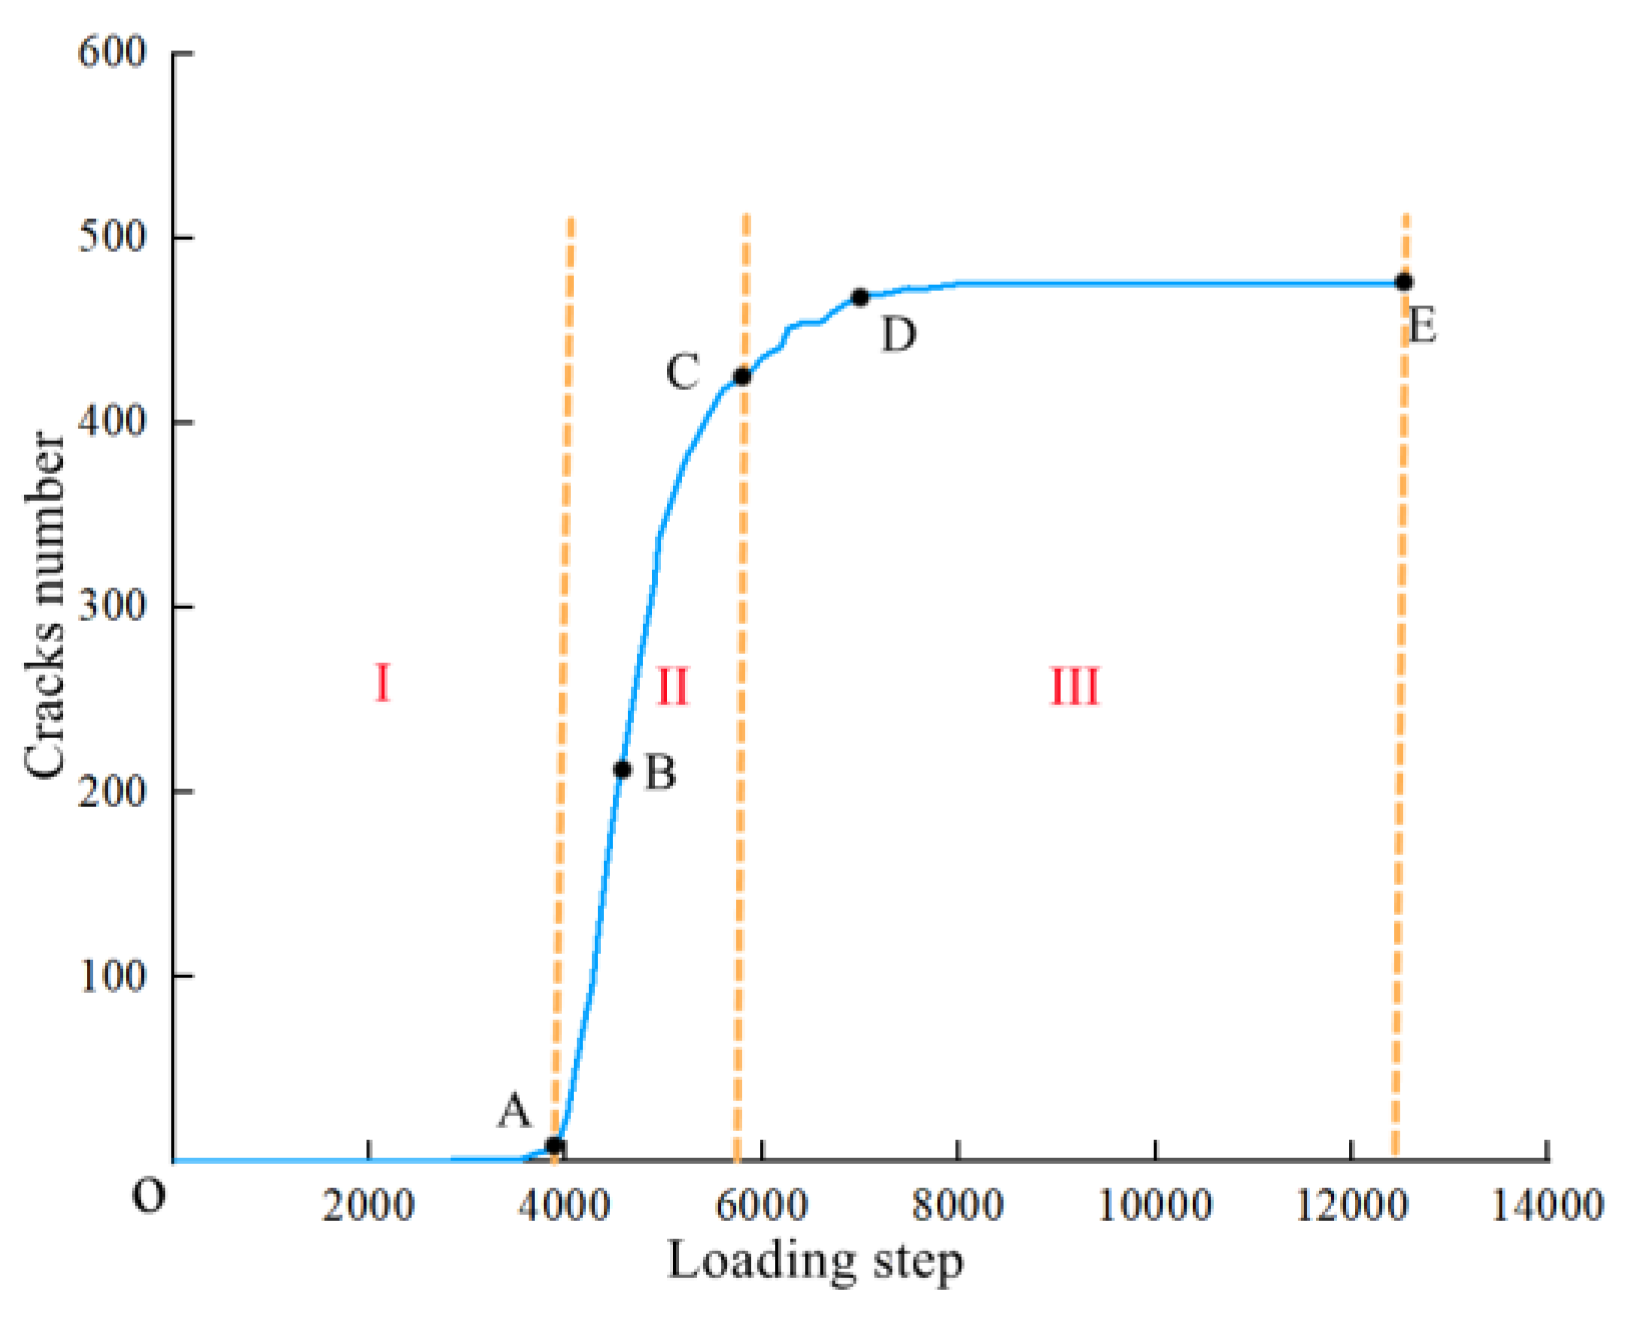
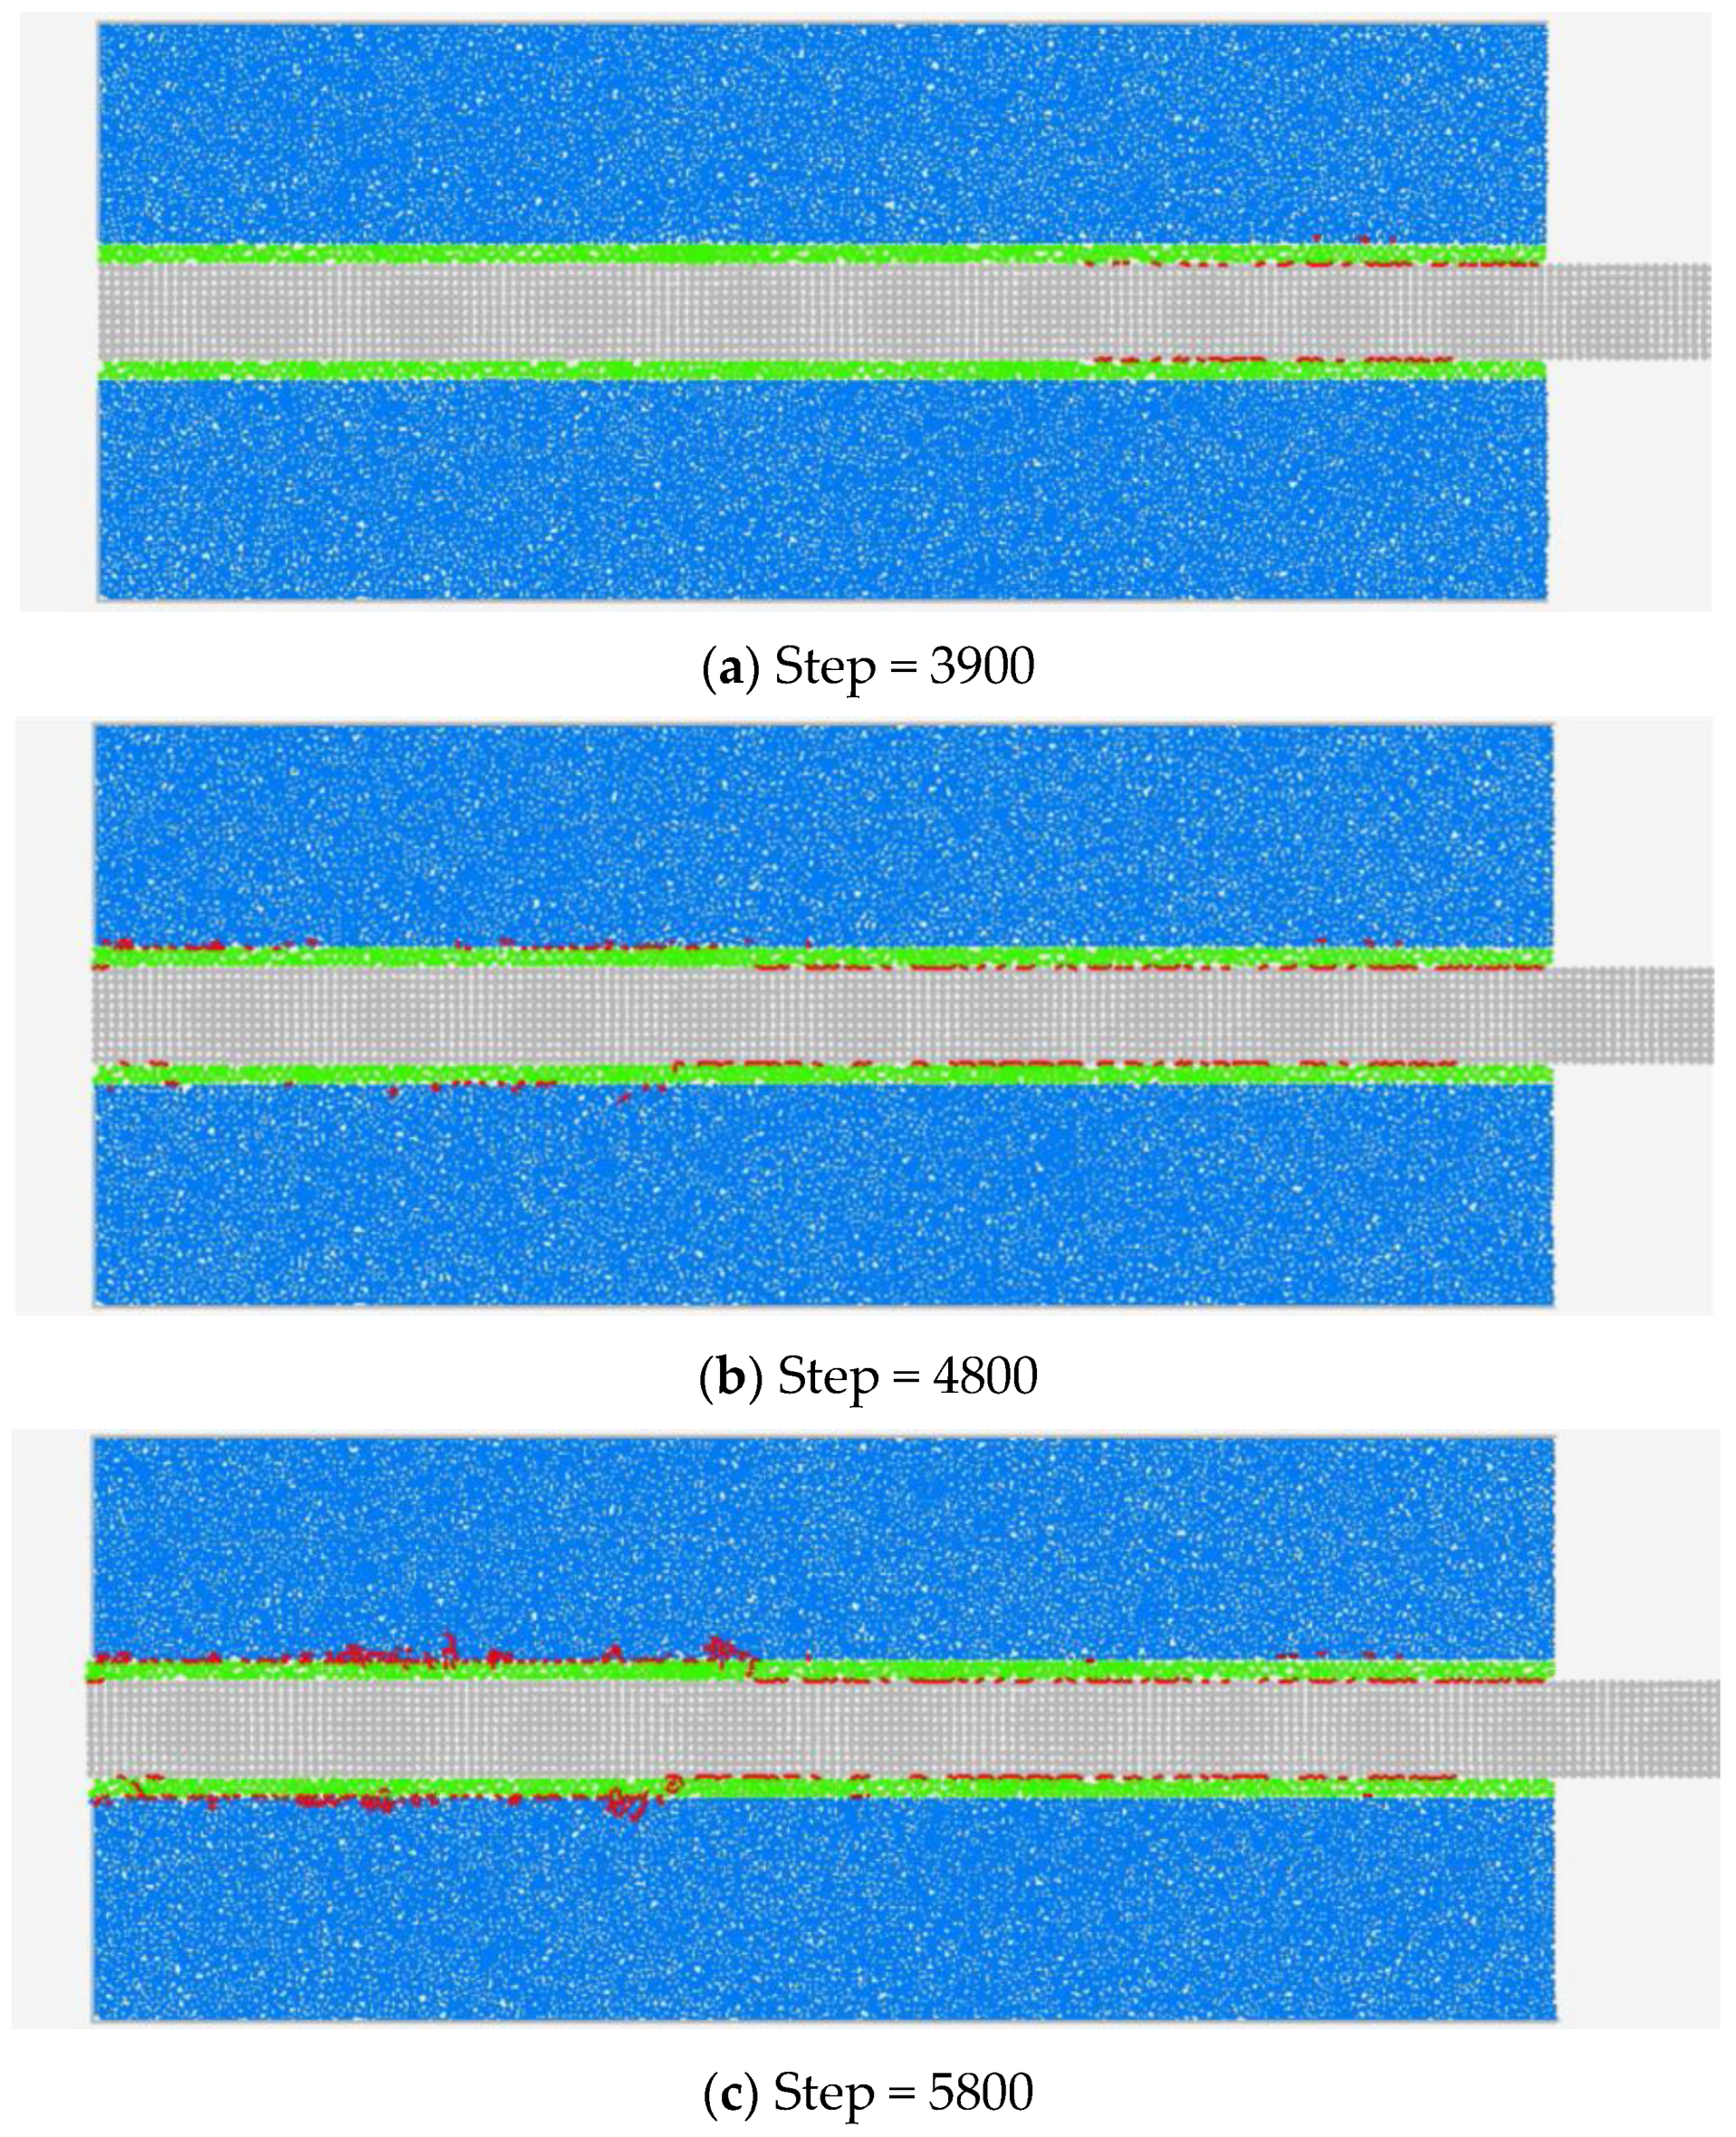
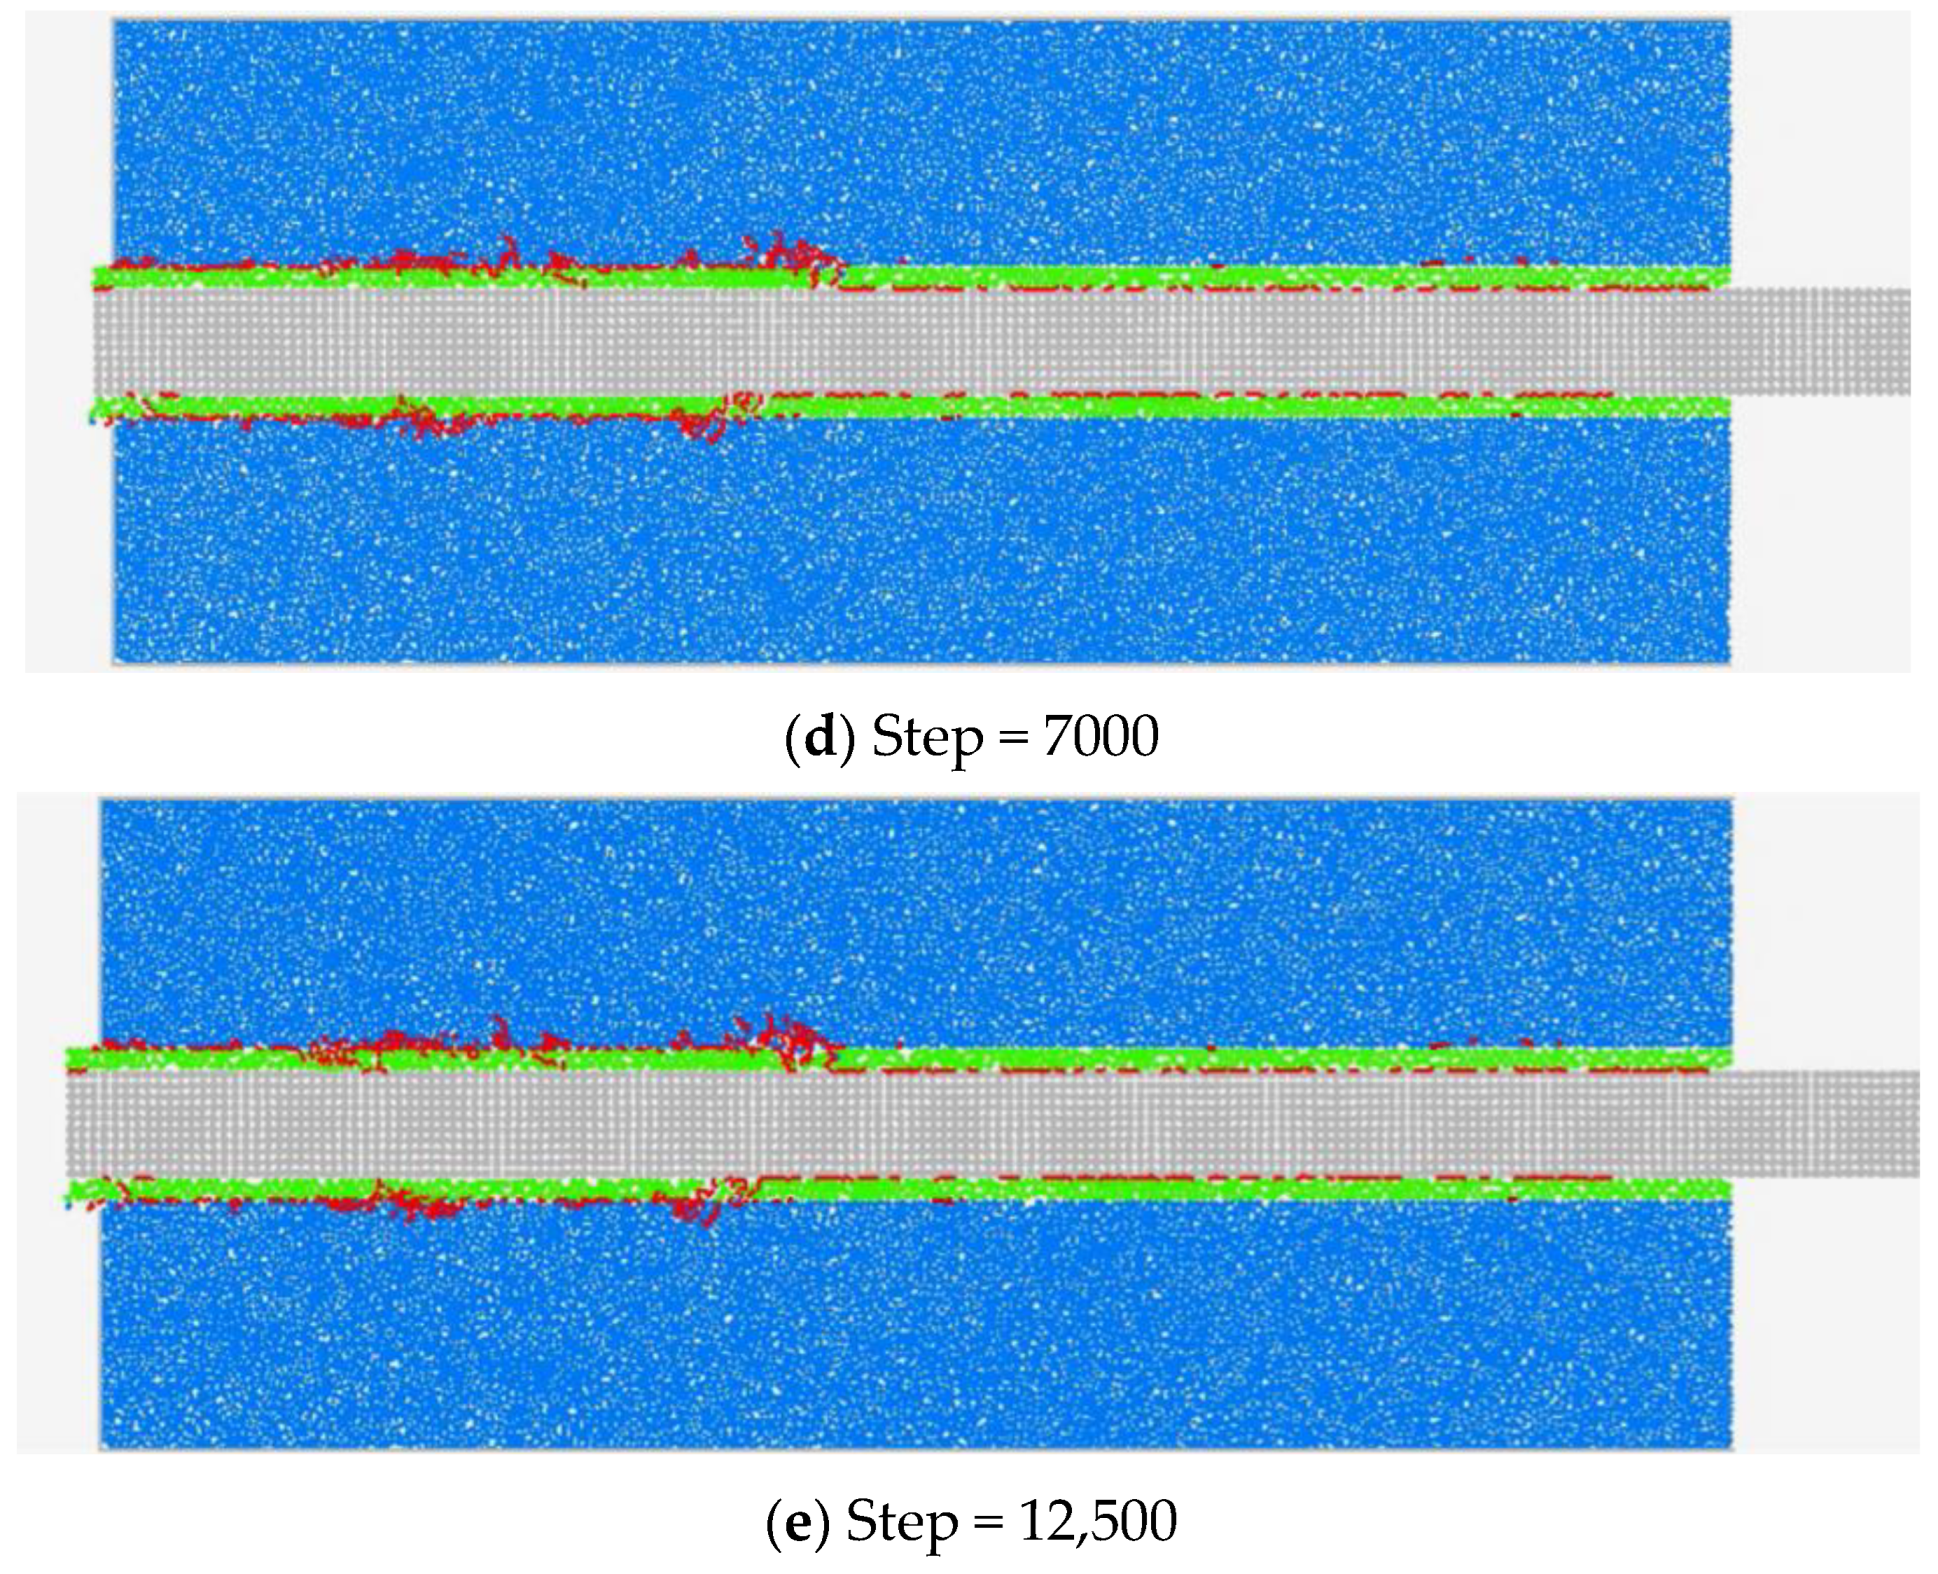
- Due to the different measuring methods, shear stress distribution of the interface is slightly different between the laboratory test and the PFC test, but the final failure mode is similar. According to the failure process of the anchoring structure based on the laboratory and simulation test, the crack evolution process of the anchoring structure is divided into three phases: crack initiation, crack coalescence, and debonding slip. The axial force curve of the rockbolt, shear stress distribution of two interfaces and failure mode of the numerical simulation are in good agreement with the laboratory test results.
Author Contributions
Funding
Institutional Review Board Statement
Informed Consent Statement
Data Availability Statement
Acknowledgments
Conflicts of Interest
References
- Zhang, J.; Jiang, F.; Yang, J.; Bai, W.; Zhang, L. Rockburst mechanism in soft coal seam within deep coal mines. Int. J. Min. Sci. Technol. 2017, 27, 551–556. [Google Scholar] [CrossRef]
- Guo, W.-Y.; Zhao, T.-B.; Tan, Y.-L.; Yu, F.-H.; Hu, S.-C.; Yang, F.-Q. Progressive mitigation method of rock bursts under complicated geological conditions. Int. J. Rock Mech. Min. Sci. 2017, 96, 11–22. [Google Scholar] [CrossRef]
- Wen, J.; Li, H.; Jiang, F.; Yu, Z.; Ma, H.; Yang, X. Rock burst risk evaluation based on equivalent surrounding rock strength. Int. J. Min. Sci. Technol. 2019, 29, 571–576. [Google Scholar] [CrossRef]
- Wang, H.; Shi, R.; Deng, D.; Jiang, Y.; Wang, G.; Gong, W. Characteristic of stress evolution on fault surface and coal bursts mechanism during the extraction of longwall face in Yima mining area, China. J. Struct. Geol. 2020, 136, 104071. [Google Scholar] [CrossRef]
- Jiao, H.; Chen, W.; Wu, A.; Yu, Y.; Ruan, Z.; Honaker, R.; Chen, X.; Yu, J. Flocculated unclassified tailings settling efficiency improvement by particle collision optimization in the feedwell. Int. J. Miner. Metall. Mater. 2021. [Google Scholar] [CrossRef]
- Jiao, H.; Wu, Y.; Wang, H.; Chen, X.; Li, Z.; Wang, Y.; Zhang, B.; Liu, J. Micro-scale mechanism of sealed water seepage and thickening from tailings bed in rake shearing thickener. Miner. Eng. 2021, 173, 107043. [Google Scholar] [CrossRef]
- Pan, Y.S.; Xiao, Y.H.; Li, Z.H.; Wang, K.X. Study of tunnel support theory of rockburst in coal mine and its application. J. China Coal Soc. 2014, 39, 222–228. (In Chinese) [Google Scholar]
- Kang, H.P. Sixty years development and prospects of rockbolting technology for underground coal mine roadways in China. J. China Univ. Min. Technol. 2016, 45, 1071–1081. (In Chinese) [Google Scholar]
- Ivanović, A.; Neilson, R.D.; Rodger, A.A. Influence of Prestress on the Dynamic Response of Ground Anchorages. J. Geotech. Geoenviron. Eng. 2002, 128, 237–249. [Google Scholar] [CrossRef]
- Aydan, O.; Feng, X.-T. Rock Reinforcement and Rock Support; CRC Press: London, UK, 2018. [Google Scholar]
- Jiang, L.; Kong, P.; Shu, J.; Fan, K. Numerical analysis of support designs based on a case study of a longwall entry. Rock Mech. Rock Eng. 2019, 52, 3373–3384. [Google Scholar] [CrossRef]
- Jiang, L.; Wu, Q.; Wu, Q.; Wang, P.; Xue, Y.; Kong, P.; Gong, B. Fracture failure analysis of hard and thick key layer and its dynamic response characteristics. Eng. Fail. Anal. 2019, 98, 118–130. [Google Scholar] [CrossRef]
- Kang, H.; Wu, Y.; Gao, F.; Lin, J.; Jiang, P. Fracture characteristics in rockbolts in underground coal mine roadways. Int. J. Rock Mech. Min. Sci. 2013, 62, 105–112. [Google Scholar] [CrossRef]
- Li, C.C. Field observations of rockbolts in high stress rock masses. Rock Mech. Rock Eng. 2010, 43, 491–496. [Google Scholar] [CrossRef]
- Li, C.C. A new energy-absorbing bolt for rock support in high stress rock masses. Int. J. Rock Mech. Min. Sci. 2010, 47, 396–404. [Google Scholar]
- Li, X.; Lok, T.; Zhao, J.; Zhao, P. Oscillation elimination in the Hopkinson bar apparatus and resultant complete dynamic stress–strain curves for rocks. Int. J. Rock Mech. Min. Sci. 2000, 37, 1055–1060. [Google Scholar] [CrossRef]
- Li, X.; Wu, Q.; Tao, M.; Weng, L.; Dong, L.; Zou, Y. Dynamic Brazilian Splitting Test of Ring-Shaped Specimens with Different Hole Diameters. Rock Mech. Rock Eng. 2016, 49, 4143–4151. [Google Scholar] [CrossRef]
- Li, X.; Zhou, Z.; Lok, T.-S.; Hong, L.; Yin, T. Innovative testing technique of rock subjected to coupled static and dynamic loads. Int. J. Rock Mech. Min. Sci. 2008, 45, 739–748. [Google Scholar] [CrossRef]
- Nie, W.; Zhao, Z.; Goh, A.; Song, M.; Guo, W.; Zhu, X. Performance based support design for horseshoe-shaped rock caverns using 2D numerical analysis. Eng. Geol. 2018, 245, 266–279. [Google Scholar] [CrossRef]
- Wang, A.W.; Gao, Q.S.; Dai, L.P.; Pan, Y.S.; Zhang, J.Z.; Chen, J.Q. Static and dynamic performance of rebar bolts and its adaptability under impact loading. J. China Coal Soc. 2018, 43, 2999–3006. (In Chinese) [Google Scholar]
- Wang, W.; Song, Q.; Xu, C.; Gong, H. Mechanical behaviour of fully grouted GFRP rockbolts under the joint action of pre-tension load and blast dynamic load. Tunn. Undergr. Space Technol. 2018, 73, 82–91. [Google Scholar] [CrossRef]
- Wu, Q.; Li, X.; Weng, L.; Li, Q.; Zhu, Y.; Luo, R. Experimental investigation of the dynamic response of prestressed rockbolt by using an SHPB-based rockbolt test system. Tunn. Undergr. Space Technol. 2019, 93, 103088. [Google Scholar] [CrossRef]
- Nie, W.; Zhao, Z.; Guo, W.; Shang, J.; Wu, C. Bond-slip modeling of a CMC rockbolt element using 2D-DDA method. Tunn. Undergr. Space Technol. 2019, 85, 340–353. [Google Scholar] [CrossRef]
- Wu, Q.; Chen, L.; Shen, B.; Dlamini, B.; Li, S.; Zhu, Y. Experimental Investigation on Rockbolt Performance under the Tension Load. Rock Mech. Rock Eng. 2019, 52, 4605–4618. [Google Scholar] [CrossRef]
- Zhang, J.-H.; Wang, W.-J.; Zhang, D.-B.; Zhang, B.; Meng, F. Safe range of retaining pressure for three-dimensional face of pressurized tunnels based on limit analysis and reliability method. KSCE J. Civ. Eng. 2018, 22, 4645–4656. [Google Scholar] [CrossRef]
- Sakhno, I.; Sakhno, S.; Isaienkov, O.; Kurdiumow, D. Laboratory studies of a high-strength roof bolting by means of self-extending mixtures. Min. Miner. Depos. 2019, 13, 17–26. [Google Scholar] [CrossRef]
- Ansell, A. Laboratory testing of a new type of energy absorbing rockbolt. Tunn. Undergr. Space Technol. 2005, 20, 291–300. [Google Scholar] [CrossRef]
- Cai, M.; Champaigne, D. Influence of bolt-grout bonding on MCB conebolt performance. Int. J. Rock Mech. Min. Sci. 2012, 49, 165–175. [Google Scholar] [CrossRef]
- St-Pierre, L.; Hassani, F.; Radziszewski, P.; Ouellet, J. Development of a dynamic model for a cone bolt. Int. J. Rock Mech. Min. Sci. 2009, 46, 107–114. [Google Scholar] [CrossRef]
- Varden, R.; Lachenicht, R.; Player, J.R.; Thompson, A.; Villaescusa, E. Development and implementation of the garford dynamic bolt at the Kanowna Belle Mine. In Proceedings of the 10th Underground Operators’ Conference, Launceston, Australia, 14–16 April 2008. [Google Scholar]
- He, M.; Gong, W.; Wang, J.; Qi, P.; Tao, Z.; Du, S.; Peng, Y. Development of a novel energy-absorbing bolt with extraordinarily large elongation and constant resistance. Int. J. Rock Mech. Min. Sci. 2014, 67, 29–42. [Google Scholar] [CrossRef]
- Sharifzadeh, M.; Lou, J.; Crompton, B. Dynamic performance of energy-absorbing rockbolts based on laboratory test results. Part I: Evolution, deformation mechanisms, dynamic performance and classification. Tunn. Undergr. Space Technol. 2020, 105, 103510. [Google Scholar] [CrossRef]
- Gong, W.L.; Sun, Y.X.; Gao, X.; He, M.C.; Qi, P. Dynamic characteristics of constant-resistance-large-deformation bolts based on weight-dropping tests. Chin. J. Rock Mech. Eng. 2018, 37, 2498–2509. (In Chinese) [Google Scholar]
- Li, C.C.; Doucet, C. Performance of D-Bolts Under Dynamic Loading. Rock Mech. Rock Eng. 2011, 45, 193–204. [Google Scholar] [CrossRef]
- Zhao, X.; Zhang, S.; Zhu, Q.; Li, H.; Chen, G.; Zhang, P. Dynamic and static analysis of a kind of novel J energy-releasing bolts. Geomatics, Nat. Hazards Risk 2020, 11, 2486–2508. [Google Scholar] [CrossRef]
- Li, L.; Hagan, P.C.; Saydam, S.; Hebblewhite, B.; Li, Y. Parametric Study of Rockbolt Shear Behaviour by Double Shear Test. Rock Mech. Rock Eng. 2016, 49, 4787–4797. [Google Scholar] [CrossRef]
- Zhao, C.; Zhang, Y.; Wu, W.; Zhang, Z.; Zhao, T. Numerical Study on Dynamic Performance of End-anchored Rockbolt under Impact Loading. Lat. Am. J. Solids Struct. 2021, 18, 1–18. [Google Scholar] [CrossRef]
- He, M.; Li, C.; Gong, W.; Sousa, L.R.; Li, S. Dynamic tests for a constant resistance large deformation bolt using a modifed SHTB system. Tunn. Undergr. Space Technol. 2017, 64, 103–116. [Google Scholar] [CrossRef]


| Parameter | Surrounding Rock | Anchoring Agent | Bolt |
|---|---|---|---|
| ball radius (mm) | 5.0 × 10⁻¹–7.5 × 10⁻¹ | 6.0 × 10⁻¹–8.0 × 10⁻¹ | 1.0 |
| density (kg/m3) | 2.1 × 10³ | 2.0 × 10³ | 1.2 × 10³ |
| normal stiffness | 2.4 × 10⁹ | 1.2 × 10⁹ | 40.0 × 10⁹ |
| stiffness ratio | 1.9 | 1.0 | 2.8 |
| parallel bond normal stiffness | 3.8 × 10⁹ | 1.0 × 10⁹ | 33.0 × 10⁹ |
| parallel bond normal-to-shear stiffness ratio | 3.9 | 2.0 | 2.8 |
| dashpot normal critical damping ratio | 0.5 | 0.5 | 0.5 |
| parallel bond tensile strength | 2.9 × 10⁷ | 6.0 × 10⁷ | 1.0 × 10¹⁰ |
| parallel bond cohesion | 6.1 × 10⁷ | 2.4 × 10⁷ | 10.0 × 10¹⁰ |
Publisher’s Note: MDPI stays neutral with regard to jurisdictional claims in published maps and institutional affiliations. |
© 2022 by the authors. Licensee MDPI, Basel, Switzerland. This article is an open access article distributed under the terms and conditions of the Creative Commons Attribution (CC BY) license (https://creativecommons.org/licenses/by/4.0/).
Share and Cite
Zhu, C.; Liu, X.; An, Y.; Zhao, W. Study on a Transparent Similar Rock-Anchoring Structure under Impact Tests and Numerical Simulation Tests. Appl. Sci. 2022, 12, 8149. https://doi.org/10.3390/app12168149
Zhu C, Liu X, An Y, Zhao W. Study on a Transparent Similar Rock-Anchoring Structure under Impact Tests and Numerical Simulation Tests. Applied Sciences. 2022; 12(16):8149. https://doi.org/10.3390/app12168149
Chicago/Turabian StyleZhu, Changxing, Xu Liu, Yeming An, and Weihao Zhao. 2022. "Study on a Transparent Similar Rock-Anchoring Structure under Impact Tests and Numerical Simulation Tests" Applied Sciences 12, no. 16: 8149. https://doi.org/10.3390/app12168149