1. Introduction
Traffic signs are the most frequent visual aids to communicate information about traffic laws and regulations, serving as reminder, direction, or warning [
1]. According to Kraft et al. [
2], a well-designed traffic sign is one that complies with a certain need, draws the road user’s attention, and conveys a clear message in a clear and simple manner, giving the user enough time to respond correctly. Furthermore, the design of traffic signs should allow users to comprehend the correct information precisely and effectively to avoid conflicts or accidents in a changing traffic environment [
3]. The ability to comprehend traffic signs is considered a major contributor to road safety, the failure of which could lead to more problematic issues [
4].
Aside from road safety, pedestrian safety is also becoming a global concern because of the unprotected nature of pedestrians. Although roads are usually shared by both pedestrians and vehicles, often less consideration is given to pedestrian safety compared to the ease of movement of vehicles and driver safety. Therefore, pedestrians are also susceptible to severe injuries and fatalities from crashes [
5]. Thus, there is a need to improve road and pedestrian safety through effective communication of traffic sign messages to increase traffic sign comprehension.
The lack of traffic comprehension has resulted in some associated risks which have become a major concern in many countries. In Metro Manila, disregarding traffic signs was the major cause of traffic accidents and violations based on the 2017 Accomplishment Report of the Metropolitan Manila Development Authority [
6], a government agency in charge of transport and traffic management in Metro Manila. In 2017, disregarding traffic signs was the number one cause of traffic violations, with over 91,000 cases, an increase of almost 37,000 cases compared to 2016 (See
Table 1) [
6]. Likewise, disregarding traffic signs was the number two cause of accidents in the region, with 27,651 cases of accidents or 30 percent of the total accidents in 2017 (See
Figure 1) [
6]. Thus, this study was conducted to analyze if drivers and nondrivers (treated as pedestrians) disregard traffic signs due to low comprehension of traffic signs. Therefore, selecting effective countermeasures to improve road and pedestrian safety is a critical component in addressing the continuous road traffic violations and accidents in Metro Manila.
One effective countermeasure is through the proper communication of traffic sign messages which depends on how these traffic signs are designed, using symbols with different shapes along with text or words [
7]. Collins and Lerner [
8] suggested the use of pictorial symbols in traffic signs, since they can effectively convey complex information using limited resources, are more easily identifiable than words from a greater distance and support the better performance of memory tasks compared to text. Because symbols provide a language-free method of communicating, they can potentially be understood by diverse groups which vary in life experience and reading ability [
9]. Wiseman et al. [
10] mentioned that when both symbols and verbal codes are provided, memory quality is improved because of the synthesis of the details of the symbols and texts. In the comprehension of traffic sign context, Shinar and Vogelzang [
11] found that adding text to symbols can improve the driver’s comprehension levels and reduce the time it takes to comprehend traffic signs.
Designing traffic signs also requires the standardization of shapes so that various signs can easily be recognized and can provide immediate information to drivers and pedestrians. For example, the circle symbol is mainly used for regulatory signs that inform road users of traffic laws and regulations, which, if disregarded, will constitute an offense [
12]. Examples of regulatory signs are those identified as priority (obligation to give way at intersections), speed (speed limit limitations), direction (indicating the direction to follow), prohibitive (prohibition of movements at intersections), parking (control of vehicle parking), and miscellaneous (not covered in other categories, such as no blowing of horns) [
12]. The equilateral triangle symbol with one point vertically upward is used for warning signs. Warning signs communicate information regarding potential hazards and intend to help reduce or eliminate the associated risks [
13]. For example, the horizontal alignment signs assist drivers in negotiating curves safely and to indicate the direction and approximate degree of the turn required [
14]. These characteristics are an important consideration in designing regulatory and warning signs to convey the intended information.
When a regulatory or warning sign does not clearly convey its intended information, the rate of comprehension is relatively low, ranging from 17 to 37 percent [
15]. Thus, most of these signs are poorly understood [
16], while some even having their meaning perceived as the opposite of the true meaning [
17,
18,
19]. In a study by Drory and Shinar [
20], drivers’ comprehension of warning signs, like crossroads, school crossings, and sharp curves, showed that only 9% of drivers could comprehend the correct sign. Also, drivers routinely have difficulties in understanding the meaning of warning signs, such as ‘slippery when wet’, ‘road narrows’, ‘steep descent’, ‘pavement ends’, and ‘truck crossing’, with correct response rates ranging from 6 to 40% [
21,
22,
23]. Brucal et al. [
24] also found low comprehension scores for 20 regulatory signs. To improve comprehension, these 20 signs were redesigned using ergonomic design principles and obtained significantly higher comprehension level ratings, which is relevant in conveying safety information.
To standardize safety signs and safety markings conveying safety information, the International Organization for Standardization (ISO) developed ISO 3864-1:2011 [
25]. ISO 3864-1:2011 established the safety identification of colors and design principles to be used in workplaces and public areas for the purpose of accident prevention, fire protection, health hazard information, and emergency evacuation. This standard also describes how symbols should be displayed with supplemental text, multiple images for more than one potential hazard, and the safe viewing distances for compliant signs and labels. Aside from considering sign features that are self-evident (e.g., colors and shapes), or those that can be identified only in relation to other icons (e.g., distinctiveness), icon features such as familiarity, concreteness, complexity and semantic distance are of central concern in traffic sign research [
26]. Familiarity is defined as the frequency of encounter or use in daily lives. According to Rosson [
27], signs that are familiar would be better comprehended by users. Concreteness means that the sign depicts objects which have obvious connections with the real-world—better signs are more concrete, whereas ambiguous signs are difficult to understand [
28]. Complexity is something related to the details and elements of the sign—a sign that contains a lot of detail or is intricate is complex, while simple signs contain fewer elements or little detail [
29]. Semantic distance refers to the distance of the relationship between what is depicted in the sign and the function it is intended to represent [
30]. These icon features are very important, particularly for testing the sign’s comprehensibility.
To test a sign’s comprehensibility, several methodologies have already been used with different test formats. For instance, ISO 9186-1:2007 [
31] proposes the open-ended test format, in which participants were asked to describe the meaning of the sign in their own words [
4]. However, the problem with this method is the subjective evaluation of the responses, especially if these are going to be corrected by different judges [
32]. Also, an open-ended test format allows for partially correct answers, but the effectiveness of traffic signs is based on the full understanding of their meaning, and not on partial understanding [
4,
19]. Thus, other methods have been employed in evaluating the comprehensibility of traffic signs, such as multiple-choice tests [
28], and matching tests [
33]. In using the multiple-choice format, the quality of distractors (wrong answers) is very important since this could greatly influence the comprehension scores. When the wrong answers could easily be ruled out, the respondents can easily choose the correct answer, and this would unfairly inflate the comprehension score [
34,
35]. In a matching test, the traffic sign is matched with the most appropriate referent name, which shows a clear-cut distinction between correct and incorrect answers. The use of a matching test also assists respondents who lack writing and expressing abilities, and this reduces the answering time and analysis cost [
32]. To assess the sign’s acceptability in a matching test, a level of at least 67% accuracy must be obtained in a comprehension test [
24,
25]. This level of accuracy was also adopted in other traffic comprehension studies [
17,
18,
23,
24,
32], particularly for reducing the associated risks brought about by the lack of traffic comprehension.
A review of previous research indicated that there were no studies of traffic sign comprehension addressing the issue of driving experience (drivers vs. nondrivers) in the Philippines. In addition, drivers and nondrivers were selected to derive the proper baseline performance, and to evaluate the beneficial effect of driving experience on recognizing the different traffic sign types (regulatory and warning) and display condition (symbol, text, text and symbol). Cognitive design features were also assessed to measure the sign’s design through concreteness, complexity, familiarity and semantic distance, including the relationship between cognitive design features, traffic sign types and display conditions. Although we adopted the matching test experiment from Chi and Dewi [
33], this was the first time that the matching test was applied in the measurement of traffic sign comprehension, using matching accuracy and matching time, with percentage and seconds as units of measurement, respectively.
4. Discussion
With the increasing cases of traffic violations and accidents in Metro Manila, the current study examined the comprehension of Filipino drivers and nondrivers of the 73 existing traffic signs for their matching accuracy, matching time, and cognitive design features. Since several studies have already investigated the effects of age, gender and educational attainment on the comprehension level of traffic signs, these were not analyzed in the current study, as they all fall under the non-design category of comprehensibility. While drivers’ characteristics may have a significant effect on comprehensibility, this study focused on the design factors, such as the type and display conditions, which are more flexible to modifications than the characteristics of drivers.
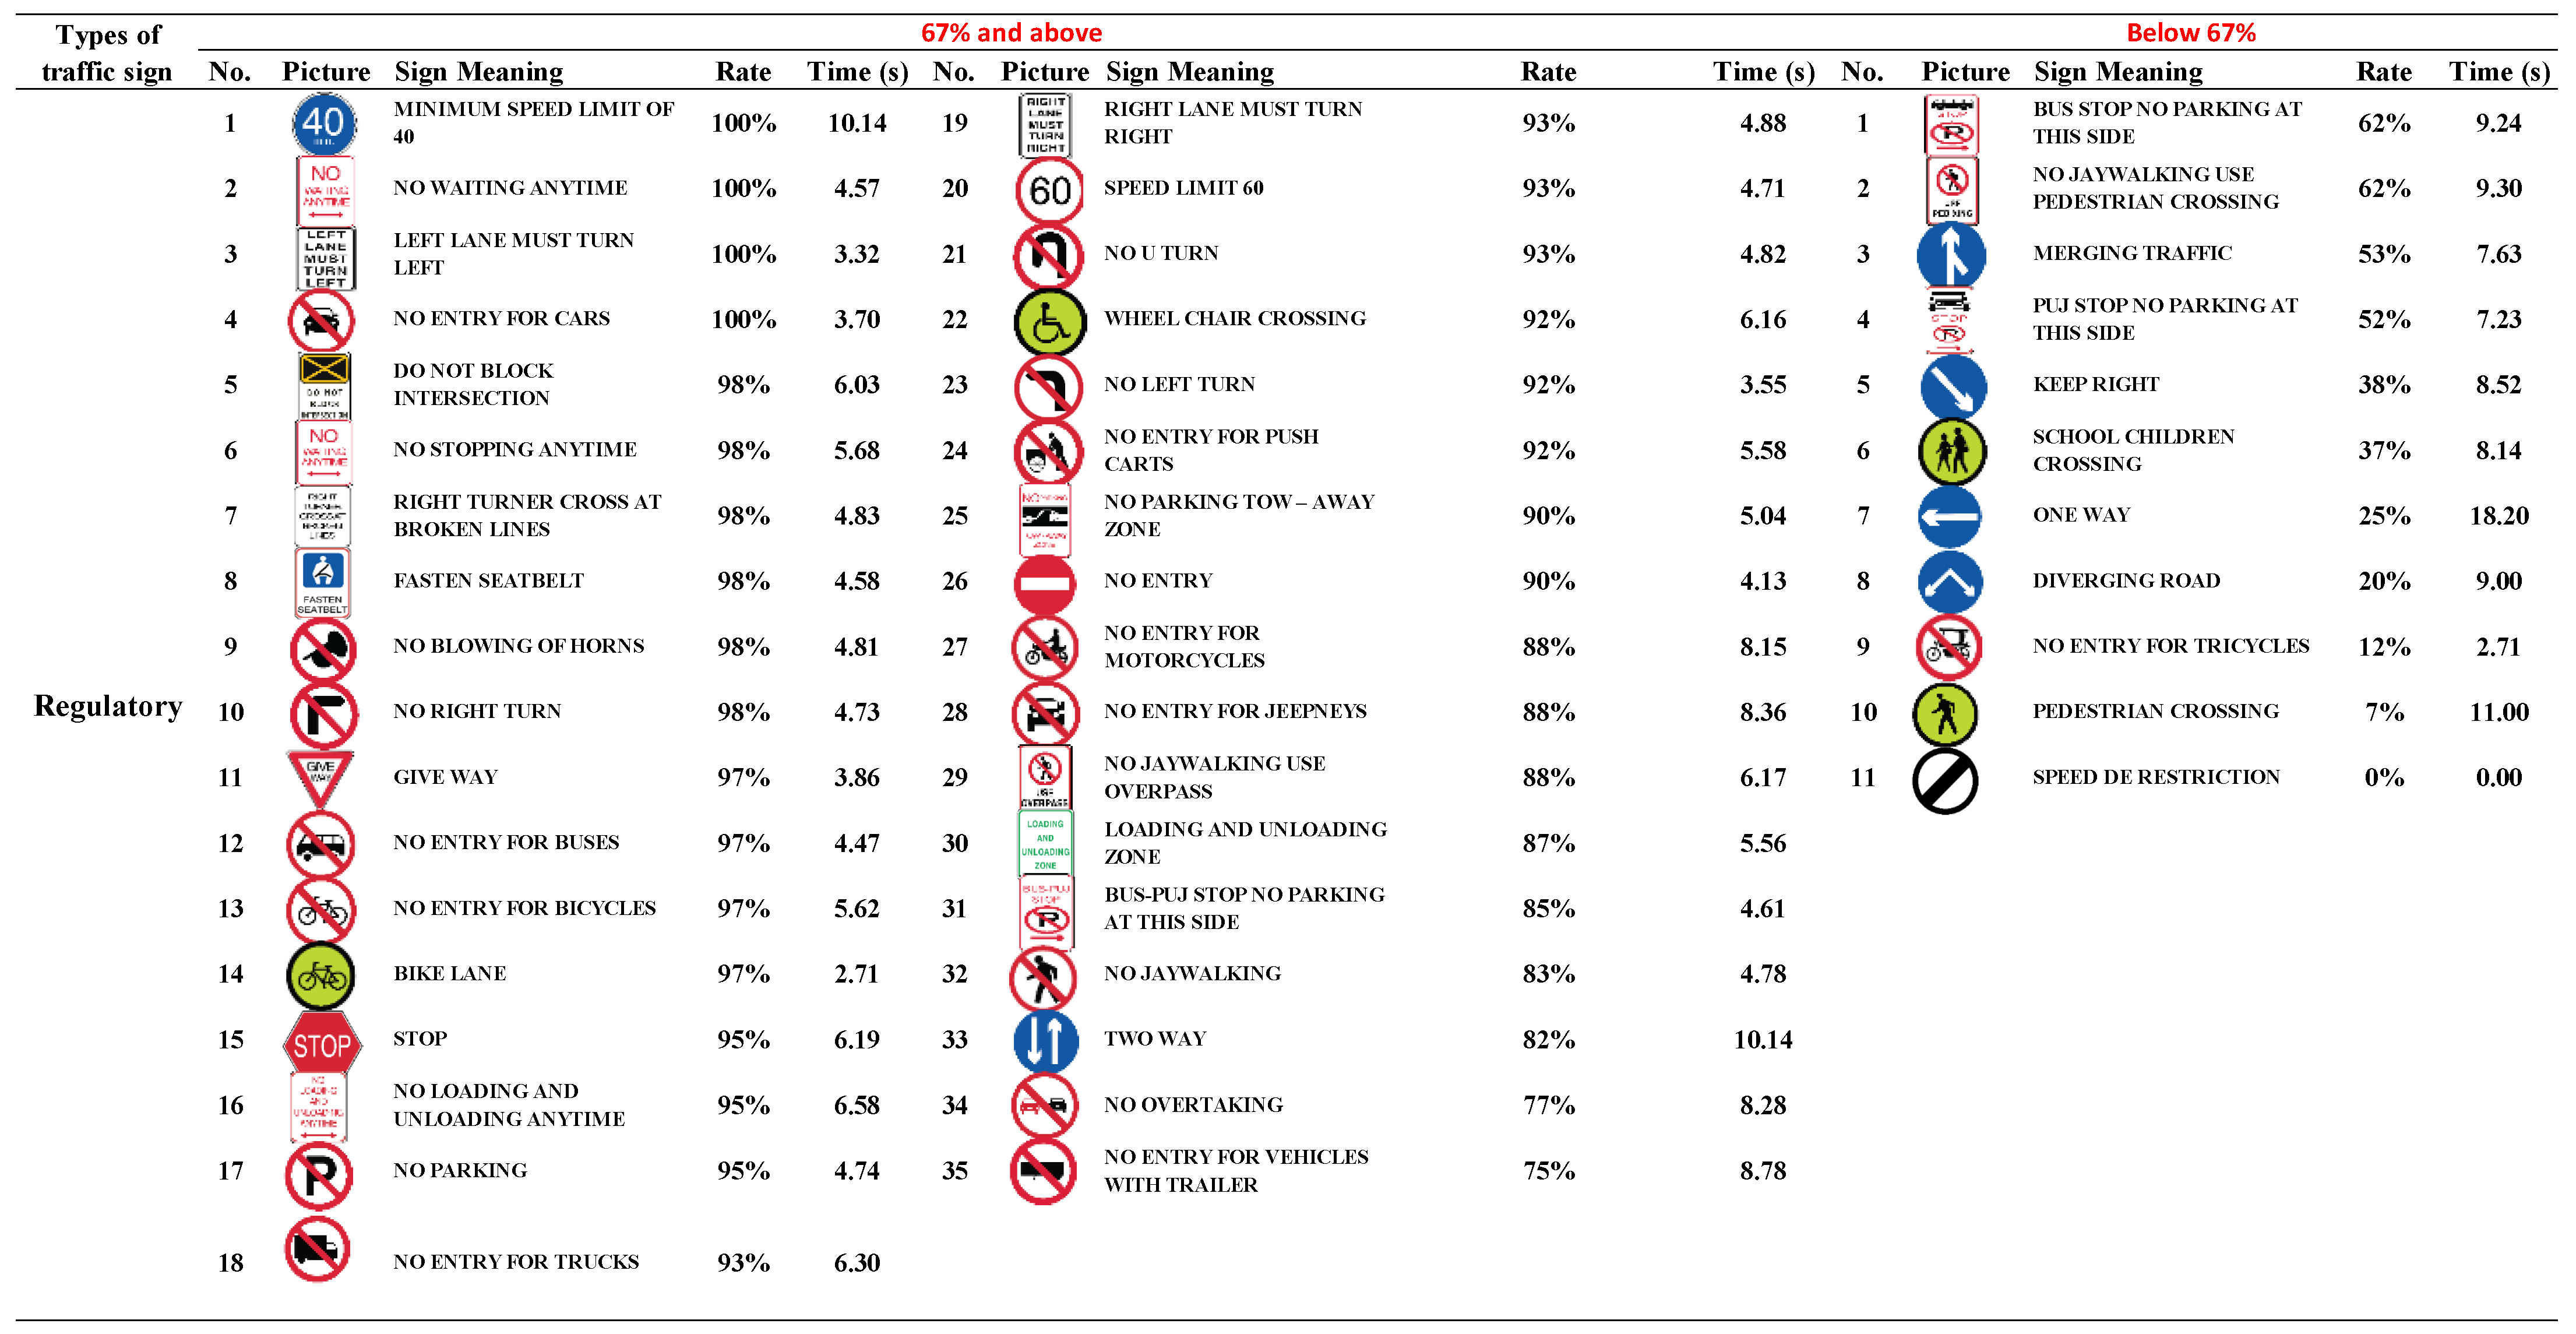
The results of the study showed that signs displayed in text may have higher matching accuracy, but not necessarily with faster matching times. For example,
![Applsci 12 08337 i015]()
“Left lane must turn left” obtained a 100 percent matching accuracy, but it was the
![Applsci 12 08337 i014]()
“Bike Lane” sign, which was displayed in symbol form, which was matched the fastest at 2.71 s. Similarly,
![Applsci 12 08337 i001]()
the minimum speed limit of 40 sign obtained a 100 percent matching accuracy, but it also registered one of the slowest matching times at 10.14 s. While some traffic signs were fully comprehended, the effect of late reaction could affect the driver’s preparedness and subsequent responsiveness to events [
36]. Thus, traffic sign effectiveness is not only attained through comprehension matching accuracy, but also through comprehension matching time.
Traffic signs are designed to prevent accidents and help road users adapt to the environment easily. However, almost thirty-seven percent of the 73 traffic signs failed to meet the 67% comprehension test passing rate set by ISO 3864-1:2011 [
25]. Between the two types of traffic signs, warning signs were more often miscomprehended, especially those presented in symbols. Symbolic signs are often misunderstood by drivers, even those that have already been standardized and used throughout the world [
14]. For example, Picha et al. [
37] found that low comprehension levels existed for several traffic symbols when evaluated by more than 3000 drivers in Texas. The use of symbols is sometimes preferred because it facilitates large amounts of information (relative to text occupying similar surface area) and avoids varying language and reading abilities among users. However, most of these symbols are poorly designed and difficult to understand [
16,
28]. Lack of understanding may reduce its intended purpose and may lead to violations and road accidents, including errors in making predictions about other road users’ actions [
38,
39].
To increase the comprehension of traffic signs, there is a need to redesign signs that failed the 67% comprehension standard, which were mostly symbolic signs. The proposed designs should be direct, simple, and closely related to the meaning by considering user perceptions [
40,
41]. With user participation in the design process, signs are more likely to be interpreted correctly by the intended meaning because they were directly mapped from the mental models of users [
42,
43]. However, redesigning the traffic sign based on the user’s perception is not enough because everyone has a different perception. Banares et al. [
19] incorporated ergonomic principles in redesigning the 21 poorly designed road warning signs in the Philippines. The redesigned alternatives led to substantial improvements in the comprehension level of drivers. Therefore, the 27 traffic signs that failed the 67% comprehension standard should also be redesigned, incorporating cognitive design features to increase comprehension scores.
Traffic signs which received the lowest ratings in cognitive design features were mostly in a symbol format. For instance,
![Applsci 12 08337 i019]()
“Give Way at Intersection Ahead” and
![Applsci 12 08337 i008]()
“Speed derestriction” both received the lowest ratings in concreteness, complexity, and familiarity. Consequently, these signs were also poorly comprehended;
![Applsci 12 08337 i019]()
“Give Way at Intersection Ahead” obtained a 17% matching accuracy, while none of the participants matched the
![Applsci 12 08337 i008]()
“Speed derestriction” correctly. In terms of semantic distance,
![Applsci 12 08337 i008]()
“Speed derestriction” also received the lowest rating at 2.72, the only traffic sign that obtained a semantic distance rating of below 3.0. The low rating can be attributed to its design which was very far from its intended meaning. For instance,
![Applsci 12 08337 i008]()
“Speed derestriction” can be confused with the symbolic “No-entry” sign, which was very far from its referent name of end of speed restriction. It should be noted that one important criterion for good sign design is its ability to induce comprehension of its meaning when being encountered for the first time (e.g., seeing the sign by nondrivers for the first time). However, even those with driving experience found difficulty in comprehending the meaning of this sign.
On the contrary, the
![Applsci 12 08337 i024]()
“No Right Turn” sign was comprehended well, obtaining a 98% matching accuracy. This is because the comprehension of drivers focuses on how consistent the sign symbols are to their cognitive expectations [
18]. Paninti [
44] compared several alternative symbols used to signify work zones and found that symbols with a good physical resemblance to what they are meant to signify were all well understood, even when the details of these symbols were different. In contrast, when the intended message was different to how it was conveyed symbolically, all proposed alternative symbols were not clearly understood [
44]. Therefore, the closer the semantic meaning of the sign, the higher the comprehension level.
Furthermore, the cognitive design feature ratings were also seen to be highest in semantic distance and concreteness. This was further validated by multiple regression analyses wherein semantic distance was associated with matching accuracy, while concreteness and familiarity were significant for predicting matching time (
Table 12). Interestingly, semantic distance alone contributed 59.53% in predicting matching accuracy, but semantic distance was not significant in predicting matching time. On the other hand, concreteness can explain 38.28% of the variance, while familiarity contributed 4.68% in predicting matching time. Thus, to improve comprehension performance, semantic distance, concreteness, and familiarity are the key cognitive design features that must be considered by designers. Specifically, this study found that semantic distance is the most significant predictor for matching accuracy, which was also the result obtained by other traffic comprehension studies [
3,
45]. For matching time, concreteness and familiarity are the best predictors, especially for warning signs, but also for signs displayed in symbols.
When changing the symbol was deemed impractical (e.g., when it was already consistent with international code), it is recommended to add text above or below the symbol to give drivers more opportunities to understand the meaning and to retain the information in memory [
11]. Interestingly, signs displayed in text using the local language resulted in better comprehension compared to other display conditions [
11]. In this study, signs in textual format were comprehended well by the Filipino participants since they can easily understand the texts which all were written in English. Since the application of the text is culture dependent, the use of variable message signs (VMS) technology can be used to display the text in different languages and can be placed at key decision points to facilitate better comprehension of drivers and nondrivers [
46]. Within countries, sign improvements have focused on ensuring both the consistency of design and the standardizing of sign design across countries and cultures [
47].
To resolve the issue of comprehension between drivers and nondrivers, Lesch [
16] suggested the conduct of training to enhance the users’ comprehension, especially for some symbolic signs that were difficult to comprehend. In the study of Ramakrishnan et al. [
48], they studied the differences in comprehension and matching time on airport safety signs before and after training. The participants’ comprehension and matching time for symbolic signs were enhanced after recognition and recall training. Ou and Liu [
3] also found that training significantly enhanced sign comprehension from an average comprehension score of 52% before training to 94% immediately after training. In addition, Wogalter et al. [
49] studied comprehension differences of pharmaceutical and industrial-safety signs before and after training and found that the comprehension of difficult signs before the training was 54% for the former and 34% for the latter, but this improved to 87% and 63%, respectively, six months after the training. Although there are cases when the comprehension level drops after a month [
49,
50], it is still better compared to the comprehension level before training.
Hung and Huyen [
51] explained that combining enforcement with education and training will have long-term effects on driver attitudes towards comprehension. Thus, educating all road users through continuous education or the retraining of drivers is a must. Ben-Bassat and Shinar [
52] also recommended that a test of traffic sign meaning should be considered as part of a relicensing process for drivers, to verify that they are familiar with new signs, and to refresh their memory on sign meanings in general. Thus, adapting retraining in license application and renewal in the country may help road users improve or sustain their knowledge regarding traffic signs. Therefore, the matching test developed in this study could be adopted as a mandatory retraining requirement for the renewal of drivers licenses by the Land Transportation Office (LTO), the government agency in the Philippines responsible for the issuance of licenses and permits. Upon the application or renewal of a license, the driver could be asked to take the matching test as a mandatory retraining requirement, and only after obtaining a 67% comprehension score could their drivers license be released. Furthermore, the LTO could use the results of the matching test to regularly analyze the comprehension level of Filipino drivers to find out which signs are difficult to comprehend. Our matching-based comprehension test can also be applied and extended to evaluate existing traffic signs worldwide.
Aside from improving traffic sign comprehension, other strategies to improve road safety include the prediction of short-term traffic flow. Chen et. al. [
53] evaluated the various smoothing models for cleaning anomalies in traffic flow data, which were further processed to predict short-term traffic flow evolution using artificial neural networks. The findings of the study provided efficient and accurate denoising approaches for short-term traffic flow prediction. In connection with traffic flow condition, Liu et al. [
54] developed a novel operational design for flex-route transit services to reduce vehicle operations and improve the service quality of customers. The regime allowed the simultaneous dispatch of a certain number of modular autonomous vehicles (MAV) from a bus terminal at a departure time, where each MAV was allowed to visit customers freely outside of checkpoints.
5. Conclusions
Being familiar and aware of the meaning of traffic signs is considered the first step towards safer roads in Metro Manila. The current study examined 73 existing traffic signs in the Philippines for their matching accuracy, matching time, and cognitive design features. A total of 30 Filipino drivers and 30 Filipino nondrivers were voluntarily recruited to perform matching-based comprehension tests. The results of the experiment showed that 27 out of the 73 traffic signs did not achieve the 67% comprehension standard set by ISO 3864-1:2011. Drivers had better matching accuracy and matching time for both regulatory and warning signs compared to nondrivers. Traffic signs displayed in symbols had the lowest matching accuracies and the longest matching times, while the traffic signs displayed in text only had the highest matching accuracies and the fastest matching times. When signs are displayed in symbols, drivers had higher matching accuracies compared to nondrivers.
The cognitive design features—concreteness, complexity, semantic distance, and familiarity—were all significant to matching time and matching accuracy. The cognitive design features were positively correlated to matching accuracy for both regulatory and warning signs, and negatively correlated to matching time for warning signs. For signs displayed in symbols, cognitive design features were also found to be correlated to matching accuracy and matching time.
To enhance the road user’s comprehension of traffic signs, traffic signs with very low ratings (e.g., fail to reach at least 67% comprehension score) must be redesigned incorporating cognitive design features such as semantic distance, concreteness and familiarity. Familiar symbols and symbols which have physical representation should be used for the easier and faster comprehension of traffic signs. Signs in textual format were comprehended well by the Filipino participants, since they can easily understand the texts which were all written in English. Since the application of the text is culture dependent, the use of variable message signs (VMS) technology can be used to display the text in different languages and can be placed at key decision points to facilitate better comprehension by drivers and nondrivers.
This study could contribute to better road safety design standards in Metro Manila by developing targeted programs for drivers and nondrivers. The findings would also be very beneficial for highway and traffic authorities to better understand drivers’ comprehension of various traffic signs. To guarantee an improved comprehension in the long run, the retraining and examination of drivers using the matching test developed in this study should be conducted. The Philippines’ Department of Transportation could adopt the matching test of the current study as a mandatory retraining requirement for the application and renewal of drivers’ licenses. Finally, our matching-based comprehension test could also be applied and extended to evaluate existing traffic signs worldwide.
Despite the clear and substantial contributions, the authors would like to acknowledge several limitations of this study. First, the demographics of the participants in terms of gender, age, and educational background were not analyzed, since these fall under the non-design category of comprehensibility. While drivers’ characteristics may have significant effects on comprehensibility, this study focused only on the design factors, such as the type and display conditions, which are more flexible to modification than the characteristics of drivers. Second, the participants for the current study were limited to the employees and students of Mapua University. While we only recruited 60 participants for this study, we ensured that these participants were selected based on the primary objective of this study. Furthermore, the increasing cases of violations and accidents due to disregarding traffic signs was hypothesized to be caused by a lack of traffic comprehension. Studies have found that the neglect of road users and the lack of comprehension lead to the major human errors in traffic accidents. Given the huge importance of verifying the effectiveness of traffic signs within the context of road safety, future researchers could consider developing a regression model to determine the relationship between comprehension and traffic accidents.


 minimum speed limit of 40,
  no waiting anytime,
  left lane must turn left, and
  no entry for cars. For warning signs,
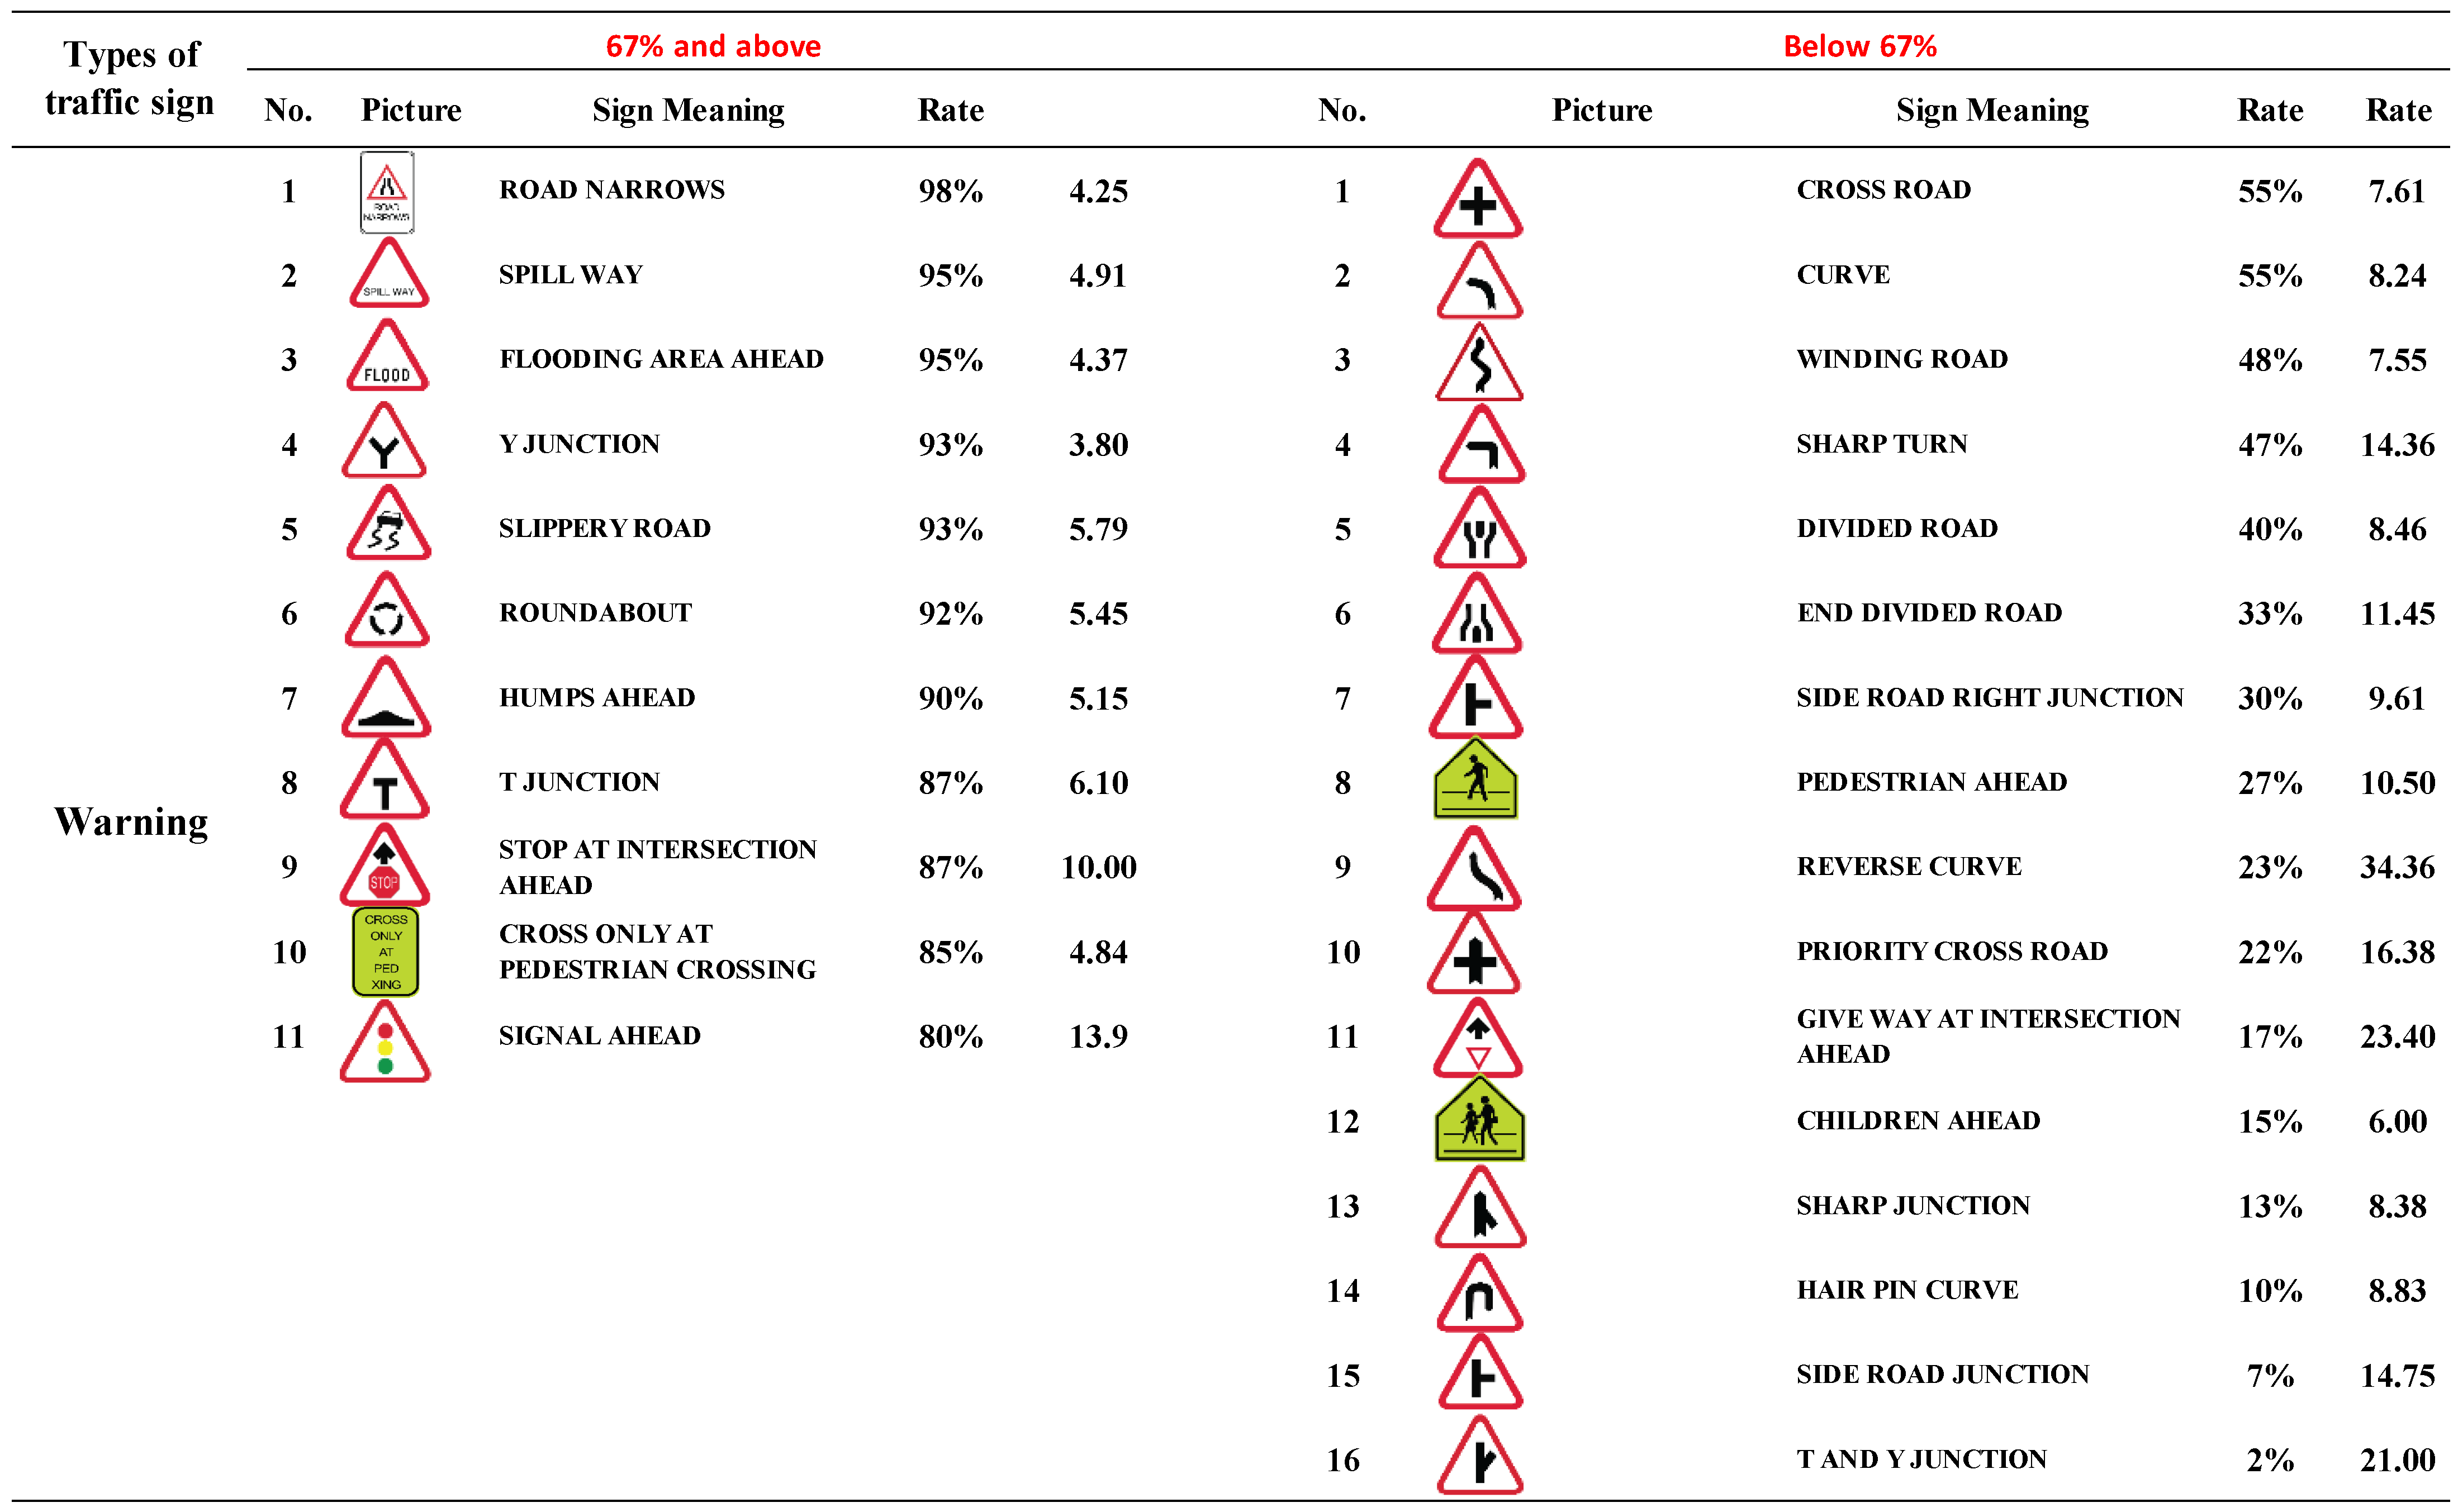
  road narrows obtained the highest matching accuracy at 98%, followed by
  spillway and
  flooding area ahead, which both got a 95% matching accuracy (Table 4). On the other hand, traffic signs which obtained a matching accuracy of below 67% were considered unacceptable because of the low comprehension test result. Among the regulatory signs, the lowest matching accuracy was obtained by
  speed derestriction, as none of the participants matched it correctly, followed by
  pedestrian crossing and
  no entry for tricycles, with 7% and 12% matching accuracy, respectively. For warning signs,
  T and Y junction had the lowest matching accuracy at 2%,
  side road junction with 7% and
  hairpin curve at 10% (Table 4).
 “Bike Lane” being matched with the fastest time of 2.71 s, followed by
  “Left lane must turn left” at 3.32 s and
  “No Left Turn” at 3.55 s.
  “Y Junction” was matched at 3.80 s, then
  “Signal Ahead” was matched with the slowest time of 13.90 s.
 “Give way at intersection ahead” received the lowest concreteness and complexity rating with 2.53 and 2.50, respectively. The participants perceived the sign as somewhat abstract and moderately complex.
  “Fasten Seatbelt” was rated as definitely concrete, with a rating of 4.63, which also received a high matching accuracy of 98%. The sign that was rated as simple was
  “Stop”, with a rating of 4.68 and a matching accuracy of 95%.
  “No Stopping Anytime” was rated as very strongly related to its intended meaning, with a rating of 4.83, and 98% matching accuracy.
  “Loading and Unloading Zone” was rated as very familiar, with a 4.97 rating and 87% matching accuracy.
 “No Right Turn” sign was comprehended well, obtaining a 98% matching accuracy. This is because the comprehension of drivers focuses on how consistent the sign symbols are to their cognitive expectations [18]. Paninti [44] compared several alternative symbols used to signify work zones and found that symbols with a good physical resemblance to what they are meant to signify were all well understood, even when the details of these symbols were different. In contrast, when the intended message was different to how it was conveyed symbolically, all proposed alternative symbols were not clearly understood [44]. Therefore, the closer the semantic meaning of the sign, the higher the comprehension level.


