Abstract
Using ultrasonic pulse velocity (UPV) testing has long been regarded as an effective approach for evaluating concrete strength; however, because of the influence of numerous factors (e.g., mixture proportion, type of coarse aggregate, pozzolanic admixture, and age of the concrete), the relationship between UPV and concrete strength cannot be conclusively determined, thus hindering the application of this approach. The objective of this paper is to develop a unified equation for prediction of concrete strength at various ages using the ultrasonic pulse velocity. Firstly, this study investigated the relationship between the UPV evolution index and the strength evolution index of normal concrete with various mixture proportions, coarse aggregate types, and ages. Subsequently, the influence of adding pozzolanic materials on this relationship was considered. The experimental results showed that excellent correlation between the UPV evolution index and the strength evolution index was found and a unified equation was established in this study through regression analysis to represent the relationship between the UPV and the strength evolution index. Finally, the applicability of the unified equation was verified by data obtained from different studies. The results indicated that for all concrete specimens more than 3 days old, the error of the strength estimation decreased to within ±15%, demonstrating that this unified equation has substantial value for application in decision-making processes for major construction procedures (e.g., applying post tensioning or removing formwork supports).
1. Introduction
The use of ultrasonic pulse velocity (UPV) to evaluate the strength of concrete has always been a goal for scholars of nondestructive testing. Various long-term studies [,,,,,,,,,,] have indicated that the volume distribution proportion of cementitious materials (i.e., cement and pozzolanic material) and filler materials (coarse and fine aggregates) influences the relationship between the UPV and strength of concrete. Furthermore, various types of coarse aggregates also affect the relationship between UPV and concrete strength [,]. Many researchers proposed various equations to describe the UPV-strength relationship [,,,], but the uncertainty of the concrete strength estimated by the proposed equations is still high. Therefore, in order to have a relatively small variation in estimating concrete strength using UPV, a relationship between UPV and strength must be established for the concrete having the same mixture proportion and aggregate type; it can then serve as the basis for quantitative assessment of concrete strength. Until now, because the relationship between UPV and strength of concrete remains unclear and cannot be systematically inferable, bottlenecks remain in the application of UPV for estimating concrete strength.
In their research on the relationship between UPV and strength of concrete, Lin et al. [] indicated that, when concrete is viewed as a two-phase material including mortar and coarse aggregate, then, for a specific cement paste volume and single-type coarse aggregate (i.e., with a similar UPV), the relationship between the UPV and strength of hardened concrete can be simplified as subject to only the influence of coarse aggregate content. However, this relationship does not apply to early-age concrete, primarily because considerable differences can be observed in concrete with various water-to-cementitious-material ratios in terms of UPV and strength growth rate. Coarse aggregate type is another unneglectable factor because different aggregate types can substantially affect the UPV of concrete but exert a nonsignificant influence on the strength of normal concrete. Comprehensively considering the influences of concrete mixture proportion, age, and pozzolanic material content can render the relationship between concrete UPV and strength rather complicated, which is why the application of UPV nondestructive testing methods in estimating concrete strength has remained limited. In particular, concrete at an early age exhibits a high level of hydration, further complicating the investigation of the relationship between UPV and concrete strength [,]. A multivariate model treating UPV and curing age as variables was proposed and used to estimate the strength of concrete at various ages and the results showed that the corresponding 95% prediction limits were determined as ±11.8 MPa [].
In this study, the testing results of the UPV and strength of concrete that had set for various ages and had different water-to-cementitious material ratios (w/cem), paste content, pozzolanic material content, aggregate content, and coarse aggregate type were compiled and analyzed to obtain a simplified and functional relationship between the UPV and strength development of concrete at different ages. Based on the idea that differences in mixture proportion and material type are eventually reflected in the final properties of hardened concrete, this study proposes a method for characterizing the relationship between the evolution index of UPV and strength in an attempt to clarify the complex relationship between UPV and strength in concrete. This study aims to establish a unified equation to represent the relationship between the UPV and the strength evolution index. The testing results of concrete with various mixture proportions were collected for strength estimation to verify the feasibility of using the unified equation to perform quantified evaluation of concrete strength at different ages.
2. Research Design and Testing Plan
2.1. Research Design
Concrete is composed of water, cementitious materials, and aggregates. At an early age, concrete exhibits high levels of hydration, and its UPV and strength positively correlate with the hydration of cementitious materials. By comparison, during the entire hydration process, the physical and chemical characteristics of aggregates do not change by age. Overall, variations in concrete UPV and strength during the hydration process are mainly affected by the water-to-cementitious-material ratio and the addition ratio of the pozzolanic material. Therefore, this research originally attributed increases in UPV and strength to the hydration level of cementitious materials. Moreover, the aggregate type and the mixture proportion primarily served as the reference for determining the final UPV and strength of the concrete. On the basis of these ideas, the concept of a relationship curve between the UPV and the strength evolution index was proposed []. By dividing the UPV (Vn) and strength (Sn) of concrete at various ages by the terminal UPV (Vt) and strength (St) after hardening, respectively, the evolution indexes Vg (Equation (1)) and Sg (Equation (2)) could be obtained.
The terminal UPV and strength of concrete may vary with variations in mixture proportions and they are used as normalized baselines in this study.
2.2. Testing Plan
Portland cement Type I served as the primary cementitious material, river sand with a unit weight of 2.62 ± 0.1 kg/cm3 was adopted as the fine aggregate, and crushed stone with a unit weight of 2.60 ± 0.1 kg/cm3 was used as the coarse aggregate. All aggregates were washed before being mixed. Test parameters included mixture proportion and pozzolanic material admixture; an appropriate amount of superplasticizer was also added to sustain workability. Cylindrical concrete specimens as shown in Figure 1 with dimensions of 10 cm (D) × 20 cm (H) were used in this study. They were all placed in water at 23 °C for curing and taken out for measurement. Excess moisture on the surface was wiped away using a dry cloth to ensure that the specimens were dry outside but saturated inside (ASTM C128 []). ASTM C597 [] and ASTM C39 [] methods were then employed to obtain the UPV and compressive strength of the concrete specimens, respectively.
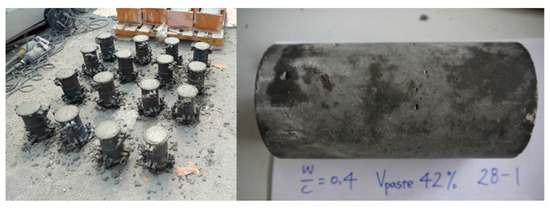
Figure 1.
Cylindrical concrete specimens.
Through a direct transmission mode, UPV was measured by a commercially available pulse meter with an associated transducer pair. The transducer pair had a nominal frequency of 54 kHz, which was relatively low compared to other ultrasonic applications and suitable for concrete. The principle of ultrasonic pulse velocity measurement involves sending a wave pulse into concrete and measuring the travel time for the pulse to propagate through the concrete. Knowing the path length, the measured travel time can be used to calculate the pulse velocity.
In this study, concrete that had a volume fraction of cement paste of 36% (Vpaste) and had a sand-to-aggregate ratio (S/A) of 45% was used as the main research subject. The S/A refers to the percentage of fine aggregate in relation to the total aggregate weight. Variations were then introduced to this mixture proportion to investigate the effect of various factors on the relationship between UPV and the strength evolution index. Table 1 presents the mixture proportions of concrete specimens that comprised normal Portland cement (Vpaste = 36%, S/A = 45%) and had water-to-cementitious-material ratios (w/cem) ranging from 0.3–0.7. The specimens were numbered NC1 to NC5 to serve as a reference for establishing the relationship between UPV and the strength evolution index. Subsequently, to clarify the effect of various coarse-aggregate-to-fine-aggregate content proportions under a fixed paste volume ratio, the concrete mixture proportions listed in Table 2 were adopted. Specimens numbered NC6–NC20 had w/cem ranging from 0.3–0.7, a fixed Vpaste of 36%, and S/A of 30, 45 and 60%.

Table 1.
Mixture proportions adopted to establish the reference relationship curve between UPV and the strength evolution index.

Table 2.
Mixture proportions of various levels of coarse aggregate content in normal concrete.
Table 3 and Table 4 present the concrete mixture proportions containing pozzolanic materials. As indicated in Table 3, fly ash replaces cement at a ratio of 15% and two Vpaste, 36 and 42%, were adopted; the specimens were labeled FC1–FC5. As seen in Table 4, slag replaces cement at a ratio of 30% and the two Vpaste of 36 and 42% were adopted; the specimens were labeled SC1–SC10. The mixture proportions in Table 3 and Table 4 were used to investigate the effects of differences in the addition of pozzolanic materials and variation in the paste volume ratio on the relationship between UPV and the strength evolution index.

Table 3.
Mixture proportions of various levels of fly ash concrete paste content.

Table 4.
Mixture proportions of various levels of slag concrete paste content.
Two types of coarse aggregate (i.e., Type 1 and Type 2) were used in this study. Specimens listed in Table 1 (NC1–NC5) and Table 3 (FC1–FC10) adopted Type 1 coarse aggregate, whereas specimens in Table 2 (NC6–NC20) and Table 4 (SC1–SC10) adopted Type 2 coarse aggregate. Type 1 coarse aggregate had a specific weight of 2.60 and a UPV of 5175 m/s, whereas Type 2 coarse aggregate had a specific weight of 2.59 and a UPV of 5361 m/s.
The UPV and strength of three concrete cylinders were measured at all ages. The measurement results of the three specimens were then averaged to obtain the UPV and strength data of concrete at specific ages. Table 5 and Table 6 summarize all the measured UPV and strength data pairs for normal concrete and pozzolanic concrete, respectively, at various ages.

Table 5.
The measured UPV and strength data for normal concrete.

Table 6.
The measured UPV and strength data for pozzolanic concrete.
3. Relationship between UPV and Strength Evolution Index of Concrete
3.1. Relationship between UPV and Strength in Normal Concrete
Figure 2a shows the testing results of NC1–NC5, which adopted the mixture proportions in Table 1. The UPV–strength curve of concrete with a w/cem of 0.3 is located on the upper end of the curve, followed sequentially by the curves of concrete with w/cem of 0.4, 0.5, 0.6, and 0.7. The measurements were conducted at specimen ages of 1, 3, 7, 14, 21, and 28 days. For the concrete with a w/cem of 0.3, the testing results revealed a relatively high UPV and strength evolution index; nearly all points on the relationship curve became adjacent to each other after 3 days. As the w/cem increased, the various points that comprised the relationship curve gradually became scattered, and the relationship curves moved downwards. In other words, concrete strength decreased in accordance with increases in the w/cem. Figure 2a clearly shows that the relationship curves of concrete with various water-to-cementitious-material ratios were mutually independent and dispersed.
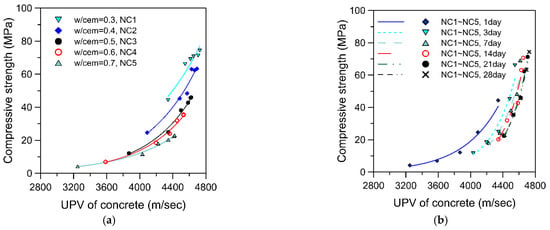
Figure 2.
Relationship of UPV and strength in normal concrete: (a) regression based on water-to-cementitious-material ratio; (b) regression based on the specimen age.
Compiling the relationship curves of concrete at different ages yielded Figure 2b, which exhibits that the distribution of the relationship curve between UPV and strength is highly related to the concrete age. Along with increases in the age of the concrete, the UPV and strength relationship curve of the concrete moved to the upper right of the figure. In terms of the shape of relationship curve, a substantial radian change was observed at an age of 1 day; however, the degree of change decreased over time. The curve shapes of all concrete specimens became fairly similar after 14 days. Figure 2b reveals that the increase in UPV due to relatively low w/cem is more apparent when the concrete is at early ages, but the difference in cementitious material content exerts less influence on increases in UPV when the concrete has a longer period of curing time. Figure 2b shows that the relationship curves of concrete specimens at different ages are independent and scattered. In Figure 2a,b, the relationship between concrete UPV and strength is weak; thus, a simple yet general regression curve could not be obtained.
Dividing the UPV (Vn) and strength (Sn) of specimens at various ages in Figure 2a by their corresponding terminal UPV (Vt) and strength (St) of concrete, one can obtain the relationship between the UPV evolution index (Vg) and the strength evolution index (Sg) of concrete with different mixture proportions, as depicted in Figure 3. Figure 3 indicates that, as the w/cem decreased, the UPV and strength evolution index became closer to the top of the figure. In other words, smaller w/cem corresponded to a higher UPV and strength evolution index when the concrete was at an early age, and vice versa. In Figure 3, the distribution of the UPV and strength evolution index data points of specimens with different mixture proportions and at different ages is highly concentrated. By inputting the data into an exponential function for regression analysis, an optimal regression curve, , was obtained, where R2 = 0.968. The regression results for Figure 3 reveal that the UPV and strength evolution index of concrete specimens with different water-to-cementitious-material ratios at different ages exhibited satisfactory correlation. Therefore, the UPV and strength evolution index of normal concrete with different mixture proportions should be capable of being simplified into a single regression curve.
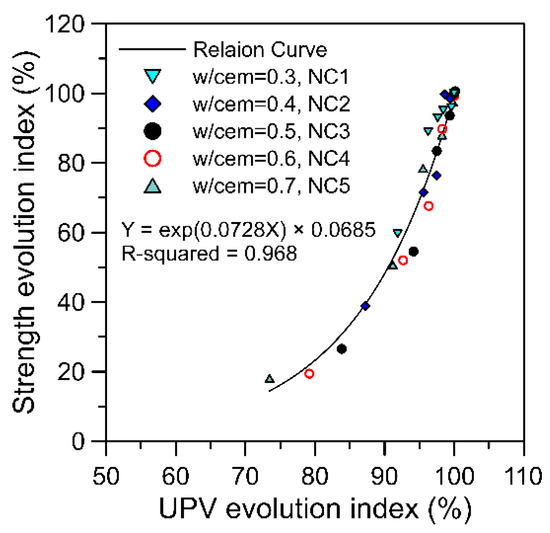
Figure 3.
Relationship between the UPV evolution index and the strength evolution index of normal concrete.
3.2. Influence of the Proportion of Coarse-to-Fine Aggregates
This section explores the influence of differences in the content of coarse and fine aggregates on the relationship between concrete UPV and strength under the condition of a fixed volume of paste. The specimens were prepared according to the mixture proportions listed in Table 2; specifically, the Vpaste was 36%, the S/A were 30, 45 and 60%, and the specimens were tested at 1, 3, 7, 14, and 28 days. Figure 4a presents the relationship curves of UPV and strength for concrete specimens with different sand–aggregate ratios. Noticeable variation was apparent among these relationship curves; specifically, increases in the S/A caused the relationship curves to move to the right. The results indicated that the relationship curves of specimens with different sand–aggregate ratios were fairly scattered and that no simplified single relationship curve could be obtained.
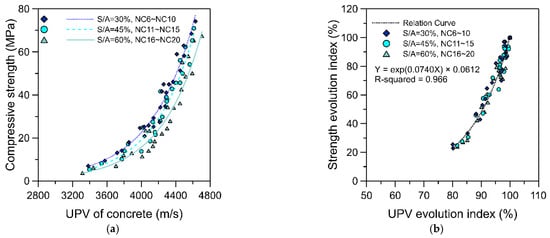
Figure 4.
Relationship between the UPV and strength of normal concrete specimens with various coarse–fine aggregate mixture proportions: (a) UPV and strength, (b) UPV and strength evolution index.
When the UPV and strength data of specimens with different mixture proportions and at different ages in Figure 4a were converted into UPV and strength evolution index, a relationship curve could be replotted (Figure 4b). This figure reveals that the distribution of data points for the UPV and strength evolution index is highly concentrated. An exponential function could then be employed for regression analysis. The optimal curve was determined to be where R2 = 0.966. The regression results of Figure 4b again indicate that the UPV and strength evolution index of the concrete specimens with various S/A and at different ages, which were obtained with reference to the terminal UPV and strength evolution index, exhibited strong correlation. Thus, the relationship between concrete UPV and strength evolution index could be simplified into a single regression curve.
Regarding the possible influence of different sources of coarse aggregate on the relationship between concrete UPV and strength, the testing results of two concrete groups, namely NC1–NC5 listed in Table 1 and NC11–NC1 listed in Table 2, were adopted for comparison and analysis. Even though these two groups of concrete had identical mixture proportions, they exhibited dissimilar UPV values because of their different coarse aggregate sources. Figure 5a presents the relationship curves of UPV and strength for concrete with different sources of coarse aggregate. A significant difference can be observed in the relationship curves of the two groups; the increase in the UPV of coarse aggregate (Type 2) leads the relationship curve to move to the right.
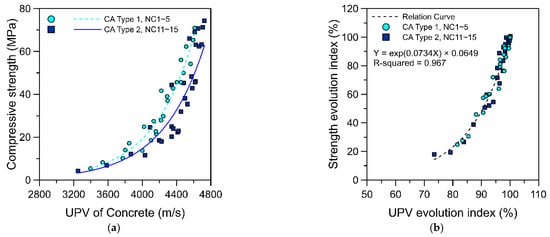
Figure 5.
Relationship between UPV and strength for normal concrete specimens with different types of aggregate: (a) UPV and strength, (b) UPV and strength evolution index.
The UPV and strength data presented in Figure 5a of specimens with different mixture proportions and at different ages were again converted into UPV and strength evolution index to construct relationship curves, as depicted in Figure 5b. Figure 5b reveals that the distribution of data points for the UPV and strength evolution index of the specimens with different mixture proportions and at different ages is again highly concentrated. Inputting the data into an exponential function for regression analysis yielded an optimal curve, , where R2 = 0.967.
The results presented in this section with respect to differences in aggregate proportion and source of coarse aggregate revealed that the regression relationship between concrete UPV and the strength evolution index remained satisfactory. The following sections investigate whether the addition of pozzolanic materials and changes in paste volume ratio exert significant influence on the relationship between concrete UPV and the strength evolution index.
3.3. Influence of Pozzolanic Material and Paste Volume Ratio
The testing results in the previous section revealed that differences in the S/A and coarse aggregate type did not have a significant influence on the correlation between UPV and the strength evolution index. This section examines the influence of adding pozzolanic materials and altering the paste volume ratio. The specimens were prepared according to the mixture proportions in Table 3 for fly ash concrete and those in Table 4 for slag concrete. Because a lower evolution index in strength was observed for concrete samples in which pozzolanic materials such as fly ash and slag were added compared with normal concrete, the time points for testing were 3, 7, 14, 21, 28, 56, and 70 days. During analysis, the UPV and strength values of specimens at an age of 70 days were adopted as the terminal UPV and strength values for concrete with pozzolanic material.
Figure 6a displays the testing results of specimens produced according to the mixture proportions listed in Table 3 for fly ash concrete. As indicated in Figure 6a, the regression curves of the UPV and strength evolution index were nearly identical for fly ash concrete with different paste volume ratios (i.e., 36 and 42%). Figure 6b presents the testing results of specimens produced according to the mixture proportions listed in Table 4 for slag concrete. The regression curves of the UPV and strength evolution index for slag concrete with different paste volume ratios (i.e., 36 and 42%) again nearly overlap. The results of a regression analysis of Figure 6a,b reveal that changes in paste volume ratio did not affect the regression curves of the UPV and strength evolution index of concrete with pozzolanic material. However, the terminal UPV and strength values used for concrete with pozzolanic material were measurement results obtained at an age of 70 days.
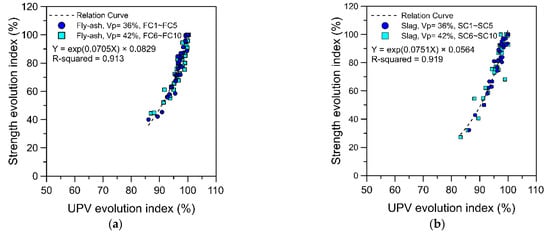
Figure 6.
Effects of adding pozzolanic admixture and altering the paste volume ratio on the UPV and strength evolution index: (a) fly ash concrete; (b) slag concrete.
To evaluate the difference between normal concrete and concrete with pozzolanic material, the data of normal concrete specimens (NC1–NC5) with identical paste volume ratios (Vp = 36%) and sand–aggregate ratios (S/A = 45%) were combined with the data of pozzolanic concrete for analysis. Figure 7 displays the relationship between the UPV and strength evolution index for specimens NC1–NC5, FC1–FC5, and SC1–SC5. The terminal UPV and strength data for the normal and pozzolanic concrete were the test results at 28 and 70 days, respectively. Figure 7 demonstrates that the data points for the UPV evolution index had a strong correlation with the data points for the strength evolution index. An exponential function was then adopted for a regression analysis. The optimal fitting curve was obtained as , where R2 = 0.951. This result indicates that, as long as the UPV and strength values measured at 70 days were adopted as the terminal UPV and strength for the pozzolanic concrete, the relationship between the UPV and strength evolution index of normal and pozzolanic concrete should still have been able to be expressed using a single relationship curve.
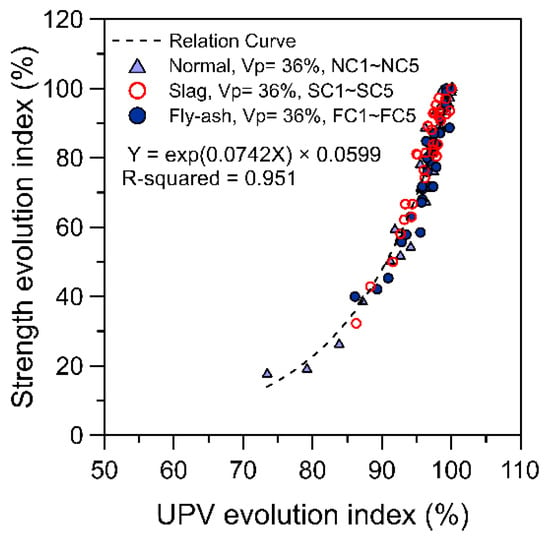
Figure 7.
Relationship between the UPV and strength evolution index of normal and pozzolanic concrete.
3.4. A Unified Equation for the Relationship between UPV and the Strength Evolution Index
The aforementioned results indicated that the adoption of various mixture proportions in this study, namely with respect to the water-to-cementitious material ratio, paste volume ratio, sand–aggregate ratio, type of aggregate source, and amount of pozzolanic material, exhibited limited influence on the concrete UPV and strength evolution index. Therefore, the test data of all mixture proportions in Table 1, Table 2, Table 3 and Table 4 were compiled to conduct a regression analysis on the UPV and strength evolution index (Figure 8). As indicated in Figure 8, the data points for the UPV and strength evolution index of concrete specimens with various mixture proportions exhibited a concentrated distribution. Specifically, these data points were distributed evenly along both sides of the regression curve of the relationship, suggesting favorable correlation between the UPV and the strength evolution index of concrete specimens with different mixture proportions at different ages. For practical application, the relationship between the UPV and the strength evolution index should be as simplified as much as possible. The regression function as given in Equation (3), derived from Figure 8, was used as a unified equation for subsequent estimations of the concrete strength evolution index using the UPV evolution index.
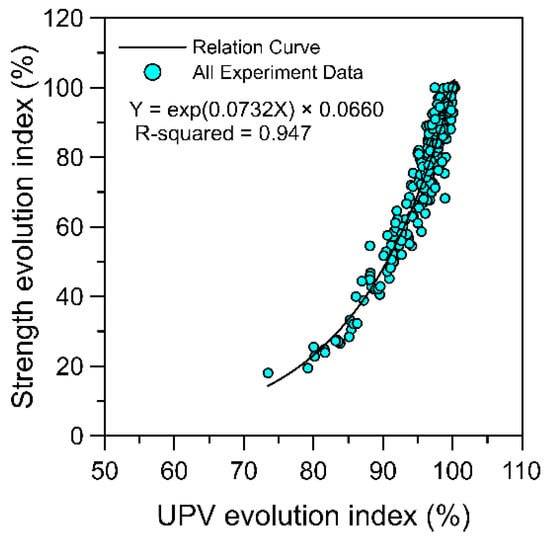
Figure 8.
Compilation of the test data of all mixture proportions to establish a general regression relationship curve of the UPV and the strength evolution index.
4. Verification of the Applicability of the Unified Equation
In this section, tests were performed on the established unified equation (Equation (3)) for the UPV and the strength evolution index to verify its applicability for estimating concrete strength. First, the aforementioned test data underwent self-verification. The specimens examined were NC1–5, NC6–20, FC1–10, and SC1–SC10. For concrete with a specific mixture proportion, dividing the UPV measured at a specific age by the terminal UPV yielded the UPV evolution index (Vg) of the concrete. By substituting Vg into Equation (3), the strength evolution index (Sg) of the concrete at that age was obtained. Multiplying Sg with the terminal strength of that mixture proportion yielded the estimation of the concrete strength. Terminal UPV and strength refer to the UPV and strength values at 28 days for normal concrete but at 70 days for pozzolanic concrete.
Figure 9 presents a comparison of the estimated strengths of all specimens and the strengths measured by performing compression tests. The errors between the strength estimations and actual measurements were generally in the range of ±15%, indicating that the unified equation (Equation (3)) could be applied for estimating concrete strength at different time points.
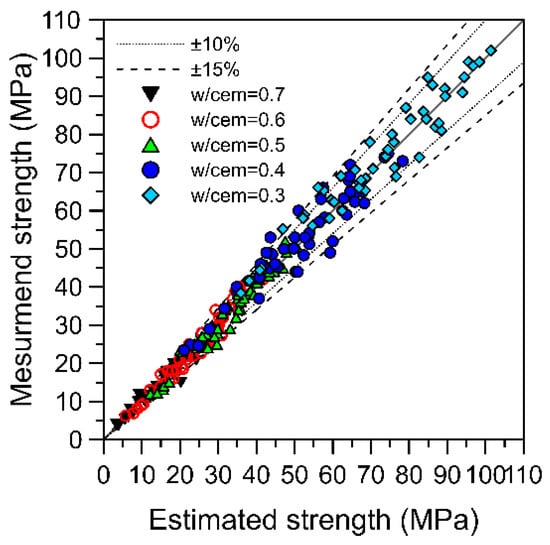
Figure 9.
Comparison between actual strength measurements and concrete strength estimations obtained using the unified equation.
In addition to using the established relationship curve data to perform self-applicability tests, this study also collected the test data of numerous relevant studies [,,,,] regarding UPV and strength values at different ages, which could be adopted to examine the applicability of the proposed unified equation. The collected data was for concrete with numerous paste volume ratios, coarse aggregate contents, and pozzolanic admixture contents; these mixture proportions are listed in Table 7 for normal concrete and Table 8 for pozzolanic concrete. In total, 34 mixture proportions were documented. Table 9 and Table 10 summarize all the measured UPV and strength data pairs collected from the relevant studies for normal concrete and pozzolanic concrete, respectively, at various ages. It should be noted that the UPV and strength values at 56 days instead of 70 days for pozzolanic concrete were used as the terminal UPV and strength values required for the calculation of evolution index due to the lack of test data at 70 days.

Table 7.
Normal concrete mixture proportions collected from the relevant studies for verifying the applicability of the unified equation.

Table 8.
Pozzolanic concrete mixture proportions collected from the relevant studies for verifying the applicability of the unified equation.

Table 9.
The measured UPV and strength data collected for normal concrete.

Table 10.
The measured UPV and strength data collected for pozzolanic concrete.
Figure 10a presents a comparison between the UPV-based strength estimations of concrete at different ages and the strength measurements obtained from actual compression tests. Of the 203 entries of verification data, most achieved an error within ±15%; only 27 entries (13.3%) had an error greater than 15%. To determine the possible cause of the relatively large error in prediction, another comparison chart, Figure 10b, was created, which compares the estimation results of concrete among samples at 1~3 days old and among those at all ages. Figure 10b reveals that 21 entries (approximately 10.3%) with estimation errors greater than 15% were identified in the estimation results for concrete at ages within 3 days, and these errors were all relatively conspicuous. In other words, only 6 entries (3.0% of the total verification data) with prediction errors greater than 15% were identified for concrete samples at ages more than 3 days, and these errors were only slightly greater than 15%. This result indicates that using the proposed unified equation to estimate the strength of concrete at ages after 3 days can yield highly reliable estimations.
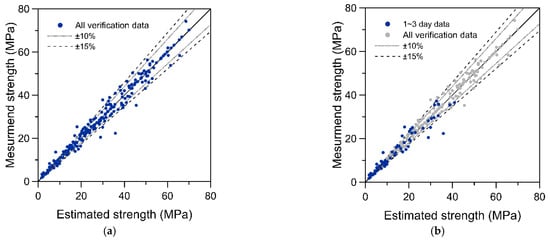
Figure 10.
Comparison between the concrete strength measurements and estimations made using the unified equation: (a) estimation results of concrete at all ages; (b) comparison of the estimation results within 3 days of setting and at all ages.
Further exploration indicated that estimations using the unified equation seem to have higher percentages of error in concrete specimens at ages less than 3 days. Concrete at ages between 1–3 days exhibits the highest hydration rate, and the influence of different water-to-cementitious material ratios and levels of pozzolanic material content on variations in concrete UPV and strength is also the most conspicuous during this period. Therefore, using the unified equation of the relationship between UPV and the strength evolution index for concrete in this period incurs a relatively high level of uncertainty.
For practical applications in construction, the execution of major construction procedures such as applying post tensioning or removing formwork supports requires the concrete to achieve a specific level of strength. The aforementioned construction procedures are usually carried out three days after the concrete is placed. At this time, the strength estimation accuracy and reliability of the unified equation are both high. In particular, in the actual application of the unified equation, only the terminal UPV and strength of the same batch of concrete need to be obtained; the mixture proportions of the concrete and the UPV–strength relationship curve are unnecessary. This method should be easy to execute for the nondestructive testing and quality control of concrete strength in construction projects.
Finally, it is necessary to reiterate that the innovation of this research is to find a unified equation to describe the relationship between the UPV and strength evolution index. For practical application, the terminal UPV and strength need to be known first. For a large construction project that takes several years, the terminal UPV and strength of the concrete used in the project can be measured at the early stage of construction (28-day or 70-day age of concrete). In the following years of construction, the unified equation proposed in this study can be used to predict the strength of concrete at different ages for the execution of major construction procedures and quality control.
5. Conclusions
The relationship between the UPV and strength of normal concrete is substantially influenced by the mixture proportions and the age of the concrete. In this study, regression analyses were conducted separately on the water-to-cementitious-material ratio and age, and the relationship curves thus obtained were mutually independent and scattered. Thus, no simplified single curve could be obtained for the relationship between concrete UPV and strength.
Based on the idea that differences in mixture proportion and material type are eventually reflected in the final properties of hardened concrete, this study proposes a method for characterizing the relationship between the evolution index of UPV and strength and aims to establish a unified equation to represent the relationship between the UPV and the strength evolution index. The following conclusions were drawn from the testing results:
- Converting the relationship between the UPV and strength into that of UPV and the strength evolution index yielded sufficiently convergent correlations for normal concrete with various mixture proportions and at different ages. Moreover, this convergence did not decrease when pozzolanic materials were added.
- This study established a unified equation for representing the relationship between the UPV evolution index and the strength evolution index of concrete. The UPV and strength values at 28 days for normal concrete and those at 70 days for pozzolanic concrete were used as the terminal UPV and strength values required for the calculation of the evolution index.
- The proposed unified equation could be used to estimate the strength of concrete at different ages. The estimation results indicated that almost all specimens over 3 days old achieved an error of less than ±15%; therefore, the proposed unified equation has substantial value for practical application in major construction procedures (e.g., applying post tensioning or removing formwork supports).
Author Contributions
Conceptualization and methodology, Y.L. and Y.-C.L.; measurements, Y.-C.L.; data analysis, Y.L., Y.-C.L. and C.-C.C.; writing-original draft preparation, Y.-C.L. and Y.L. All authors have read and agreed to the published version of the manuscript.
Funding
Not applicable.
Institutional Review Board Statement
Not applicable.
Conflicts of Interest
The authors declare no conflict of interest.
References
- Tanigawa, Y.; Baba, K.; Mori, H. Estimation of concrete strength by combined nondestructive testing method. In In Situ/Nondestructive Testing of Concrete; American Concrete Institute: Farmington Hills, MI, USA, 1984; Volume 82, pp. 57–76. [Google Scholar]
- Sturrup, V.R.; Vecchio, F.J.; Caratin, H. Pulse velocity as a measure of concrete compressive strength. In In Situ/Nondestructive Testing of Concrete; American Concrete Institute: Farmington Hills, MI, USA, 1984; Volume 82, pp. 201–227. [Google Scholar]
- Andersen, J.; Nerenst, P. Wave velocity in concrete. J. Am. Concr. Inst. 1952, 48, 613–636. [Google Scholar]
- Andrej, G. Estimate of concrete strength by ultrasonic pulse velocity and damping constant. J. Am. Concr. Inst. 1967, 64, 678–684. [Google Scholar]
- Lin, Y.; Changfan, H.; Hsiao, C. Estimation of high-performance concrete strength by pulse velocity. J. Chin. Inst. Eng. 1998, 20, 661–668. [Google Scholar] [CrossRef]
- Popovics, S.; Rose, L.J.; Popovics, J.S. The behavior of ultrasonic pulses in concrete. Cem. Concr. Res. 1990, 20, 259–270. [Google Scholar] [CrossRef]
- Popovics, S. Strength and Related Properties of Concrete: A Quantitative Approach; John Wiley & Sons, Inc.: New York, NY, USA, 1998. [Google Scholar]
- Lin, Y.; Kuo, S.F.; Hsiao, C.; Lai, C.P. Investigation of pulse velocity-strength relationship of hardened concrete. ACI Mater. J. 2007, 104, 344–350. [Google Scholar]
- Mahure, N.V.; Vijh, G.K.; Sharma, P.; Sivakumar, N.; Ratnam, M. Correlation between pulse velocity and compressive strength of concrete. Int. J. Earth Sci. Eng. 2011, 4, 871–874. [Google Scholar]
- Bogas, J.A.; Gomes, M.G.; Gomes, A. Compressive strength evaluation of structural lightweight concrete by non-destructive ultrasonic pulse velocity method. Ultrasonics 2013, 53, 962–972. [Google Scholar] [CrossRef] [PubMed]
- Irrigaray, M.A.P.; de Pinto, R.C.A.; Padaratz, I.J. A new approach to estimate compressive strength of concrete by the UPV method. IBRACON Struct. Mater. J. 2016, 9, 395–402. [Google Scholar] [CrossRef]
- Mohammed, T.U.; Rahman, M.N. Effect of types of aggregate and sand-to-aggregate volume ratio on UPV in concrete. Constr. Build. Mater. 2016, 125, 832–841. [Google Scholar] [CrossRef]
- Trtnik, G.; Kavčič, F.; Turk, G. Prediction of concrete strength using ultrasonic pulse velocity and artificial neural networks. Ultrasonics 2009, 49, 53–60. [Google Scholar] [CrossRef] [PubMed]
- Khan, M.I. Evaluation of non-destructive testing of high strength concrete incorporating supplementary cementitious composites. Resour. Conserv. Recycl. 2021, 61, 125–129. [Google Scholar] [CrossRef]
- Najim, K.B. Strength evaluation of concrete structures using ISonReb linear regression models: Laboratory and site (case studies) validation. Constr. Build. Mater. 2017, 149, 639–647. [Google Scholar] [CrossRef]
- Rashid, K.; Waqas, R. Compressive strength evaluation by non-destructive techniques: An automated approach in construction industry. J. Build. Eng. 2017, 12, 147–154. [Google Scholar] [CrossRef]
- Pessiki, P.S.; Carino, N.J. Setting time and strength of concrete using the impact-echo method. ACI Mater. J. 1998, 85, 389–399. [Google Scholar]
- Pessiki, P.; Johnson, M.R. Nondestructive evaluation of early-age concrete strength in plate structures by the impact-echo method. ACI Mater. J. 1996, 93, 260–271. [Google Scholar]
- Gavela, S.; Nikoloutsopoulos, N.; Papadakos, G.; Sotiropoulou, A. Combination of compressive strength test and ultrasonic pulse velocity test with acceptable uncertainty. Mater. Des. Process. Commun. 2021, 3, e171. [Google Scholar] [CrossRef][Green Version]
- Lin, Y.C.; Lin, Y.; Chan, C.C. Use of ultrasonic pulse velocity to estimate strength of concrete at various ages. Mag. Concr. Res. 2016, 68, 739–749. [Google Scholar] [CrossRef]
- ASTM C128-01; Standard Test Method for Density, Relative Density (Specific Gravity), and Absorption of Fine Aggregate. ASTM International: West Conshohocken, PA, USA, 2001.
- ASTM C 597; Standard Test Method for Pulse Velocity through Concrete. ASTM International: West Conshohocken, PA, USA, 2002.
- ASTM C 39/C39M-15a; Standard Test Method for Compressive Strength of Cylindrical Concrete Specimens. ASTM International: West Conshohocken, PA, USA, 2015.
- Lee, C.Y. Estimate of Concrete Strength at Various Ages Using the Ultrasonic Pulse Velocity. Master’s Thesis, Department of Civil Engineering, National Chung Hsing University, Taichung, Taiwan, 2008. [Google Scholar]
- Liao, C.L. The Influence of Pozzolanic Materials on the Relationship between the Ultrasonic Pulse Velocity and Compressive Strength of Hardened Concrete. Master’s Thesis, Department of Civil Engineering, National Chung Hsing University, Taichung, Taiwan, 2008. [Google Scholar]
- Hsiao, Y.L. Use of Pulse Velocity for Evaluating the In-Place Strength of Hardened High-Strength and Self-Compacting Concrete. Master’s Thesis, Department of Civil Engineering, National Chung Hsing University, Taichung, Taiwan, 2008. [Google Scholar]
- Lin, C.C. Investigation of the Relationship between Ultrasonic Pulse Velocity and Strength Development of Slag Concrete and Its Application to In-Place Strength Evaluation. Master’s Thesis, Department of Civil Engineering, National Chung Hsing University, Taichung, Taiwan, 2011. [Google Scholar]
- Huang, W.L. Study of the Relationship between the Pulse Velocity and Strength Development of Fly-Ash Concrete at Various Ages. Master’s Thesis, Department of Civil Engineering, National Chung Hsing University, Taichung, Taiwan, 2012. [Google Scholar]
Publisher’s Note: MDPI stays neutral with regard to jurisdictional claims in published maps and institutional affiliations. |
© 2022 by the authors. Licensee MDPI, Basel, Switzerland. This article is an open access article distributed under the terms and conditions of the Creative Commons Attribution (CC BY) license (https://creativecommons.org/licenses/by/4.0/).