Article

Experimental Investigation and Applicability of Multi-Stage Simulations in the Case of a Thick-Walled Injection-Moulded Composite

1
Department of Materials Science and Engineering, Széchenyi István University, Egyetem tér 1, 9026 Győr, Hungary
2
Webasto Convertibles GmbH, Seckerstrasse 3, 94491 Hengersberg, Germany
3
Imsys Engineering Services Ltd., Mozaik Utca 14/a, 1033 Budapest, Hungary
*
Author to whom correspondence should be addressed.
Appl. Sci. 2022, 12(17), 8415; https://doi.org/10.3390/app12178415
Submission received: 7 July 2022 / Revised: 15 August 2022 / Accepted: 19 August 2022 / Published: 23 August 2022
(This article belongs to the Section Materials Science and Engineering)

Abstract

:
The structure and mechanical properties of an injection-moulded short glass fibre (GF)-reinforced polymer composite were analysed through simulation methods. Fibre orientation, which evolves during the production of a thick-walled automotive part, was determined with an injection moulding simulation. Next, using the material model for the injected product, the force that resulted from the given deformation was determined with finite element software. To validate the simulation results, the examined products were manufactured with 30% reinforced GF, and then measurements were carried out. The validation of the fibre orientation tensor was achieved with optical microscope images, while the validation of the finite element, which analysed the flexural tests, was carried out through a comparison of flexural rigidity. The aim of the project was to verify the reliability of multi-stage finite element software. According to the results, in the case of a thick-walled GF-reinforced product, it was demonstrated that the integration of a different finite element software could be used reliably.

1. Introduction

Nowadays, in order to maintain and enhance competitiveness, not only the physical and mechanical properties of the raw material, but also changes caused by production technology (e.g., residual stress and orientation) should be taken into consideration while designing and sizing a product. The above-mentioned statement is particularly true for fibre-reinforced products manufactured with injection moulding as, due to the geometry of the product and the fountain flow of the melt, the orientation of the fibres is not homogenous. Therefore, a model that is capable of taking the effects of production parameters into account must be used for sizing.
One of the key requirements of the good-quality injection moulding of thermoplastics is a thin and consistent wall thickness. In the case of the injection moulding of thick-walled products, either aesthetic problems occur (e.g., sink marks) or production can only be executed by applying an unacceptably long cycle time. Of course, such products can be manufactured with more expensive and special injection moulding technologies, such as gas-assisted [1], water-assisted [2,3], microcellular [4] and multi-layer [5] injection moulding, or by applying raw materials that are less likely to shrink, for example, fibre-reinforced materials [6].
Multiple alternatives are available for modelling injection moulding technologies. Both use fibre-reinforced raw materials, and the prediction of fibre orientation can be achieved in simulation software. In the case of most simulation software, determining fibre orientation is executed using two fundamental models or by upgrading them. One of them is the Jeffrey model, in which the motion of an infinite fibre in a dilute suspension is examined qualitatively, but the fibre–fibre interaction is not taken into consideration. The other one is the Folgar–Tucker model, which is more adaptable for polymer composites with massive fibre reinforcements, as mechanical interactions between fibres are taken into account [7,8].
Nowadays, more and more objective theoretical models have been created in the field of fibre orientation during rheology, for example, the RSC (reduced strain closure) model [9], ARD-RSC (anisotropic rotary diffusion and reduced strain closure) model [10] and iARD-RPR (improved anisotropic rotary diffusion and retarding principal rate) model [11]. In commercial injection moulding simulation software, these novel orientation models have been included, such as Autodesk MoldFlow insight (AMI) and Moldex3D.
In most programmes, the result is a second-order orientation tensor main diagonal (Aij) in a 3 × 3 matrix, with which the orientation condition of the material in a unit area is described. Orientation tensors were first introduced by Advani and Tucker [12]. If the flow direction (usually A11) is chosen to be the reference direction, it can be determined whether the orientation of the fibres is perpendicular (usually in the core) (A11 < 0.30) to the flow direction, completely random (A11 = 0.5) or parallel to the flow direction (usually in the shell layer) (A11 > 0.7) [13].
Another interpretation of the orientation tensor can be used [14,15]. If the fibres are perfectly orientated in the flow direction, then the tensor and the fibre orientation represented in Figure 1a are valid, while, if the fibres are only parallel to a certain plane, then planar isotropy occurs (Figure 1b), and if the same amount of fibres is parallel to the three coordinate axes, then the material is isotropic (Figure 1c).
Fibre orientation during injection moulding with a sprue gate of a 1.5 mm thick, circular disk from a polycarbonate composite with a 10 wt% short glass fibre (GF) reinforcement was measured with optical microscopy at three different points and compared to the predictions determined with the Moldflow simulation software in a study carried out by Neves and colleagues [16]. During the comparison of the results, it was found that even though a qualitative agreement between the measured and calculated fibre orientation tensor in the flow direction was established, the difference between the actual values was significant. A quantitative agreement was only found at the wall of the mould and in the middle of the core, which may be the result of shear flow behaviour being less capable of being modelled than extensional flow behaviour.
In research carried out by Tseng and colleagues [17], fibre orientation determined with Moldex3D simulation software was compared to values measured with micro-CT on short-GF-reinforced composites, on long-GF-reinforced composites [18,19] and also on long carbon-fibre-reinforced composites [20,21]. It was stated that by using an integrated simulation in modelling components composed of fibre-reinforced thermoplastics, an accurate prediction of fibre orientation has become available for the industry.
Another research project carried out by Tseng and colleagues [22] examined a 3 mm thick, rectangular plaque with a fan gate produced from 50 wt% short- and long-GF-reinforced polyamide 6.6. The plaques were manufactured with injection moulding; then, the two components, the flow direction and perpendicular, of the fibre orientation tensor were measured with micro-CT, and were compared to predictions of the Moldex3D software (Taiyuan St. Zhubei City, Taiwan) using the same injection moulding parameters. The results showed a qualitative agreement between the measured and the simulated values for both materials. The exact results for both long- and short-fibre-reinforced composites were within the 15% relative margin of error, which was the qualitative criteria (−3.5% and 8.5%, respectively). At both fibre lengths, the shell–core–shell structure was clearly identified, which was the result of the fountain flow of the melt. It was revealed that compared to the short-fibre-reinforced composite, the thickness of the core was greater in the long-fibre-reinforced system. After that, the material model (including the inhomogeneity caused by the fibre orientation) from Moldex3D was imported into the Digimat MF software (Cobham, UK), where the tensile flexural modulus of the composites was calculated. Values of the simulation were compared to the measured results, and it was found that in both cases, the simulation underestimated the real values, but the difference was acceptable. In conclusion, the fibre orientation in sizing injection-moulded parts is crucial.
Numerous analytical and numerical methods are available in the literature for examining the structure of composites from the perspective of either stress, dislocation, oscillation or stability [23]. Of these methods, the finite element method (FEM) is an extremely efficient way of calculating approximate solutions of complex problems. The FEM is typically divided into two main categories based on the applied principles. Classic or displacement-type finite elements [24,25] are classified into the first category, while hybrid or mixed-type finite elements [26,27] are sorted into the second one. In the case of displacement-type finite elements, the variables are geometric quantities from which forces and torques can be derived, while in the case of hybrid finite elements, apart from geometric quantities, force and torque-type quantities can also contain variables under certain conditions. The advantages of both types are undoubted, but in the case of solving static problems, engineering calculations can be executed using fewer elements with the hybrid FEM.
Hirsch et al. [28] examined hybrid injection-moulded short- and continuous-fibre-reinforced thermoplastic composites using a numerical simulation with experimental validation. For injection moulding, simulation Moldex3D software was used, while for the numerical simulation of the flexural test, Ansys software (Canonsburg, PA, USA) was used. In the hybrid FEM analysis, the Mori–Tanaka analytical model was used, which was necessary for the simulation of the complex microstructure. During the simulation, they used mechanical properties from the supplier and Ansys database, the fibre volume content from pyrolysis, fibre aspect ratio from the fibre length analysis and fibre orientation tensor from the CT analysis. In this new numerical workflow, the deviation of the numerically predicted and experimentally measured flexural strength could be reduced from 31% to 13%.
Throughout the present project, the simulation and experimental results of a thick-walled short-GF-reinforced product were compared using a mould that was designed based on a CAD model and manufactured in a previous work [29]. The investigated wall thickness of the part was 8 mm. The fibre orientation results of the injection moulding simulation were validated with a microscopic investigation following the real injection moulding process. Then, the finite element simulation was validated by performing mechanical examinations on the product. The input parameters were the same as in the experiments and, after every single step, the results were compared to the measured ones. The aim was to characterise the trustworthiness of the simulation by determining the differences through experiments.

2. Materials and Methods

Schulamid 6 GF 30 (A. Schulman, LyondellBasell, NYSE:LYB)-type PA6 with a 30% GF reinforcement was used, for which the material model was already in the database of the injection moulding simulation software (Figures S1 and S2).
An automotive inner door handle was produced in a mould [29] that was designed and manufactured in previous research. The injection moulding was carried out with an Arburg Allrounder Golden Edition 420C (Lossburg, Germany) machine. During the production, the melt temperature was 280 °C, mould temperature was set to 80 °C, injection speed was 50 cm3/s and the switchover point was at 100% filling. Then, 800-bar holding pressure was applied for 20 s, which was followed with 20 s residual cooling.
A mould with a 1 + 1 cavity was used for the simultaneous production of a right- and left-handed door handle (reflections of each other). The sprue and runner system were removed from the products and, for the flexural test, the left-handed door handle was drilled in accordance with the position of the spindle. The door handle was then secured against rotation by placing it in the support developed in-house before the flexural test was carried out.
Flexural tests were carried out using a support developed in-house, with the arrangement shown in Figure 2, on a Zwick Z050-type (Fürstenfeld, Austria) universal tensile testing machine, modelling the bending load applied to the door handle while opening. The examination was carried out at 240 mm/min until a previously determined deflection (2, 4, 6 and 8 mm) was reached, and force–time diagrams were recorded.
For the injection moulding simulation, the entire mould cavity with the sprue and the runner system was modelled. The model was built using three-dimensional tetrahedron elements (192,045 tetrahedron elements, 190,710 nodes), taking the location of the subsequent mortise into consideration (Figure 3a). As for the simulation of injection moulding, Autodesk Moldflow Insight 2011 software (San Francisco, CA, USA) was used for the real raw material with the parameters used in injection moulding.
The results for the material model, including the fibre orientation and residual stress, were exported and then imported into Abaqus 6.11 software (Vélizy-Villacoublay, France) as an input parameter. After that, parts unnecessary for the mechanical simulation (right-handed door handle, sprue and runner system, location of the mortise) were deleted. However, the remaining nodes (73,540) preserved the material model established with the injection moulding simulation (Figure 3b). Again, kinematic constraints were added to the model (along the mortise, 1 rotation degree of freedom was kept, the axial displacement of the handle was tied and its rotation was blocked by applying a support system); then, the model of the loading pin was built, in which only one axial dislocation (the direction of axes 3) was allowed. Finally, the test simulation was carried out at 240 mm/min with a stepped load until a previously determined deflection (2, 4, 6, 8 mm) was reached. Surface to surface, a rigid–flexible type of contact was chosen (the support, the axis and the head of the testing machine were considered rigid). For the calculations, frictional contact was applied with a 0.5 coefficient of friction. The displacement-type FEM analysis was used.
The fibre orientation tensor values provided by the injection moulding simulation were validated based on Zeiss Axio Imager M 1-type (Oberkochen, Germany) optical microscopy. A 10 mm section was cut off from the end of the product, which was polished to an average of 1 µm roughness, so that the fibres were visible. Then, the images were created with 100× magnification on −6, −4, 0, 4 and 6 mm from the midplane for measurement.
The volumetric shrinkage presented with the injection moulding simulation was validated with the GOM ATOS surface digitisation measuring system. Two cameras were applied in the unit, one for digitising the subject based on the reference points and one to function as a control camera [30]. To avoid reflections, the sample was thinly coated with special anti-reflex paint. The deviation between the injected sample and the mould cavity was generated with GOM ARAMIS software.
The flexural test simulation was carried out with Abaqus finite element method software as an analysis of the static structure using the experimental parameters. The initial condition was considered inhomogeneous, and the results of the injection moulding simulation were applied as the input parameters.

3. Results

In this section, the results of the injection moulding and flexural test simulations were presented and compared to the measured values. The meanings of the used variables can be found in Table S1.

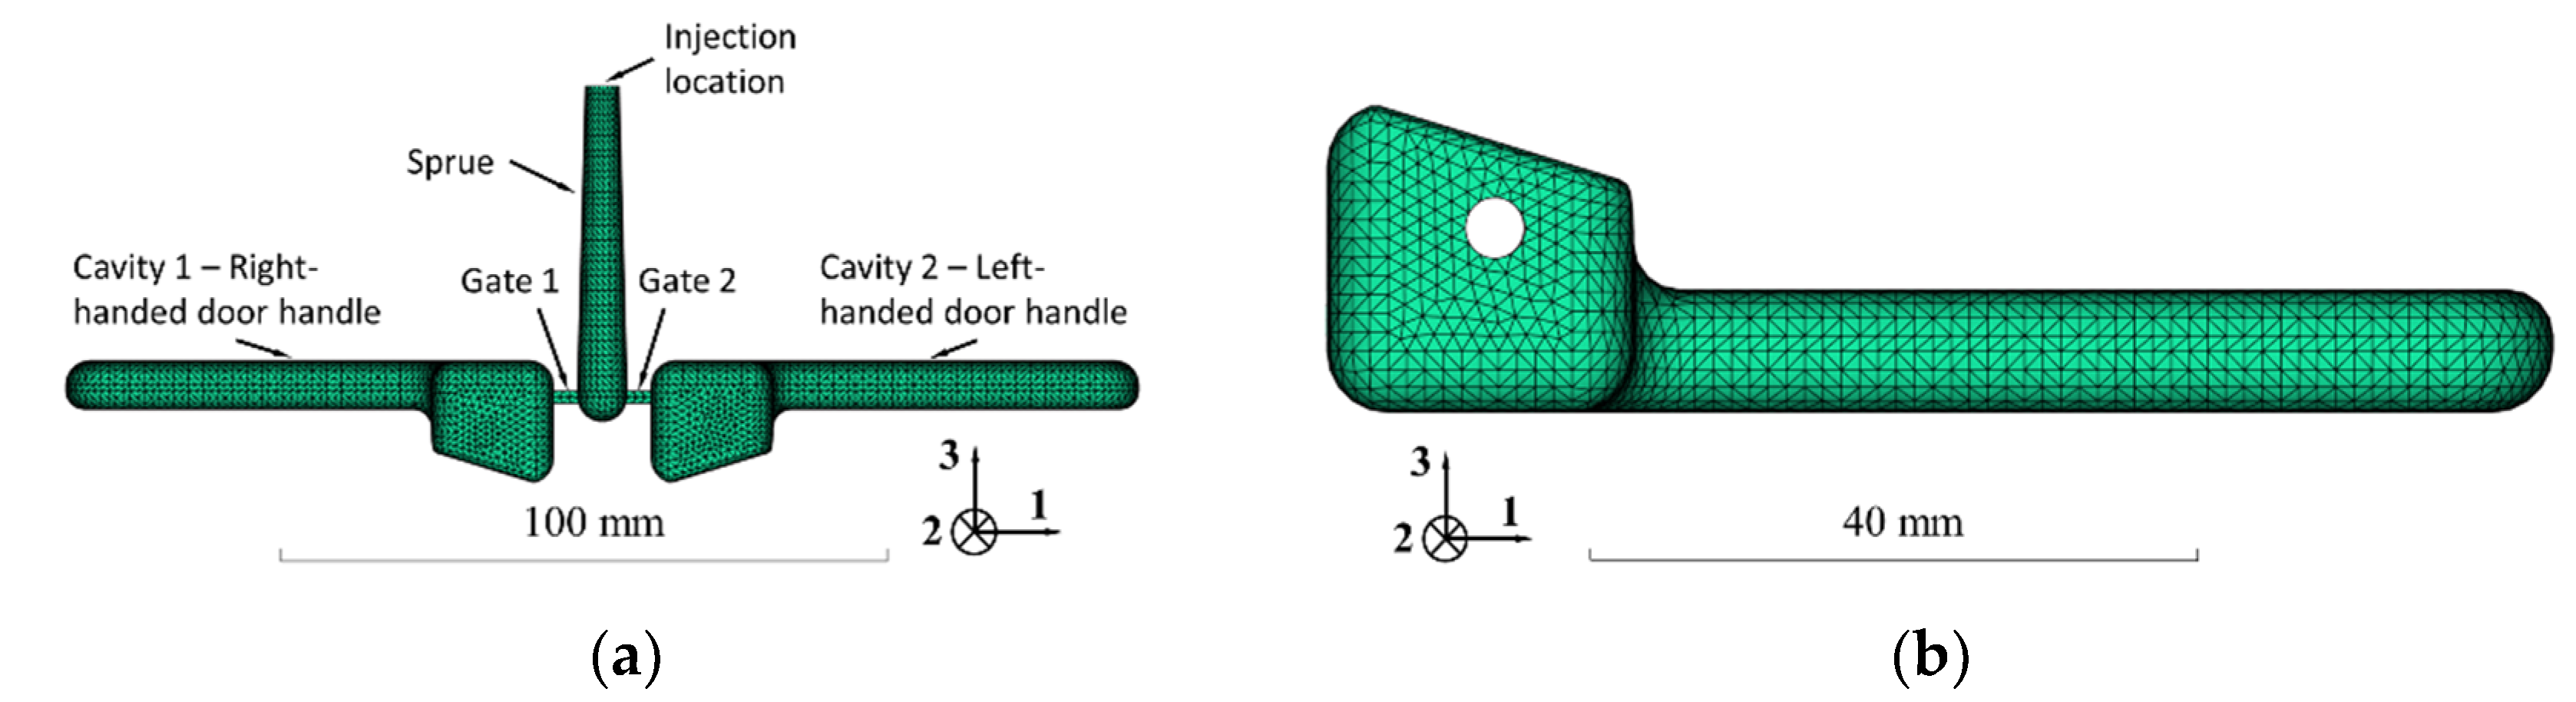
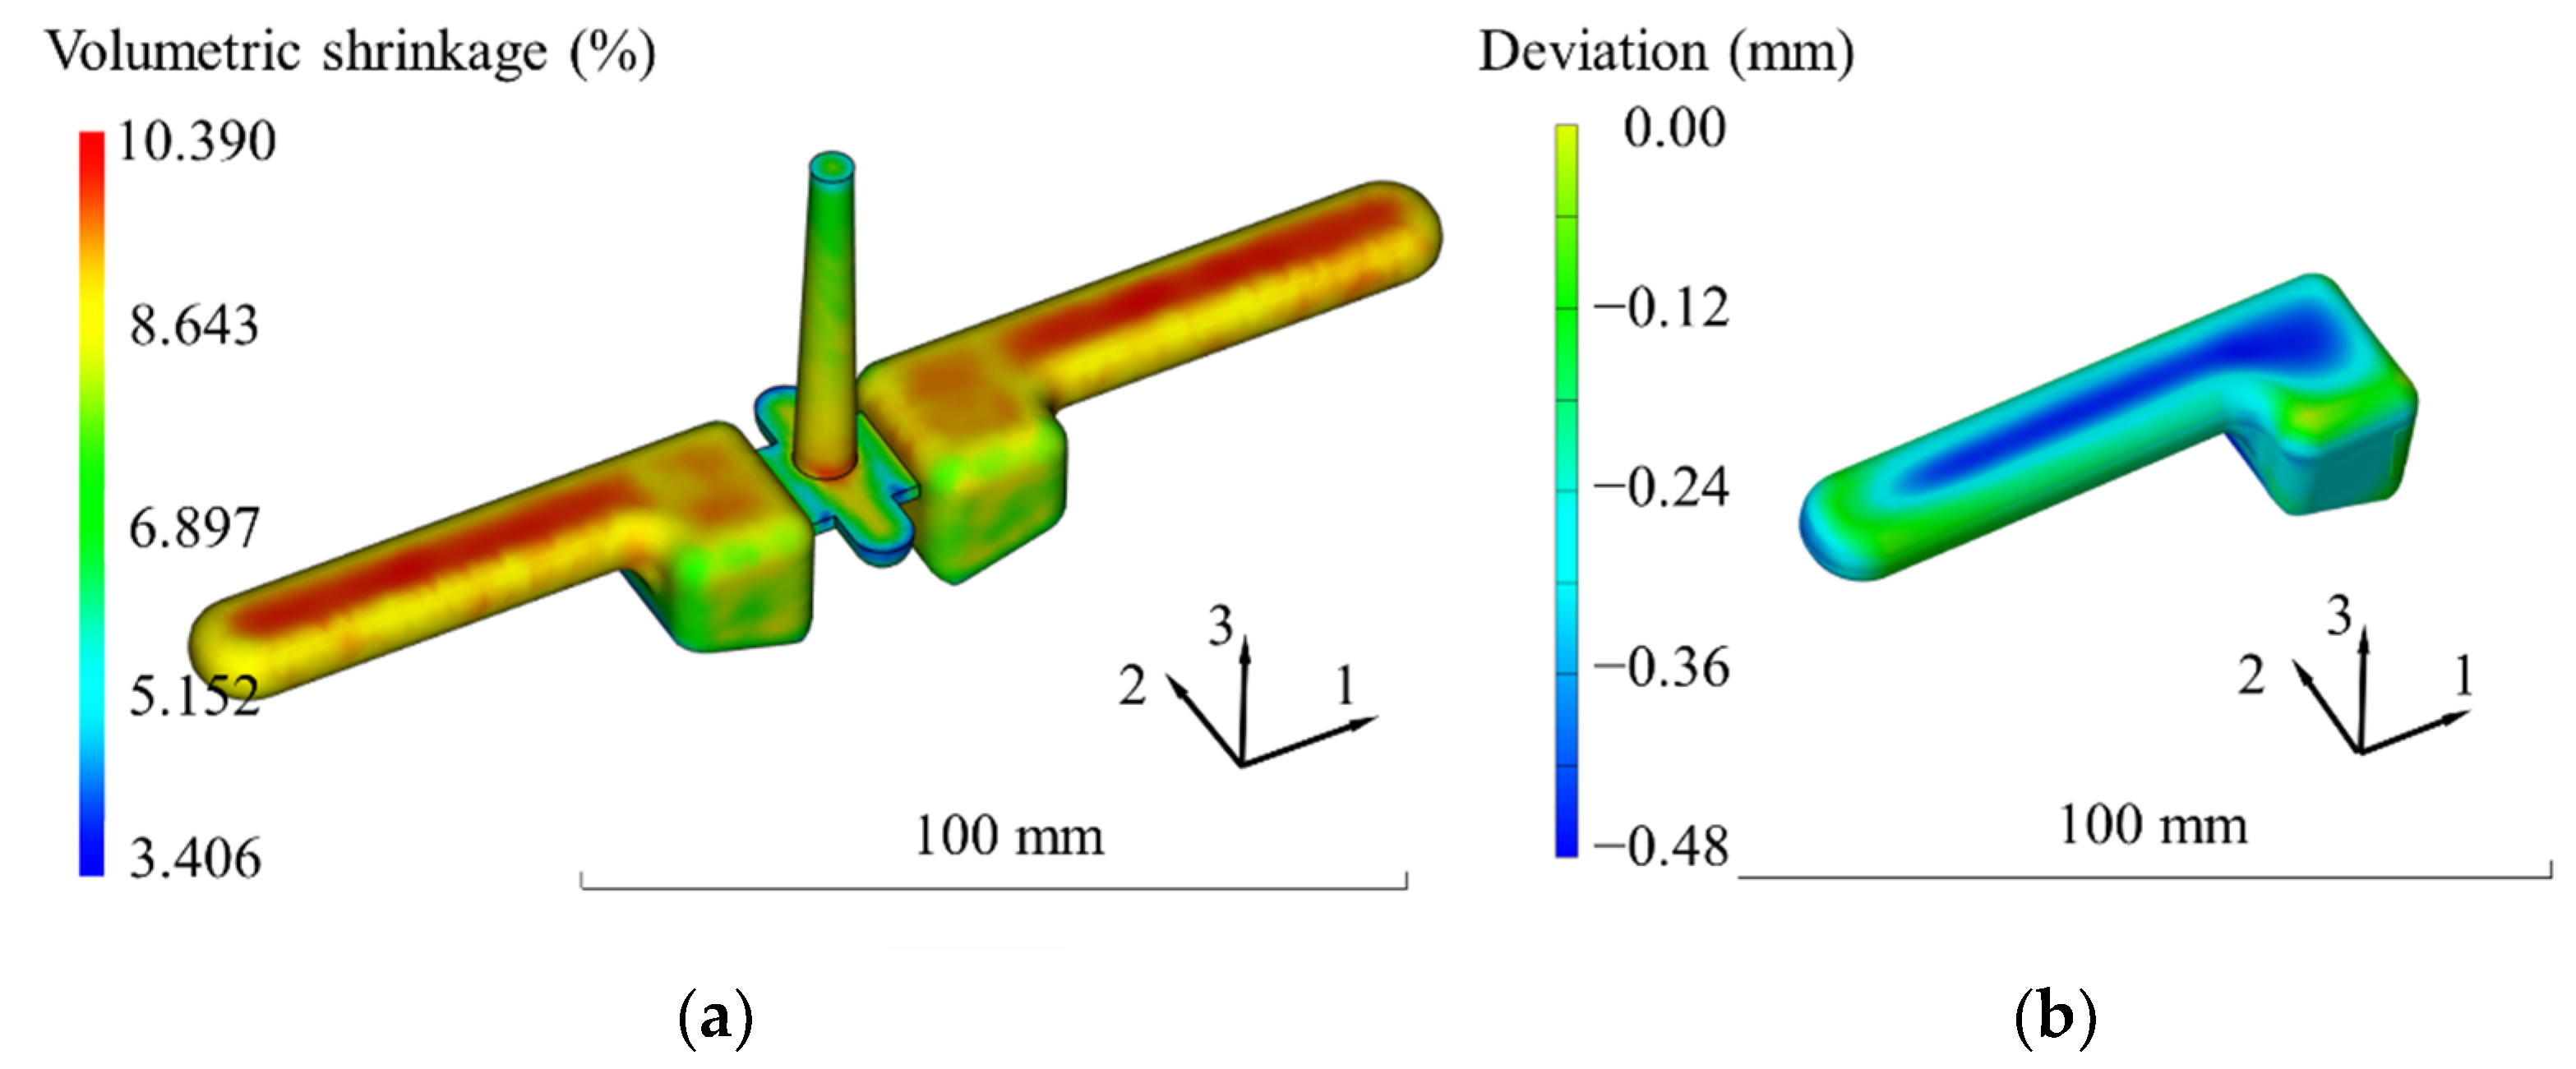
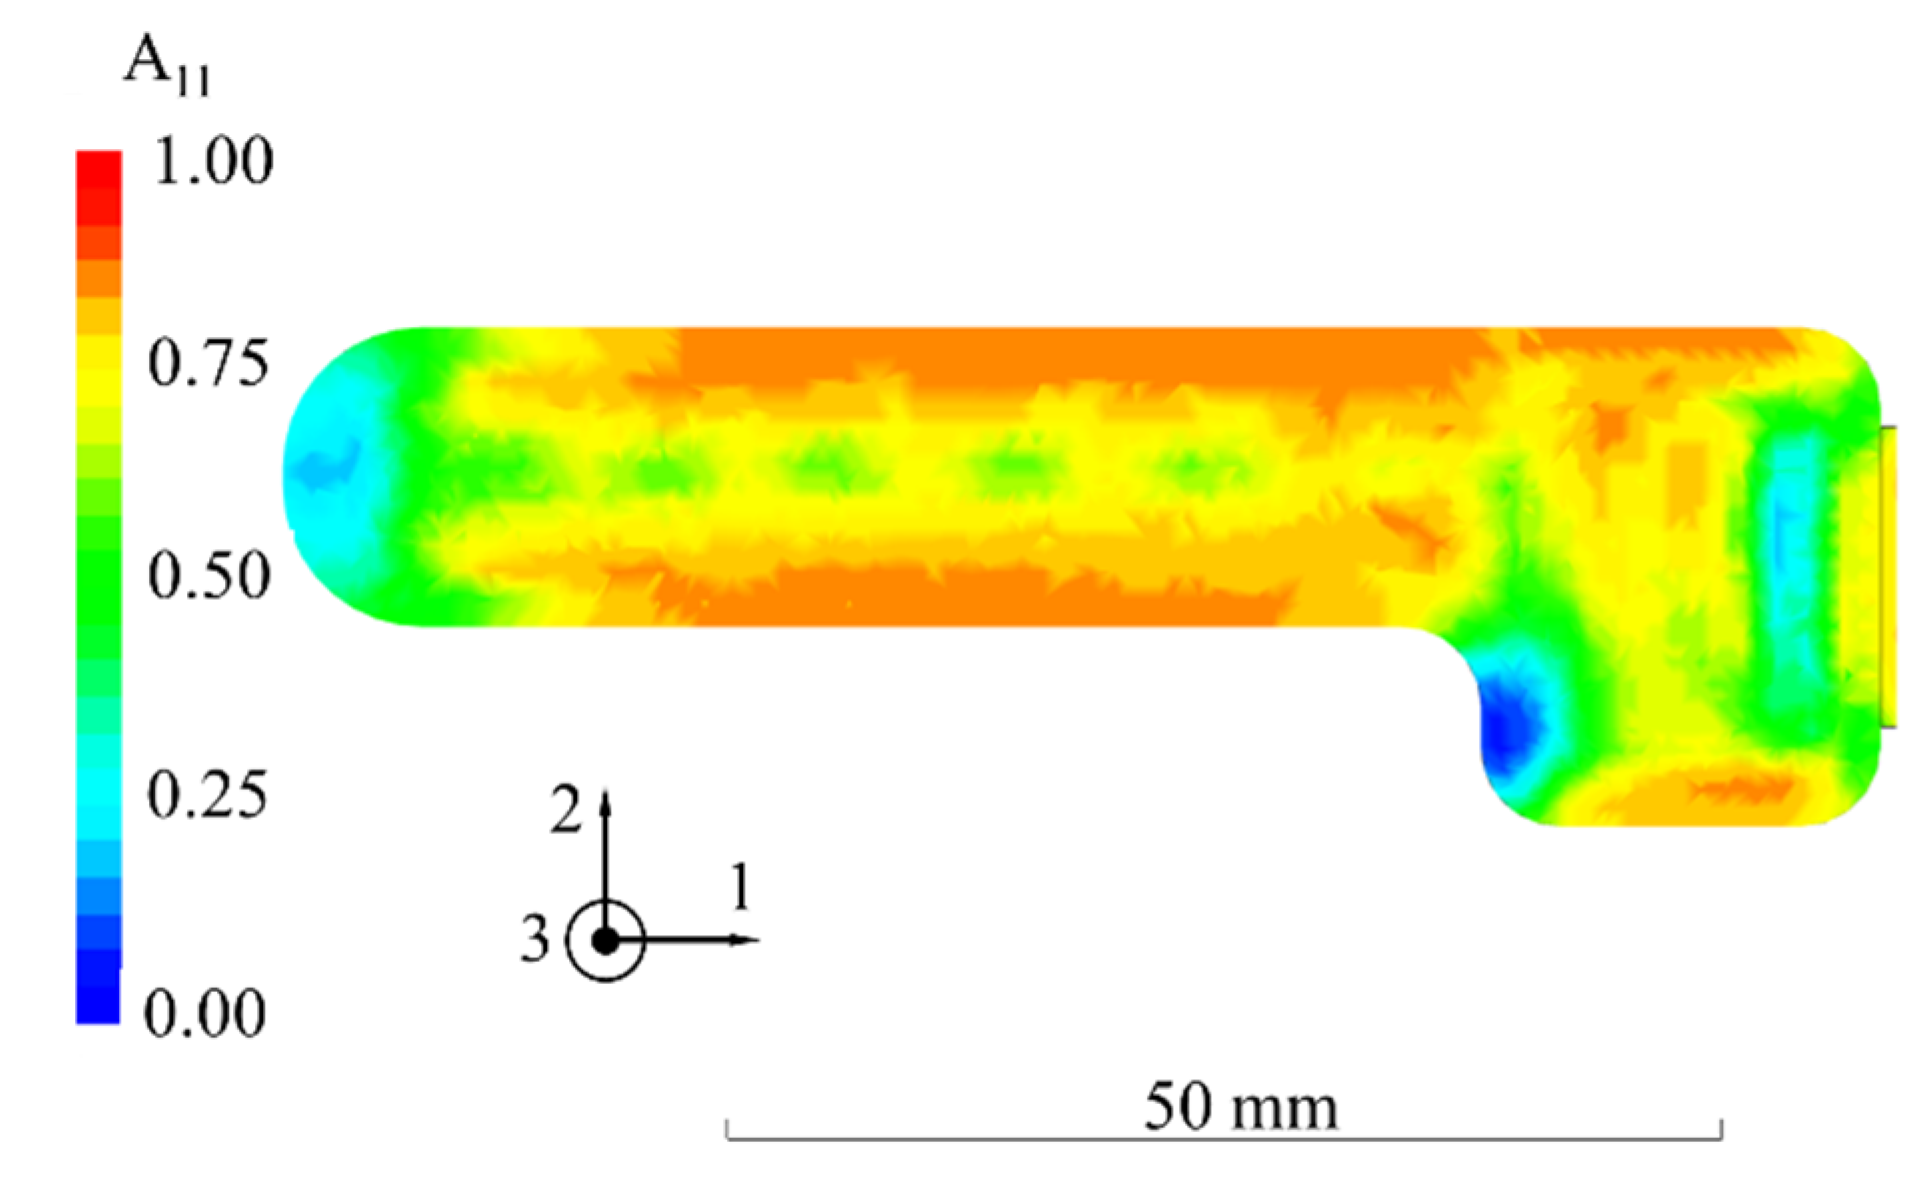
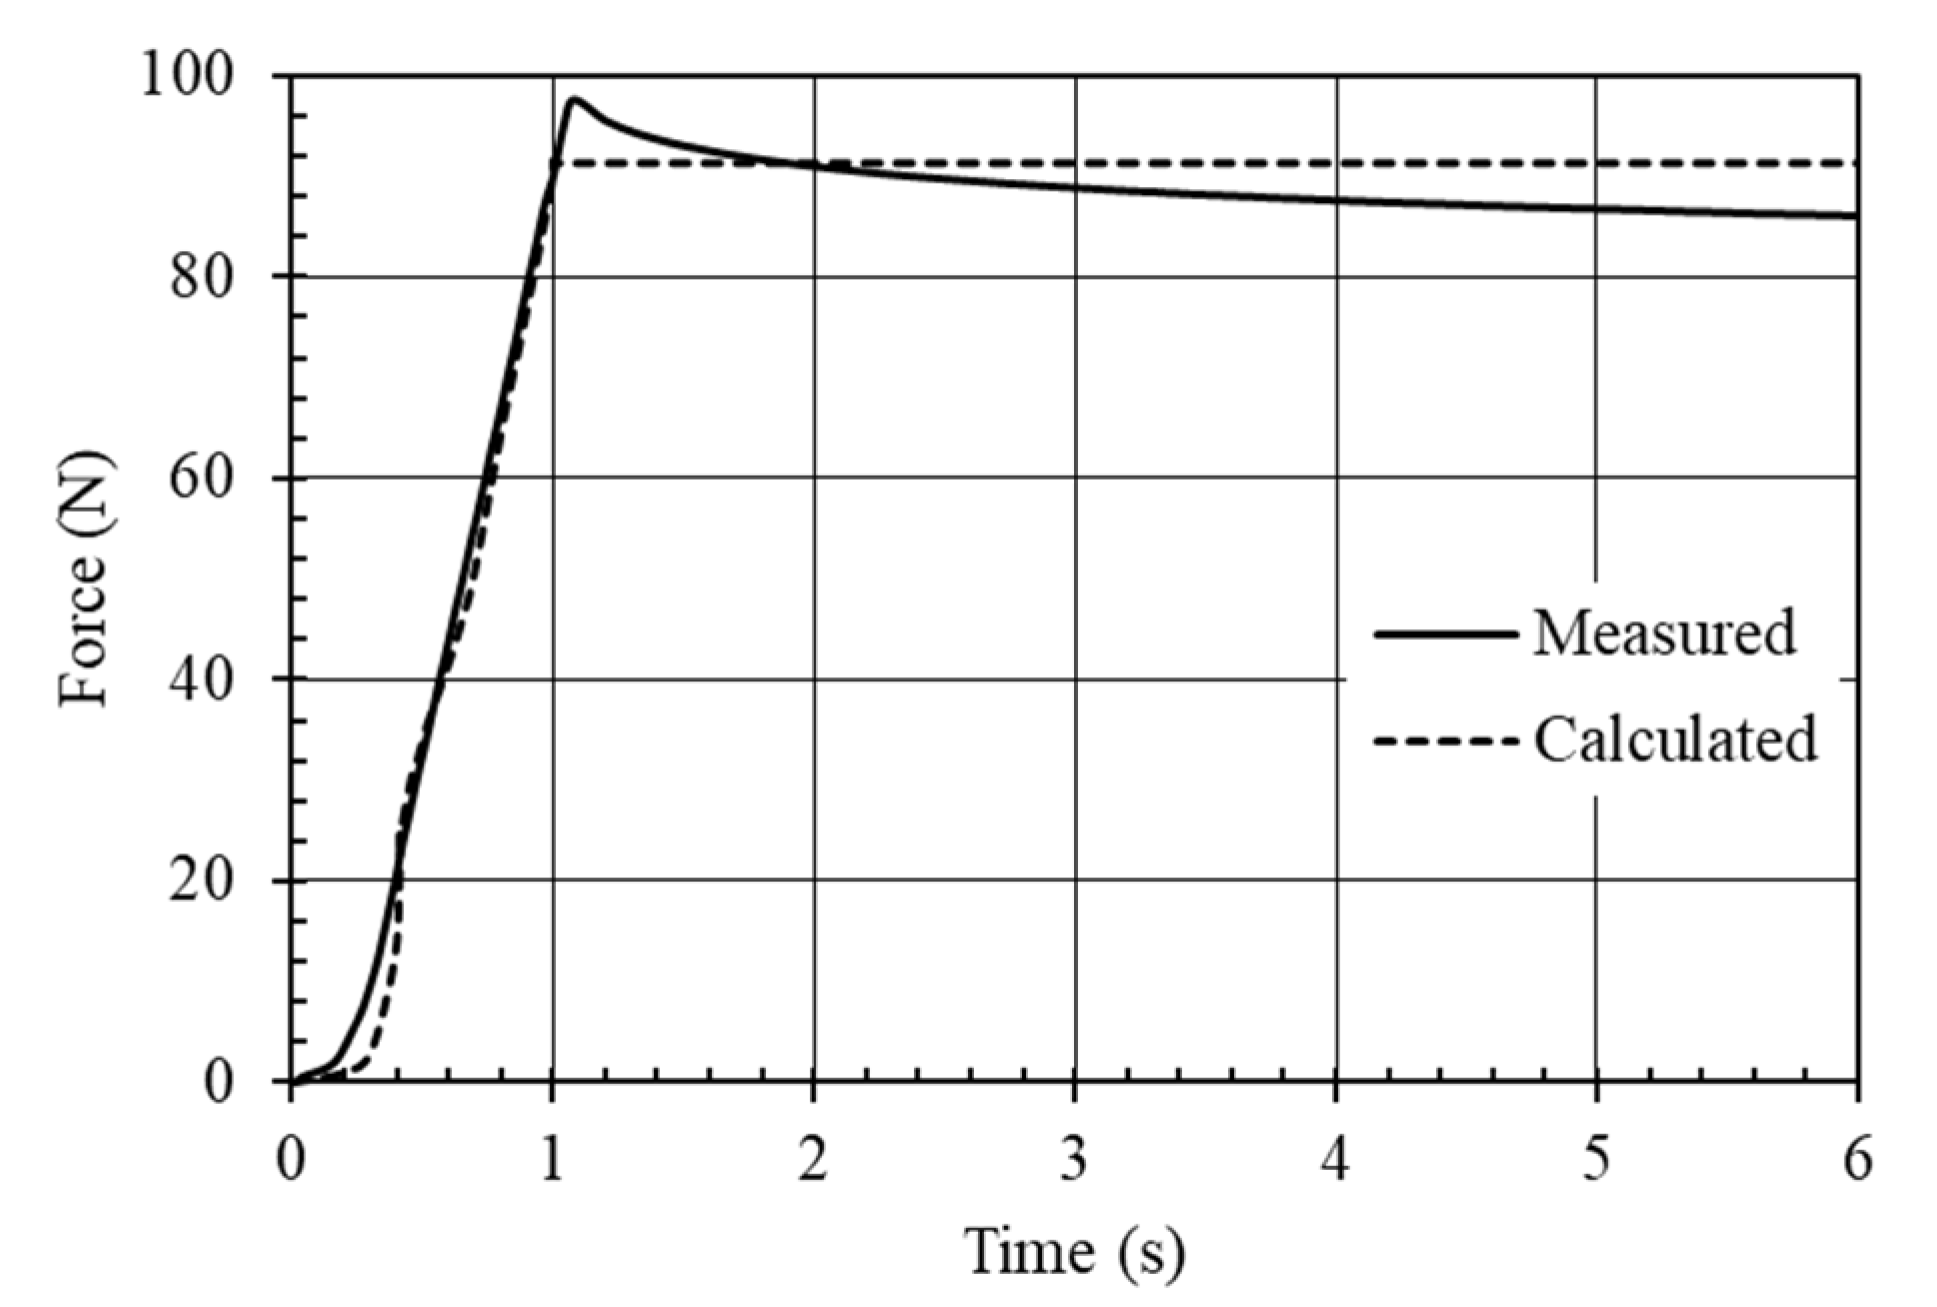
3.1. Validation of Process Simulation

During the simulation, we used the same parameters as for the injection moulding (melt temperature: 280 °C; mould temperature: 80 °C; injection speed: 50 cm3/s; holding: 800 bar for 20 s; residual cooling time: 20 s). The first step of validation was the comparison of the filling time and the injection pressure in the simulation (Figures S3 and S4) and in reality (0.574 s and 0.58 s; 310 bar and 325 bar, respectively), which showed a match. The second step of the validation was the comparison of volumetric shrinkage in the simulation and in reality (Figure 4). The surface of the door handle was measured with GOM and the deviation was generated between it and the mould cavity. The shape of the shrinkage did not match perfectly, but in the areas important from the point of view of the load, in the middle of the handle stem, there was a match; the biggest deviation was generated where the shrinkage was high, so we could state that the simulation was a good representation of reality.
The third step of validation was the comparison of the fibre orientation tensor. The global conformation of the flow direction part of the fibre orientation tensor (A11) along the longitudinal section of the door handle is presented in Figure 5, based on the Autodesk Moldflow Insight 2011 injection moulding simulation software. The simulation was calculated in accordance with the previously mentioned Folgar–Tucker model. The visualisation was quite spectacular, because the 3D solver in AMI was based on the Navier–Stokes model; it can be seen that the fibre orientation in the core and the shell differed from each other (A11 was 0.75 and 0.9, respectively). However, due to the large wall thickness, the shear rate was more evenly distributed in the cross-section; therefore, the difference was smaller than expected.
However, this representation was incapable of comparing the results to the real fibre orientation. Instead, the diagonals of the fibre orientation tensor were applied in a specific cross-section and were presented as a function of distance from the midplane. During the experimental investigation, sections were prepared from the injection-moulded door handle and, on the 8 × 15 mm slices, the elliptic projection of the GF sections was examined with optical microscopy, and the minor (m) and major (M) axes and the angle of the major axis (φ) (Figure 6) [16] were measured. With the help of these results, the orientation was determined with Equation (1) in the flow direction (A11), with Equation (2) in the width direction (A22) and with Equation (3) in the height direction (A33) [31]. A11 showed the oriented fibres’ ratios in the direction of axis 1, A22 showed the oriented fibres’ ratios in the direction of axis 2 and A33 showed the oriented fibres’ ratios in the direction of axis three. The sum of these variables (A11, A22 and A33) had to be one.
A 11 = m M 2
A 22 = sin φ sin cos 1 m M 2
A 33 = cos φ sin cos 1 m M 2
During validation, more sections of the injection-moulded part were checked, and we found that the orientation in the middle of the door handle stem (from 10 to 55 mm from the end of the product) was similar. The measured and simulated fibre orientations in a specific section (10 mm from the end of the product) are presented in Figure 7 as a function of distance from the midplane. The effect of shear rate could be clearly seen from the results, although obvious core and s hell layers could not be determined. This could be explained by the large wall thickness (8 mm) of the product as, in a case such as this, the difference in the applied shear was smaller during injection. The simulated values properly approached the results of the experimental investigation, and the difference was within the accepted tolerance everywhere; therefore, it could be stated that the results of the simulation represented the real situation. The relative errors of the calculated and measured fibre orientation components are presented in Table S2. In the case of measurements, the differing deviation values were the result of the unequal number of measurements, as fewer fibres could be found and, therefore, measured close to the surface.

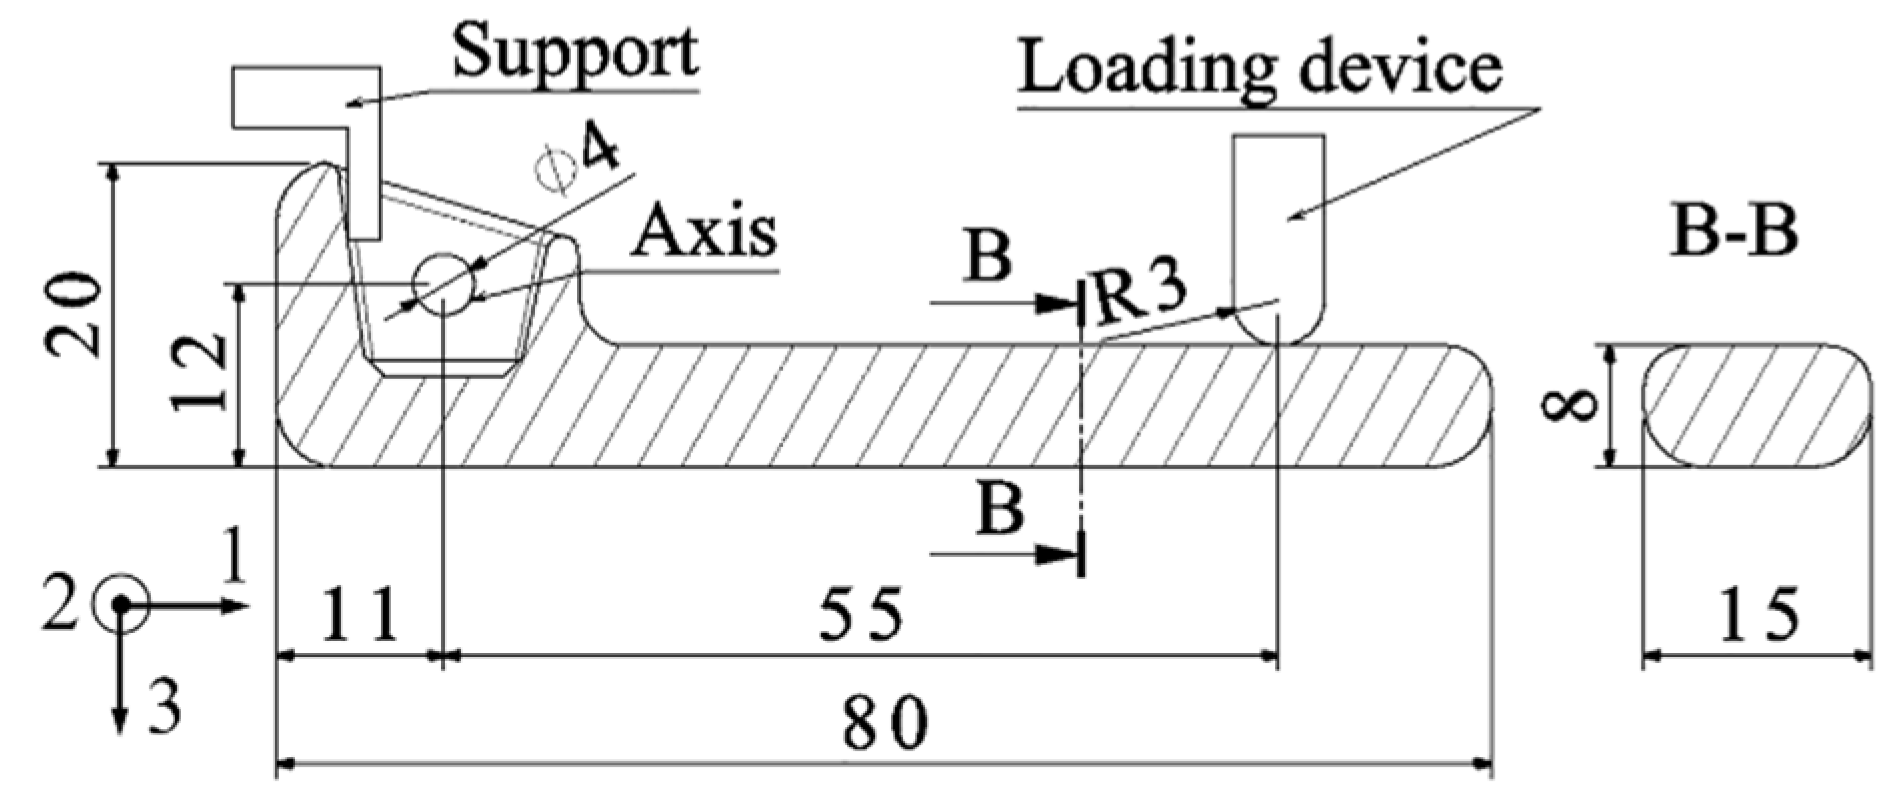
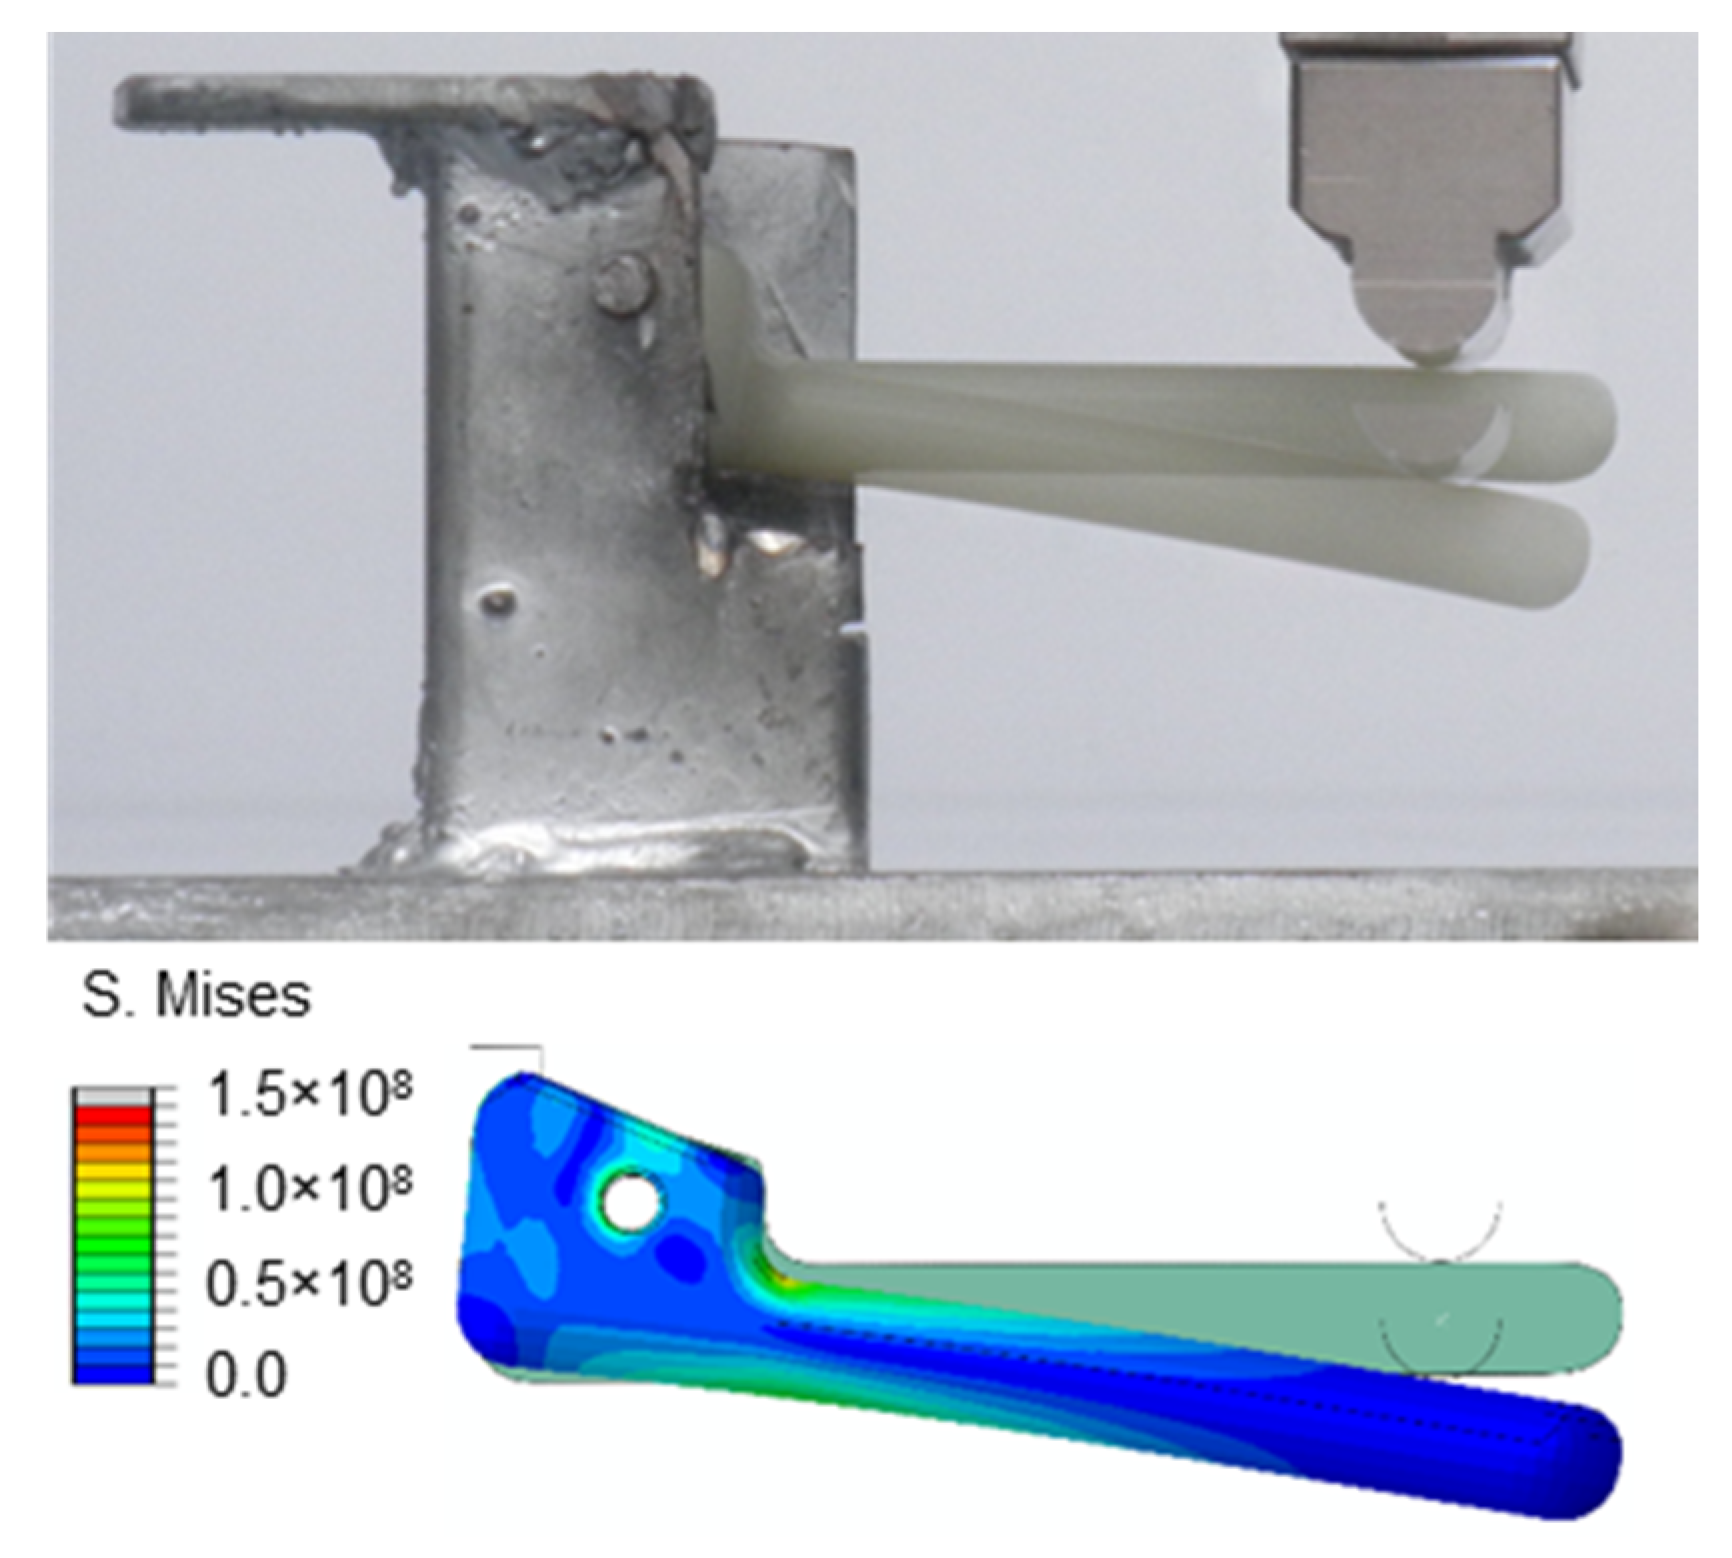
3.2. Validation of FE Analysis

In order to validate the finite element analysis, the flexural test was carried out by applying a deformation, and the maximum force values at the previously determined deflections (2, 4, 6 and 8 mm) were compared. The results of the experimental and the simulated investigation with the unloaded and the loaded (8 mm deflection) door handle are presented in Figure 8. The simulation results were shown on a solid body model with the distribution of stress presented on the deformed body with a colour ramp, while the undeformed figure was a solid green colour. It can be seen from the compilation that the correspondence was notable; however, quantitative values were compared for an exact comparison.
The generated force as a function of time at a 4 mm deflection is presented in Figure 9. In both experimental and simulated investigations, force continuously increased until it reached a maximum; then, the force started to decrease until a constant value was achieved in the experimental investigation, while, in the simulation, it remained constant. This difference may possibly be because our simulation did not take stress relaxation into account; therefore, the reaction force remained constant after reaching the set deflection, while, in reality, the force would have relaxed, as shown in the diagram. Stress relaxation is a phenomenon in which a constant deformation at a constant temperature and humidity to a plastic is applied; then, the stress required to maintain a constant deformation decreases with time [32]. Some models, for example, the VAMUCH (variational asymptotic method for unit cell homogenisation), can calculate stress relaxation [33], but we used the built-in Abaqus model instead.
The flexural rigidity (EI) of the door handle was derived from the deflection formula for a cantilever beam (4) [34], based on the measured and the finite element analysis results:
f = F L 3 3 E I  
where “f” is the determined deflection, “F” is the maximum reaction force and “L” is the distance between supports (55 mm).
The calculated flexural rigidity values and relative errors are presented in Table 1. The EI values from the door handle simulation showed less than a 15% difference from the measured rigidity values, which was an acceptable difference. The relative errors at an 85% confidence level were between 6.06% and 15.84%. From the results, it could be concluded that for the 8 mm deformation of a door handle with such geometry, applying a relatively small force was enough (223.8 N), which could easily be reached by not opening the door carefully. However, it has to be mentioned that a short period load (which is typical in reality) would not cause a residual deformation, so the door handle would not suffer damage.

4. Discussion and Conclusions

The aim of the research was the complex analysis of a thick-walled automotive inner door handle from production to load applied during use. The production technology and the mechanical properties of the short-GF-reinforced composite part were modelled by integrating finite element software and were also experimentally investigated. By validating the simulations, it was proved that they could be applied within an acceptable margin of error. In the case of a multi-stage simulation, the reliability was higher than 85%, which contained the error of injection moulding and finite element simulation. We state that, by combining the programmes into a process, a complex mechanical analysis of injection-moulded products with a thick-walled geometry is possible, saving on the time- and money-consuming processes of conventional iteration methods.

Supplementary Materials

The following supporting information can be downloaded at https://www.mdpi.com/article/10.3390/app12178415/s1. Figure S1. The pVT curves of Schulamid 6 GF 30. Figure S2. The viscosity-shear rate curves of Schulamid 6 GF 30. Figure S3. The simulated filling time. Figure S4. The simulated injection pressure. Table S1. The meaning of the used variables. Table S2. The relative errors of calculated and measured fiber orientation tensor components.

Author Contributions

Conceptualisation, G.D.; injection moulding simulation, G.D.; FEA simulation, T.M.; methodology, F.R.; validation, F.R.; writing—review and editing, G.D.; supervision, F.R. All authors have read and agreed to the published version of the manuscript.

Funding

This research received no external funding.

Data Availability Statement

Not applicable.

Conflicts of Interest

The authors declare no conflict of interest.

References

  1. Nian, S.C.; Li, M.H.; Huang, M.S. Warpage control of headlight lampshades fabricated using external gas-assisted injection molding. Int. J. Heat Mass Transf. 2015, 86, 358–368. [Google Scholar] [CrossRef]
  2. Liu, X.; Pan, Y.; Zheng, G.; Liu, H.; Chen, Q.; Dong, M.; Liu, C.; Zhang, J.; Wang, N.; Wujcik, E.K.; et al. Overview of the Experimental Trends in Water-Assisted Injection Molding. Macromol. Mater. Eng. 2018, 303, 13. [Google Scholar] [CrossRef]
  3. Karger-Kocsis, J.; Kmetty, Á.; Lendvai, L.; Drakopoulos, S.X.; Bárány, T. Water-Assisted Production of Thermoplastic Nanocomposites: A Review. Materials 2015, 8, 72–95. [Google Scholar] [CrossRef] [PubMed]
  4. Li, S.; Zhao, G.; Dong, G.; Wang, J. Study on reducing sink mark depth of a microcellular injection molded part with many reinforcing ribs. J. Cell Plast. 2016, 52, 479–502. [Google Scholar] [CrossRef]
  5. Hopmann, C.; Robig, M. Application of a multilayer injection molding process for thick-walled optical components. J. Polym. Eng. 2016, 36, 557–562. [Google Scholar] [CrossRef]
  6. Sikló, B.; Cameron, K.; Kovács, J.G. Deformation analysis of short glass fiber-reinforced polypropylene injection-molded plastic parts. J. Reinf. Plast. Compos. 2011, 30, 1367–1372. [Google Scholar] [CrossRef]
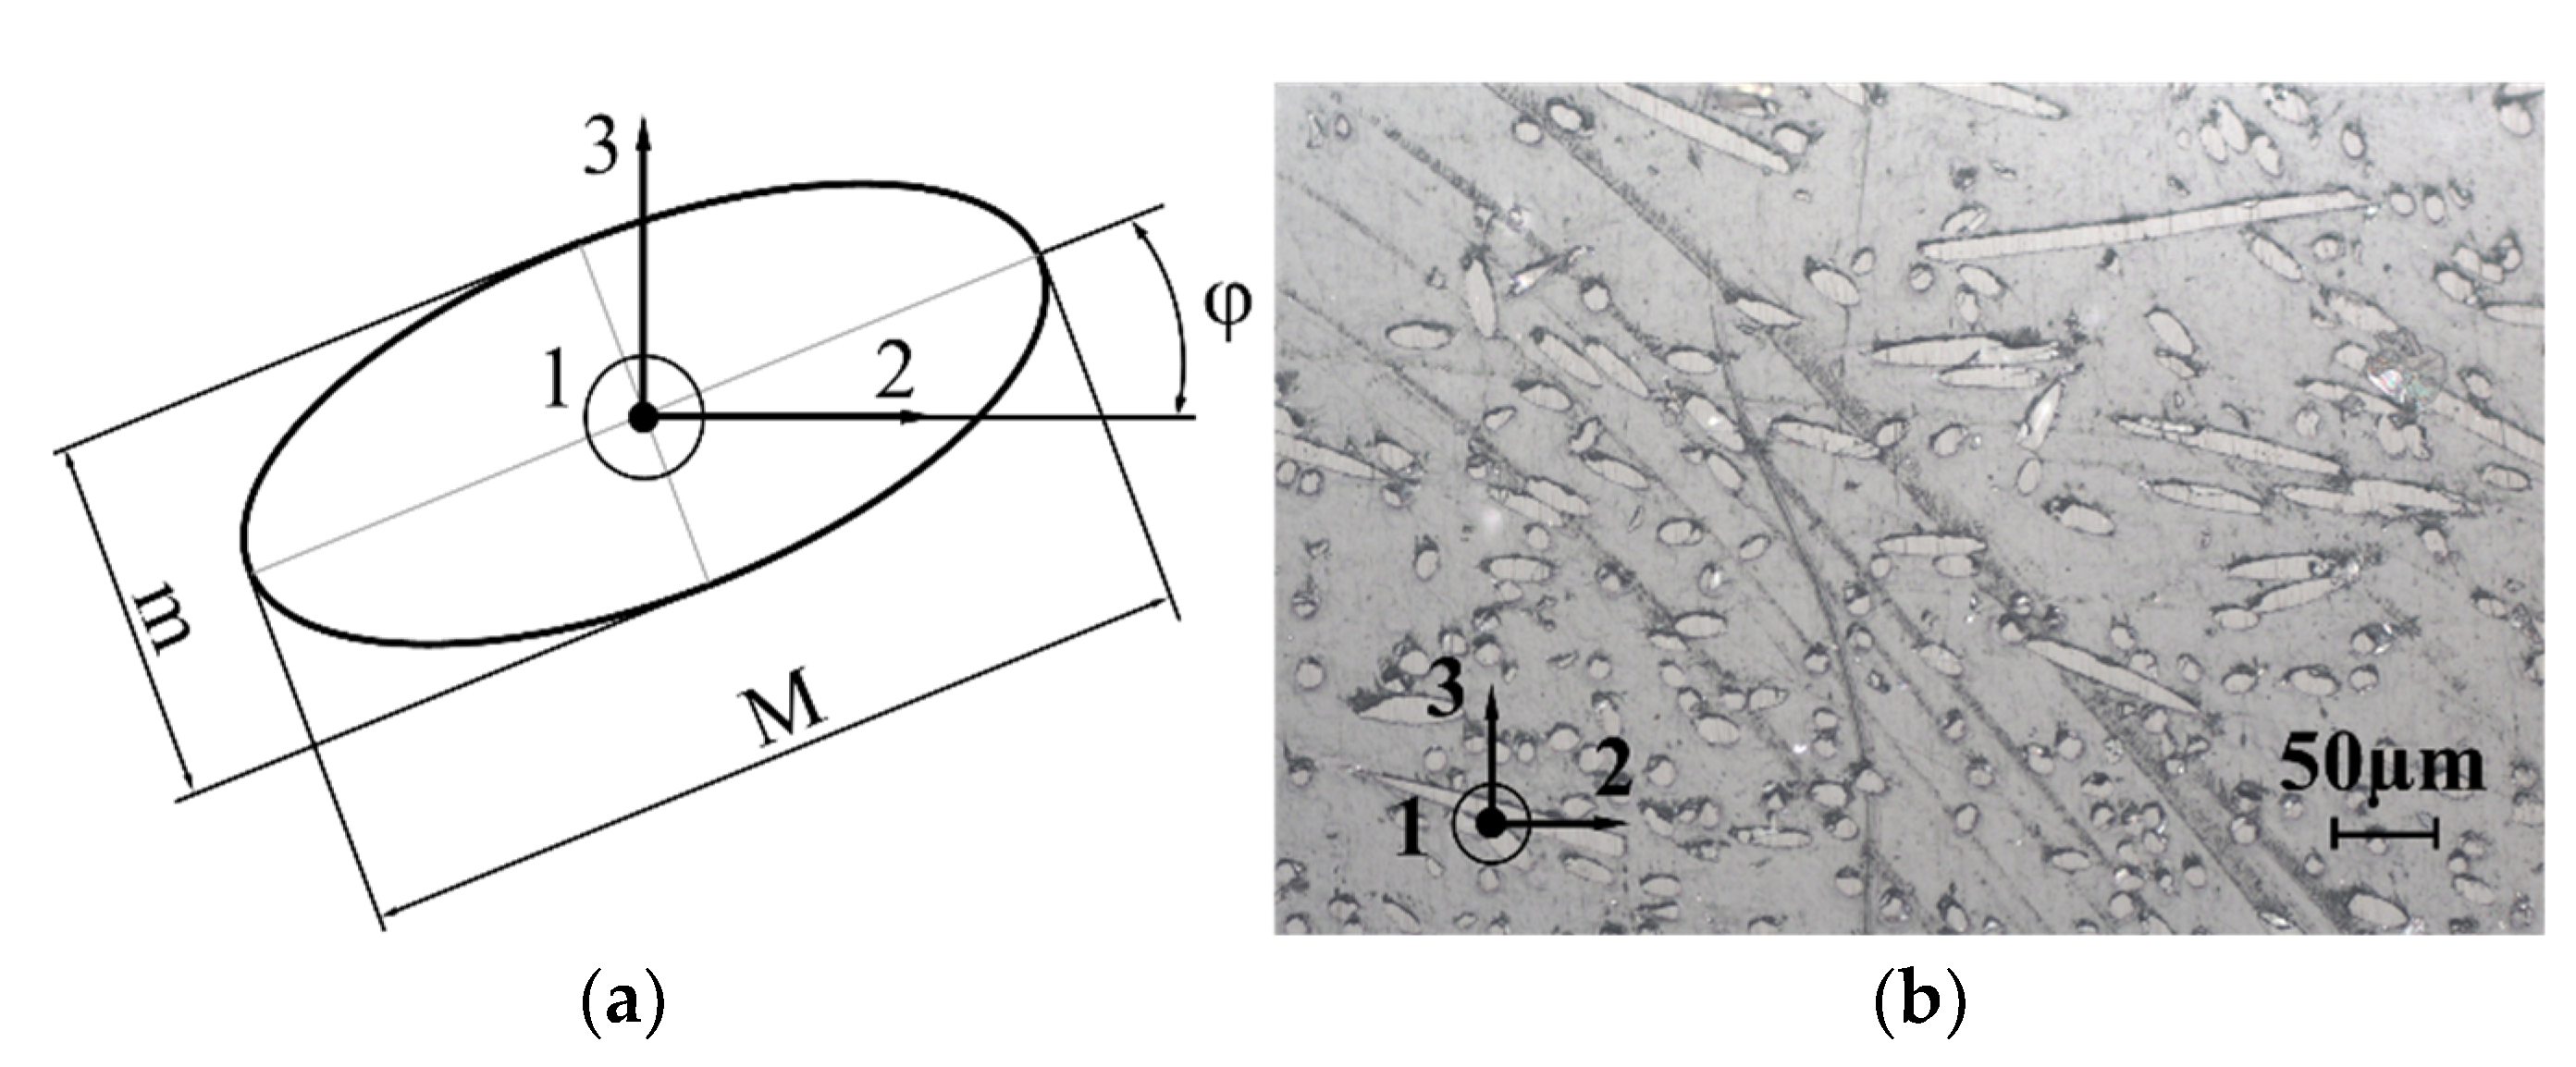
  7. Kim, E.G.; Park, J.K.; Jo, S.H. A study on fiber orientation during the injection molding of fiber-reinforced polymeric composites: (Comparison between image processing results and numerical simulation). J. Mater. Process. Technol. 2001, 11, 225–232. [Google Scholar] [CrossRef]
  8. Folgar, F.; Tucker, C.L. Orientation Behavior of Fibers in Concentrated Suspensions. J. Reinf. Plast. Compos. 1984, 3, 98–119. [Google Scholar] [CrossRef]
  9. Wang, J.; O’Gara, J.F.; Tucker, C.L. An objective model for slow orientation kinetics in concentrated fiber suspensions: Theory and rheological evidence. J. Rheol. 2008, 52, 1179–1200. [Google Scholar] [CrossRef]
  10. Phelps, J.H.; Tucker, C.L. An anisotropic rotary diffusion model for fiber orientation in short- and long-fiber thermoplastics. J. Non-Newtonian Fluid Mech. 2009, 156, 165–176. [Google Scholar] [CrossRef]
  11. Tseng, H.C.; Chang, R.Y.; Hsu, C.H.; CoreTech System Co., Ltd.; Molecular Dynamics Tech Co., Ltd. Method and Computer Readable Media for Determining Orientation of Fibers in a Fluid. U.S. Patent No. 8,571,828, 29 October 2013. [Google Scholar]
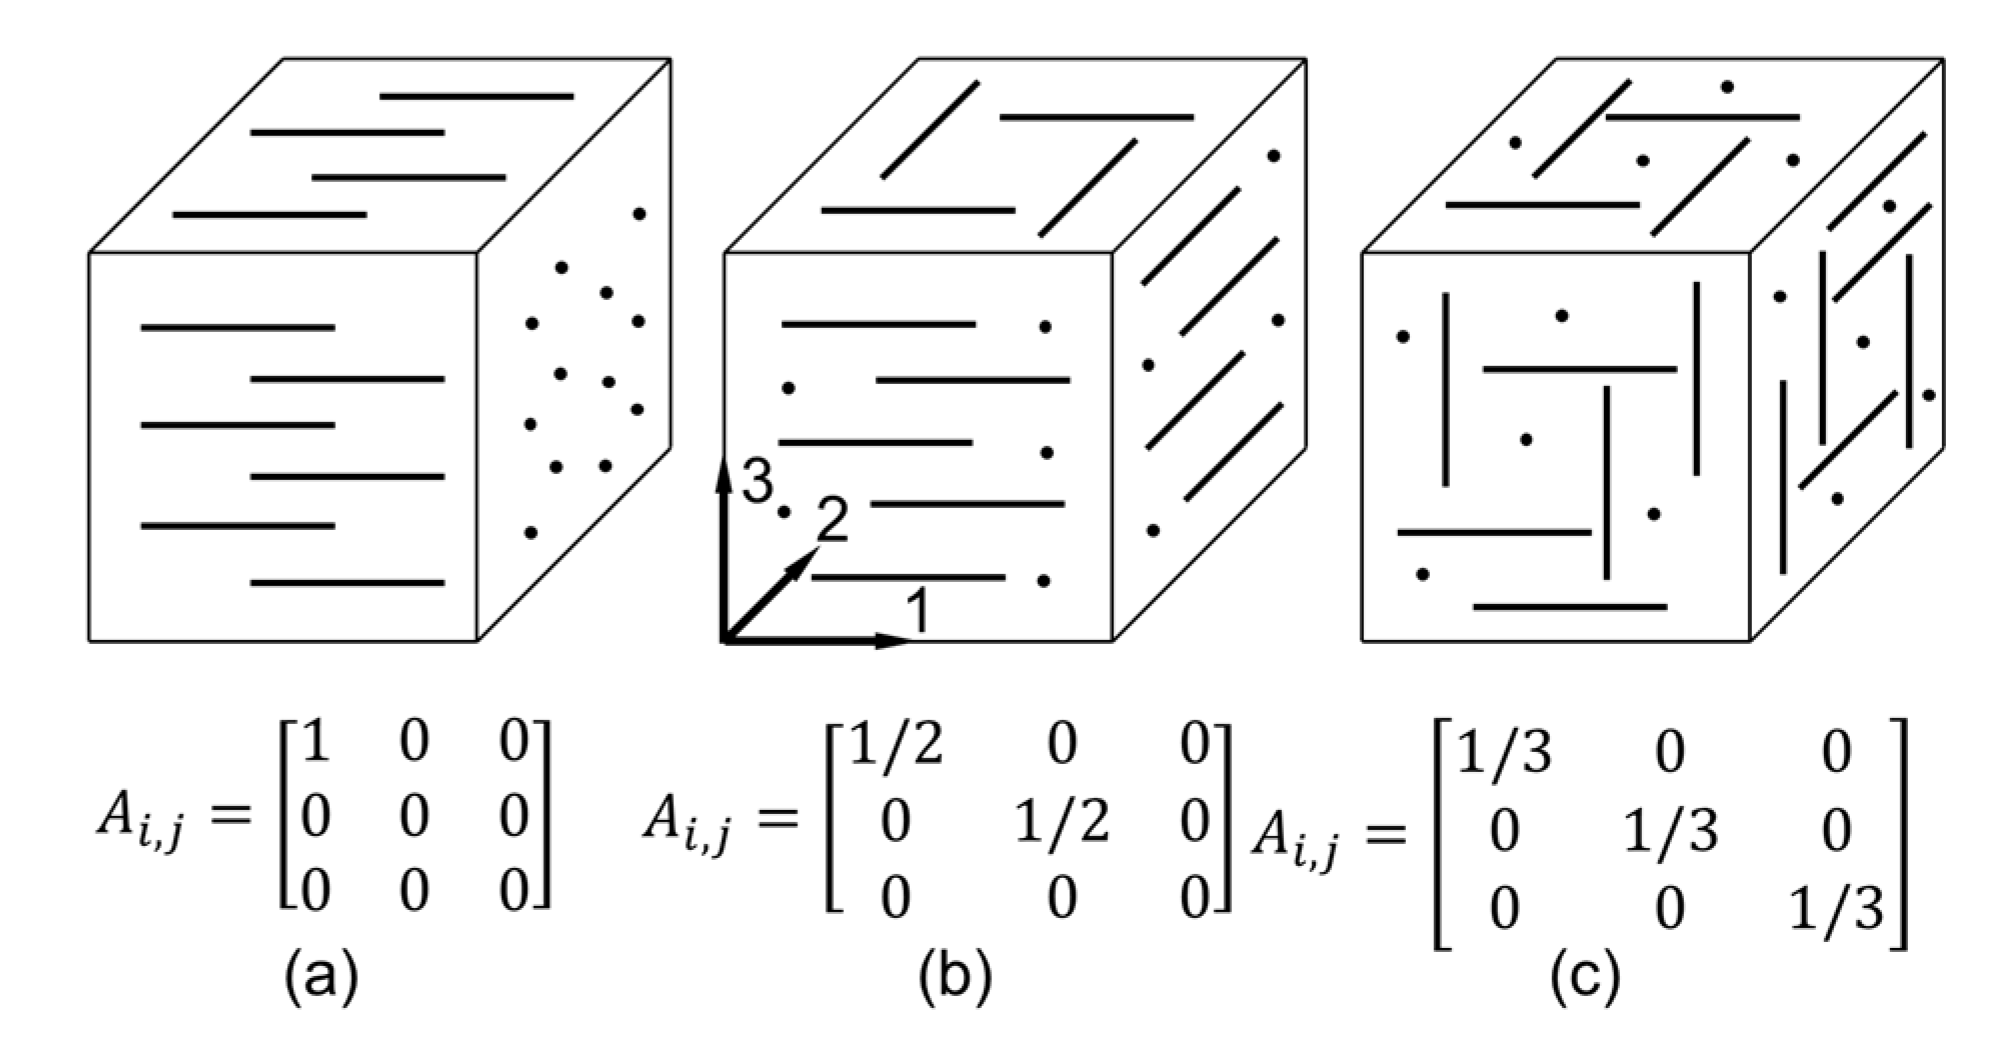
  12. Advani, S.G.; Tucker, I.I.I.C.L. The Use of Tensors to Describe and Predict Fiber Orientation in Short Fiber Composites. J. Rheol. 1987, 31, 751–784. [Google Scholar] [CrossRef]
  13. Lafranche, E.; Krawczak, P.; Ciolczyk, J.P.; Maugey, J. Injection moulding of long glass fibre reinforced polyamide 6-6: Guidelines to improve flexural properties. Express Polym. Lett. 2007, 1, 456–466. [Google Scholar] [CrossRef]
  14. Chung, D.H.; Kwon, T.H. Fiber orientation in the processing of polymer composites. Korea-Aust. Rheol. J. 2002, 14, 175–188. [Google Scholar]
  15. Swain, S.S.; Samal, S.K.; Mohanty, S.; Nayak, S.K. Investigation of fibre orientation using SEM micrograph and prediction of mechanical properties through micromechanical modelling. Bull. Mater. Sci. 2016, 39, 837–846. [Google Scholar] [CrossRef]
  16. Neves, N.M.; Pontes, A.J.; Pouzada, A.S. Experimental Validation of Morphology Simulation in Glass Fibre Reinforced Polycarbonate Discs. J. Reinf. Plast. Compos. 2001, 20, 452–465. [Google Scholar] [CrossRef]
  17. Tseng, H.-C.; Chang, R.-Y.; Hsu, C.-H. The use of shear-rate-dependent parameters to improve fiber orientation predictions for injection molded fiber composites. Compos. Part A 2018, 104, 81–88. [Google Scholar] [CrossRef]
  18. Tseng, H.-C.; Chang, R.-Y.; Hsu, C.-H. Numerical predictions of fiber orientation and mechanical properties for injection-molded long-glass-fiber thermoplastic composites. Compos. Sci. Technol. 2017, 150, 181–186. [Google Scholar] [CrossRef]
  19. Tseng, H.-C.; Goto, M.; Chang, R.-Y.; Hsu, C.-H. Accurate predictions of fiber orientation and mechanical properties in long-fiber-reinforced composite with experimental validation. Polym. Compos. 2018, 39, 3434–3445. [Google Scholar] [CrossRef]
  20. Tseng, H.-C.; Chang, R.-Y.; Hsu, C.-H. Improved fiber orientation predictions for injection molded fiber composites. Compos. Part A 2017, 99, 65–75. [Google Scholar] [CrossRef]
  21. Tseng, H.-C.; Chang, R.-Y.; Hsu, C.-H. Numerical predictions of fiber orientation and mechanical properties for injection-molded long-carbon-fiber thermoplastic composites. Polym. Compos. 2018, 39, 3726–3739. [Google Scholar] [CrossRef]
  22. Tseng, H.-C.; Chang, R.-Y.; Hsu, C.-H. Numerical prediction of fiber orientation and mechanical performance for short/long glass and carbon fiber-reinforced composites. Compos. Sci. Technol. 2017, 144, 51–56. [Google Scholar] [CrossRef]
  23. Madenci, E.; Özkılıç, Y.O.; Gemi, L. Experimental and theoretical investigation on flexure performance of pultruded GFRP composite beams with damage analyses. Compos. Struct. 2020, 242, 112162. [Google Scholar] [CrossRef]
  24. Tarfaoui, M.; Nachtane, M.; Boudounit, H. Finite Element Analysis of Composite Offshore Wind Turbine Blades Under Operating Conditions. J. Thermal. Sci. Eng. Appl. 2019, 12, 011001. [Google Scholar] [CrossRef]
  25. Boudounit, H.; Tarfaoui, M.; Saifaoui, D.; Nachtane, M. Structural analysis of offshore wind turbine blades using finite element method. Wind Eng. 2020, 44, 168–180. [Google Scholar] [CrossRef]
  26. Mollamahmutoğlu, Ç.; Mercan, A. A novel functional and mixed finite element analysis of functionally graded micro-beams based on modified couple stress theory. Compos. Struct. 2019, 223, 110950. [Google Scholar] [CrossRef]
  27. Aribas, U.N.; Ermis, M.; Eratli, N.; Omurtag, M.H. The static and dynamic analyses of warping included composite exact conical helix by mixed FEM. Compos. Part B 2019, 160, 285–297. [Google Scholar] [CrossRef]
  28. Hirsch, P.; John, M.; Leipold, D.; Henkel, A.; Gipser, S.; Schlimper, R.; Zscheyge, M. Numerical Simulation and Experimental Validation of Hybrid Injection Molded Short and Continuous Fiber-Reinforced Thermoplastic Composites. Polymers 2021, 13, 3846. [Google Scholar] [CrossRef]
  29. Ronkay, F.; Bodzai, B.; Dogossy, G. Production of technical component from polymer waste. Műanyag Gumi 2010, 47, 344–347. [Google Scholar]
  30. Szürke, S.K.; Szalai, S.; Lakatos, I. Battery Deformation Measurement with DIC Technique. In Proceedings of the 21st International Symposium on Electrical Apparatus & Technologies (SIELA), Bourgas, Bulgaria, 3–6 June 2020. [Google Scholar] [CrossRef]
  31. Fiebig, I.; Schoeppner, V. Influence of fiber orientation and weld position in welding injection-molded fiber-reinforced thermoplastics. Weld World 2018, 62, 1301–1309. [Google Scholar] [CrossRef]
  32. Papanicolaou, G.C.; Zaoutsos, S.P. 1-Viscoelastic constitutive modeling of creep and stress relaxation in polymers and polymer matrix composites. In Creep and Fatigue in Polymer Matrix Composites, 2nd ed.; Guedes, R.M., Ed.; Woodhead Publishing: Sawston, UK, 2019; pp. 3–59. [Google Scholar] [CrossRef]
  33. Tang, T.; Felicelli, S.D. Computational evaluation of effective stress relaxation behavior of polymer composites. Int. J. Eng. Sci. 2015, 90, 76–85. [Google Scholar] [CrossRef]
  34. Alagusundaramoorthy, P.; Veera Sudarsana Reddy, R. Testing and evaluation of GFRP composite deck panels. Ocean Eng. 2008, 35, 287–293. [Google Scholar] [CrossRef]
Figure 1. Explanation of fibre orientation tensor, based on [14,15] (a) oriented in direction 1, (b) planar isotropy in plane 1-2, (c) isotropic.
Applsci 12 08415 g001
Figure 2. The outline of flexural test and the main dimensions of door handle.
Applsci 12 08415 g002
Figure 3. The simulation model for Moldflow Insight 2011 (a) and for Abaqus (b).
Applsci 12 08415 g003
Figure 4. The simulated volumetric shrinkage (a) and the deviation between injected door handle and mould cavity according to GOM measurements (b).
Applsci 12 08415 g004
Figure 5. The simulated fibre orientation tensor component in direction 1 (A11) in the longitudinal section.
Applsci 12 08415 g005
Figure 6. Explanation of measurement of fibre orientation in a section of one fibre, based on [16], (a) and one measured optical microscope image (b).
Applsci 12 08415 g006
Figure 7. Validation of fibre orientation across the thickness, 10 mm from the end of product (“c”—calculated data with AMI; “m”—measured data according to optical microscopy with standard deviation).
Applsci 12 08415 g007
Figure 8. The unloaded and loaded (8 mm deflected) door handle in reality (above) and in simulation (below).
Applsci 12 08415 g008
Figure 9. The force–time curves at 4 mm deflection.
Applsci 12 08415 g009
Table 1. The ratio of measured (subscript “m”) and calculated (subscript “c”) flexural rigidity.
DeflectionReaction ForceFlexural RigidityRatioRelative Error
fFmFcEImEIcEIm/EIc
(mm)(N)(MPa·mm4)(−)(%)
245.751.91.271.440.8813.39
5.93
12.24
12.26
497.491.41.351.271.075.93
6159.0139.51.471.291.1412.24
8223.8195.91.551.361.1412.26
Mean10.95
Standard deviation3.39
Publisher’s Note: MDPI stays neutral with regard to jurisdictional claims in published maps and institutional affiliations.

