Article

Fast Calculation of Acoustic Field Distribution for Ultrasonic Transducers Using Look-Up Table Method

1
School of Instrumentation and Opto-Electronics Engineering, Hefei University of Technology, Hefei 230009, China
2
National Engineering Laboratory of Special Display Technology, National Key Laboratory of Advanced Display Technology, Academy of Photoelectric Technology, Hefei University of Technology, Hefei 230009, China
3
National Engineering Research Center for Optoelectronic Crystalline Materials, Fujian Institute of Research on the Structure of Matter, Chinese Academy of Sciences, Fuzhou 350003, China
*
Authors to whom correspondence should be addressed.
Appl. Sci. 2022, 12(17), 8459; https://doi.org/10.3390/app12178459
Submission received: 1 August 2022 / Revised: 16 August 2022 / Accepted: 22 August 2022 / Published: 24 August 2022

Abstract

:
The point source superposition method based on the Rayleigh integral model is time-consuming for calculating the three-dimensional spatial sound field. In this paper, the look-up table method is introduced into the calculation of the acoustic field to reduce the computational effort. Based on the region of synchronous vibration on the transducer, a sub-regional look-up table method is proposed. Simulations demonstrate that both the acoustic field look-up table (ALUT) method and the acoustic field sub-regional look-up table (ASLUT) method have the same acoustic field calculation results as the point source method. Regarding the cost of time, the acoustic field look-up table method takes only one third of the time of the point source method, and the acoustic field sub-region look-up table method takes only one eighteenth of the time of the point source method, with the possibility of further reduction. Both the ALUT and ASLUT methods significantly reduce the calculation time for different types of transducers, which is beneficial for the study of planar sound source devices.

1. Introduction

The key element for acoustic energy emission is the ultrasonic transducer. Different shapes of ultrasonic transducers are designed to create different sound fields and are used in various applications, such as ultrasonic ranging [1,2] and ultrasound imaging [3]. The directivity of the acoustic field, the width of the beam and other indicators directly affect the accuracy of the instrument which is significant in ultrasound medicine [4] and acousto-optical devices [5,6,7]. Acoustic field simulation results of ultrasonic transducers assist researchers in adjusting designs to achieve improved performance. So, accurate calculation of the acoustic field is a key aspect in the design and optimization of ultrasonic transducers, and scholars have carried out a lot of work in this area [8,9].
The calculation of the acoustic field of an ultrasonic transducer is often equated to the calculation of the acoustic field for embedded sound sources on an infinitely large rigid plane. The problem of planar radiating surfaces has been studied by many scholars [10,11]. Solving the acoustic field in three-dimensional space is generally described by the fixed solution equation formed by the Helmholtz equation under the boundary conditions [12,13]. The multi-Gaussian beam superposition model calculates the acoustic field of a piston-type source using multiple Gaussian beams [14]. The calculation is fast but limited by the near-axis condition. The nonparaxial multi-Gaussian model is proposed to address errors arising from non-proximal axes [15]. The Rayleigh integral model is based on the derivation of Huygens’ principle, proposed by the British physicist Rayleigh in 1877, which can be used to obtain accurate solutions and is suitable for many types of acoustic field radiation [16]. Due to the complexity of the boundary conditions in the acoustic field region and the arbitrary shape of the sound source, the calculation process takes a long time and it is difficult to find an analytical solution.
The point source method is a numerical calculation of the Rayleigh integral for piston type sources, which greatly simplifies the complexity of the calculation [17,18]. Compared with the acoustic calculation methods such as finite element [19] and boundary element [20] proposed later, the point source method saves the trouble of associating a larger number of systems of equations. However, due to a large number of sampling points, the point source method is time-consuming. Various methods of numerical deceleration have been proposed to address this problem. Williams et al. propose a method for accelerating the numerical calculation of Rayleigh integrals through the FFT. However, the algorithm is limited by distance and is only suitable for near-field calculations [21]. The angular spectrum method is equivalent in principle to the Rayleigh integral, which is the spatial time-domain representation of the Huygens principle, and the angular spectrum method (ASM) is the spatial frequency domain representation of the Huygens principle. In numerical calculations, the ASM uses the two-dimensional fast Fourier transform (FFT), which greatly reduces the computation time and is suitable for applications such as phased arrays that require a large number of acoustic field calculations [22,23,24]. However, the calculations may incur a serious aliasing error which seriously affects the computation accuracy. To reduce errors in the propagation, aperture size and propagation distance are limited [25,26]. Alberto et al. proposed a GPU-based solution to accelerate the acoustic field simulations [27].
The look-up table method is often used as an accelerated algorithm in the calculation of holograms of three-dimensional point sets, which has a good reference for accelerated calculation of the acoustic field of piston-type sources [28,29]. In this paper, an acoustic field look-up table method is presented for fast calculation of the acoustic field. To the best of our knowledge, this is the first time that the idea of the look-up table method has been used in the calculation of ultrasonic transducers. Moreover, based on the same amplitude of the source plane, we propose an acoustic field sub-region look-up table method which reduces the number of calculations by dividing the region into blocks. To demonstrate validity, the point source method based on the Rayleigh integral model is compared with the two proposed methods. Compared with the point source method, both the acoustic field look-up table method and the acoustic field sub-region look-up table method can obtain the same acoustic field. In the cost of time, the ALUT method takes only one third of the time of the point source method, and the ASLUT method takes only one eighteenth of the time of the point source method, with the possibility of further reduction. In practical applications, phased arrays in non-destructive testing (NDT), high-intensity focused ultrasound (HIFU), and ultrasound medical imaging require the fast and accurate calculation of the acoustic field to achieve safety and efficiency targets [30,31,32]. The study of the ALUT method and the ASLUT method has contributed to these performance indicators.

2. Method

2.1. Rayleigh–Sommerfeld Integral Model

As shown in Figure 1, the transducer with arbitrary shape is located in the complete radiating surface S. According to the Huygens principle, each point on S can be regarded as a vibration source radiating spherical waves outward, and the acoustic field at any point in space is the combined result of propagation in space in the form of a spherical wave at each point of the source plane, which can be expressed as Rayleigh integral [16]:
p x , y , z = j ρ c λ s u e j k r r d s
where ρ is the density of the medium, c is the phase velocity of the sound waves, u is the velocity amplitude of the piston, λ is the wavelength, k is the wavenumber, and r is the distance between the sampling point (x, y, z) in space and an elemental area ΔS of the radiation surface S.
In most cases, Rayleigh integrals are difficult to find analytical solutions. Numerical processes are introduced into the calculation. The point source method is the most commonly used numerical calculation method. Divide the surface of the sound source into an infinite number of small facets. When the facets are small enough, any facet can be regarded as a point sound source. By superimposing the sound field distribution at each point of the source plane in space, we can obtain the distribution in the whole space. This method is suitable for calculating the free sound field generated in the acousto-optic crystal by a transducer of any shape. The expression is given by:
p x , y , z = j ρ c u λ n = 1 N e j k ( x x n ) 2 + ( y y n ) 2 + z ( x x n ) 2 + ( y y n ) 2 + z
where the location of the sound source point is denoted by (xn, yn, 0), and N is the number of sampling points in the sound source. For uniformly excited rectangular sources, the complex surface velocity u is the same for all points.

2.2. Acoustic Field Look-Up Table Method

Due to a large number of sampling points in the acoustic field, the calculation of the numerical solution based on the Rayleigh integral takes a long time. The look-up table (LUT) method can be used to solve this problem. The LUT method is an algorithm that accelerates the computational process by pre-computing part of the data. In hologram calculations, a three-dimensional object is discretized as a collection of points and the complex amplitude information of the hologram is obtained by superimposing the spherical waves of the discretized points. The look-up table method saves time in the computation by pre-storing the repetition information in the spherical wave superposition calculation. The process of calculating planar sound sources through the Rayleigh integral model can also be accelerated by pre-storing information. Unlike hologram calculations, where the depth information of a 3D object is compressed into a 2D hologram, the acoustic field is calculated from a 2D source surface to the acoustic field in 3D space. In this subsection, we elaborate on the reasons for the long time taken to calculate the acoustic field. And an acoustic field look-up table method is proposed to reduce the time.
Figure 2a,b shows an outline of the process of calculating the acoustic field in three dimensions by the point source method. As shown in Figure 2a, the Source layer is the acoustic source plane where the electrode is located, and slice 1 to slice M is the spatial location planes of different depths. To facilitate the calculation, we make the source point spacing and the acoustic field distribution sampling point spacing the same, both denoted by ∆p, with N × N elements in each layer. Figure 2b shows the location relationships between the acoustic source point and sound field sampling points in a one-dimensional manner. There are N vibration points in the source plane. From slice 1 to slice M, there are N sound field sampling points in each layer. According to Equation (2), the distance relationship between any source point in the source plane and the sampling point in space can be expressed as Equation (3):
r = ( x x n ) 2 + ( y y n ) 2 + z
where r is the distance between the sampling point (xn, yn, z) in space and the acoustic source point (x, y, 0). In order to obtain the three-dimensional sound field distribution in space, it is necessary to perform the M × N2 calculation as in Equation (3), which is undoubtedly a tedious task.
The ALUT method was proposed to solve this problem. When calculating the acoustic field distribution of any layer, the distance relations between source points and the sampled points in the spatial plane have overlapping parts. As shown in Figure 2c, based on the distance of different layers from the source layer, the corresponding M tables are calculated according to Equation (3). The corresponding table for each layer has 2N − 1 pixels, and the pixel spacing is the same as the spacing of the sound field sampling points as ∆p. The distance correspondences of the nth vibration point in the slice m can be extracted from the (N + 1 − n)th sampling point to the (2Nn)th sampling point of the nth table. Thus, the distance term between the distribution of acoustic source points and the sampling points at slice m can be obtained by table m. As a result, the flow of the sound field calculation is simplified from Equations (2)–(4):
P = n = 1 N j ρ c u λ · T n
T n = e j k R R
where Tn represents the distance term of the acoustic field radiated by the nth source point into three dimensions. The distance term Tn is calculated in advance and stored in the table. R denotes the set of distances between the nth sound source point and all points in space. By storing the table in advance, the multiplication, root, and exponential operations of each point are omitted. Thus, the computation time decreases significantly.

2.3. Acoustic Field Sub-Region Look-Up Table Method

To the best of our knowledge, this is the first time that the look-up table method has been applied to the calculation of the acoustic field of an ultrasonic transducer. Moreover, we further simplify the calculation according to the specificity of the ultrasonic transducer. An arbitrarily shaped ultrasonic transducer is expressed by a discretized point source distribution. The ALUT method records the look-up tables of individual point sources at different depths, so the calculation of the sound field at each depth requires a superposition equal to the number of point sources of the sound source. The points on the ultrasonic transducer vibrate synchronously. Thus, we propose the acoustic field sub-region lookup table (ASLUT) method to further simplify the calculation process.
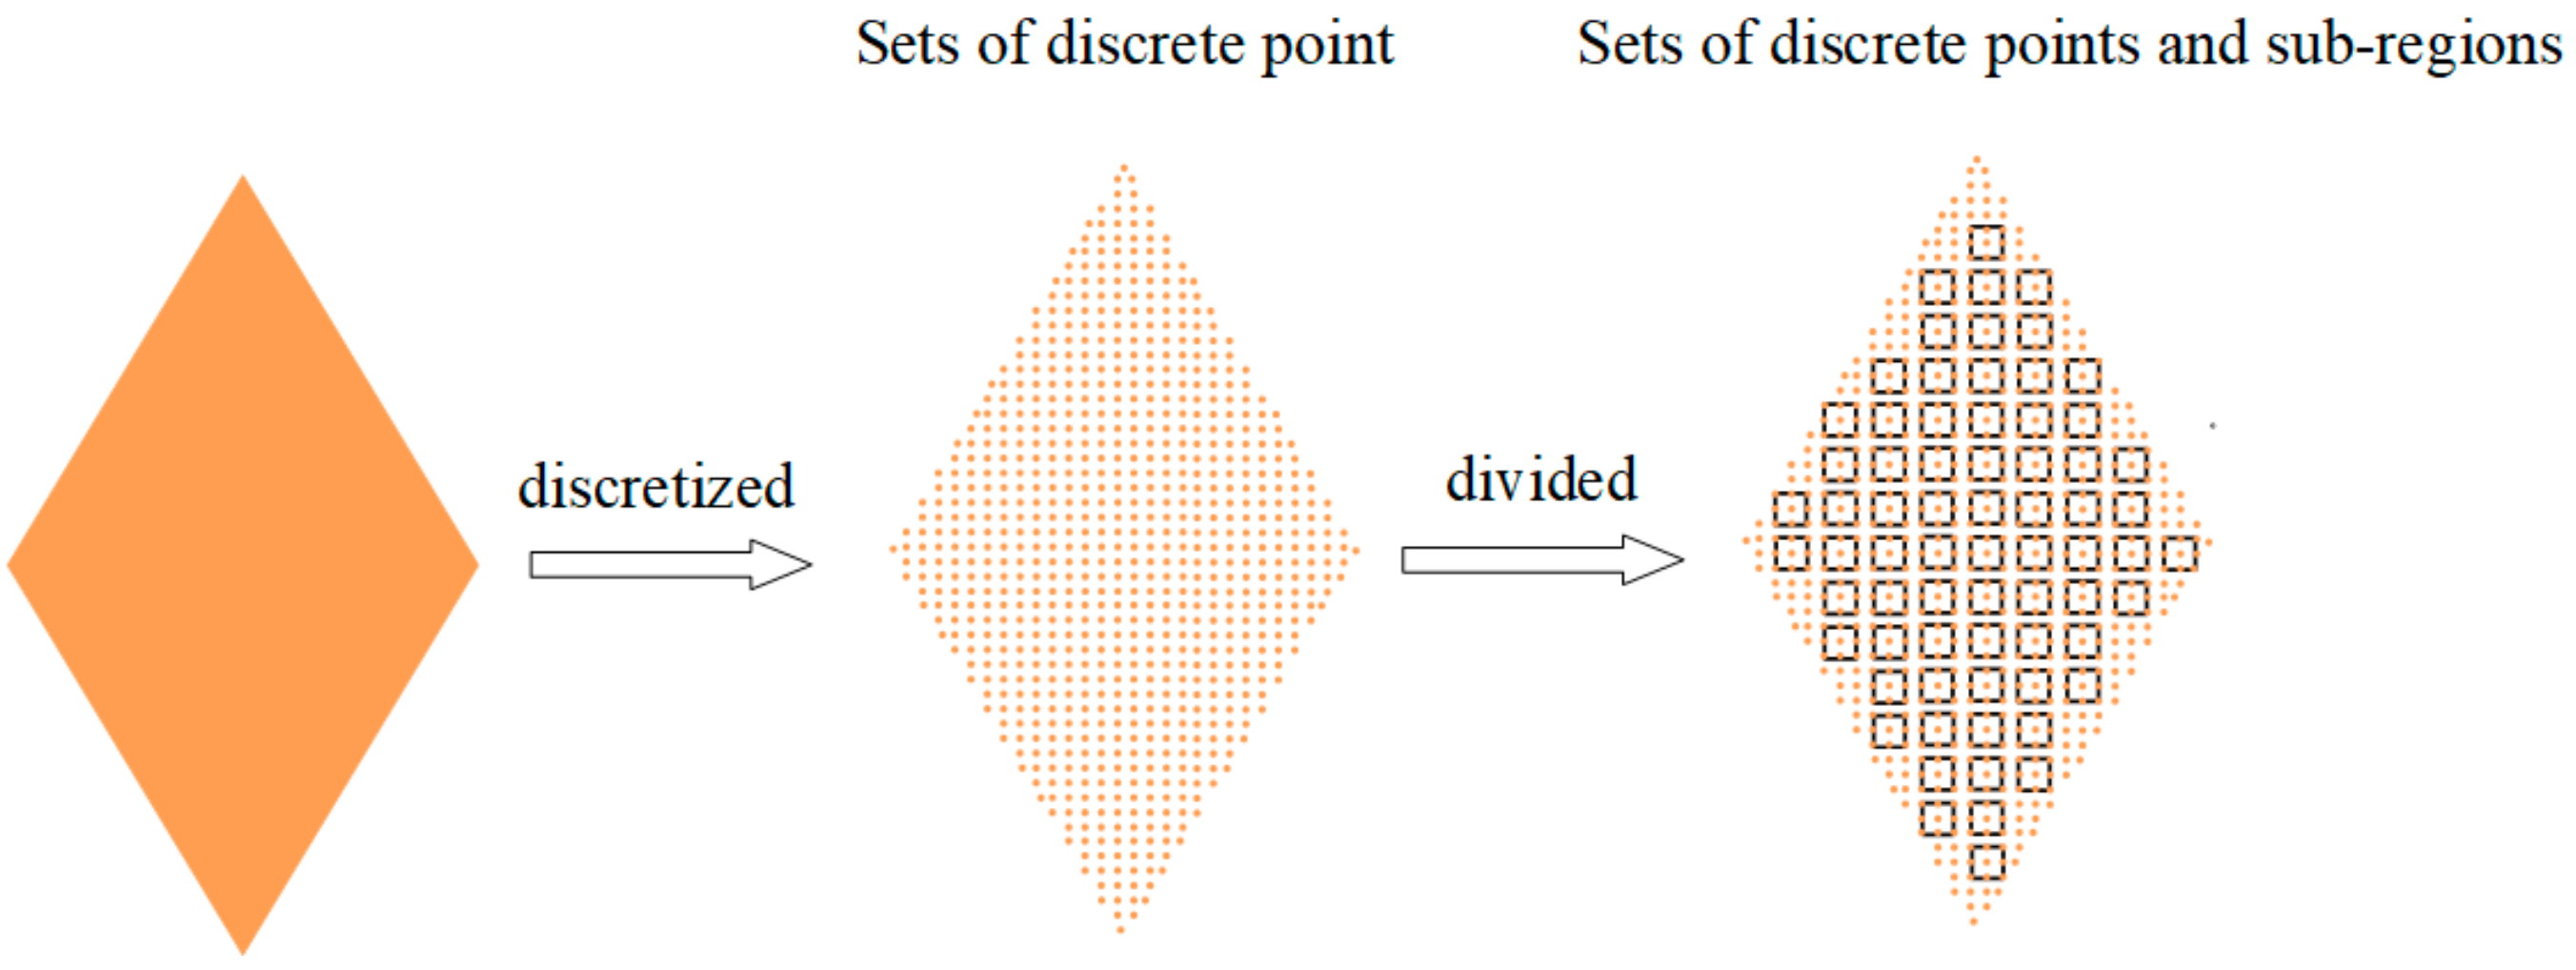
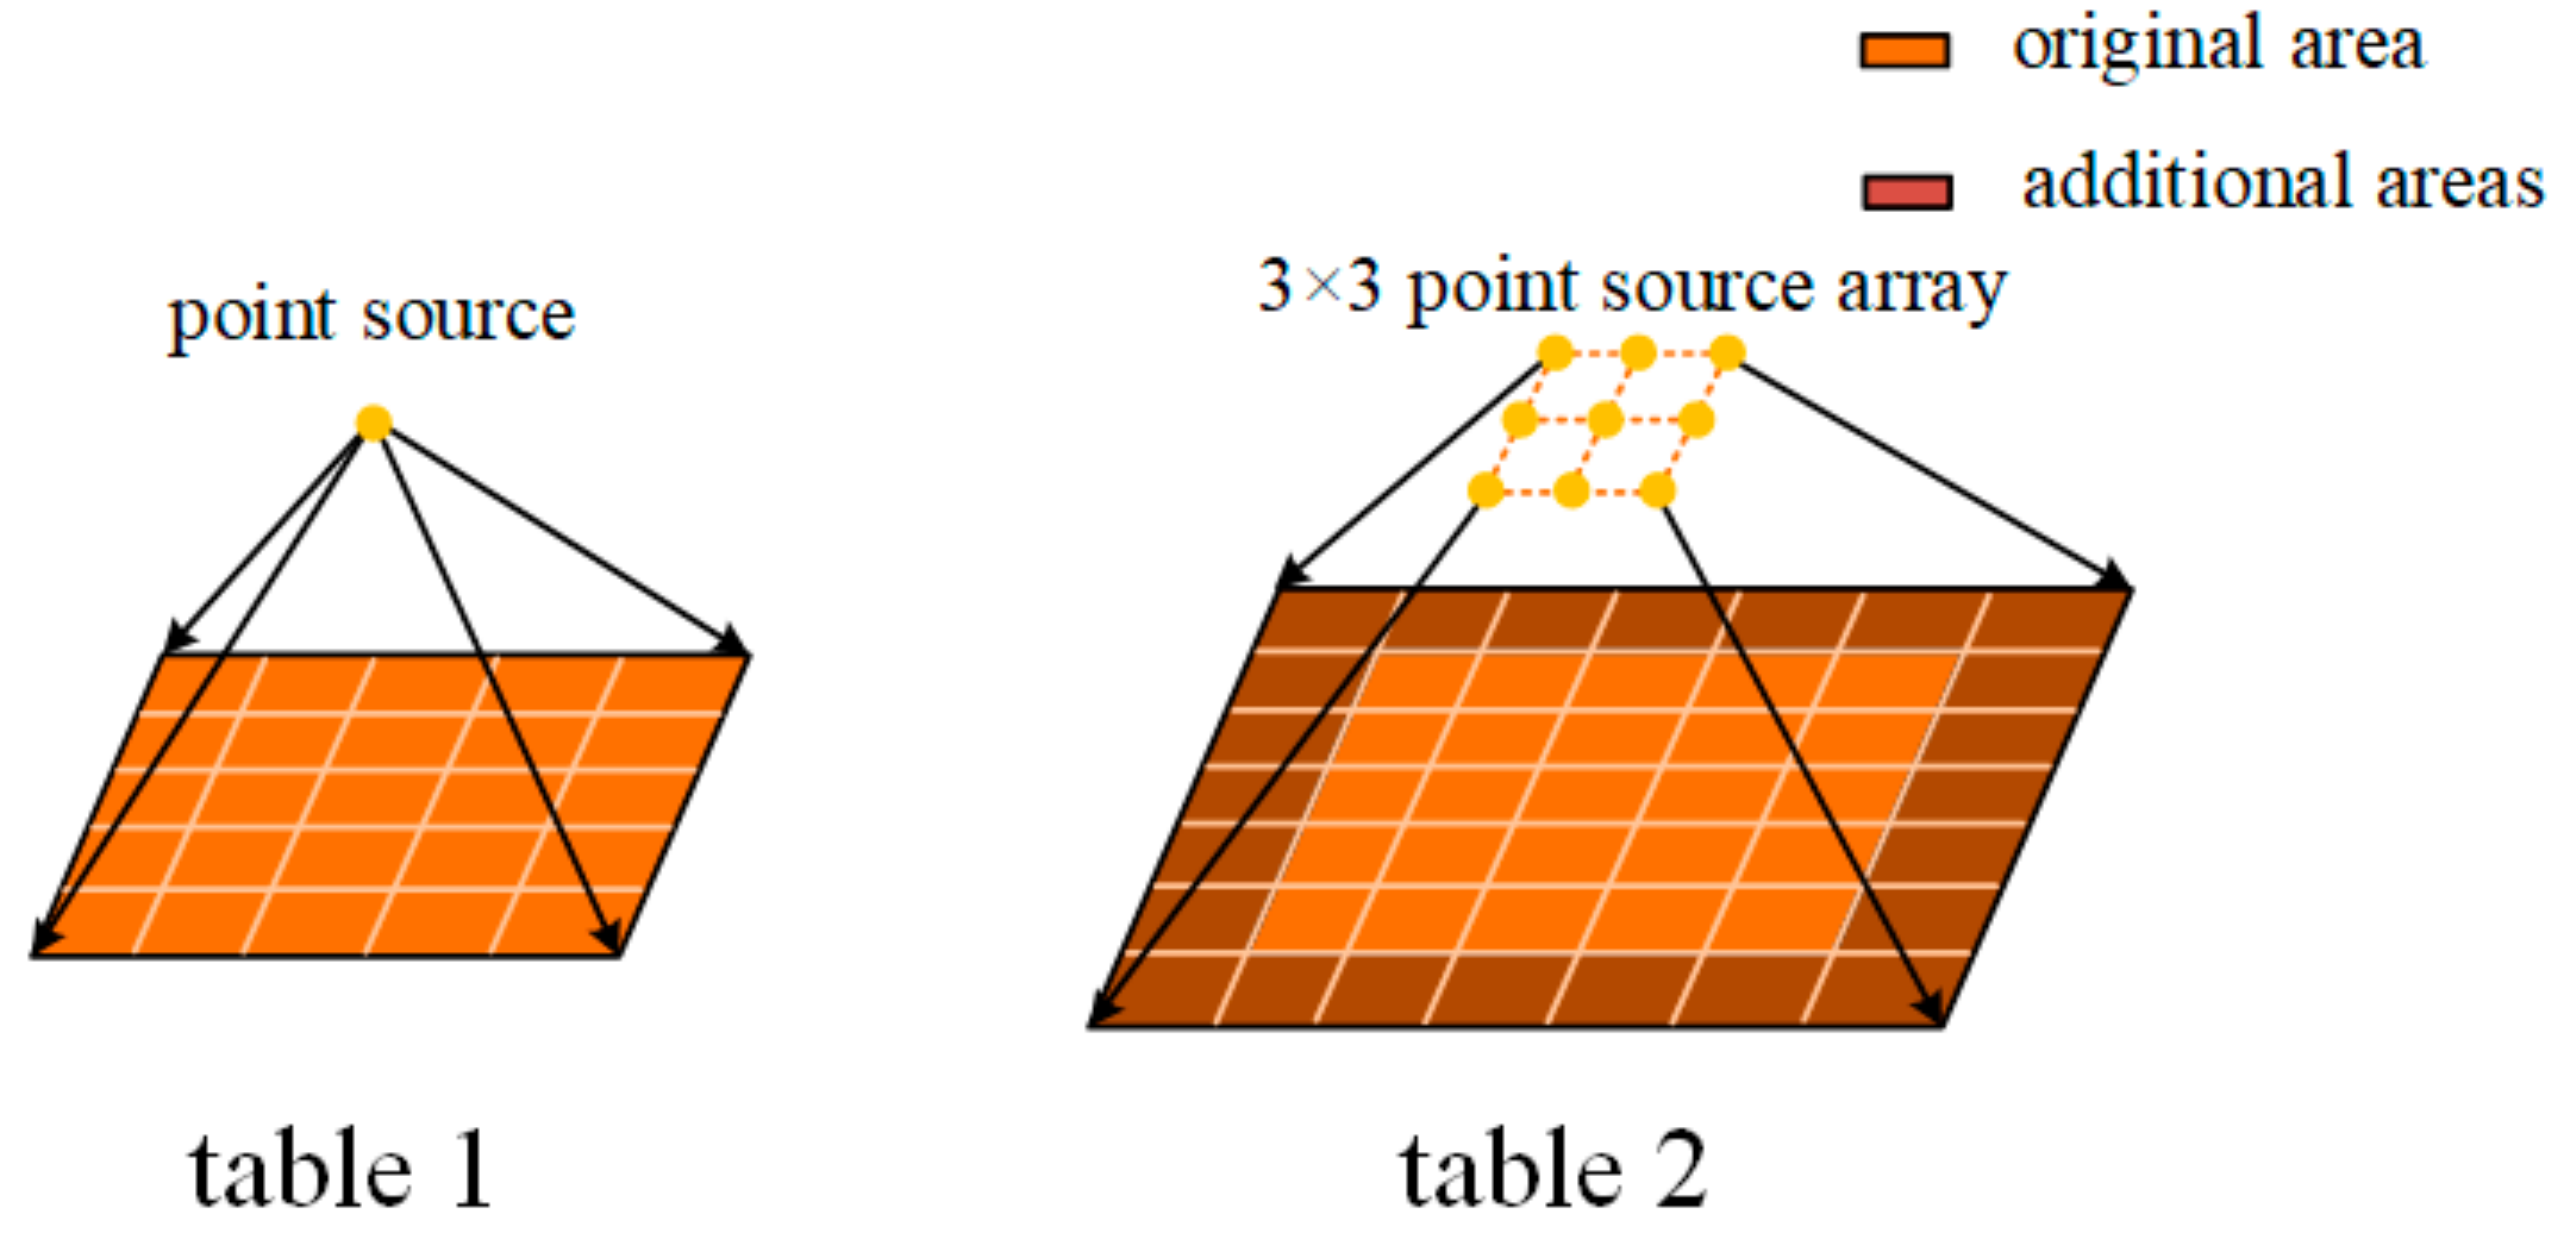
As shown in Figure 3, the amplitude of each point source on the ultrasonic transducer is the same, and thus the adjacent point sources can be composed as a sub-region. As an example, in Figure 3, a 3 × 3 point source square is integrated into a sub-region. The entire diamond-shaped transducer component is divided into a single point source and a 3 × 3 point source group. The shape of the transducer can also be decomposed into other combinations of different point sets, which will not be discussed in detail here. The table is also adjusted accordingly to save the spatial propagation distances of single point sources and 3 × 3 point source groups respectively as shown in Figure 4.
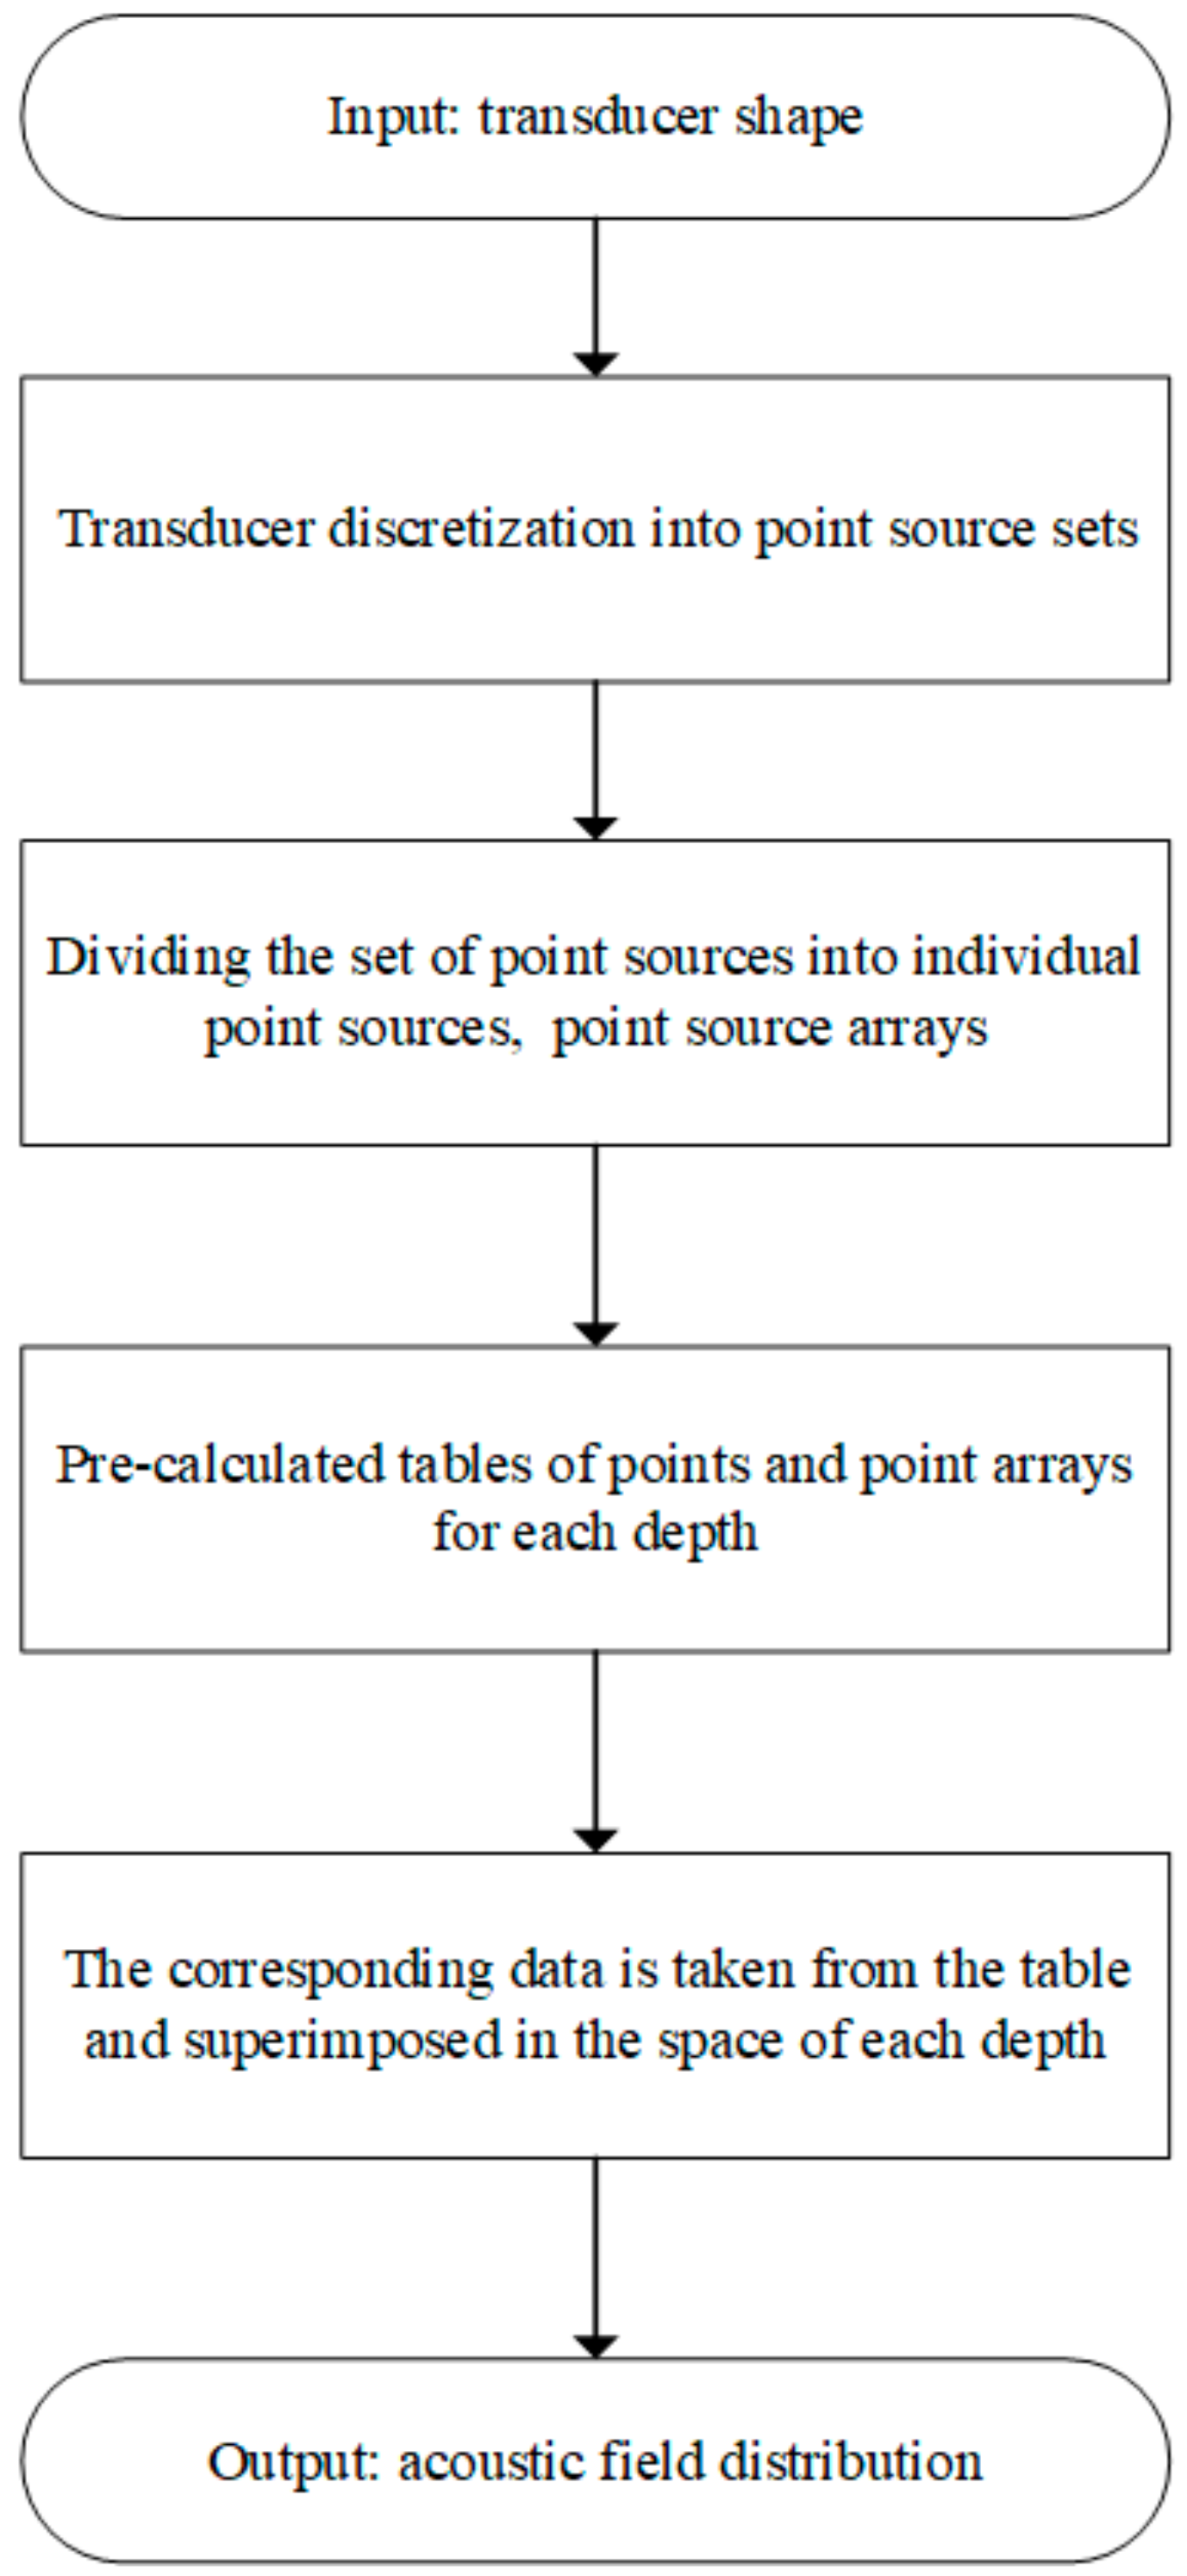
Because the point source array superimposes the spatial sound field propagation information of all the different location points, the size of the recorded table is larger than the size of the individual point source recording table. Taking 3 × 3 point source array as an example, if the size of a single point source recorded table is L × L, where L = (2N − 1) × ∆p, then the record table length and width of the 3 × 3 point source array are L + 2∆p. After calculating and storing the acoustic field distribution information for each depth, the acoustic field distribution in space can be quickly calculated by the look-up table method. The whole process is represented in Figure 5 for a clearer representation.

3. Numerical Simulations and Experiment

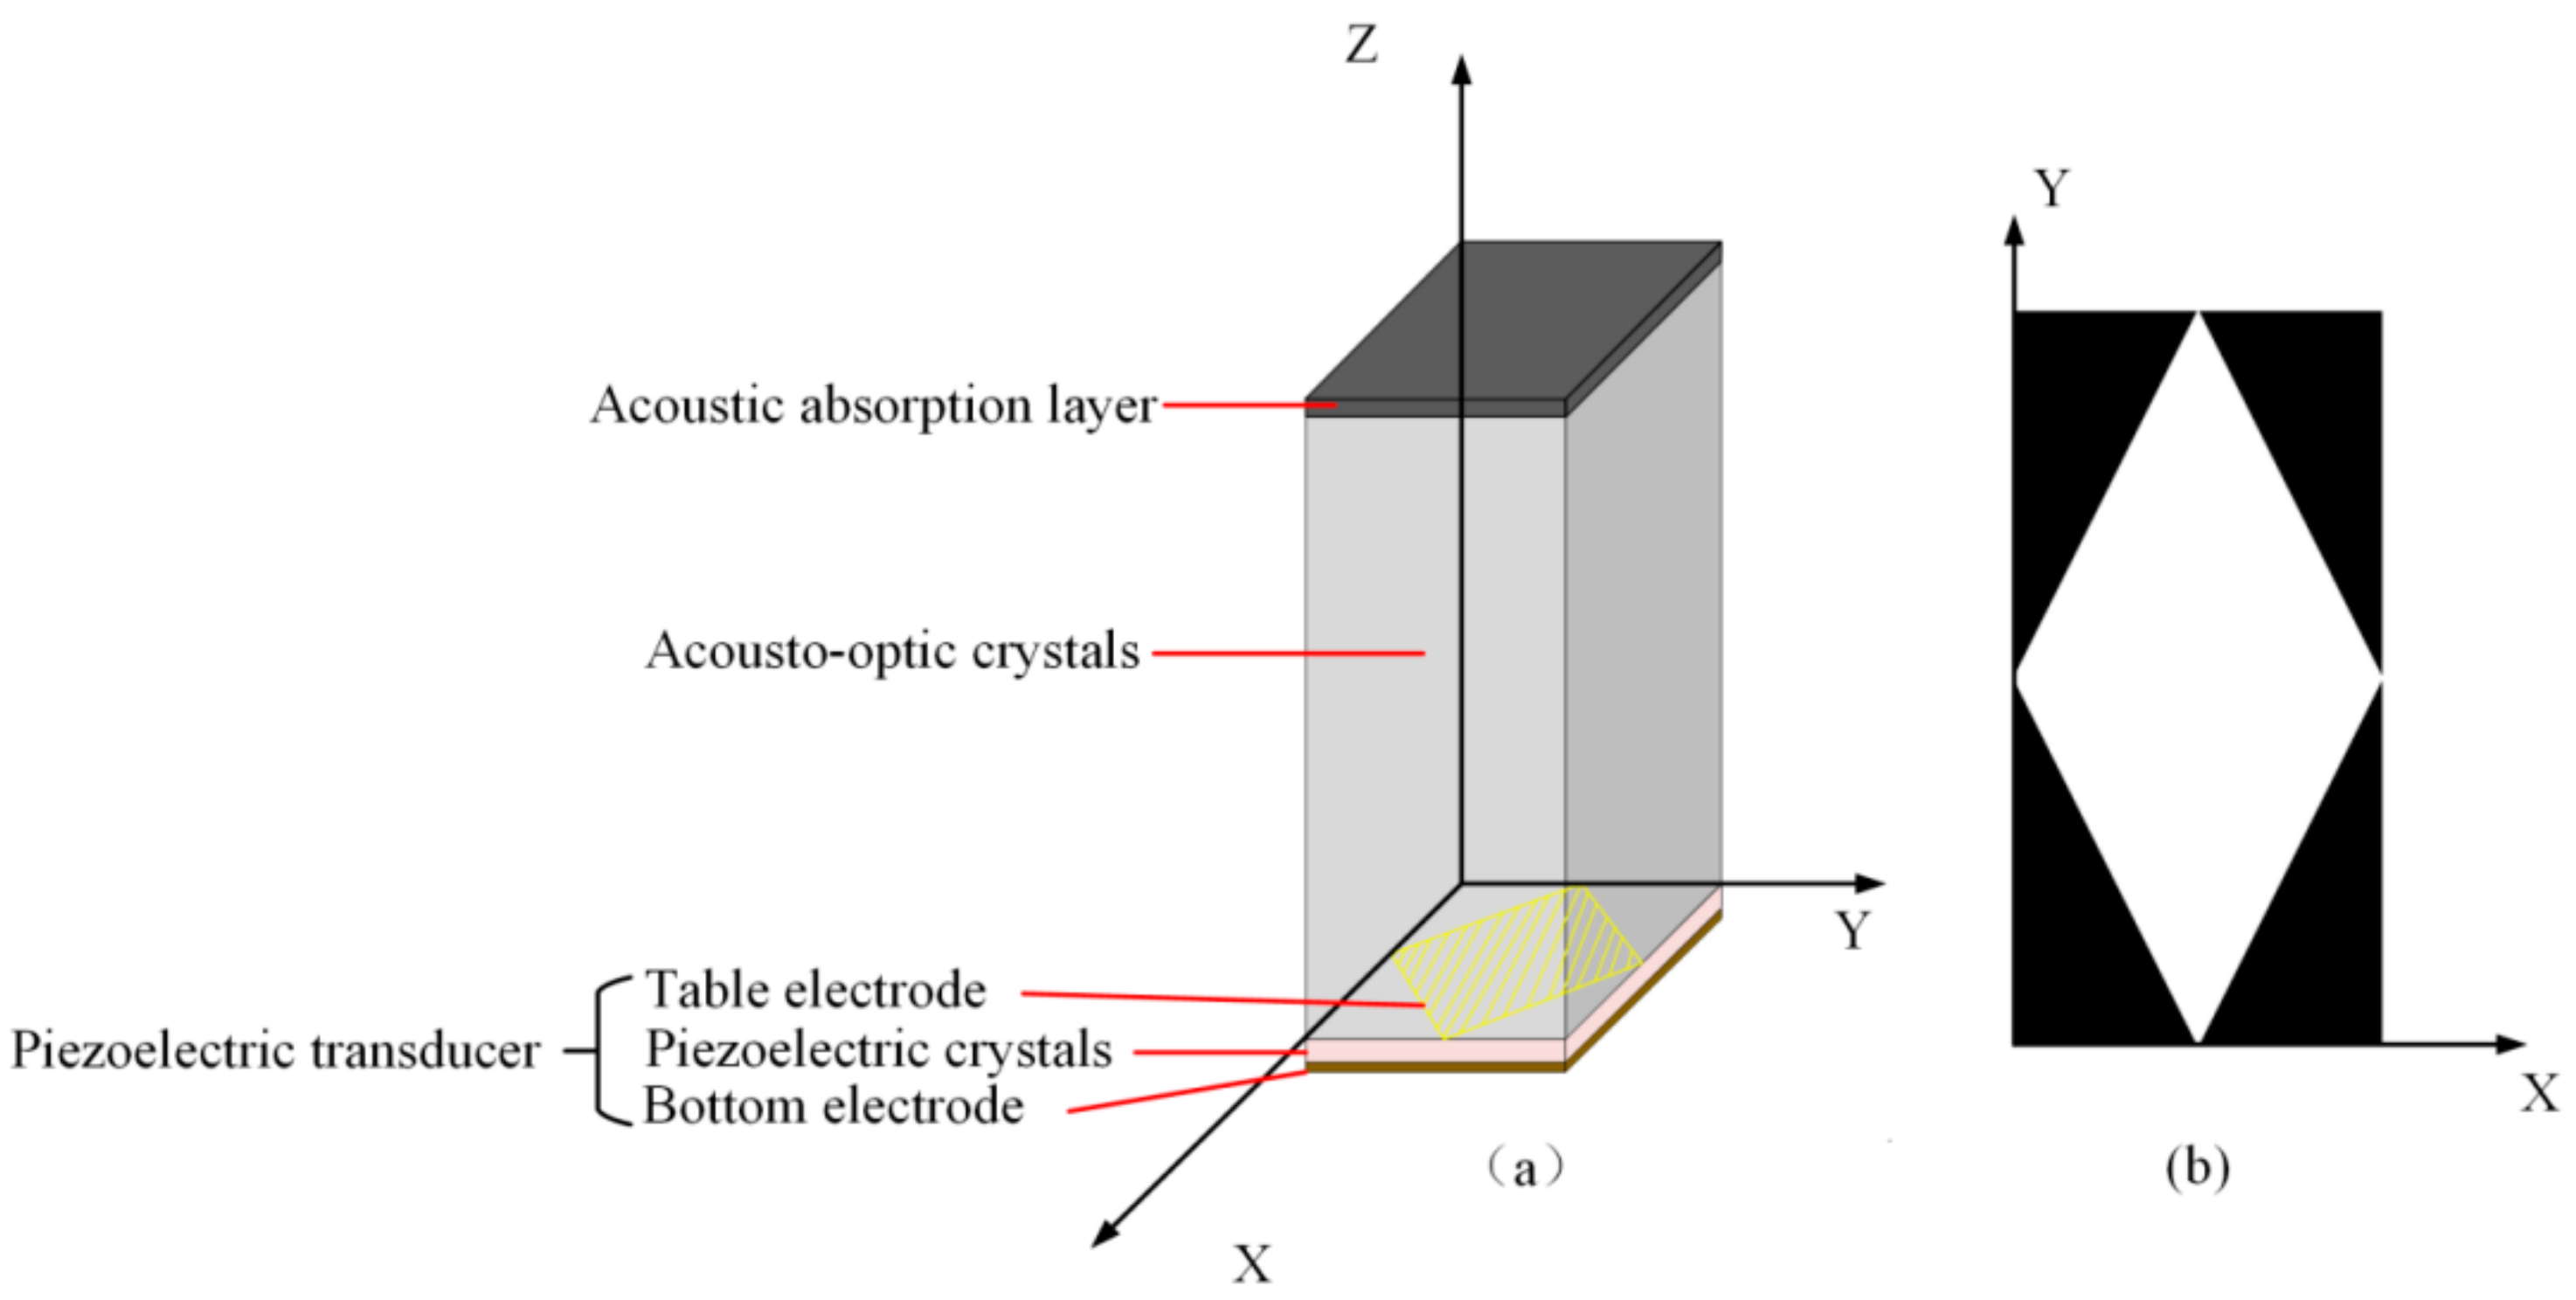
To demonstrate the effectiveness of the proposed method to calculate the acoustic field distribution, we calculated the acoustic field distribution generated by the transducer using the point source method, the ALUT method, and the ASLUT method, respectively. Acousto-optical devices are one of the main areas of application for ultrasonic transducers. We use the structure and parameters of the acousto-optic modulator to calculate the ultrasonic transducer acoustic field [33]. The overall structure of the transducer is shown in Figure 6a, which consists of an ultrasonic transducer, an acoustic-optical crystal, and a perfectly matched layer. In this simulation, a diamond transducer shape is chosen. The driving frequency of the transducer is 80 MHZ, and the wavelength of the sound wave propagating in the crystal is 71.8 µm. If boundary discretization coarser than λ/2 is employed, the resulting acoustic field would be distorted because of spatial aliasing [34,35,36]. For simplicity, we set the sampling spacing to 25 µm. Thus, the rhombic electrode is represented by a two-dimensional matrix that consists of 400 × 200 sampling points, as shown in Figure 6b. Any point in the transducer area is assigned a value of 1, indicating that the points on the electrode vibrate synchronously, while the points not in the transducer area do not vibrate. And the initial phase of the vibration at each point on the electrode is set to 0. To more clearly represent the direction and position relationship, the long side of the transducer is set to the Y-axis and the short side is set to the X-axis, and the propagation direction of the acoustic field is the Z-axis. The propagation distance of the acoustic field calculation is 12 cm. The sampling spacing of propagation depth is the same as the sampling spacing of electrode surface grid points; both are 25 μm.
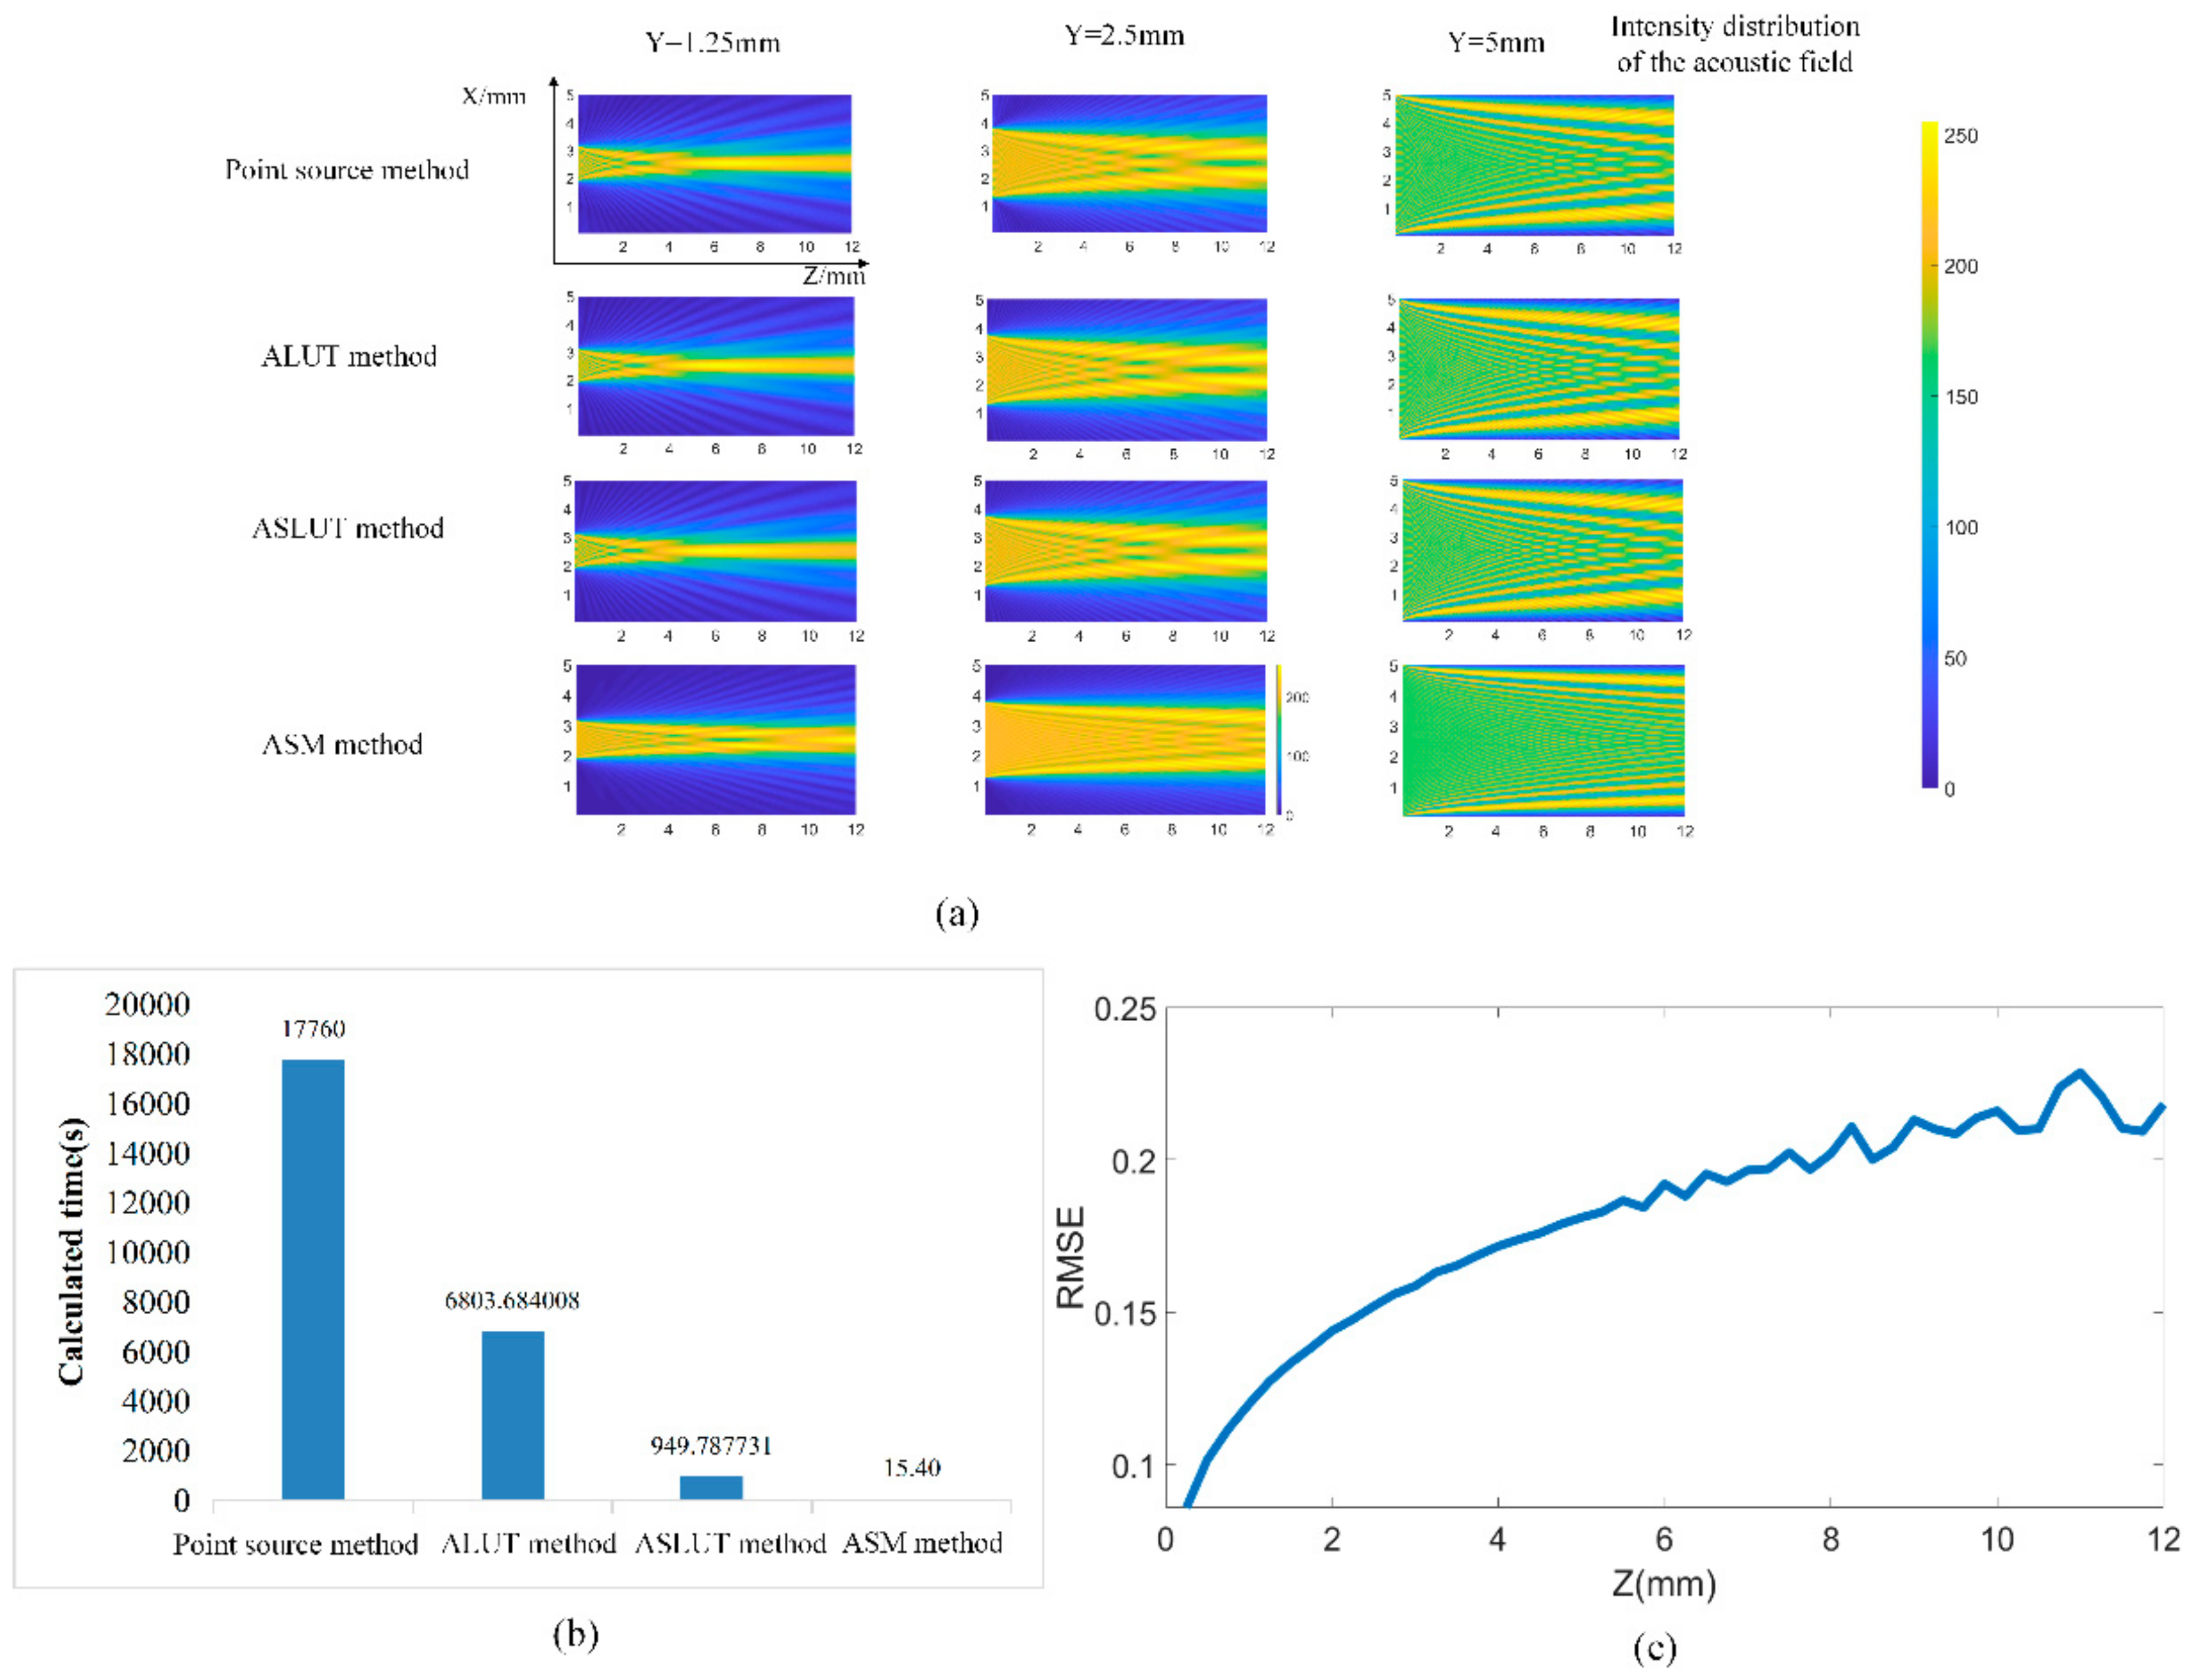
In order to demonstrate the acceleration effect of the ALUT and ASLUT methods for point source superposition calculations, the calculation times and acoustic field results of the three methods are presented as shown in Figure 7a. the ASM is also included in the comparison as a well-known method for acoustic field calculations. As shown in Figure 7b, the calculation time of the acoustic field of the point source method is 17,760 s, and the calculation time of the ALUT method is 6803.68 s, which is around one third of the point source method. The calculation time of the ASLUT method is only 949.79 s, which is about one eighteenth of the point source method. The ASM took the least time, only 15.40 s. However, the root-mean-square error of the calculated results of the angular spectrum method and the point source method increased with the propagation distance as shown in Figure 7c, which confirms that the ASM is limited by the propagation distance. The ALUT method and ASLUT method are acceleration algorithms based on point-source method. Moreover, their calculation results are the same as those obtained using the point-source method.
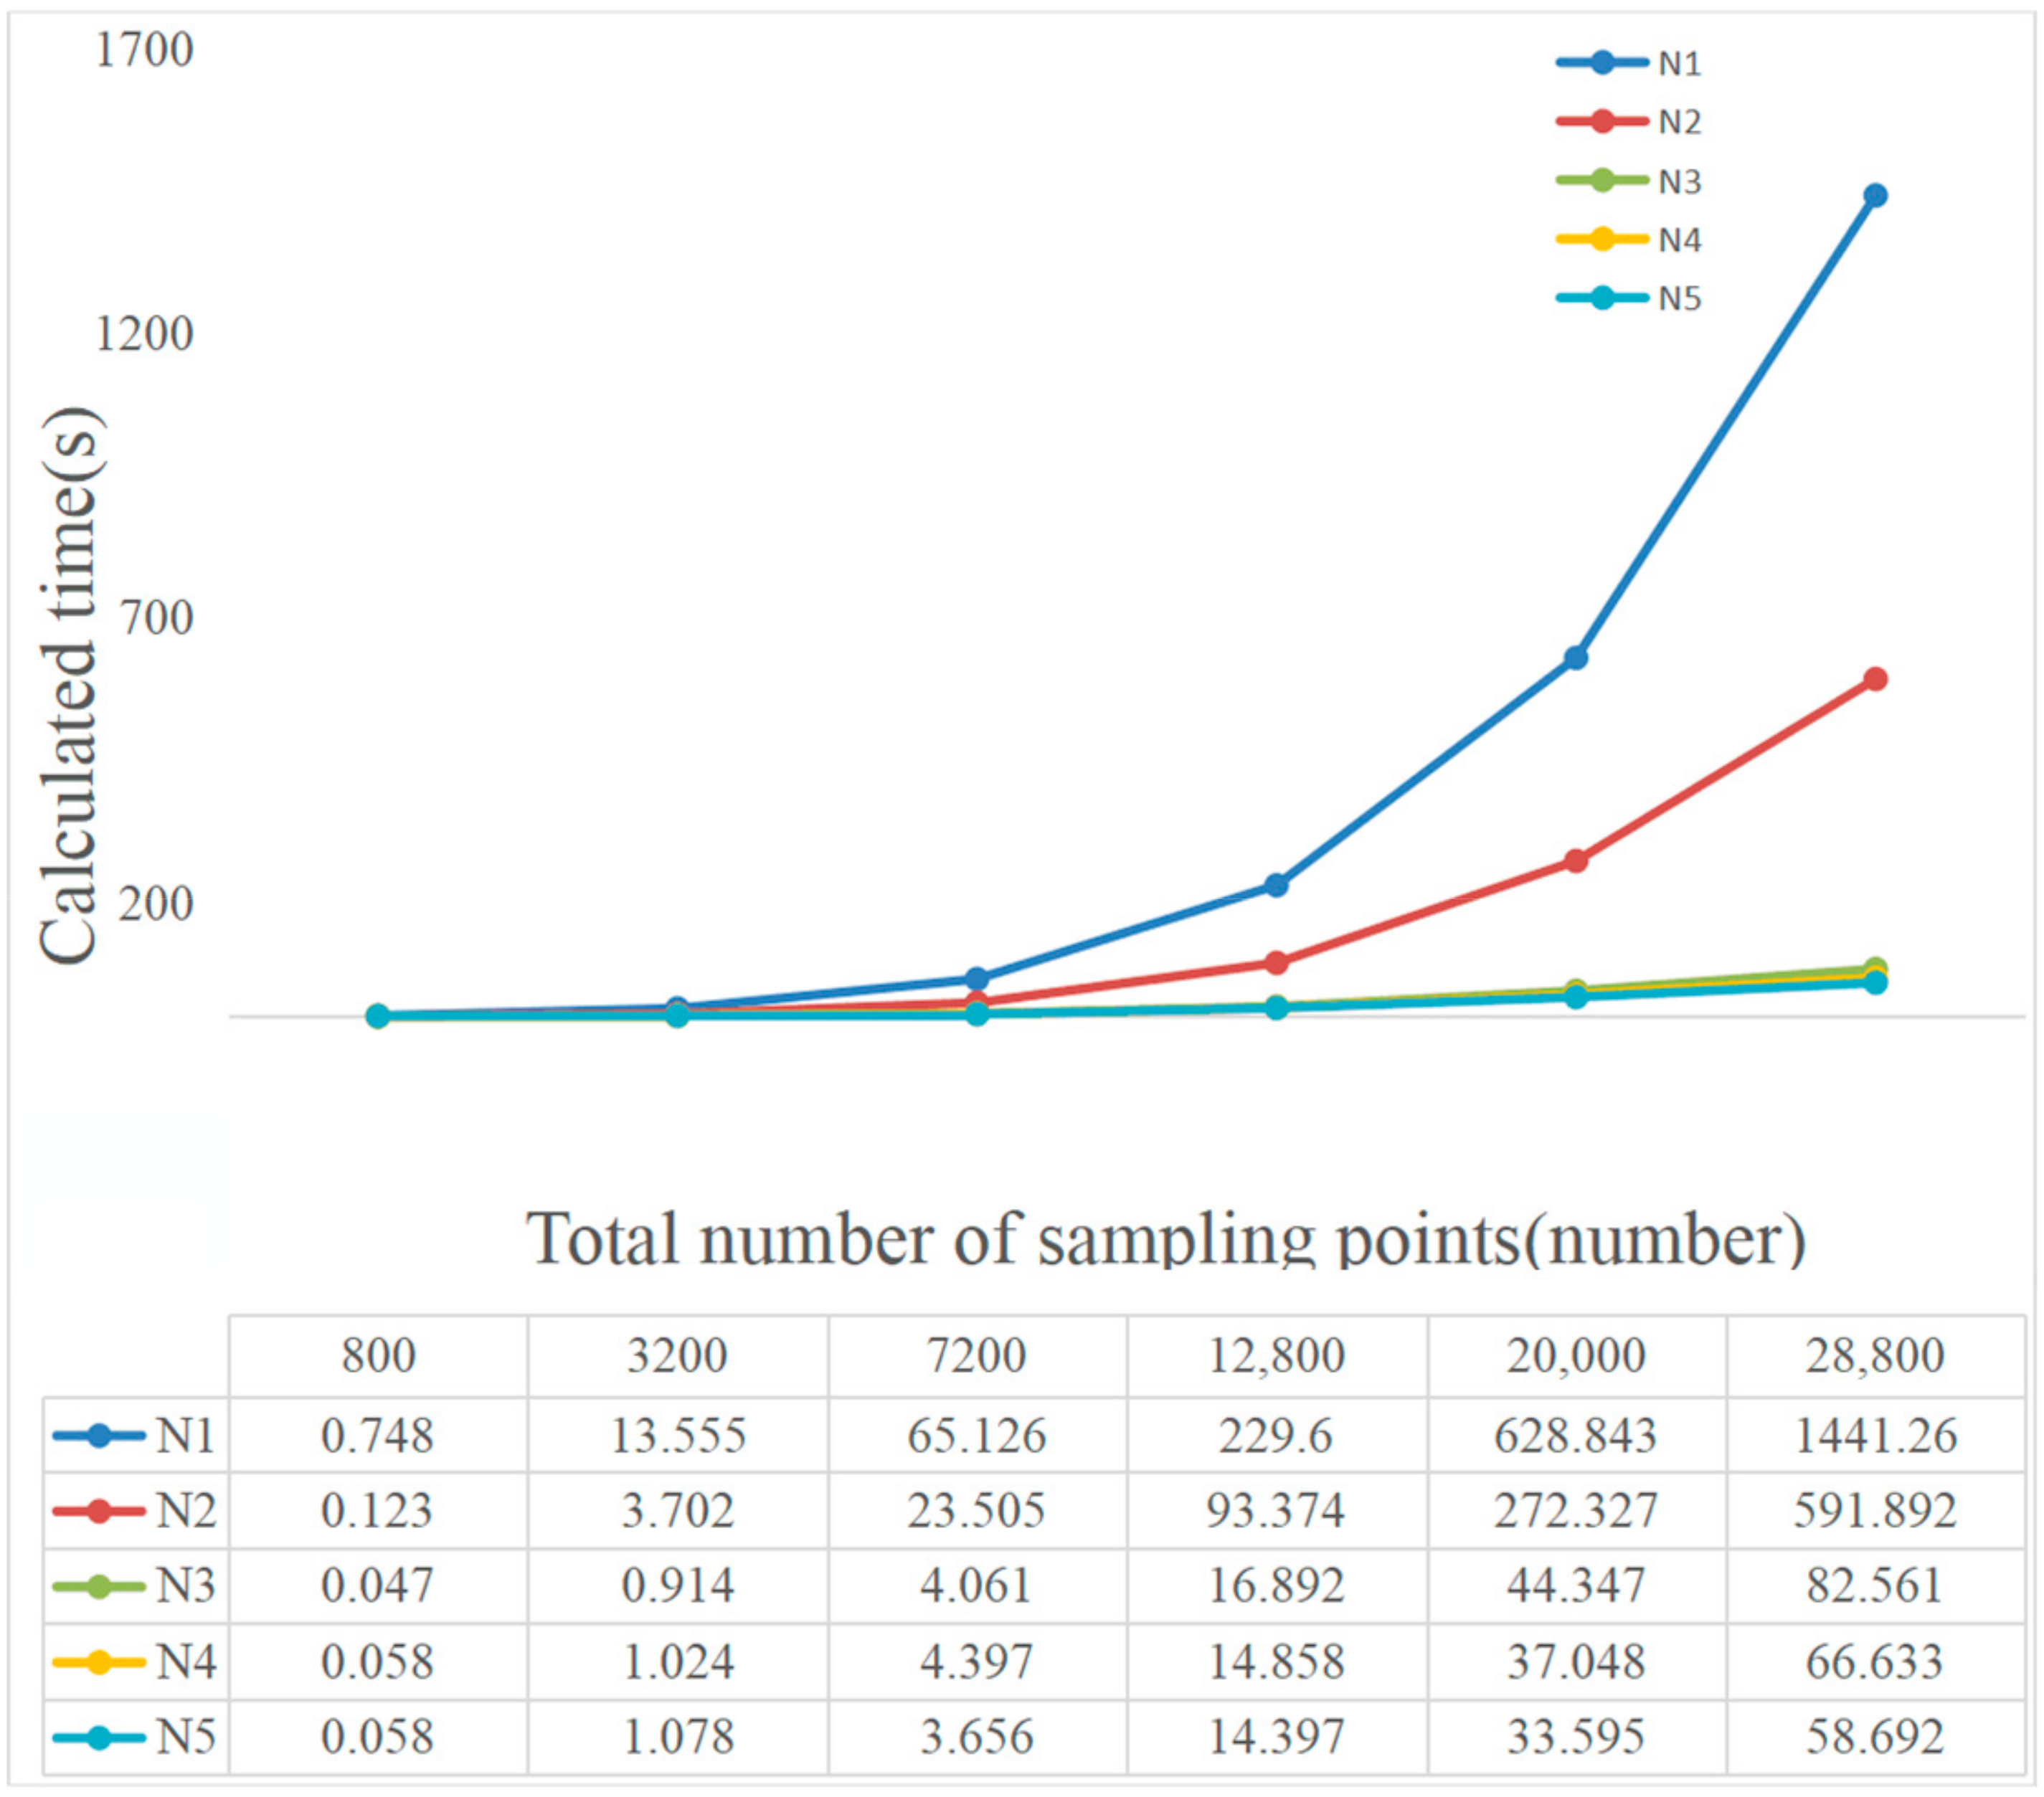
To test the applicability of implementing the sub-region lookup table method under different computational volumes, a comparison was made between five different algorithms: point source method (labeled N1), ALUT method (labeled N2), ASLUT method which stored a single point source and 3 × 3 point source array (labeled N3), ASLUT method which stores a single point source and 3 × 3, 5 × 5 point source arrays (labeled N4), and ASLUT method which stores a single point source and 3 × 3, 5 × 5, 7 × 7 point source arrays (labeled N5).
As the planar radiation source expands in the two-dimensional direction, the increase in computation time increases rapidly with the number of sampling points as shown in Figure 8. The LUT method significantly reduces the computation time, especially with a large number of sampling points. and the sub-region lookup table method further drastically reduces the time. According to the trend, it can be seen that the proposed method will be more significant as the sampling spacing decreases and the number of sampling points becomes larger. It is worth discussing the trade-off between the storage size of the lookup table and the computation time. The advantage of the ALUT method is that it requires a smaller lookup table to be stored, while the advantage of the ASLUT method is that it takes less time to compute.
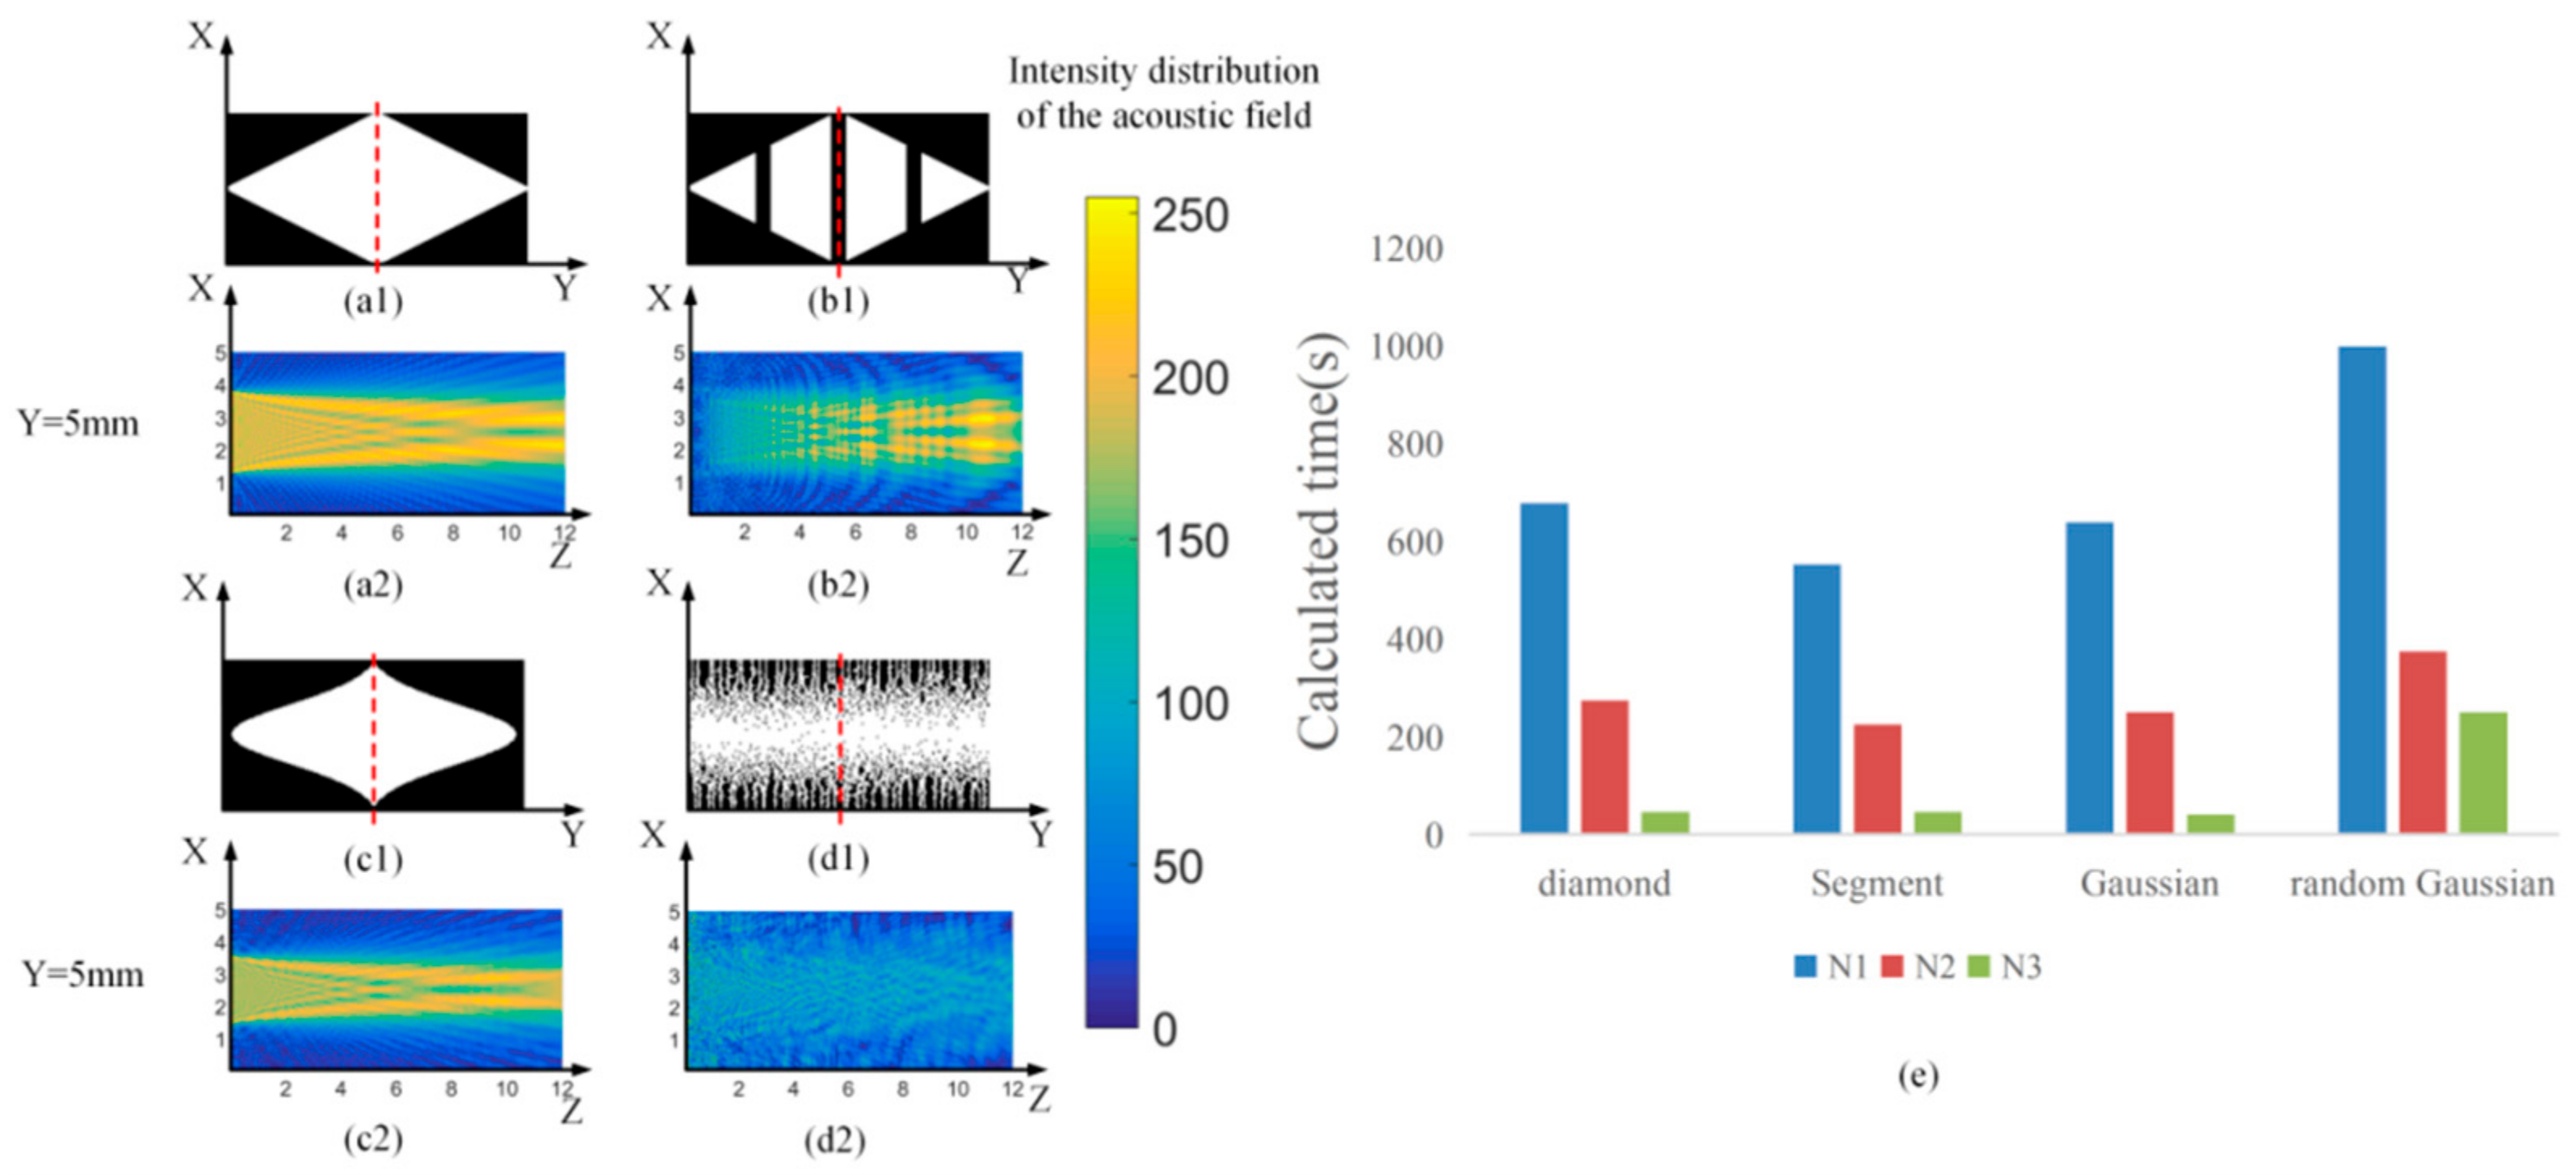
To verify the effectiveness of these two methods for planar radiation sources in practical applications, the point source method, the ALUT method and the ASLUT method are calculated for four different radiation sources. These four sources of radiation are applied in their respective fields. The diamond-shaped and Gaussian-shaped ultrasonic transducers are applied in acousto-optic tunable filters [6]. Ultrasonic transducers with random Gaussian distribution are an improvement of Gaussian-shaped transducers [37]. Segmented transducers are used in acousto-optical devices with large bandwidth requirements and phased arrays [38,39]. Except for the shape of the transducer, the conditions were the same as in the first experiment. As shown in Figure 9, the ASLUT which stores a single point source and 3 × 3 point source array (labeled N3) takes the shortest time to calculate, the ALUT method (labeled N2) takes the next shortest time and the point source method (labeled N1) is the slowest. This result is consistent with the theoretical ranking of the three methods of calculating time. It can be seen that any shape of planar radiation source can be reduced by the ALUT and ASLUT methods. It is worth noting that the greater the number of sub-regions that can be separated, the more significant the acceleration effect of the ASLUT method.
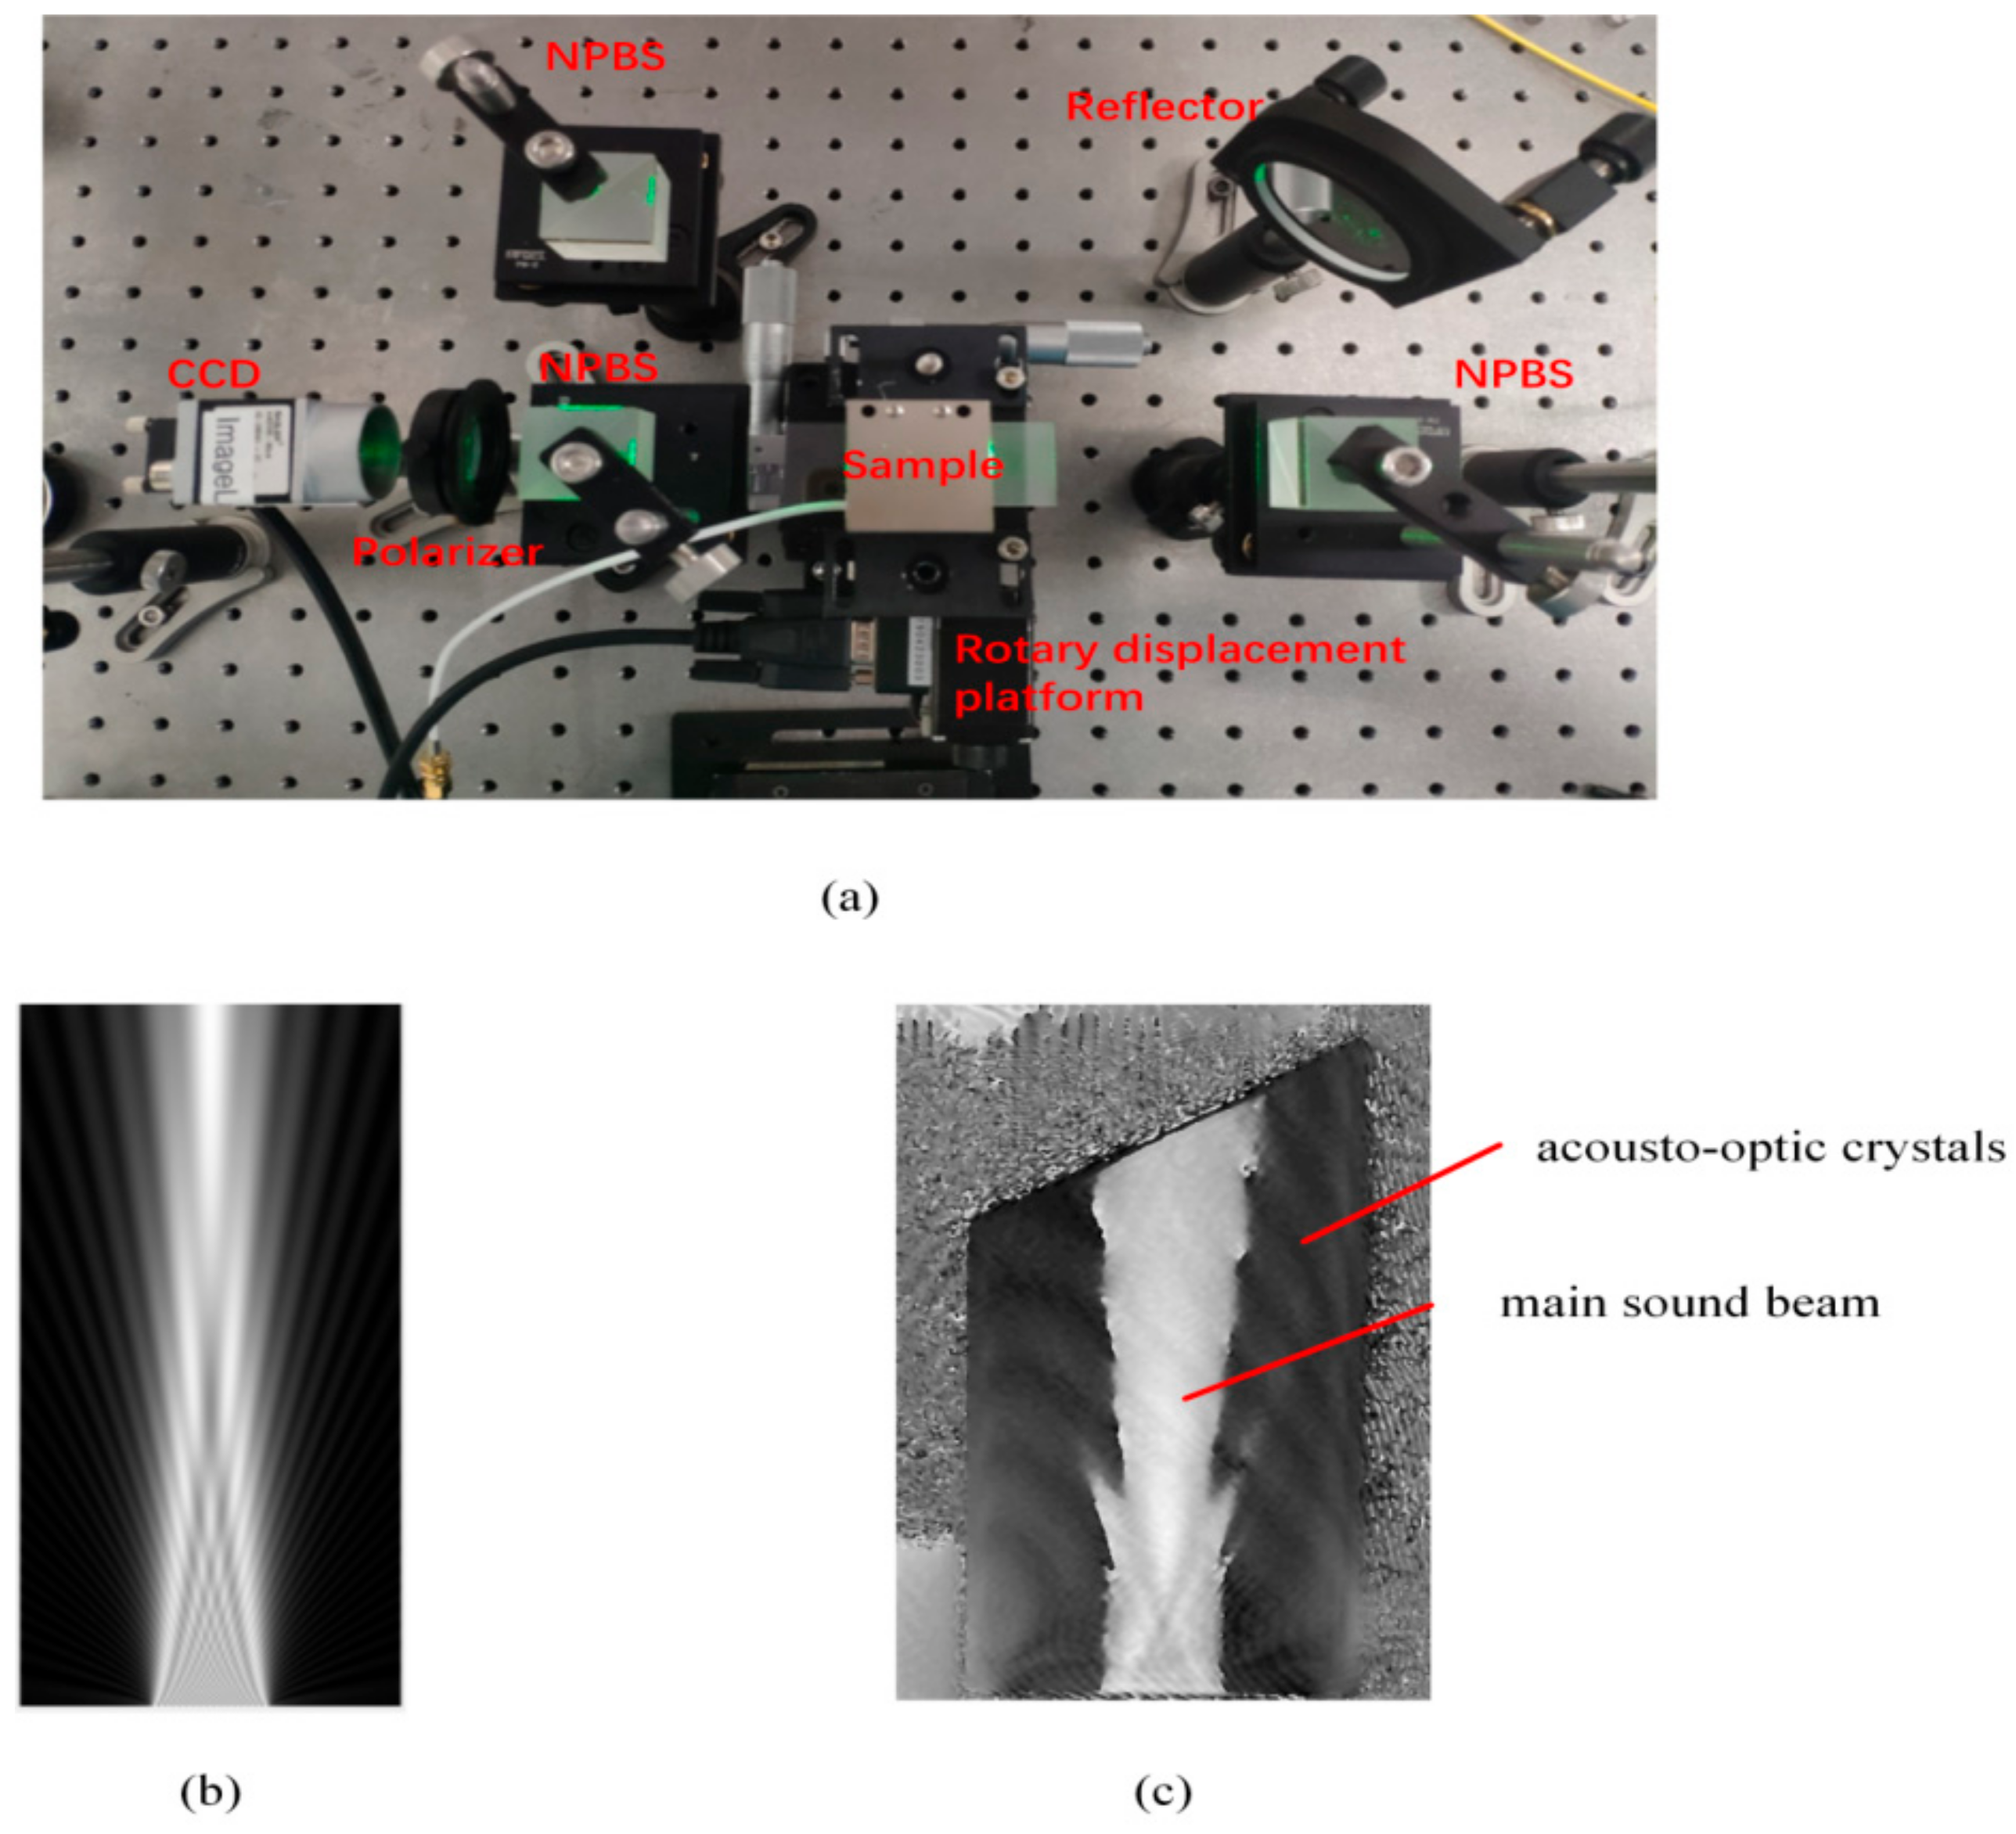
Finally, the internal acoustic field of the acousto-optic modulator with rectangular electrodes was tested using a digital holographic interferometer and compared with simulation results to verify the computational accuracy of the proposed algorithms. The length and width of the electrodes are 29 mm and 1.5 mm respectively. The propagation distance in the simulation is 12 mm. The propagation distance of the acoustic waves in the real object is slightly shorter and the remaining acoustic waves are deflected by the wedge structure, which does not affect the waveform of the main beam. The rest of the conditions remain the same as in the previous simulation.
As shown in Figure 10, the simulation results of the acoustic field distribution after superimposition along the length direction (Y-axis) are approximately the same as those measured by holographic interferometry along the same direction. The results demonstrate that our proposed method can be utilized by industries involved in planar radiation sources which contributes to accurate calculations and reducing time costs.

4. Discussion

The point source method is a formula for calculating the acoustic field of a planar source placed on an infinitely large rigid baffle and is one of the numerical methods of the Rayleigh integral. Any arbitrarily shaped radiating surface can be calculated by the point source method. Most planar radiating surfaces satisfy the condition that the radiating surface size is much larger than the wavelength. So, the point source method can be used to calculate the acoustic field. In this paper, the ALUT method is proposed for accelerating point source method calculations. The ALUT method only pre-calculates the distance between the sampling point in the radiation plane and the spatial sampling point which is used repeatedly in the calculation. Thus, the ALUT method has the same scope of application as the point source method and does not have conditional constraints on the amplitude and phase of the points on the sound source plane. Not all ultrasound transducers are composed of homogeneous materials, resulting in different amplitudes and phases at the sampling points on the source plane. The ALUT method can achieve fast calculations for ultrasonic transducers composed of non-homogeneous media. Moreover, the laser vibrometer can help to obtain the amplitude and phase of the sound source surface. The ASLUT method improves on the ALUT method by combining adjacent discrete points, thus reducing the number of calculations. Sampling points located in the same sub-region must have the same amplitude and phase. If the amplitude and phase of any adjacent points are different, the ASLUT method will take the same computational speed as the ALUT method. The ultrasonic transducer is a typical example of a planar radiating surface. The piezoelectric crystals in the ultrasonic transducer vibrate synchronously under the control of an AC voltage. Therefore, the amplitude and phase of any point on the ultrasonic transducer can be considered to be the same. The ASLUT method is able to significantly reduce the calculation time.

5. Conclusions

In this paper, we proposed two fast algorithms based on LUT method to calculate the acoustic field distribution of a planar ultrasound transducer. The numerical calculation of the Rayleigh integral obtains the acoustic field distribution by discretizing the source surface into a collection of source points and superimposing the acoustic field of each point. In the ALUT algorithm, the sound source surface is discretized as a set of source points. The distance relationship between the point source and each sampling point in space is calculated in advance and compressed into a table. In the process of calculating the acoustic field, the distance between each source point and the sampling points is obtained by looking up table, without the need for point-to-point calculations. Thus, the calculation time is reduced. Based on the fact that some neighboring source points in the ultrasound transducer have the same amplitude and phase, the ASLUT method combines these source points into sub-regions and calculates a table of sub-region distances from the sampling points. The reduction in the number of calculations further reduce the time. Simulation and experiments are used to demonstrate the reliability of the proposed algorithm. Compared to the point source superposition method, both the ALUT and ASLUT methods take significantly less time to calculate ultrasound transducers of different shapes. The time for calculating the acoustic field by the ALUT method can be reduced to one third of that by the point source superposition method, and the ASLUT method further reduces the time to one eighteenth of that by the point source method. In addition, the digital holographic interference light path measures the internal acoustic field of a rectangular transducer-based acousto-optical device. The measured acoustic field distribution is compared with the calculated results of the proposed methods, which verify the practicality of both calculation methods. Moreover, the results measured by laser vibrometer will be considered for comparison with computational results in future work. This work achieves a fast and accurate calculation of the acoustic field generated by the ultrasonic transducer, which can be used in NDT, HIFU, and other fields requiring optimization of the acoustic field.

Author Contributions

Conceptualization: J.W., Z.W. and G.L; methodology, J.W.; software, K.T. and L.L.; validation, K.T., L.L, and S.W.; formal analysis, K.T.; writing—original draft preparation, J.W.; writing—review and editing, Z.W. and G.L.; funding acquisition, Z.W. and G.L. All authors have read and agreed to the published version of the manuscript.

Funding

This work was supported by the National Engineering Research Center for Optoelectronic Crystalline Materials (OCM-2020-03) and the National Key Research and Development Program of China (2021YFB3602500).

Institutional Review Board Statement

Not applicable.

Informed Consent Statement

Not applicable.

Data Availability Statement

Not applicable.

Conflicts of Interest

The authors declare no conflict of interest.

References

  1. Qiu, Z.; Lu, Y.; Qiu, Z. Review of Ultrasonic Ranging Methods and Their Current Challenges. Micromachines 2022, 13, 520. [Google Scholar] [CrossRef] [PubMed]
  2. Lagler, D.; Anzinger, S.; Pfann, E.; Fusco, A.; Bretthauer, C.; Huemer, M. A single ultrasonic transducer fast and robust short-range distance measurement method. In Proceedings of the 2019 IEEE International Ultrasonics Symposium (IUS), Glasgow, UK, 6–9 October 2019; pp. 2533–2536. [Google Scholar]
  3. Kim, P.; Kang, J.; Song, T.K. A Pseudo-Dynamic Delay Calculation Using Optimal Zone Segmentation for Ultra-Compact Ultrasound Imaging Systems. Electronics 2019, 8, 242. [Google Scholar] [CrossRef] [Green Version]
  4. Cook, B.D.; Cavanagh, E.; Dardy, H.D. A numerical procedure for calculating the integrated acoustooptic effect. IEEE Trans. Sonics Ultrason. 1980, 27, 202–207. [Google Scholar] [CrossRef]
  5. Wu, J.; Xu, Z.; Li, K.; Lv, G.; Li, X.; Wang, C. Analysis of acoustic near field characteristics in acousto-optic modulator. IEEE Photonics Technol. Lett. 2021, 33, 201–204. [Google Scholar] [CrossRef]
  6. Khokhlova, V.A.; Shmeleva, V.A.; Gavrilov, L.R. Infrared mapping of ultrasound fields generated by medical transducers: Feasibility of determining absolute intensity levels. J. Acoust. Soc. Am. 2013, 134, 1586–1597. [Google Scholar] [CrossRef] [PubMed] [Green Version]
  7. Laude, V.; Beugnot, J.C.; Sylvestre, T. Special issue on Brillouin scattering and optomechanics. Appl. Sci. 2019, 9, 3745. [Google Scholar] [CrossRef] [Green Version]
  8. Li, J.; Piwakowski, B. A time-domain model and experimental validation of the acoustic field radiated by air-coupled transducers. Ultrasonics 2018, 82, 114–129. [Google Scholar] [CrossRef]
  9. Wu, J.; Xu, Z.; Ji, K.; Lv, G.; Wang, C.; Li, X. Transducer design of acousto-optic modulators. In Proceedings of the AOPC 2020: Advanced Laser Technology and Application, Beijing, China, 5 November 2020; Volume 11562, pp. 272–280. [Google Scholar]
  10. Rayleigh, L. Theory of Sound; Dover: New York, NY, USA, 1965; Volume II, pp. 162–169. [Google Scholar]
  11. Morse, P.M.; Ingard, U.K. Theoretical Acoustics; McGraw-Hill: New York, NY, USA, 1968. [Google Scholar]
  12. Sun, Q.; Klaseboer, E.; Khoo, B.C.; Chan, D.Y.C. Boundary regularized integral equation formulation of the Helmholtz equation in acoustics. R. Soc. Open Sci. 2015, 2, 140520. [Google Scholar] [CrossRef]
  13. Antoine, X.; Darbas, M. Generalized Combined Field Integral Equations for the Iterative Solution of the Three-Dimensional Helmholtz Equation. ESAIM Math. Model. Numer. Anal. 2007, 41, 147–167. [Google Scholar] [CrossRef] [Green Version]
  14. Kim, H.J.; Schmerr, L.W., Jr.; Sedov, A. Generation of the basis sets for multi-Gaussian ultrasonic beam models—An overview. J. Acoust. Soc. Am. 2006, 119, 1971–1978. [Google Scholar] [CrossRef]
  15. Zhao, X.; Gang, T. Nonparaxial multi-Gaussian beam models and measurement models for phased array transducers. Ultrasonics 2009, 49, 126–130. [Google Scholar] [CrossRef]
  16. Kirkup, S.M. Computational solution of the acoustic field surrounding a baffled panel by the Rayleigh integral method. Appl. Math. Model. 1994, 18, 403–407. [Google Scholar] [CrossRef]
  17. Lee, S. The use of equivalent source method in computational acoustics. J. Comput. Acoust. 2017, 25, 1630001. [Google Scholar] [CrossRef] [Green Version]
  18. Koopmann, G.H.; Song, L.; Fahnline, J.B. A method for computing acoustic fields based on the principle of wave superposition. J. Acoust. Soc. Am. 1989, 86, 2433–2438. [Google Scholar] [CrossRef]
  19. Zarnekow, M.; Ihlenburg, F.; Grätsch, T. An Efficient Approach to the Simulation of Acoustic Radiation from Large Structures with FEM. J. Theor. Comput. Acoust. 2020, 28, 1950019. [Google Scholar] [CrossRef]
  20. Assaad, J.; Hladky, A.C.; Cugnet, B. Application of the FEM and the BEM to compute the field of a transducer mounted in a rigid baffle (3D case). Ultrasonics 2004, 42, 443–446. [Google Scholar] [CrossRef]
  21. Williams, E.G.; Maynard, J.D. Numerical evaluation of the Rayleigh integral for planar radiators using the FFT. J. Acoust. Soc. Am. 1982, 72, 2020–2030. [Google Scholar] [CrossRef]
  22. Stepanishen, P.R.; Benjamin, K.C. Forward and backward projection of acoustic fields using FFT methods. J. Acoust. Soc. Am. 1982, 71, 803–811. [Google Scholar] [CrossRef]
  23. Higgins, F.P.; Norton, S.J.; Linzer, M. Optical interferometric visualization and computerized reconstruction of ultrasonic fields. J. Acoust. Soc. Am. 1980, 68, 1169–1176. [Google Scholar] [CrossRef]
  24. Xu, Q.; Wang, H. Sound Field Modeling Method and Key Imaging Technology of an Ultrasonic Phased Array: A Review. Appl. Sci. 2022, 12, 7962. [Google Scholar] [CrossRef]
  25. Zeng, X.; Mcgough, R.J. Evaluation of Angular Spectrum Approach for Simulations of Spherically Focused Ultrasound Phased Arrays. In Proceedings of the IEEE International Conference on Electro/Information Technology, East Lansing, MI, USA, 7–10 May 2006. [Google Scholar]
  26. Shimobaba, T.; Matsushima, K.; Kakue, T.; Masuda, N.; Ito, T. Scaled angular spectrum method. Opt. Lett. 2012, 37, 4128–4130. [Google Scholar] [CrossRef] [PubMed]
  27. Duran, A.L.; Sato, A.K.; Silva, A.M., Jr.; Franco, E.E.; Buiochi, F.; Martins, T.C.; Adamowski, J.C.; Tsuzuki, M.S.G. Gpu accelerated acoustic field determination for a continuously excited circular ultrasonic transducer. IFAC-Pap. 2020, 53, 10480–10484. [Google Scholar] [CrossRef]
  28. Shimobaba, T.; Nakayama, H.; Masuda, N.; Ito, T. Rapid calculation algorithm of Fresnel computer-generated-hologram using look-up table and wavefront-recording plane methods for three-dimensional display. Opt. Express 2010, 18, 19504–19509. [Google Scholar] [CrossRef] [PubMed]
  29. Gao, C.; Liu, J.; Li, X.; Xue, G.; Jia, J.; Wang, Y. Accurate compressed look up table method for CGH in 3D holographic display. Opt. Express 2015, 23, 33194–33204. [Google Scholar] [CrossRef] [PubMed]
  30. Völz, U. Four-dimensional directivity pattern for fast calculation of the sound field of a phased array transducer. In Proceedings of the 2012 IEEE International Ultrasonics Symposium, Dresden, Germany, 7–10 October 2012; pp. 1035–1038. [Google Scholar]
  31. Lean, H.Q.; Zhou, Y. Acoustic field of phased-array ultrasound transducer with the focus/foci shifting. J. Med. Biol. Eng. 2019, 39, 919–931. [Google Scholar] [CrossRef]
  32. Onose, L.; Moraru, L.; Nicolae, M.C. Simulation of Acoustic Fields from Medical Ultrasound Transducers. Rom. J. Biophys. 2009, 19, 277–283. [Google Scholar]
  33. Goutzoulis, A.P. Design and Fabrication of Acousto-Optic Devices; CRC Press: Boca Raton, FL, USA, 2021. [Google Scholar]
  34. Sapozhnikov, O.A.; Tsysar, S.A.; Khokhlova, V.A.; Kreider, w. Acoustic holography as a metrological tool for characterizing medical ultrasound sources and fields. J. Acoust. Soc. Am. 2015, 138, 1515–1532. [Google Scholar] [CrossRef] [Green Version]
  35. Otani, M.; Watabe, H.; Tsuchiya, T.; Iwaya, Y. Numerical examination of effects of discretization spacing on accuracy of sound field reproduction. Acoust. Sci. Technol. 2015, 36, 362–365. [Google Scholar] [CrossRef] [Green Version]
  36. Merthe, D.J. A Sampling Theorem for Computational Diffraction. arXiv 2013, arXiv:1301.6814. [Google Scholar]
  37. Pannell, C.N.; Ward, J.D.; Wachman, E.S.; Zhang, B.G.; Reed, M.K. A high-performance passband-agile hyperspectral imager using a large aperture acousto-optic tuneable filter. In Photonic Instrumentation Engineering II; International Society for Optics and Photonics: San Francisco, CA, USA, 2015; Volume 9369, p. 936906. [Google Scholar]
  38. Yuanfeng, Z.; Jisheng, Y. Optimization and design of acousto-optic tunable filters. J. Optoelectron. Adv. Mater. 2005, 7, 1599–1604. [Google Scholar]
  39. Voloshin, A.; Balakshy, V.; Mantsevich, S. Unpolarized light diffraction in an acoustic field created by a phased array transducer. In Proceedings of the 2016 IEEE International Ultrasonics Symposium (IUS), Tours, France, 18–21 September 2016; pp. 1–4. [Google Scholar]
Figure 1. Procedure for computing the numerical solution of the Rayleigh integral.
Applsci 12 08459 g001
Figure 2. (a) Layered calculation of sound field distribution in 3D space. (b) The correspondence between the sound source layer and the layers in the space. (c) The correspondence between the sound source point and data in the nth table.
Applsci 12 08459 g002
Figure 3. Area division of point and point arrays for arbitrarily shaped electrodes.
Applsci 12 08459 g003
Figure 4. Comparison of lookup tables for point source and point source arrays.
Applsci 12 08459 g004
Figure 5. The flow chart of the ASLUT method.
Applsci 12 08459 g005
Figure 6. (a) Structure of acoustic-optic modulator. (b) The electrode shape of the Ultrasonic transducer.
Applsci 12 08459 g006
Figure 7. (a) Comparison of the acoustic field distribution calculated by the four methods. (b) Comparison of the time taken to calculate the acoustic field distribution by the four methods. (c) Root mean square error of angular spectrum method and point source method along the propagation direction.
Applsci 12 08459 g007
Figure 8. Comparison of the time spent by the point source method, the traditional lookup table method, and the sub-region lookup table method (three forms) for different computational volumes.
Applsci 12 08459 g008
Figure 9. (a) Diamond-shaped transducer and acoustic intensity interface at Y = 5 mm. (b) Segmented transducer and acoustic intensity interface at Y = 5 mm. (c) Gaussian-shaped transducer and acoustic intensity interface at Y = 5 mm. (d) random Gaussian-shaped transducer and acoustic intensity interface at Y = 5 mm. (e) comparison of three methods to calculate the time of different shapes of electrodes.
Applsci 12 08459 g009
Figure 10. (a) The optical path of digital holographic interference (b) The simulation results of acoustic field calculated by ASLUT method (c) The measurement results of digital holographic interference experiments.
Applsci 12 08459 g010
Publisher’s Note: MDPI stays neutral with regard to jurisdictional claims in published maps and institutional affiliations.