Article

Simulation Analysis of Cement-Stabilized Macadam Compaction Processing Based on the Discrete Element Method

1
College of Transportation, Jilin University, Changchun 130025, China
2
CCCC Infrastructure Maintenance Group Co., Ltd., Beijing 100191, China
3
Highway College, Chang’an University, Xi’an 710064, China
*
Author to whom correspondence should be addressed.
Appl. Sci. 2022, 12(17), 8505; https://doi.org/10.3390/app12178505
Submission received: 18 July 2022 / Revised: 19 August 2022 / Accepted: 20 August 2022 / Published: 25 August 2022

Abstract

:
The mechanical properties of cement-stabilized macadam (CSM) base mixture are closely related to its forming process. Although the present study investigates the macroscopic effects of molding on cement-stabilized macadam, mesoscopic research analyses of the internal composition’s structural characteristics and change trends after molding lack sufficient intuitiveness. In this study, we built three-dimensional models of cement-stabilized macadam for heavy compaction molding and vibration molding tests based on the discrete element theory. The effects of different molding methods on cement-stabilized macadam’s internal structure were revealed from the mesoscopic perspective by tracking changes in porosity, coordination number, force chain development and internal particle position during the simulation molding process. The simulation results show that (1) the first 10 compactions had a significant influence on the molding effect, and specimens’ height and porosity decreased the fastest; (2) after the simulation experiments, the average coordination number of particles in the vibration molding specimen was 2.3% higher than that of the heavy compaction molding specimen; (3) after the simulation experiments, the vibration molding specimen’s porosity was 2.5% lower than that of the heavy compaction molding specimen; and (4) the vibration molding specimen’s particle distribution was more uniform, whereas the heavy compaction molding specimen’s particle distribution was dense at the top and sparse at the bottom. Overall, the effect of vibration molding is superior to that of heavy compaction molding.

1. Introduction

Cement-stabilized macadam (CSM) remains the primary material used for asphalt pavement subgrade in China due to its early strength, stability, and high integrity; it is widely used in the construction of high-grade highways in China. Extensive attention has been paid to CSM’s performance regarding its compressive strength [1,2], flexural tensile strength [3,4], resilient modulus [5,6], durability, and shrinkage behavior [7,8], which are closely related to the structural design and performance evaluation of semi-rigid base asphalt pavements. As a particle-based composite material, CSM’s performance is directly influenced by composition structure and dense homogeneity [9]. Therefore, CSM’s molding method is highly significant with regard to improving CSM’s service performance.
The structure and properties of cement-stabilized macadam are closely related to its molding method [10]. Current research regarding CSM forming methods remains based on comparative analysis of moisture content and compactness data from indoor tests. The results show that the physical and structural properties of CSM mixes formed using vibration are significantly better than those of mixes formed using the static pressure method [11,12,13,14,15]. Studies regarding the effect of CSM forming based on discrete element theory primarily focus on vibration molding [16]; less research has been conducted on compaction molding and comparison between the two. Donghai Liu et al. used the discrete element method to simulate the vibration molding process of two-layer compacted concrete specimens, and established the discrete element model, contact model, and mesoscopic parameters of compacted concrete using the particle flow code. The embedding and movement of inter-layer aggregates under different compaction forces were analysed in the discrete element model of two-layer specimens [17]. Fangyuan Gong et al. established a rotary compaction model of asphalt mixture by obtaining the displacement and rotation angles of coarse aggregates of different shapes in asphalt mixtures using discrete elements to analyze and simulate the movement characteristics of the aggregates [18]. Y.J. Jiang investigated the mechanical properties of CSM based on the quasi-static compaction method (QSCM) and vertical vibratory compaction method (VVCM), and obtained quantitative indices of the mechanical properties of VVCM-formed and QSCM-formed materials [19]. Guoping Qian studied the change characteristics of mesostructure in the compaction process of asphalt mixture by tracking the porosity and distribution of aggregate and asphalt mortar [20]. Mechtcherine et al. summarized three main issues in the discrete element method (DEM) simulation of concrete materials: materials (mortar and coarse aggregate), contact models, and fine-view structural parameters [21]. Xuan Zh et al. used the DEM to simulate the Marshall impact compaction (MIC) process and proposed a new index of the contact imbalance force of coarse aggregate particles. Tuanjie Wang built a three-dimensional discrete element model for surface compaction experiments on soil and stone mixes, explored the effects of experimental conditions and particle fine-scale parameters on compaction effects, and proposed porosity as a quantitative index to evaluate compaction effects in simulated tests [22].
At present, CSM is usually formed using the compaction molding (quasi-static compaction) or the vibration molding method, and it is generally believed that the vibration molding method is closer to the actual construction-measured CSM compactness [23]. Current research studies the molding effect from a meso perspective; however, the mesoscopic research and analysis of the interior composition structure’s characteristics and trends after molding are not sufficiently intuitive. This study examines the molding effect, porosity change, force chain development law, and internal particle movement processes of compaction molding and vibration molding by creating virtual CSM specimens, simulating CSM compaction molding tests, and using inversion to obtain meso-mechanical parameters. This study was based on particle flow numerical simulation technology and aimed to investigate the influence of compaction molding and vibration molding on the composition and structure of CSM at the meso level. This paper explains the influence of different molding processes on CSM’s internal composition and structure from the perspective of mesoscopic particle movement and interaction. It provides a reference for studying CSM’s mesoscopic compositional characteristics using discrete element software.

2. Raw Materials and Experimental Methods

2.1. Raw Material and Test Gradation

This study used Jidong No.425 ordinary silicate cement tested in accordance with ‘General Silicate Cement’ [24] for cement-stabilized macadam. Table 1 shows the technical indexes, all of which satisfied the ‘Construction Guidelines for Highway Base and Subbase’ requirements [25].
Aggregate used to prepare the cement-stabilized macadam base material came from Siping quarry. According to the relevant materials of the index provisions of the ‘Test Methods of Materials Stabilized with Inorganic Binders for Highway Engineering’ (JTG E42-2009) [26] regarding testing coarse and fine aggregates required for this study, our test results met the technical requirements; test results are shown in Table 2.
The test gradation of cement-stabilized macadam is shown in Table 3. The optimum moisture content of the mixture is 5% and the maximum dry density is 2.557 g/cm3 using the heavy standard compaction test. In this study, uniform design and multi-stage filling methods were used to comprehensively consider the maximum dry density and the minimum gradation attenuation according to continuous extrusion gradation optimization. The cement-stabilized macadam mixture was designed according to the skeleton dense structure.

2.2. Experimental Scheme

2.2.1. Experimental Scheme for Compaction Molding

According to the current test procedure, ‘Test Methods of Materials Stabilized with Inorganic Binders for Highway Engineering’ (JTG E51-2009), the maximum particle size of test aggregate is 25 mm, and the maximum shall not exceed 40 mm. The maximum particle size in the cement-stabilized macadam used in this study was 26.5 mm; as a result, the test method’s procedure C was used. The specimen was compacted in three layers, with 98 compactions per layer. The heavy compaction molding specimen was cylindrical; its diameter × height = 152 mm × 150 mm.

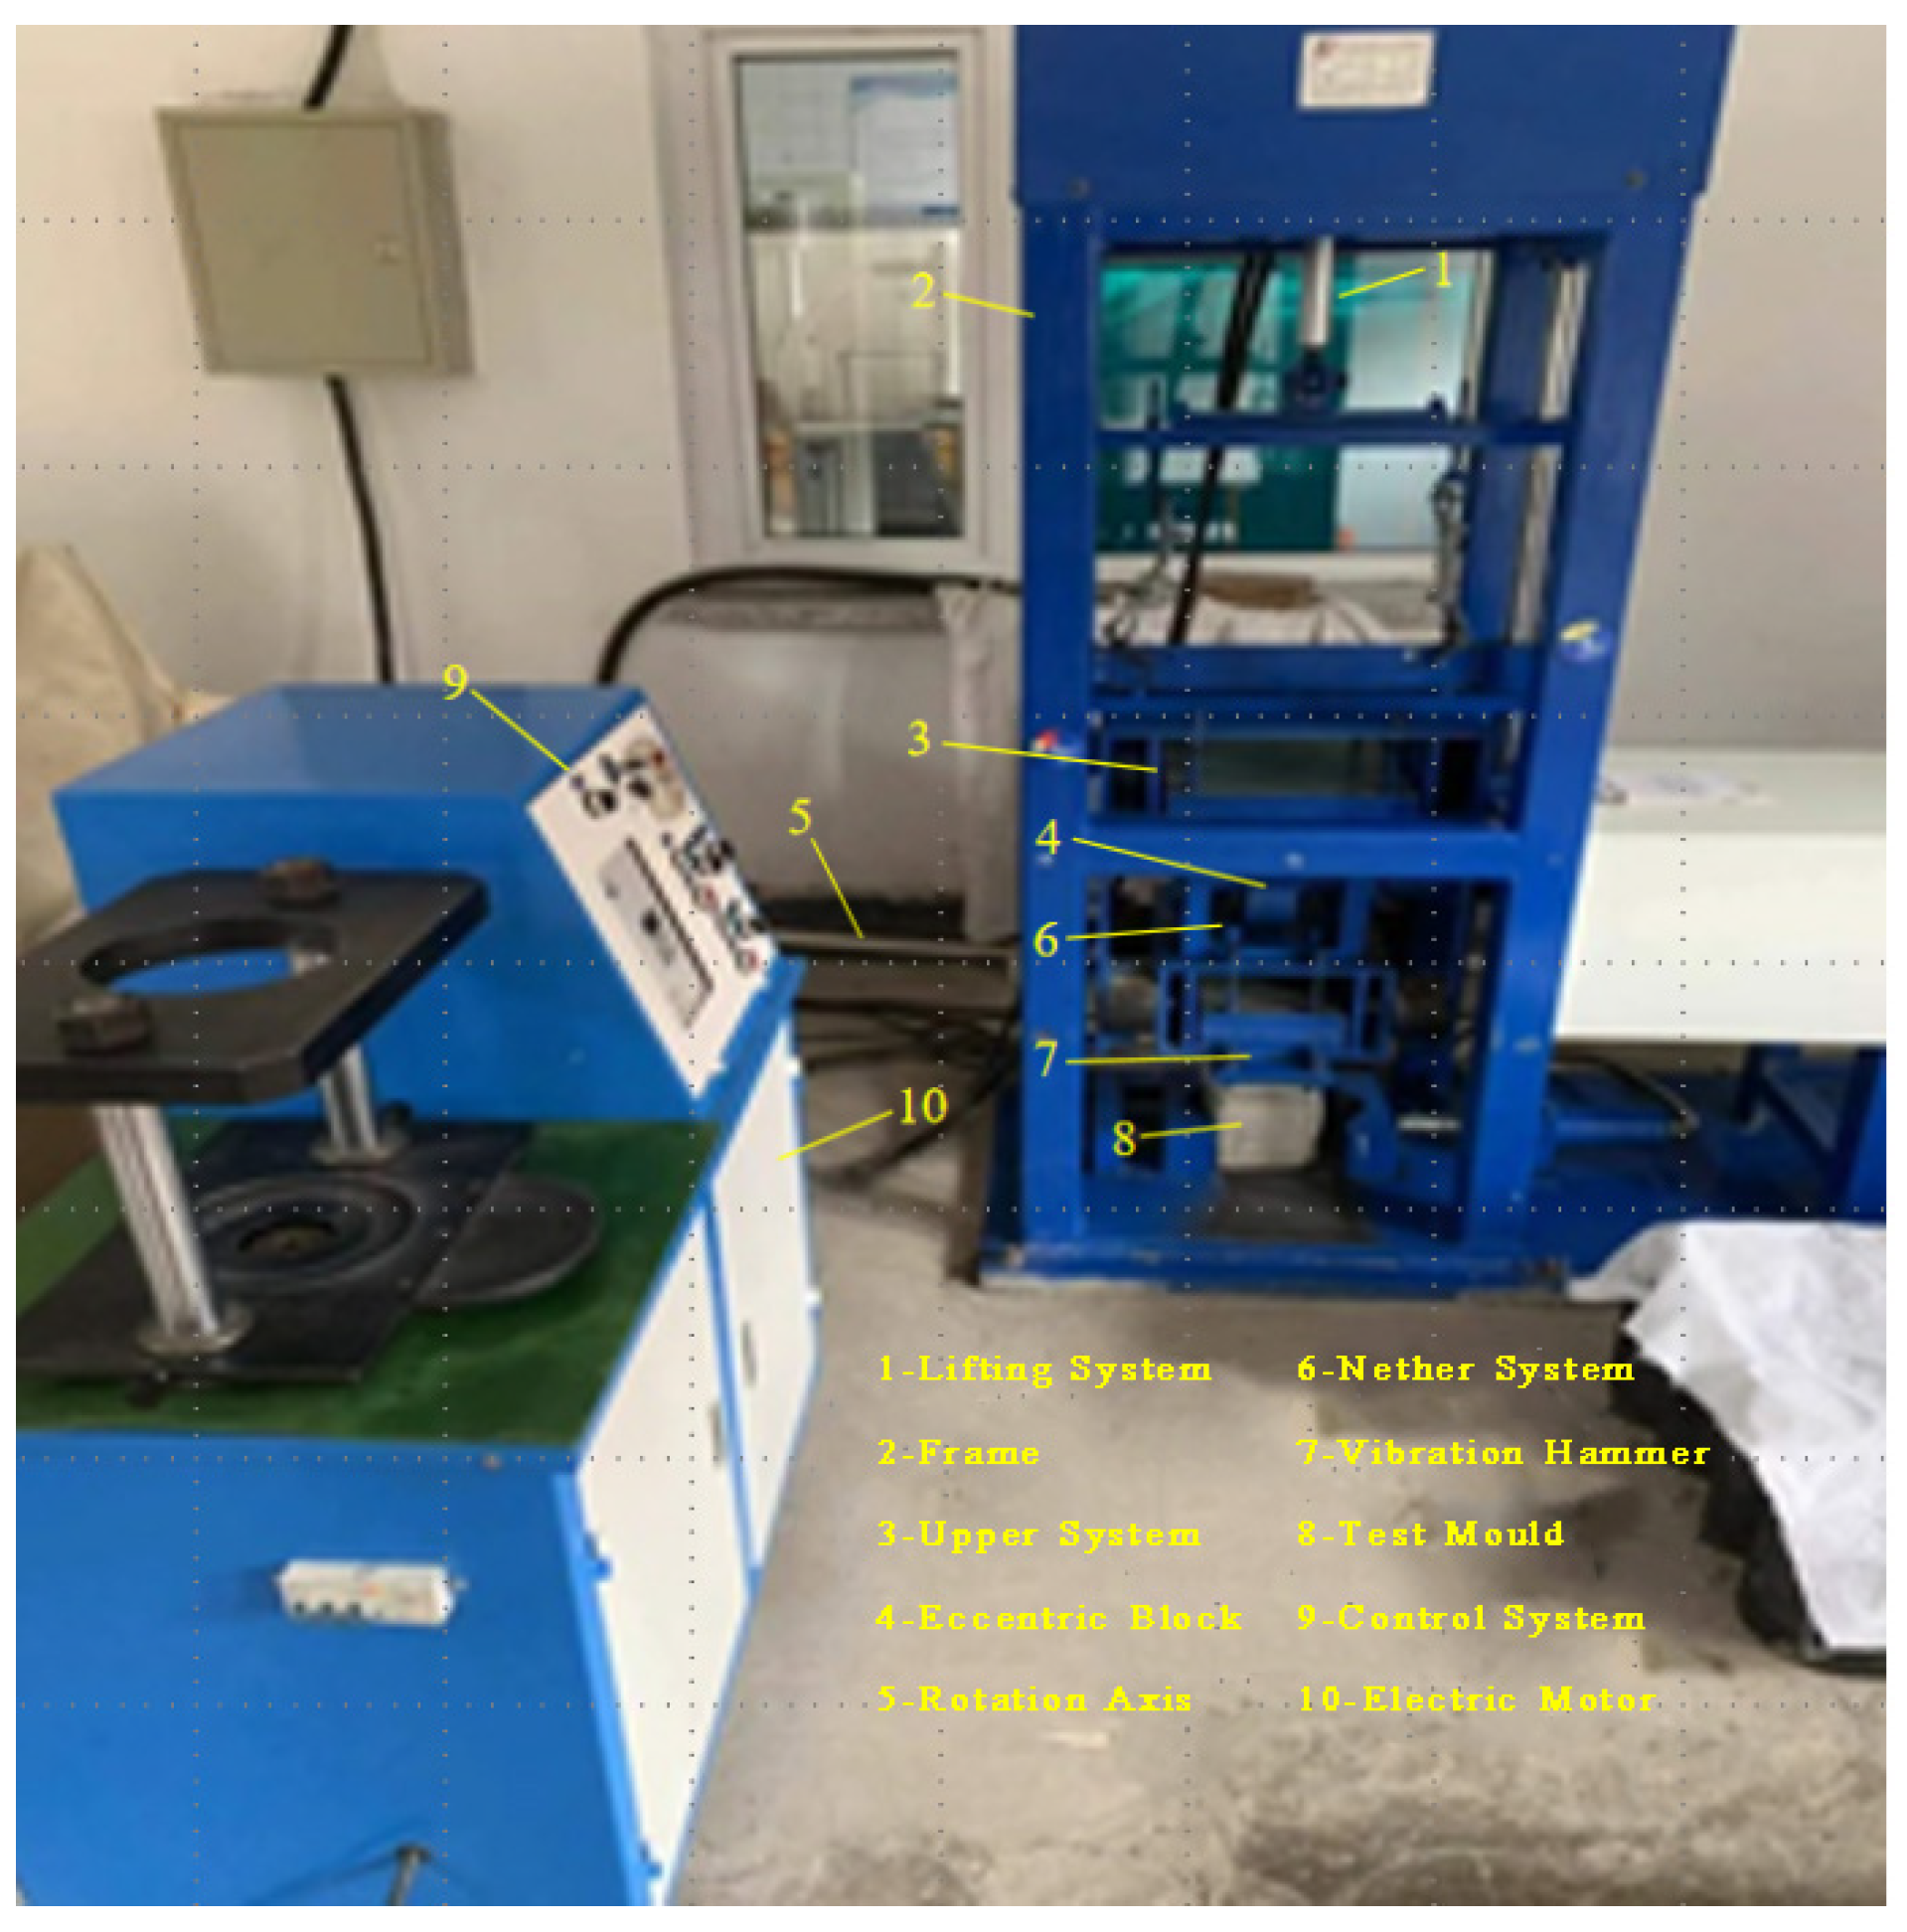
2.2.2. Experimental Scheme for Vibration Molding

The vertical vibration compaction instrument used in this study imitates the working principle and structural characteristics of a directional vibratory roller, which can better simulate site construction. The adjustable parameters of the vertical vibration test method (VVTM) include the mass of the loading system, the mass of the unloading system, the working frequency, and the static eccentric moment. Amplitude and static pressure are adjusted by changing the counterweight; the working frequency is changed by adjusting the output frequency of the motor; and the size of the eccentric moment is adjusted by changing the angle between the fixed and movable eccentric blocks. Combined with the existing vibration parameter optimization study and test verification, the vibration parameter configuration selected for use in this study is shown in Table 4. The surface vibration compactor used in this study is shown in Figure 1.
The vibration molding specimens were cylindrical; their diameter × height = 152 mm × 180 mm. Specimens were vibrated and compacted for 100 s after configuring the working parameters of the vibratory compaction instrument according to Table 4.

3. Discrete Element Model Building and Verification

3.1. Basic Theory of Discrete Elements

The discrete element method is a numerical method using explicit equations. Its basic concept is to discrete a discontinuous medium into a certain number of rigid particles, so that each rigid body satisfies a series of motion equations. Next, the dynamic relaxation iteration method is used to solve the motion equations of each rigid element, and the motion state of the entire discontinuous body is obtained.
In the discrete element method, mechanical action between particles is a non-static process, and displacement and force between particles can be calculated by tracking the motion process of a particle in space. In the calculation process of a discrete element, the object of calculation can be divided into elements connected by nodes. The position relation of adjacent elements can be contacted or separated. According to the relationship between force and displacement and the motion equation, the interaction force and its motion state between elements can be calculated, respectively [27].
Particle Flow Code (PFC) is a widely used discrete element software. It is often used to simulate dynamic problems such as discontinuous media mechanics and large deformations [28,29].
The discrete element calculation method’s key problem is the mechanical behavior of contact. Contact interconnects a large number of balls, clusters, and walls, which affects the whole by locally reflecting all types of mechanical behaviors when using mesoscopic view media.
The parallel bonding model is used to characterize the mechanical behavior between bonded materials (similar to the bonding of epoxy resin glued glass beads and cement inter-aggregates). Its bonding components are parallel to linear elements, creating elastic interactions between contacts; parallel bonding can transfer forces and moments between different entities. The component and behavior of two interfaces of the linear parallel bond model is shown in Figure 2.
The contract bond can be viewed as a set of springs with constant normal and tangential stiffness, uniformly distributed on the contact surface and at the central contact point, parallel to linear springs. The relative motion that occurs at contact after the creation of the parallel bond generates forces and moments within the bonded material. Such forces and moments act on the two contact blocks and are related to the maximum positive and shear stresses in bond-adjacent bonding material. If these stresses exceed their corresponding bonding strengths, the parallel bond breaks and the parallel bonding contact model degenerates to a linear model.
In this study, the cement-stabilized macadam model was set up using different contact models for aggregate and mortar combinations, which reflect CSM’s actual performance test characteristics more realistically [31]. Therefore, a parallel adhesion model was used to simulate the mechanical behavior between mortar and mortar, and mortar and aggregate specimens, and a linear contact model was used to simulate the contact behavior between coarse aggregates and coarse aggregates.
There are two primary methods of external loading in the discrete element method. The first method uses a wall to apply the load; a certain velocity is applied to a wall, and then the wall’s motion applies force to internal particles. The second method uses the clump command to generate a “flat” shaped particle cluster similar to a rigid plate, which does not deform; then the load is applied to the particle cluster. This method can achieve various forms of variable loads.

3.2. Modeling Process

The particle flow compaction model used in this study included a specimen model and a loading plate model, which were generated as follows.
The wall was generated at the boundary of the specimen according to specified dimensions, and various sizes of spherical particles represented each aggregate grade. The specimen was generated with specified gradation and porosity to simulate laboratory tests to the maximum extent possible.
The compaction molding test generated 43,618 small particles to characterize the cement and fine aggregates, and 2804 large particles to characterize coarse aggregates. The vibration molding test generated 54,546 small particles and 3414 large particles. The particles were assigned mesoscopic mechanical parameters and allowed to balance under gravity. When the ratio of unbalanced force was less than 1 × 10⁻⁴, the system reached the equilibrium steady state [32].
In this study, both molding tests were performed by generating loading plates. The compaction molding loading plate was composed of 172 particles with a 15 cm base diameter and a height of 8.4 cm using the ‘clump create’ command. The vibration molding loading plate used the ‘clump create’ command to generate a 3.36 cm high cylinder with a 15 cm diameter composed of 31 spherical particles with a 1.68 cm radius.
To reduce computational pressure, the models used in this study were simplified as follows: (1) layered compaction was not used, (2) one cycle of heavy compaction was simplified to one compaction by expanding the loading plate diameter, and (3) particles smaller than 2.36 mm were generated using 2.36 mm, and 26.5 mm-sized particles were generated using 20 mm.
The forming models generated in this study are illustrated in Figure 3.

3.3. Molding Simulation Process

3.3.1. Experimental Process of Compaction Molding

(1)
A ramming hammer was generated directly above the specimen. To save computing time, the initial velocity of the hammer v 0 = 2 g h replaced free-fall motion at a fixed height while ensuring constant kinetic energy and momentum.
(2)
After each ramming, specimen porosity, hammer displacement time range and other key parameters were monitored. When the hammer speed dropped to 0, the basically unchanged amount of sink was rammed to terminate the compaction test, and the hammer model was removed.
(3)
When the next compaction test was performed, the specimen after the last compaction test was called, the hammer was regenerated, and given its initial speed.
(4)
Calculation results were exported and analyzed.

3.3.2. Vibration Molding Process

The loading plate was generated above the specimen. Appropriate contact parameters were set between the loading plate and the specimen. Key parameters, such as the porosity of the specimen and the displacement time history of the loading plate, were monitored. The vibration force was simplified to the loading force. The simple resonant dynamic equation is found in the formula
F = A cos ( 2 π   f t )
where F is loading force (N); A is vibration force (N); f is frequency of the exciting force (Hz); and t is load time (s).

3.4. Experimental Validation of Numerical Model

The change in specimen height was an intuitive reflection of the forming effect. Throughout the indoor compaction test, the specimen heights were measured after each compaction. After the test, the specimen’s height change and the number of compactions were obtained. In the discrete element simulation process, the loading plate’s height change during the loading cycle was observed after each compaction, and the change in specimen height was reflected by the average value of the center height of the loading plate. The specimen’s height change was used as a comparison object; indoor test results and discrete element simulation results were compared to verify the correctness of the numerical simulation in this study. The Comparison of tamping settlement between the indoor compaction test and the discrete element simulation test in this paper is shown in Figure 4.
The discrete element simulation results were close to the indoor test results. Specimen height decreased faster at the beginning of compaction, and the speed gradually decreased as the number of compactions increased. Although height variation in the first ten simulations was slightly smaller than that of the indoor experiments, the decreasing trend was the same. Specimens’ heights after compaction were very close to that of the experimental measurements.

4. Results and Discussion

4.1. Specimen Porosity Variation

Porosity is an important parameter affecting the performance of materials. It directly indicates the degree of material density, and indirectly indicates a material’s strength. The greater the material’s porosity, the lower the strength of the material. There is an approximately linear proportional relationship between a material’s strength and its porosity.
The discrete element model established in this paper does not consider the role of water and assumes that coarse and fine particles have the same density. Assuming that a mixture’s dry density is equal to its density, the following equation holds.
ρ d = ρ = m V = ρ s V s V = ρ s V V k V = ρ s 1 p
where ρ d is dry density; ρ s is solid particle density; V s is volume   of   solid   particle ; V k is pore volume; V is specimen volume; p is porosity.
In the indoor compaction test, maximum dry density is generally used to evaluate compaction quality [33,34]. The above formula shows that dry density is linearly related to porosity; therefore, porosity can be used as an indicator to evaluate the compaction effect.
The initial porosity of the simulated cement-stabilized macadam was set to 23%. As the ‘DISTRIBUTE’ command is limited (overlap of particles is allowed), generated specimens had a slightly higher porosity than the set value. The final initial porosity of the vibration molding specimen was 24.052%, and the initial porosity of the compaction molding specimen was 24.177%. Porosity values were recorded during the forming process, and the variation in porosity with the number of compactions was obtained, as shown in Figure 5.
Figure 5a illustrates the specimen used for compaction molding. In order to better observe the change in voids inside the specimen, it was split, as shown in Figure 5b. Figure 5c–h represent slices of the unloaded compaction molding specimen (1 compaction, 5 compactions, 10 compactions, 17 compactions, and post compaction, respectively). Figure 5 illustrates that porosity decreased most after the first compaction, that as the number of compactions increased, porosity decreased, and that porosity’s rate of decrease gradually slowed until it remained almost unchanged towards the last compactions. The change trend in porosity was consistent with the changing law of specimen height previously mentioned, and the decrease in porosity was significantly influenced by the first few compactions.
The relationship between porosity and dry density can be deduced from Formula (2), as shown in Formula (3). CSM’s maximum dry density was 5%; the indoor test detected a 2.557 water content. The porosity of the indoor test specimen was 7.85% after compaction molding, whereas the porosity of the simulation test specimen was 8.31% after molding. Although the simulation test specimen’s porosity was slightly higher than that of the indoor test, there was particle overlap in the discrete element simulation; given this, the results obtained from the simulation experiment are reasonable.
p = 1 V S V = 1 M d ρ d V
where p is porosity; V S   is   volume   of   solid   particle ; V   is   volume   of   specimen ;   M d   is   dry weight ;   ρ d   is   dry   density .
Figure 6a illustrates the specimen used for vibration molding and Figure 6b illustrates the cut open vibration specimen. Figure 6c–h represent slices of the vibration molding specimen unloaded, and loaded for 10 s, 20 s, 30 s, 40 s, and post loading, respectively. The specimen’s porosity changed very little in the first 10 s of vibration molding, the rate of decline gradually increased after 10 s and reached its maximum at 20–30 s. After this, the trend of change gradually slowed to almost unchanged. The decline in porosity was significantly influenced by the key time period of compaction.
The porosity of the simulated vibration molding specimen was 8.12%, which is 2.5% lower than that of the compaction molding. This was due to the strong excitation force of the vibration molding instrument, which embedded particles with each other to form a more compact composition.

4.2. Specimen Force Chain Variation

Bulk particles are primarily arranged in dense rows; contact between adjacent particles forms many paths for transferring external loads, which usually take the form of a quasi-linear chain structure, called a force chain. Several force chains intersect to form a network throughout granular material in a granular system; the contact force between particles is an important factor affecting the mechanical performance of granular materials [35,36]. Inter-particle links occur under external loading, which form linear and more stable force chains. These force chains form a network, which support gravitational and external loads throughout the granular medium.
Contact forces between particles are complex, with different magnitudes and directions. The external load share is different when local particles in the contact network are subjected to different forces. There are strong and weak contacts between particles. Paths that transfer larger shares of loads constitute strong force chains, and paths that transfer smaller shares of loads form weak force chains. Strong and weak force chains are the paths of external load transfer, and these paths constitute the entire contact network [37,38].
In Figure 7, the contact force between large particles is coarse and dense, which shows that the force in the CSM was primarily transferred between skeletal particles. As a result of the skeleton effect of coarse aggregates, the strength of the mixture after molding largely depended on the skeleton formed by coarse aggregates embedded with each other, rather than on the strength of the cement paste.
Figure 8 shows the force chain evolution process of the compaction molding specimen, illustrating the change process as the force gradually radiated from the surface of the entire specimen.
Each line segment in Figure 8 represents a contact between particles, and the thickness of the line represents the magnitude of the contact force. From the beginning to the end of the loading process, the load was gradually transferred from the top of the mixture to the bottom. During the first ten compactions, the specimen’s force chain density rapidly increased, while the specimen’s height and porosity significantly decreased. After ten compactions, the decreasing trend of the specimen’s height and porosity slowed and stabilized. This is because the cement-stabilized macadam was in a loose state with large internal voids and relatively few contact points between skeletal particles before loading started. As the number of compactions increased, CSM specimens were gradually compacted, skeletal particles embedded with each other, and the contact force of the skeletal particles in the specimens increased. These force chains constituted a force chain network, which supported the gravity and external load of the entire particle medium. Particles produced relatively little movement and displacement under the action of an external compaction force; force transmission was relatively fast.
The force chain structure evolution process during vibration molding is distinct from the force chain structure evolution process during compaction molding. Figure 9 illustrates the force chains of vibration molding specimens before vibration, after vibration for 10 s, 20 s, 30 s, and 60 s, and post vibration.
In the initial state, under the action of gravity, the bottom force chain was denser. As the vibration process proceeded under the dual action of gravity and vibration, the bottom material was continuously dense, the contact force between particles increased, and the strong force chain that formed was still concentrated at the bottom and transferred upward. At approximately 30 s, the vibration action’s force on the upper material increased, and a strong force chain began to appear and transfer downward. After that, the material in the mold was subjected to axial pressure and vibration force, the force chain was transmitted from the upper and lower ends to the middle, and the force chain generated by the lower vibration was transmitted a greater distance. At the end of the molding process, the distribution of force chains in the specimen tended to be uniform.

4.3. Variation in Average Coordination Number

As a mesoscopic parameter, the average coordination number reveals detailed structural information regarding the inside of granular material and affects the macroscopic properties of granular material more directly than the packing density. The average coordination number is defined as the ratio of the sum of the number of contacts in the measurement circle to the number of particles in the measurement circle.
The measurement circle is user-specified (volume in three dimensions; area in two dimensions), within which a number of quantities in a PFC model are measured. The quantities measured include coordination number, porosity, sliding fraction, stress, and strain rate [30].
C N = N b n C b N b
where N b is the number of particles in the measurement circle and   n C b is the actual number of contacts (normal contact force greater than zero) for a single particle within the measurement circle.
In this study, two particles were considered to be in contact with each other when the normal contact force was non-zero. The coordination number can be interpreted as the average number of particles in contact with each particle in the specimen, which reflects the state of the specimen to some extent, such as degree of denseness. The larger the coordination number, the denser the particles; the smaller the deformation, the greater the strength. Conversely, the smaller the coordination number, the looser the particles; the greater the deformation, the smaller the strength.
In the simulated specimens, the measurement circle was arranged to obtain the change process of the average coordination number of particles in each specimen, as shown in Figure 10.
In both forming methods used in this study, the early increase in the CSM’s average coordination number was very fast. The trend of the average coordination number tended to slow after a certain point. After molding, the average coordination number of the vibration molding specimen was approximately 2.3% higher than that of the compaction molding specimen. This is because the cement-stabilized macadam mixture received vibration and impact in the forming process. CSM segregation surrounded the outer layer of material particles with a water film, which lubricated particle movement, reducing the friction and bonding force between materials. Particles easily moved to a dense state, and embedded with each other to achieve high bearing capacity and stability.
In the compaction molding method, because the specimen was subjected to a single force, the hammer forced particles in the mixture to approach each other when the material was in a loose state until they moved to a stable position. However, compared with the vibration forming method, particles in the heavy compaction forming specimen were less mobile and the degree of inter-particle nesting was low. The average coordination number of particles in the compaction molding specimen was slightly lower than that of the vibration molding specimen.

4.4. Displacement Variation in Specimen Particles

During the application of load, particles in the mesoscopic view model will produce mutual misalignment and spatial position change, which causes the interior of the specimen to gradually converge to an equilibrium state. The distribution of particle displacement reflects the location and degree of force on the specimen to a certain extent. This study tracked the distribution of particle displacement under the load, as shown in Figure 11.
Figure 11 shows that for both molding methods used, particle displacement was primarily concentrated at the top of the specimen during the molding process, and vertical displacement increased as the distance between the particles and the bottom plate increased. The overall direction of particle movement inside the specimens was downward, and displacement of upper particles was obviously greater than that of lower particles. This is because the force on the lower particles was attenuated and constrained by the bottom plate, showing the movement pattern downward and to the left and right sides. In addition, the trajectory of small particles was easily influenced by large particles; small particles moved around large particles under the action of the load.
Measurement circles of the same size were used in both simulated specimens. Porosity inside the measurement circles was detected, and differences in porosity between the upper and lower parts of the specimens were obtained, as shown in Table 5.
The porosity of the upper part of the compaction molding specimen was less than that of its lower part, whereas the difference between the porosity of the upper and lower parts of the vibration molding specimen was slight. The particle distribution of the vibration molding specimen was more uniform, whereas the particles of the compaction molding specimen were obviously distributed densely at its top and sparsely in its bottom. This is because during the vibration molding process, compacted material was affected by gravity and also subjected to the vibration effect of the surface vibrator. All particles were subjected to uniform force throughout the specimen, which made it easier to achieve a dense state with relative motion and filling. In contrast, during the compaction molding process, compacted material was only subjected to the impact of the falling hammer. Moreover, the impact force of the hammer decreased as depth increased, so that the force received by the lower particles was insufficient; the relative displacement between particles was small, and the filling effect was relatively poor.

5. Conclusions

The molding process of a cement-stabilized macadam base directly affects its performance. In order to explore the influence of heavy compaction molding and vibration molding on the composition and structure of a CSM base at the meso level, compaction molding and vibration molding tests were simulated based on the three-dimensional discrete element method. Laboratory tests verified numerical simulation model results. CSM’s structural changes were captured and analyzed during the molding process, and quantitative indexes of porosity and coordination number were proposed to evaluate the molding effects of the simulation tests. The main conclusions drawn are:
(1)
The DEM numerical simulation of the cement-stabilized macadam forming test effectively simulated CSM’s porosity and specimen height variation trends during the forming process.
(2)
The specimen height and porosity changes in the compaction molding process illustrate that the first 10 compactions had the most significant influence on the compaction effect. During the first 10 compactions specimen height and porosity fell fastest, accounting for approximately 80% of the compaction effect, indicating that real-world construction must pay attention to the initial compaction link.
(3)
The discrete element method simulation can explain the CSM forming process from the perspective of particle motion and interaction. The DEM simulation illustrates that during the initial compaction molding action, impact force was transmitted slowly from top to bottom and the compaction load’s transmission speed increased as the mixture was continuously squeezed and compacted. During its initial state, the vibration molding simulation’s force showed a bottom-to-top transmission, presented a trend of transfer from the top and bottom ends towards the middle at approximately 30 s, and finally reached an equilibrium state.
(4)
Particle distribution in the vibration molding specimen was more uniform, whereas particles in the compaction molding specimens showed a dense distribution at the top of the specimen and sparse distribution at the bottom. The porosity of the vibration molding specimen was 2.5% lower than that of the compaction molding specimen, which showed that vibration molding was more effective.
(5)
In the simulation experiments, the average coordination number of particles in the vibration molding specimen was 2.3% higher than that of the compaction molding specimen, implying that the vibration forming specimen had higher load-bearing capacity and stability.

Author Contributions

Conceptualization, C.L.; Data curation, X.Y.; Formal analysis, F.L.; Investigation, F.L.; Methodology, H.Z.; Project administration, H.B.; Software, H.Z.; Supervision, H.B.; Validation, C.L.; Visualization, X.Y.; Writing—original draft, H.Z.; Writing—review & editing, C.L. All authors have read and agreed to the published version of the manuscript.

Funding

This research was funded by the Transportation Science and Technology Program of Jilin Province (2018ZDGC-9).

Acknowledgments

We gratefully acknowledge the researchers of all reports cited herein and the financial support of the Science and Technology Project of the Jilin Provincial High Class Highway Construction Bureau.

Conflicts of Interest

The authors declare no conflict of interest.

References

  1. Jayasinghe, C.; Kamaladasa, N. Compressive strength characteristics of cement stabilized rammed earth walls. Constr. Build. Mater. 2007, 21, 1971–1976. [Google Scholar] [CrossRef]
  2. Jiang, Y.J.; Li, M.J.; Zhang, J.J.; Wang, S. Influence factors of strength properties of cement stabilization of crushed aggregate. J. Chang. Univ. 2010, 30, 1–7. [Google Scholar] [CrossRef]
  3. Chakrabarti, S.; Kodikara, J. Direct tensile failure of cementitiously stabilized crushed rock materials. Can. Geotech. J. 2007, 44, 231–240. [Google Scholar] [CrossRef]
  4. Wang, L.; Xie, X.; Luan, H. Influence of laboratory compaction methods on shear performance of graded crushed stone. ASCE J. Mater. Civ. Eng. 2011, 23, 1483–1487. [Google Scholar]
  5. Li, X. Research on Value of Strength and Modulus of Cement-stabilized crushed rock for Pavement Base Course. Master’s Thesis, Chang’an University, Xi’an, China, 2016. [Google Scholar] [CrossRef]
  6. Hu, L.Q. Research on Structural Characteristic and Component Design Methods for Semi-rigid Base Course Material. Ph.D. Dissertation, Chang’an University, Xi’an, China, 2004. [Google Scholar]
  7. Yan, X.L.; Liang, C.Y.; Xu, J.H.; You, Q.L.; Li, A. Elastoplastic Characteristics of Cement-stabilized Aggregate Bases. Chin. J. Highw. Transp. 2019, 32, 29. [Google Scholar] [CrossRef]
  8. Wang, Y.; Ni, F.J.; Li, Z.X. Test Research on Influential Factor for Shrinkage Performance of CementOtreated Macadam Base. J. Highw. Transp. Res. Dev. 2007, 24, 30–34. [Google Scholar]
  9. Zhang, Q.Q. Study on the Design Method of Material Composition and Performance Change Law of Cement Stabilized Gravel Base with Skeletal Pore Structure. Master’s Thesis, Chang’an University, Xi’an, China, 2011. [Google Scholar] [CrossRef]
  10. Jiang, Y.J.; Wang, F.Y.; Liu, B. Research on Strength Properties of Cement Stabilization of Crushed Aggregate. J. Wuhan Univ. Technol. 2009, 31, 52–57. [Google Scholar]
  11. Jiang, Y.J.; Li, D.W.; Xie, R.S. Influence of forming method on physical and mechanical properties of cement stabilized aggregates. Highw. Transp. Technol. Appl. Technol. Ed. 2012, 8, 45–50. [Google Scholar]
  12. Yang, D.Y.; Wang, L. Relationship and mechanism analysis of compressive strength of cement stabilized aggregates under vibration and static compression molding methods. Heilongjiang Transp. Sci. Technol. 2013, 36, 67–69. [Google Scholar] [CrossRef]
  13. Li, X.H.; Li, B.; Yang, X.L. Influence on Mechanical Performance of Cement Stabilized Macadam Base Molded by Different Methods. J. Lanzhou Jiaotong Univ. 2015, 34, 1–4+19. [Google Scholar]
  14. Hong, L.; Liu, T.; Yang, S.-Q. Comparative Experiment on Vibrating Compaction and Modified Proctor Compaction of Silt Cement-Stabilized Gravel Aggregate. J. Chongqing Jiaotong Univ. Nat. Sci. Ed. 2014, 33, 63–67. [Google Scholar]
  15. Wang, L.; Xie, X.G. Relationship on index of physics and mechanics cement-stabilized aggregates between vibrating and static compacting methods. J. Harbin Inst. Technol. 2012, 44, 70–74. [Google Scholar]
  16. Wang, J. Analysis of Dynamic States of Granular Materials under Cyclic Loading by Discrete Element Modeling. Master’s Thesis, Chang’an University, Xi’an, China, 2012. [Google Scholar] [CrossRef]
  17. Liu, D.; Xia, X.; Sun, L. Movement and embedding characteristics of interlayer aggregates during roller-compacted concrete compaction process using discrete element simulation. Constr. Build. Mater. 2020, 249, 118765. [Google Scholar] [CrossRef]
  18. Gong, F.; Zhou, X.; You, Z.; Liu, Y.; Chen, S. Using discrete element models to track movement of coarse aggregates during compaction of asphalt mixture. Constr. Build. Mater. 2018, 189, 338–351. [Google Scholar] [CrossRef]
  19. Jiang, Y.J.; Fan, L.F. An investigation of mechanical behavior of cement-stabilized crushed rock material using different compaction methods. Constr. Build. Mater. 2013, 48, 508–515. [Google Scholar] [CrossRef]
  20. Qian, G.; Hu, K.; Li, J.; Bai, X.; Li, N. Compaction process tracking for asphalt mixture using discrete element method. Constr. Build. Mater. 2020, 235, 117478. [Google Scholar] [CrossRef]
  21. Mechtcherine, V.; Gram, A.; Krenzer, K.; Schwabe, J.-H.; Shyshko, S.; Roussel, N. Simulation of fresh concrete flow using Discrete Element Method (DEM): Theory and applications. Mater. Struct. 2013, 47, 615–630. [Google Scholar] [CrossRef]
  22. Wang, U.; Li, X.M. Three-dimensional discrete element analysis of vibratory compaction characteristics of soil-rock mixture. J. Henan Urban Constr. Inst. 2018, 27, 66–71. [Google Scholar] [CrossRef]
  23. Meng, Q.; Zhou, W.; Zhao, K. Study and Comparison of CementOstabilized Aggregate Mixture with Static Pressure Method and Vibration Method. Highw. Traffic Technol. 2007, 1, 21–25. [Google Scholar]
  24. GB 175-2007; General-Purpose Silicate Cement. Available online: https://www.antpedia.com/standard/5156435-1.html (accessed on 24 February 2022). (In Chinese).
  25. JTG/T F20-2015; Technical Details of Road Pavement Base Construction. People’s Traffic Publishing House: Beijing, China, 2015. (In Chinese)
  26. JTG E51-2009; Test Procedure for Inorganic Binding Material Stabilization for Highway Engineering. People’s Traffic Press: Beijing, China, 2009. (In Chinese)
  27. Zhigang, D. Study on Numerical Simulation Method of Asphalt Mixture Based on Three Dimensional Discrete Element Method. Master’s Thesis, South China University of Technology, Guangzhou, China, 2017. [Google Scholar]
  28. Zhou, C. PFC Practice of Performance Analysis of Asphalt Mixture; Dalian University of Technology Press: Dalian, China, 2015. [Google Scholar]
  29. Wang, T.; Han, Y.; Zhu, Y.; Zhang, F. PFC2D/3D Particle Discrete Element Calculation Method and Application; China Building Industry: BeiJing, China, 2020. [Google Scholar]
  30. PFC 5.0 Documentation; Itasca Consulting Group Inc.: Minneapolis, MN, USA, 2016.
  31. Oñate, E.; Cornejo, A.; Zárate, F.; Kashiyama, K.; Franci, K. Combination of the finite element method and particle-based methods for predicting the failure of reinforced concrete structures under extreme water forces. Eng. Struct. 2022, 251, 113510. [Google Scholar] [CrossRef]
  32. Shi, C.; Zhang, Q.; Wang, S. Numerical simulation technology and application with Particle flow Code (PFC5.0). Rock Soil Mech 2018, 39, 43. [Google Scholar]
  33. Spagnoli, G.; Shimobe, S. An overview on the compaction characteristics of soils by laboratory tests. Eng. Geol. 2020, 278, 105830. [Google Scholar] [CrossRef]
  34. Du, K.; Li, A. Experimental study on maximum dry density and compactness of coarse grained soil mixture. Railw. Eng. 2012, 11, 98–100. [Google Scholar] [CrossRef]
  35. Sun, Q.; Wang, G. Review of particle flow dynamics and its discrete model. Adv. Mech. 2008, 38, 87–100. [Google Scholar] [CrossRef]
  36. Sun, Q.; Xin, H.; Liu, J.; Jin, F. Skeletal and force chain networks in granular systems. Geotechnics 2009, 30, 83–87. [Google Scholar]
  37. Liu, G.; Han, D.; Jia, Y.; Zhao, Y. Asphalt mixture skeleton main force chains composition criteria and characteristics evaluation based on discrete element methods. Constr. Build. Mater. 2022, 323, 126313. [Google Scholar] [CrossRef]
  38. Kang, G.; Ning, Y.-j.; Liu, R.; Chen, P.-W.; Pang, S.-p. Simulation of force chains and particle breakage of granular material by numerical manifold method. Powder Technol. 2021, 390, 464–472. [Google Scholar] [CrossRef]
Figure 1. Schematic diagram of the structure of the vibration meter used in this study.
Applsci 12 08505 g001
Figure 2. Parallel bonding models [30].
Applsci 12 08505 g002
Figure 3. (a) Compaction molding and (b) vibration molding discrete element models. In the figure, E is abbreviation for exponent, for example, the number 1.68E0 stands for 1.68.
Applsci 12 08505 g003
Figure 4. Comparison of tamping settlement between the indoor compaction test and the discrete element simulation test.
Applsci 12 08505 g004
Figure 5. Changes in porosity during compaction molding. (a) is the specimen model used for compaction molding in this paper; (b) is the axial section of the specimen model; (c) is the axial section of the specimen before compaction; (d) is the axial section of the specimen after 1 compaction; (e) is the axial section of the specimen after 5 compaction; (f) is the axial section of the specimen after 10 compaction; (g) is the axial section of the specimen after 17compaction; (h) is the axial section of the specimen after compaction is completed. In the figure, E is abbreviation for exponent, for example, the number 2.3753E-1 stands for 0.23753.
Applsci 12 08505 g005
Figure 6. Changes in porosity during vibration molding. (a) is the specimen model used for vibration molding in this paper; (b) is the axial section of the specimen model; (c) is the axial section of the specimen before vibration; (d) is the axial section of the specimen after vibrating for 10 s; (e) is the axial section of the specimen after vibrating for 20 s; (f) is the axial section of the specimen after vibrating for 30 s; (g) is the axial section of the specimen after vibrating for 40 s; (h) is the axial section of the specimen after vibration is completed. In the figure, E is abbreviation for exponent, for example, the number 1.2973E0 stands for 1.2973.
Applsci 12 08505 g006
Figure 7. Force chain distribution and skeleton particle position. In the figure, E is abbreviation for exponent, for example, the number 1.68E3 stands for 1.68.
Applsci 12 08505 g007
Figure 8. Skeleton particle force chain visualization of compaction molding. (a) Force chain before compaction; (b) force chain after 1 compaction; (c) force chain after 5 compactions; (d) force chain after 10 compactions; (e) force chain after 17 compactions; and (f) force chain after 42 compactions. In the figure, E is abbreviation for exponent, for example, the number 2E7 stands for 2 × 10⁷.
Applsci 12 08505 g008
Figure 9. Skeleton particle force chain diagrams. (a) Force chain before vibration; (b) force chain after 10 s vibration; (c) force chain after 20 s vibration; (d) force chain after 30 s vibration; (e) force chain after 60 s vibration; and (f) force chain post vibration. In the figure, E is abbreviation for exponent, for example, the number 4.5E7 stands for 4.5 × 10⁷.
Applsci 12 08505 g009
Figure 10. Variation in coordination numbers.
Applsci 12 08505 g010
Figure 11. Comparison of skeleton particle displacement in specimens after molding. (a) Particle displacement of vibration specimen; (b) particle displacement of compaction specimen; (c) particle displacement of vibration specimen slice; and (d) particle displacement of compaction specimen slice. In the figure, E is abbreviation for exponent, for example, the number 3E0 stands for 3.
Applsci 12 08505 g011
Table 1. Technical index test results of cement.
IndexFineness (%)Initial Setting Time (min)Final Setting Time (min)Stability28 d Strength (MPa)
CompressionFlexural
Experimental results0.63245365eligible48.610.4
Specification requirements≤10≥180≥360≥42.5≥6.5
Table 2. Test results of aggregates’ technical indexes.
Performance IndicatorsTest ResultsTechnical Requirements (High Speed and Primary Roads)
Coarse aggregatesCrushing value (%)18.8≤22
Content of needle-like particles (%)11.5≤18
Dust content below 0.075 mm (%)0.5≤1.2
Soft stone content (%)1.1≤3
Fine aggregatesParticle analysisQualifiedMeet grading requirements
Plasticity Index12≤17
Organic matter content (%)0.6≤2
Sulfate content (%)0.12≤0.25
Table 3. Test gradation of cement-stabilized macadam.
Mass Passing Percentage of Each SIEVE Aperture (%)
Sieve size0.0750.150.30.61.182.364.759.513.2161926.5
Gradation3.66.81014.318.323.636.159.968.375.383.5100.0
Table 4. Parameter Settings of Vibration Compactor.
Operating Frequency (HZ)Nominal Amplitude (mm)Working Mass (Kg)
301.2Upper systemLower systemTotal mass
180120300
Table 5. Porosity difference between upper and lower parts of specimens.
Molding MethodUpper Porosity (%)Lower Porosity (%)
Compaction molding8.238.36
Vibration molding8.088.11
Publisher’s Note: MDPI stays neutral with regard to jurisdictional claims in published maps and institutional affiliations.

