Abstract
To understand the deep tectonic environment at the origin of strong earthquakes along the northern section of the North-South seismic belt and the central continental block of Mongolia, large-scale gravity and geomagnetic surveys and rock sample collection were carried out along the Suhbaatar-Ulaanbaatar-Dalandzadgad profile in Mongolia. The spatial distribution characteristics of the lithospheric magnetic field at 160 geomagnetic measuring points along the profile were then systematically analyzed and summarized. Based on the composition of the lithospheric magnetic field from different sources at different depths combined with the regional geological structure and collected rock sample lithology, the lithospheric magnetic field was further decomposed into different components—the basement, middle layer, and shallow surface—by the upward continuation method. The results show that these components have obvious zoning characteristics and that the lithospheric magnetic field distribution of the Suhbaatar-Ulaanbaatar-Dalandzadgad profile is related to the geological structure, rock lithology, seismic activity, natural remanent magnetization, and magnetic susceptibility. Many destructive earthquakes have occurred in the area where the lithospheric magnetic field changes dramatically, the lithologies are dominantly igneous, and the magnetic susceptibility and natural remanent magnetization are high. In contrast, the lithologies in the area with moderate variation in the lithospheric magnetic field are mostly sedimentary, the magnetic susceptibility and natural remanent magnetization are low, and destructive earthquakes are rare. Since the lithospheric magnetic field reflects the magnetic characteristics of the rocks above the Curie interface, its spatial distribution not only corresponds to the geological structure but also predicts the depth and location of faults. Therefore, it is significant to carry out geomagnetic surveys and rock sampling to analyze the characteristics of geological structures and research regional seismicity.
1. Introduction
The lithospheric magnetic field originates from the rocks above the Curie temperature interface and is mainly generated by the remanent magnetization and induced magnetization of the rocks [1]. This field is related to the composition and thermal state of lithospheric rocks, as well as to the geomagnetic field during the formation of the rocks and the present geomagnetic field [2]. The magnetization field of an underground medium is mainly controlled by the types, proportion, and particle size of ferromagnetic material and by the temperature environment and stress state [1,3]. These factors show complex spatial inhomogeneity due to the differences in geological structure, tectonic environment, and tectonic activity [4,5]. There are few detailed studies on the depth of the lithospheric magnetic field source. It is estimated that magnetic rocks can produce a lithospheric magnetic field mainly located in the upper crust according to the Curie temperature of ferromagnetic rocks under atmospheric pressure and the past research results on the temperatures at different depths in the earth’s crust [3,6,7]. However, the latest research suggests that the Curie temperature of ferromagnetic substances such as Fe3O4 significantly increases as the pressure increases [8]. It is then expected that the depth of the ferromagnetic rocks that produce the lithospheric magnetic field would exceed the depth of the upper crust. To explore the possible depth of ferromagnetic rocks in the lithosphere, the lithospheric magnetic field data are analyzed by upward continuation.
The upward continuation method is a technique for extracting regional magnetic anomalies originating from deep sources based on observed magnetic data [9]. This transformation technique can divide measurement data into different components from different sources [10]. The upward continuation transformation of the data can reduce the influence of shallow anomaly sources, and the effect of upward continuation is that short-wavelength features are smoothed out [11]. The upward continuation process clearly shows the attenuation of short-wavelength anomalies concerning the increase in observations relative to source distance in aeromagnetic data from the Ibadan Area, southwestern Nigeria [10]. According to the upward continuation result of the lithospheric magnetic field data, this method can eliminate random interference, suppress shallow anomalies, and highlight regional anomalies. Therefore, we can estimate the depth of magnetic bodies based on the anomaly scale [12] and determine the physical parameters of geological bodies. This can improve the efficiency and accuracy of related work [13].
The parameters and boundaries of faults can be delineated according to magnetic anomalies. Based on magnetic anomaly data from Mongolia, D. Badarch et al. employed a spectral method to separate shallow, middle, and deep faults and estimated the locations and depths of the faults [14]. For the MS7.0 earthquake that occurred in Lushan, Sichuan Province, on 20 April 2013, the dynamic variation characteristics of the local lithospheric magnetic field before and after the earthquake have been analyzed, and the relationship between the dynamic variation characteristics and the earthquake is retraced [15,16,17,18]. The spatial distribution of the lithospheric magnetic field is related to the factors such as seismic activity and geological structure [19,20]. Earthquakes are generally located near anomalies in areas with complex lithospheric magnetic field patterns [21,22]. Therefore, the relationship between geological structure and seismicity can be investigated by analyzing the spatial distribution characteristics of the lithospheric magnetic field at different depths.
Mongolia is located in the northern part of the Asian continental tectonic domain. Mongolia is one of the most active tectonic areas on earth due to the combined action of the Indo-Eurasian collision and compression and the subduction of the Pacific plate [23,24]. Geologically, Mongolia is connected to the Siberian platform to the north and the China-Korea platform and the Tarim platform to the south. Mongolia mainly has two large E—W-trending faults: the Khangai fault and Erhun River fault in the north, and the Hanbogdor fault and Wenduerhile fault in the south. These two large faults divide Mongolia into three major tectonic zones: the Baikal fold system (Tuva-Mongolia block) in the north, the Caledonian fold system in the middle, and the Hercynian fold system in the south [25]. The outline tectonic map of Mongolia (Mongolia, 1998) shows the diversity and complexity of rock types and structures covering all geological ages from Cambrian to Tertiary, and various extrusive and intrusive rocks of different ages are widely developed in Mongolia [26]. Mongolia is also one of the most active areas with strong seismic activity in the world in the 20th century. From 1905 to 2022, four earthquakes with magnitudes > 8.0 ML occurred in western Mongolia, whereas weak seismic activity was detected in eastern Mongolia [27].
From 2011 to 2013, scientists from China and Mongolia carried out comprehensive geophysical observations and research through seismic, geomagnetism, gravity, and rock sampling in Mongolia and obtained significant velocity structure, geomagnetic field, and gravity anomaly results [28,29,30,31]. This paper describes the Suhbaatar-Ulaanbaatar-Dalandzadgad (SD) profile in Mongolia and its magnetic survey, analyzes the lithospheric magnetic anomalies in the SD profile through upward continuation, explores the depth of the lithospheric magnetic field source, discusses the lithospheric magnetic anomalies and regional geological structure, rock lithology, magnetic susceptibility, and natural remanent magnetization, and discusses the relationship between seismic activity and fault depth.
2. Observation Data and Data Processing Methods
2.1. SD Profile Geomagnetic Survey
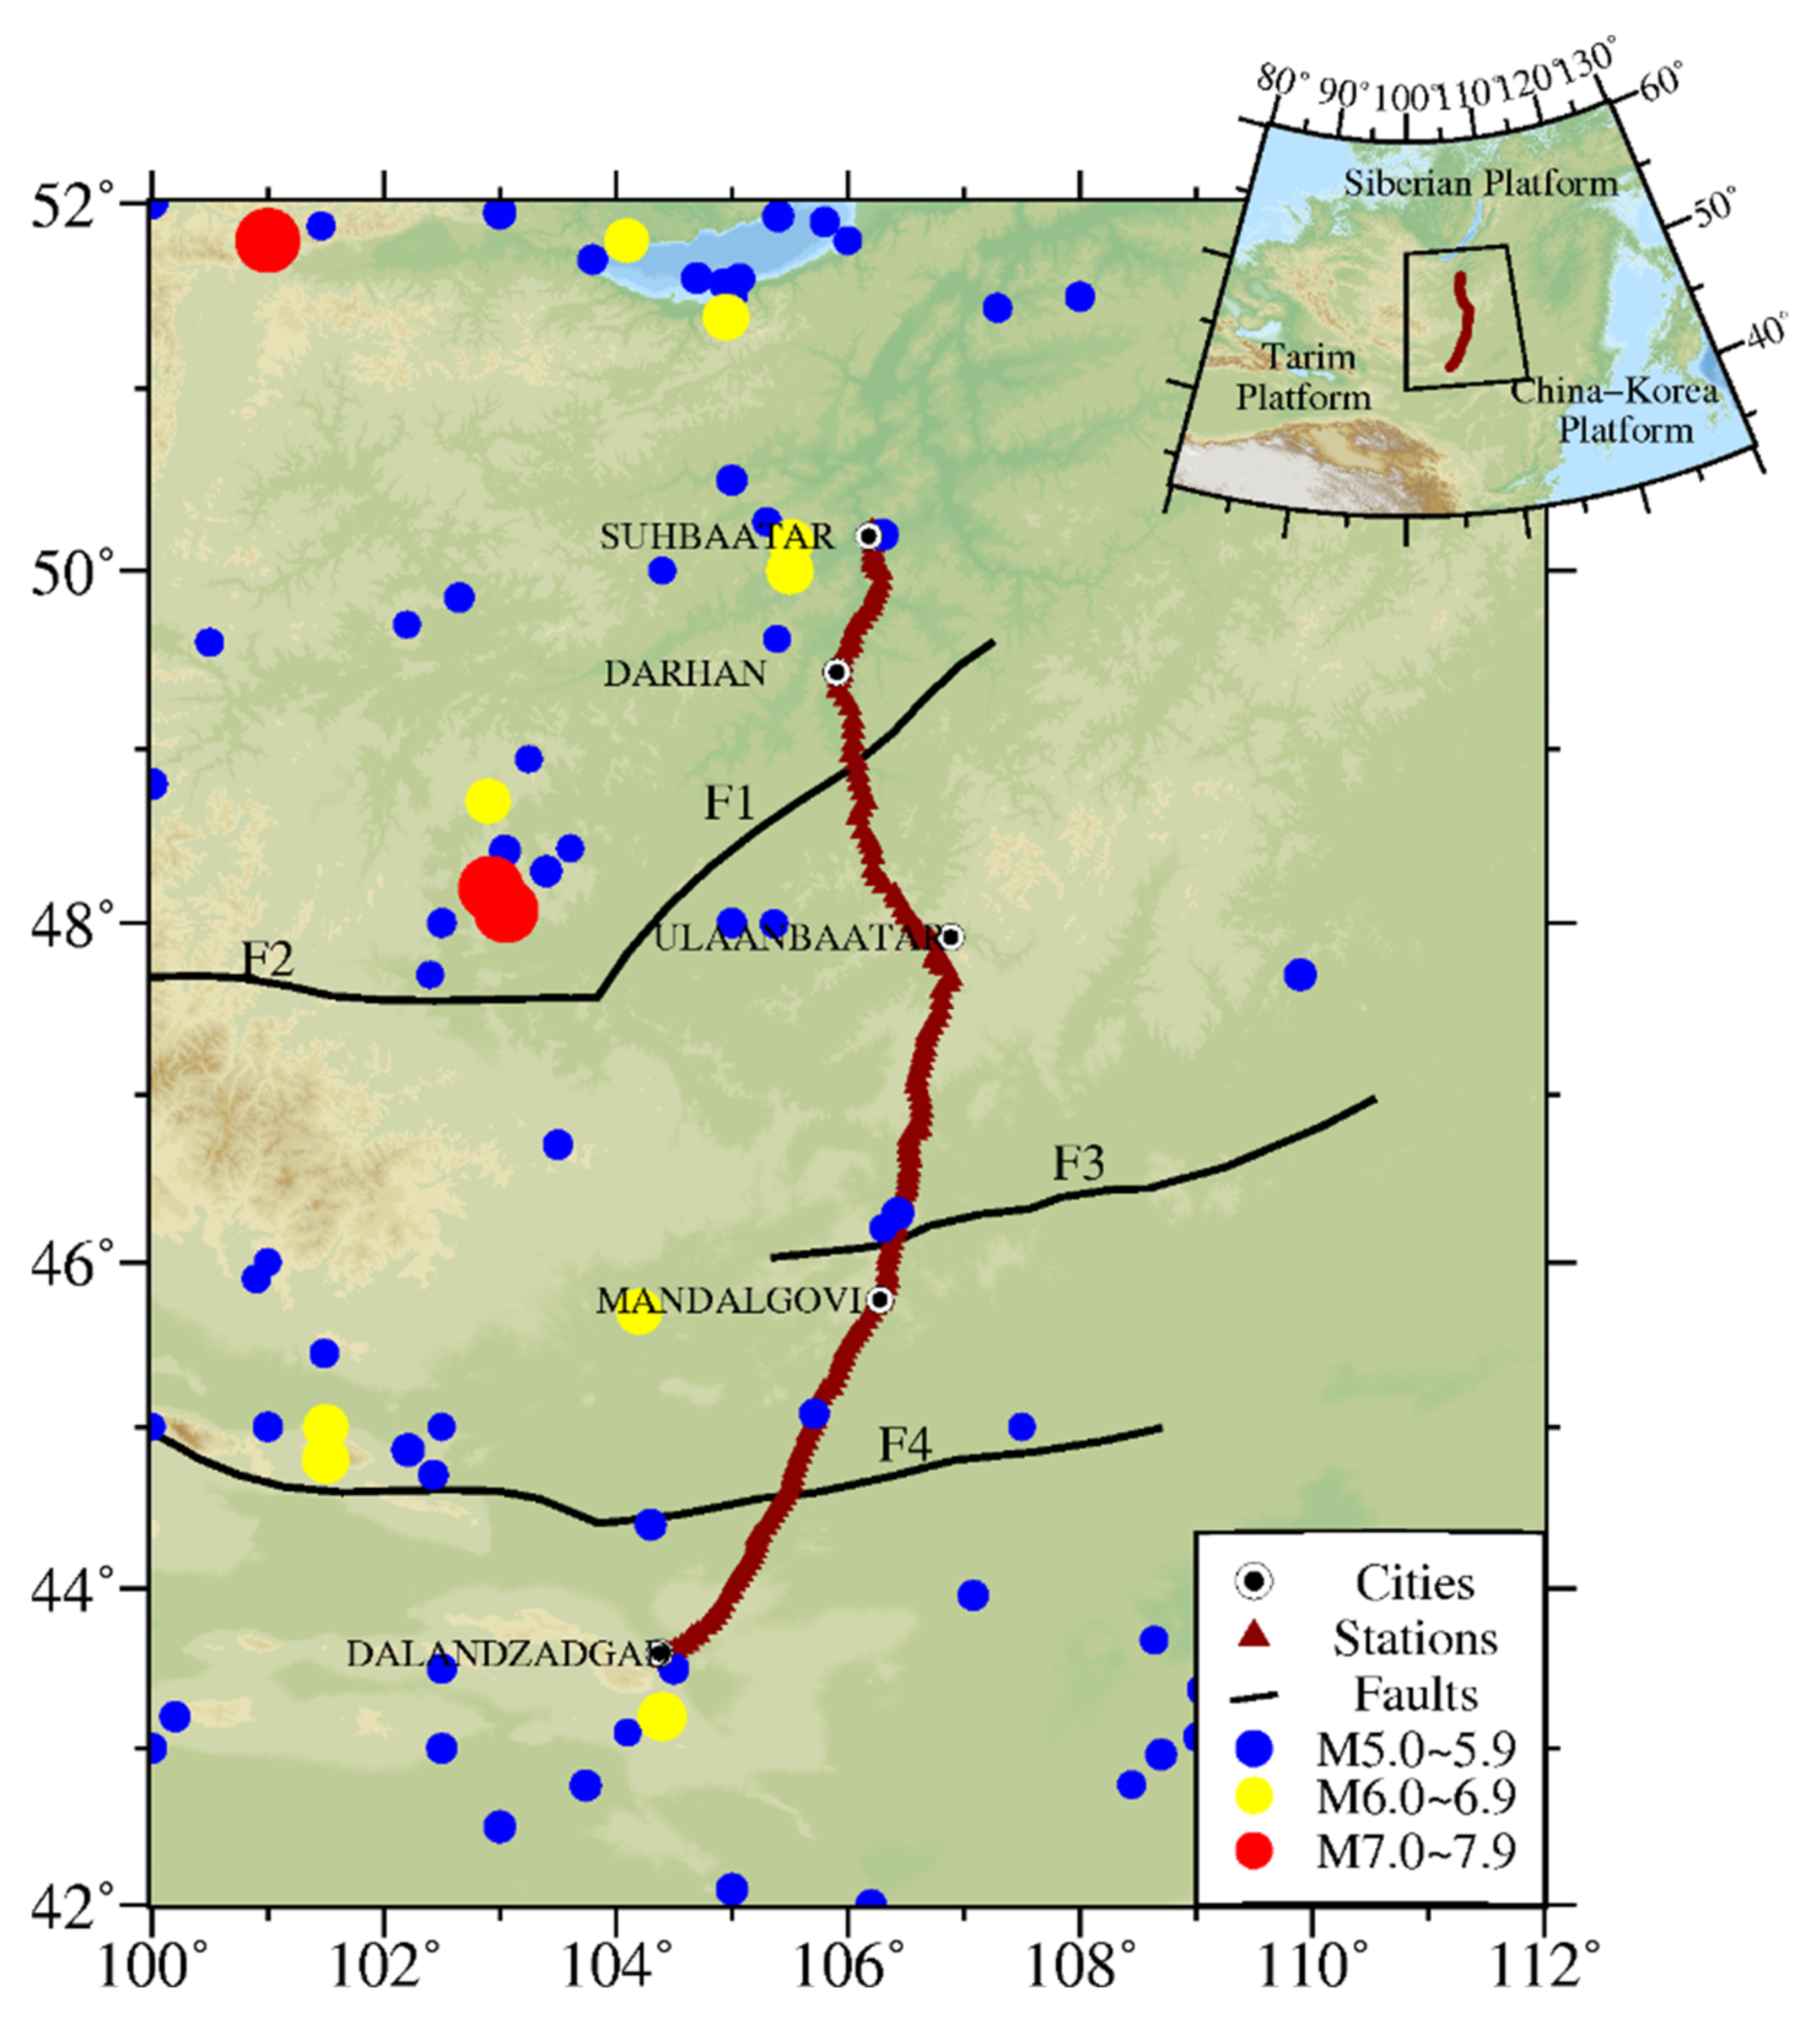
To examine the geophysical characteristics of faults and sedimentary structures in this area, comprehensive geophysical profiles perpendicular to the strike of these faults and sedimentary structures are designed. Based on the analysis of geological data and field investigation results, a comprehensive geophysical profile with a nearly N—S trend was laid from Suhbaatar to Dalandzadgad in Mongolia, which passes Ulaanbaatar, with a total length of approximately 900 km, as shown in Figure 1.
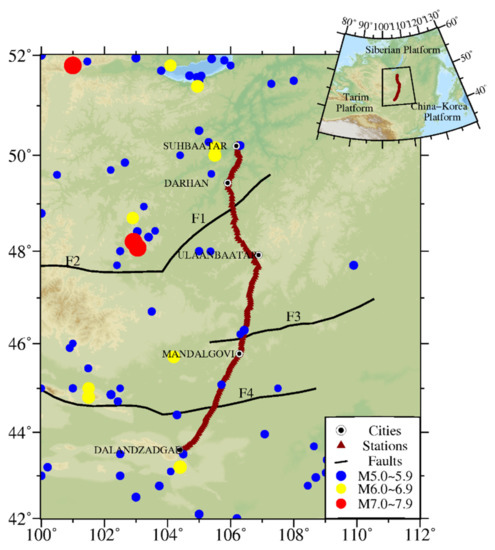
Figure 1.
Geomagnetic stations of the SD profile, seismic activity, and fault distribution in Mongolia. F1 is the Erhun River fault, F2 is the Khangai fault, F3 is the Hanbogdor fault and F4 is the Wenduerhile fault.
A total of 160 geomagnetic observation points were arranged along the SD profile, with the codes from north to south being M001 to M160 and the distance between adjacent points being 5–10 km. When selecting the points, the site environment was examined, and the total geomagnetic intensity gradient was measured. The magnetic field gradient within 10 m of each point was less than 5 nT/m, which basically excludes the surface anomalies at the sites. The observation data reflect the magnetic field values of rocks above the top of the Curie threshold in the lithosphere and exclude the influence of shallow anomalies as much as possible. Additionally, 117 sampling points were selected in the profile, and 5 samples were collected from each point, for a total of 585 rock samples, including 235 samples of sedimentary rocks, 45 samples of metamorphic rocks, and 305 samples of igneous rocks [32].
Geomagnetic measurements were made from July to August 2011. The measurement instrument was a G-856 proton precession magnetometer [33] (http://www.magnetometer.cn/?m=home&c=View&a=index&aid=143, accessed on 22 August 2022), which measures the total magnetic intensity F with a resolution of 0.1 nT and an absolute accuracy of 0.5 nT. Its dynamic range is 20,000 to 100,000 nT, and the sampling rate can be set to 5, 10, or 60 s. At each point, the measurement position of the instrument is 1.5 m above the ground, the sampling rate is at 5 s, and 30 values of F were observed by the proton precession magnetometer. An average value is calculated from every 10 geomagnetic total intensities to obtain 3 average values. During the geomagnetic survey, the Global Positioning System (GPS) was used to measure the longitude, latitude, and elevation of the geomagnetic survey points.
2.2. Acquisition of Lithospheric Magnetic Fields
Based on the composition of the geomagnetic field, the lithospheric magnetic field Fl can be obtained by eliminating the components of the earth’s main magnetic field Fm, inductive magnetic field Fi, ionospheric magnetic field Fe, and magnetospheric magnetic field Fs from the geomagnetic data F0 measured above:
Fl = F0 − Fm − Fi − Fe − Fs
The main components of the inductive magnetic field Fi and magnetospheric magnetic field Fs are rapid changes within a period of hundreds of seconds or shorter. The geomagnetic measurement mode adopted in the SD profile is described as follows: the average value of the total geomagnetic intensity within hundreds of seconds is taken as the measured value of the total geomagnetic intensity. Therefore, the components of the induced magnetic field and magnetospheric magnetic field in the measured value can be disregarded.
The continuous observation data of the Ulaanbaatar Geomagnetic Observatory, Mongolia, were selected as the reference data of ionospheric magnetic Fe variation in the SD profile; the diurnal variation in the measured values at all measuring points was reduced to eliminate the ionospheric magnetic field Fe, and the reduction value F0 of each measuring point was obtained [34]. The reduction time of the diurnal geomagnetic variation is 16:00–18:00 (universal time) on 31 August 2011.
To eliminate the main magnetic field, IGRF-13 was selected as the main magnetic field reference model [35], and the numerical value F13 of each measuring point of the model at the reduction time was calculated. The lithospheric magnetic field Fl can be obtained by subtracting the main magnetic field F13 from the reduction value F0 of each point.
2.3. Decomposition of the Lithospheric Magnetic Field
The upward continuation method is a conventional gravity and magnetic data processing method that mainly highlights deep anomalies. It has an important role in the study of deep structures, the tendency of structures, and the depth of faults. In this paper, the upward continuation method was employed to decompose the lithospheric magnetic field; the specific formula is defined as follows [3]:
Here, ΔT and ΔT′ are the lithospheric magnetic field values before extension and after extension, respectively, in nT; h is the upward continuation height; Xi and Xk are the projection distances of each measuring point, where Xi is given, Xk is variable, and k changes from 1 to 159; and n is the total number of measuring points, that is, n = 160.
The obtained “residual” anomalies can be considered an approximation of local anomalies (caused by shallow materials) by subtracting the anomalies at a certain height from the measured anomalies [11]. The majority of the surface at depths of 0–5 km in most areas is sedimentary rock. Most of the surface at depths of 5–30 km is intrusive rock, and the temperature of most rocks is below the Curie temperature [3]. The rock temperature below 30 km is evaluated to be higher than the Curie temperature of the ferromagnetic material, so it is concluded that the lithospheric magnetic field generated by the rock below 30 km is very weak. Based on these above characteristics, the process of lithospheric magnetic field decomposition by the upward continuation method is described as follows: the lithospheric magnetic field is extended at a height of 30 km, and the obtained magnetic field components reflect the distribution characteristics of the interior, which is referred to as the basement part fb. After subtracting the basement part fb from the lithospheric magnetic field Fl, i.e., Fl–fb, and then extending upwards to a height of 10 km, the obtained lithospheric magnetic field component reflects the characteristics of the magnetic susceptibility and remanent magnetization structure of the medium at a depth of approximately 5–25 km, which is referred to as the middle layer fm. The lithospheric magnetic field Fl is subtracted from the basement part fb and the middle layer fm. The obtained lithospheric magnetic field component reflects the characteristics of the magnetic susceptibility and remanent magnetization structure of the medium from the surface to a depth of approximately 5 km, referred to as the superficial part fs. The lithospheric magnetic field Fl is decomposed into the basement part fb, middle layer part fm, and superficial part fs by the upward continuation method, namely
Fl = fb + fm + fs
3. Results
3.1. Lithospheric Magnetic Field Characteristics of the SD Profile
The results of the diurnal variation reduction show that the standard deviation σ ranges from 0.01 to 0.66 nT, with a mean value of 0.12 nT. We obtain the lithospheric magnetic field Fl of the SD profile by using the method described in Section 2.2. The characteristics of the SD profile are shown in Figure 2.

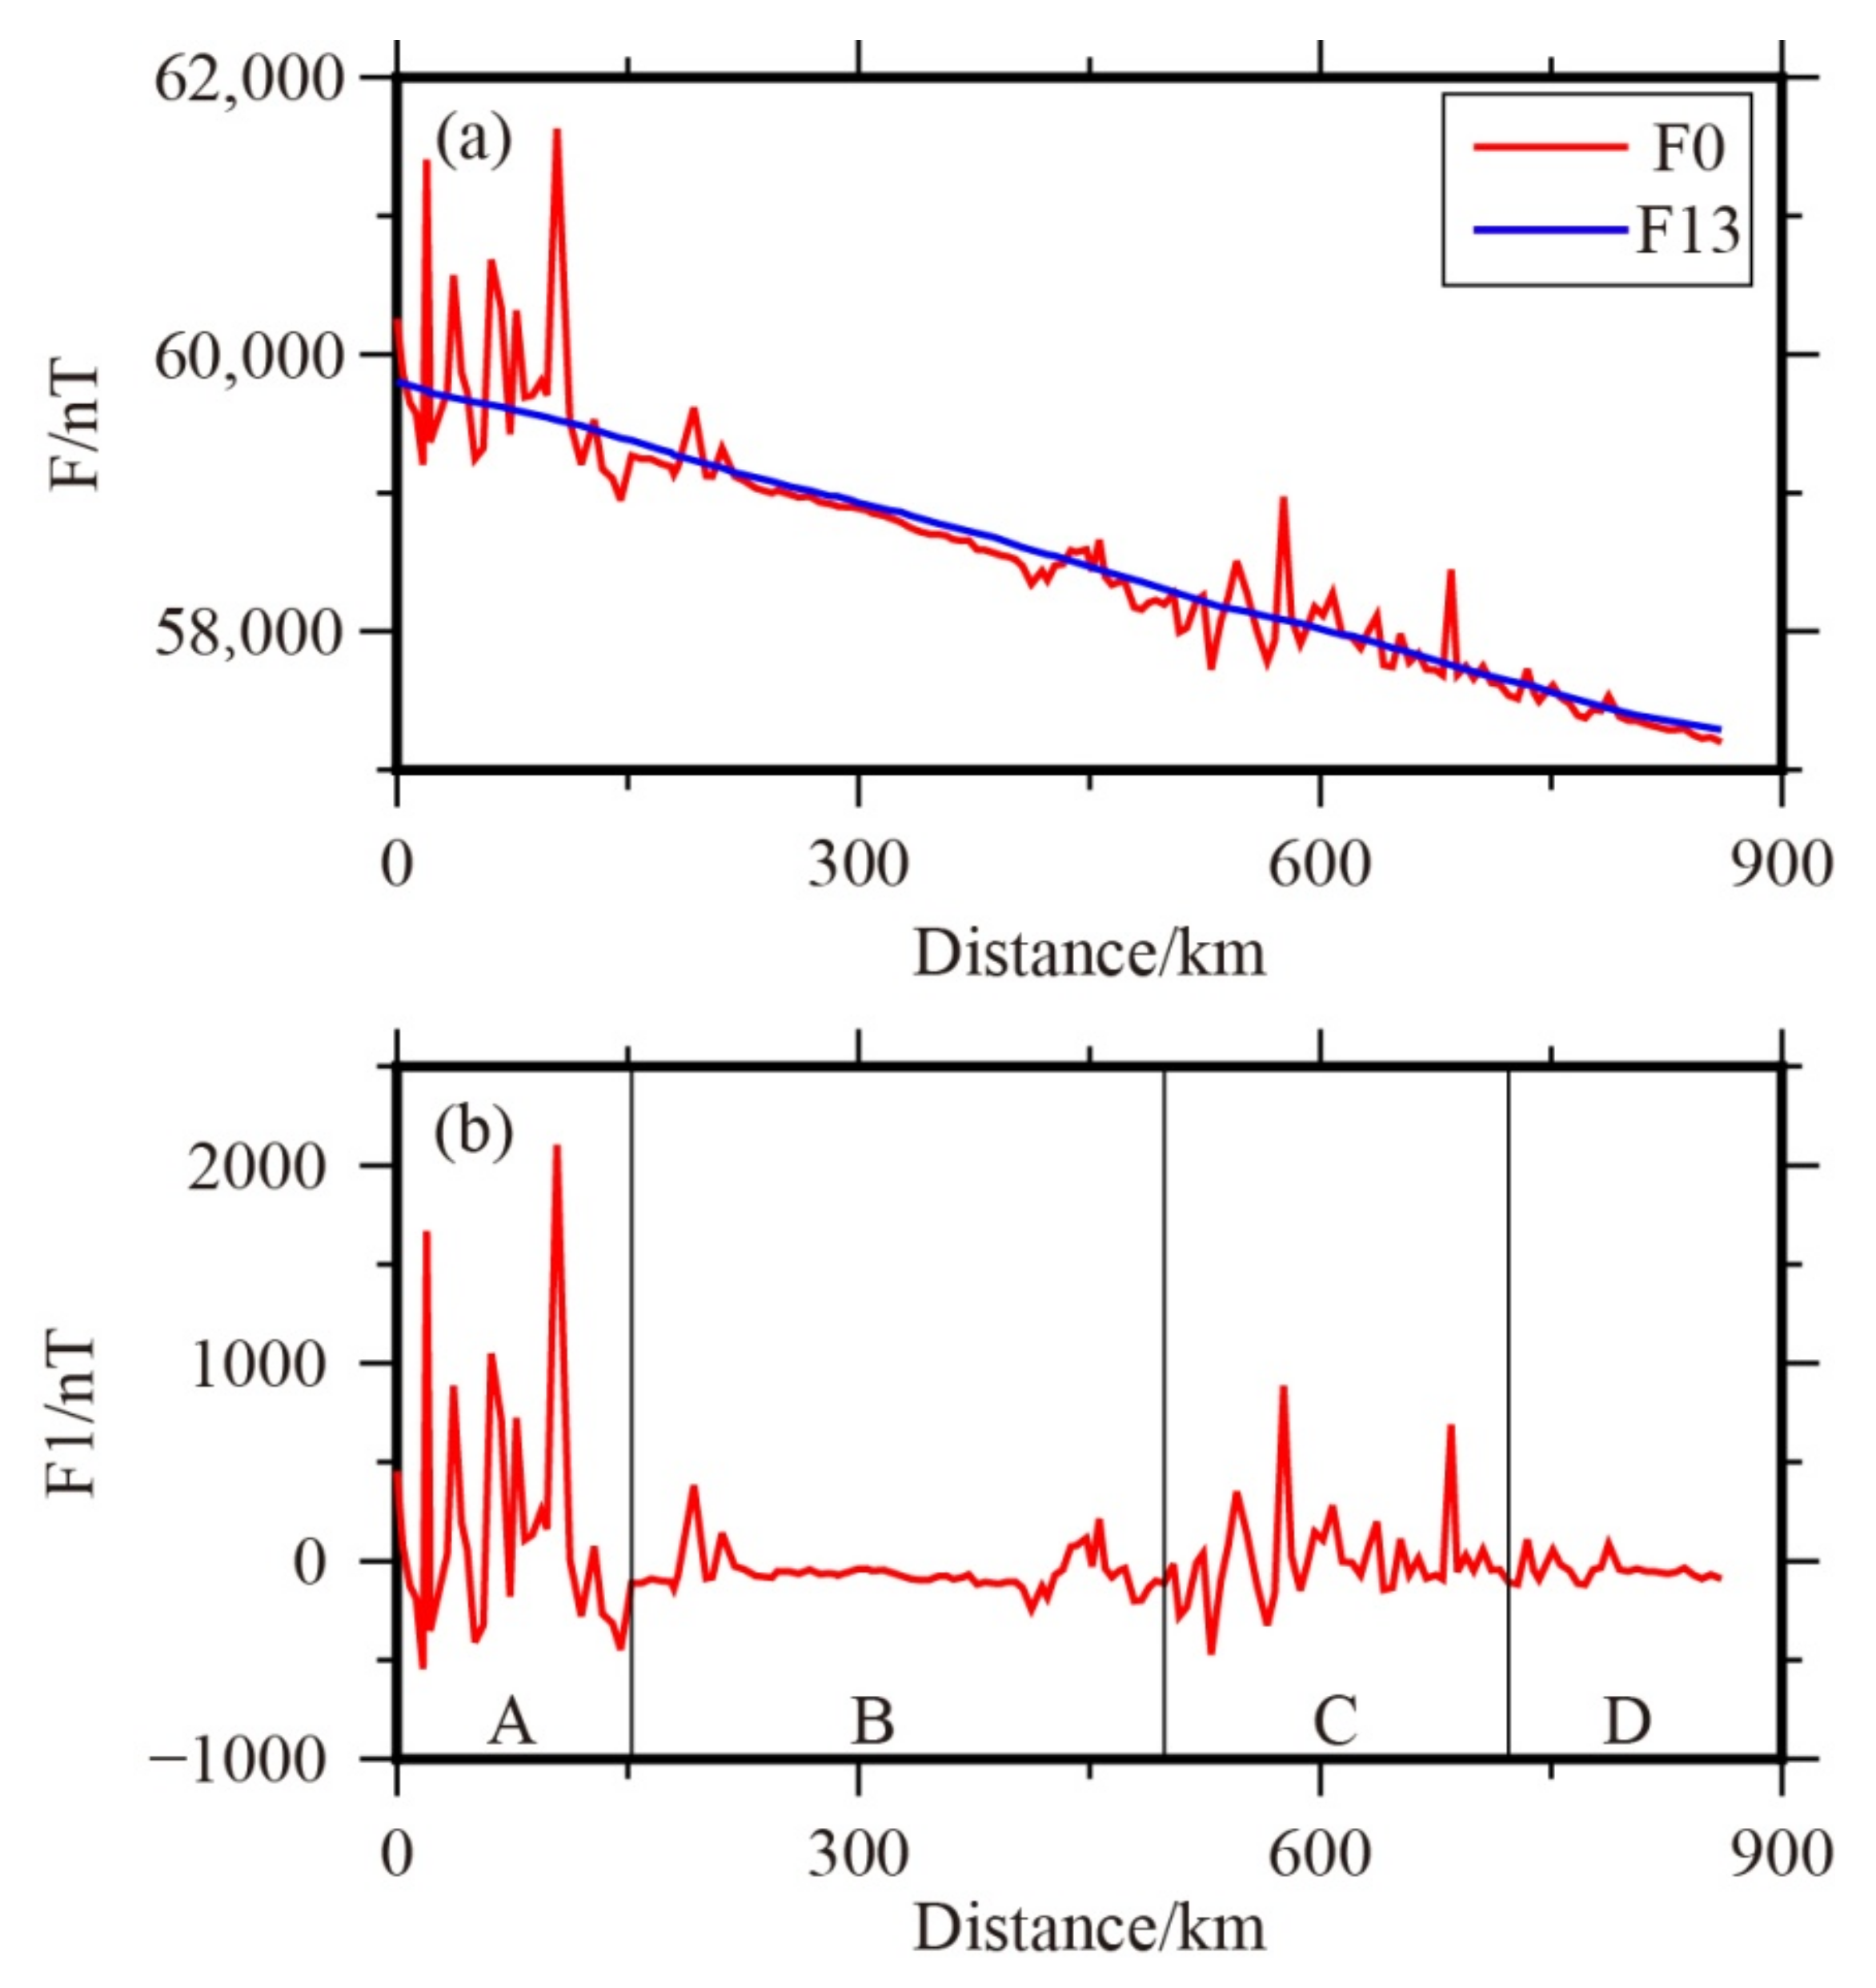
Figure 2.
(a) The distribution of total geomagnetic intensity (F0), IGRF-13 model (F13). (b) Lithospheric magnetic field, region A is the Vitrim orogenic belt, region B is the Erhotsk orogenic belt, region C is the Erguna orogenic belt, and region D is the Southern Mongolia orogenic belt. The meanings of A, B, C, and D are the same in all other figures.
Figure 2a shows the distribution of F0 and F13 of the IGRF-13 model in the SD profile. F13 of the IGRF-13 model is high north of the SD profile and has the maximum value at measurement point M001, F13 = 59,801.8 nT. In the south, F13 is small and has the minimum value at measurement point M160; F13 = 57,289.6 nT. There is a monotonic and nearly linear decreasing trend between the two measurement points. The general value F0 of each measuring point has different fluctuations around this decreasing trend, and some measuring points have larger fluctuations.
Figure 2b shows the Fl distribution of the lithospheric magnetic field in the SD profile. The distribution of lithospheric magnetic field Fl along the SD profile is very uneven. According to its distribution characteristics and structural features, the lithospheric magnetic field can be roughly divided into four regions. From survey points M001 to M031, namely, from Suhbaatar to Bayyangol, labeled region A, the lithospheric magnetic field Fl presents complex local anomalies with a spatial scale of 150 km and a maximum variation range of 2648.1 nT. From measuring points M032 to M094, namely, from Bayyangol to Delgertsgot, labeled region B, Fl exhibits relatively gentle changes. From measuring points M095 to M135, namely, from Delgertsgot to TsGT-Ovoo, labeled region C, Fl has a relatively complex local anomaly pattern with a spatial scale of 220 km and a maximum variation of 1358.2 nT. From measuring points M136 to M160, namely, from TsgT-Ovoo to Dalandzadgad, labeled region D, the Fl in this area exhibits relatively gentle changes.
3.2. The Decomposition Results of the Lithospheric Magnetic Field
We obtain the decomposition results of the SD profile lithospheric magnetic field Fl using the upward continuation method described in Section 2.3. The characteristics of the results are shown in Figure 3.
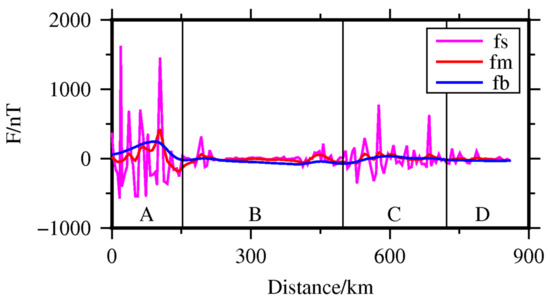
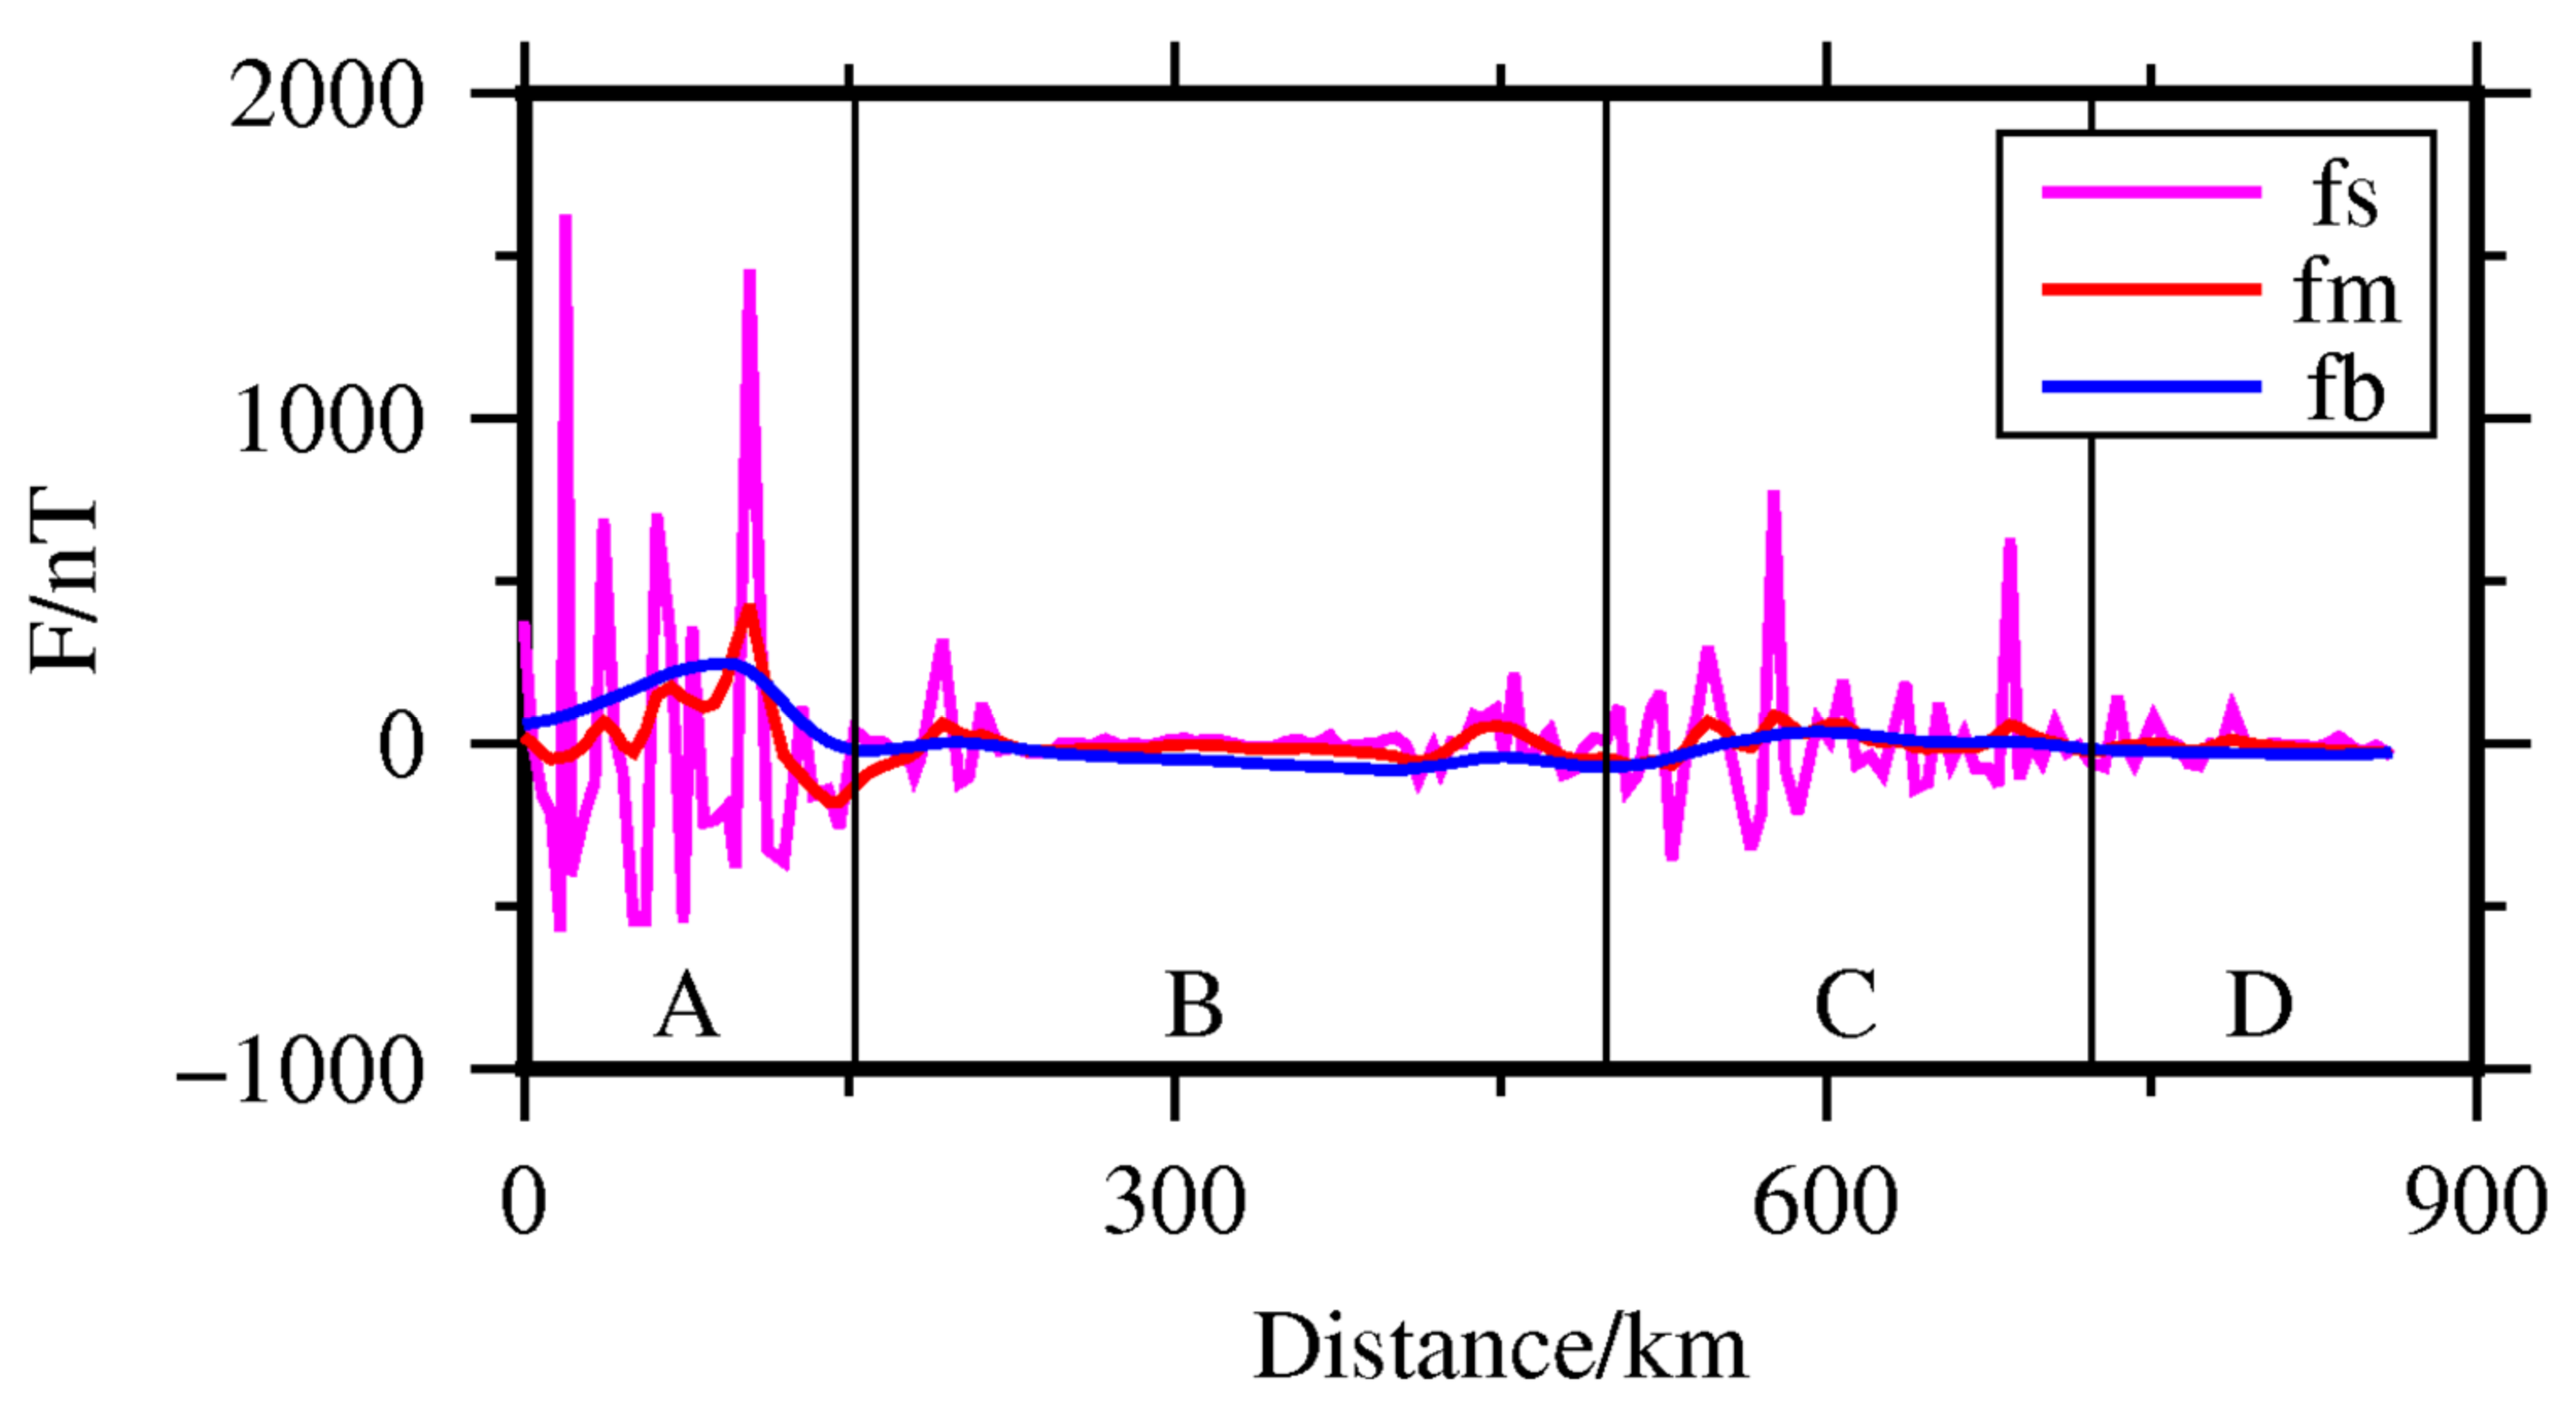
Figure 3.
Decomposition results of the lithospheric magnetic field: basement part fb, middle part fm, and surficial part fs.
Figure 3 shows the decomposition results of lithospheric magnetic field Fl. The basement part fb, the middle layer part fm, and the superficial part fs obtained after the decomposition of the lithospheric magnetic field Fl show significant zoning characteristics, which are basically identical to those of the above lithospheric magnetic field Fl.
The zonal characteristics of fb in the basement part shown in Figure 3 are as follows: In zone A, fb presents a complete upward trend and reaches its maximum value (fb = 246.3 nT) at measuring point M022, with a variation range of 269.5 nT. In zone B, fb shows a slow downward trend and two small peaks with a variation range of 83.5 nT at both ends. In region C, fb shows an upward trend, with a large peak and a small peak and a variation range of 107.6 nT. In zone D, fb shows a gentle decreasing trend, with a decrease of approximately 15.1 nT. The regional characteristics of fm in the middle layer are as follows: In zone A, fm exhibits the most dramatic change, with three peaks, with increases followed by decreases. The maximum value of fm is at M024 (fm = 425.0 nT), and the variation range is approximately 603.4 nT. In zone B, fm exhibits gentle changes, except for two small peaks with a variation range of 153.5 nT at both ends. In zone C, fm exhibits sharp changes, with four peaks and a variation range of 151.3 nT. In the D region, the changes in fm are relatively gentle, with a variation range of 39.8 nT.
As shown in Figure 3, the zoning characteristics of fs in the superficial parts are described as follows: In zone A, fs exhibits the most dramatic changes, with six large, sharp peaks, and reaches the maximum value at measuring point M006, fs = 1623.7 nT, with a variation range of 2201.0 nT. In region B, fs exhibit gentle changes, with a range of 441.3 nT, except for small changes at both ends. In zone C, fs exhibits sharp changes, with 8 peaks and a variation range of 1134.5 nT. In region D, fs has a small change of 215.1 nT.
Based on the above results, Table 1 shows the maximum and minimum values of Fl and fb in the basement, fm in the middle layer, and fs on the superficial surface of the SD profile in each partition. The distribution characteristics of each region in the SD profile are shown intuitively in this table.

Table 1.
The maxima and the minima of Fl, fb, fm, and fs in the four regions A, B, C, and D (unit: nT).
3.3. Comprehensive Information on the SD Profile
According to lithospheric magnetic anomalies, regional geological structures, remanent magnetization, magnetic susceptibility, seismicity, and lithology, we obtain the comprehensive comparison map shown in Figure 4.
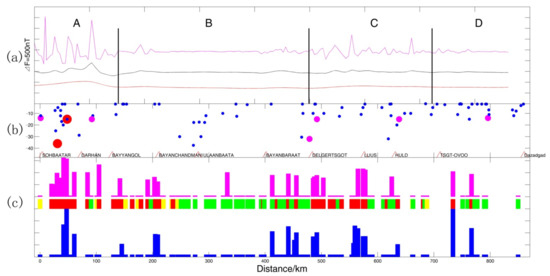
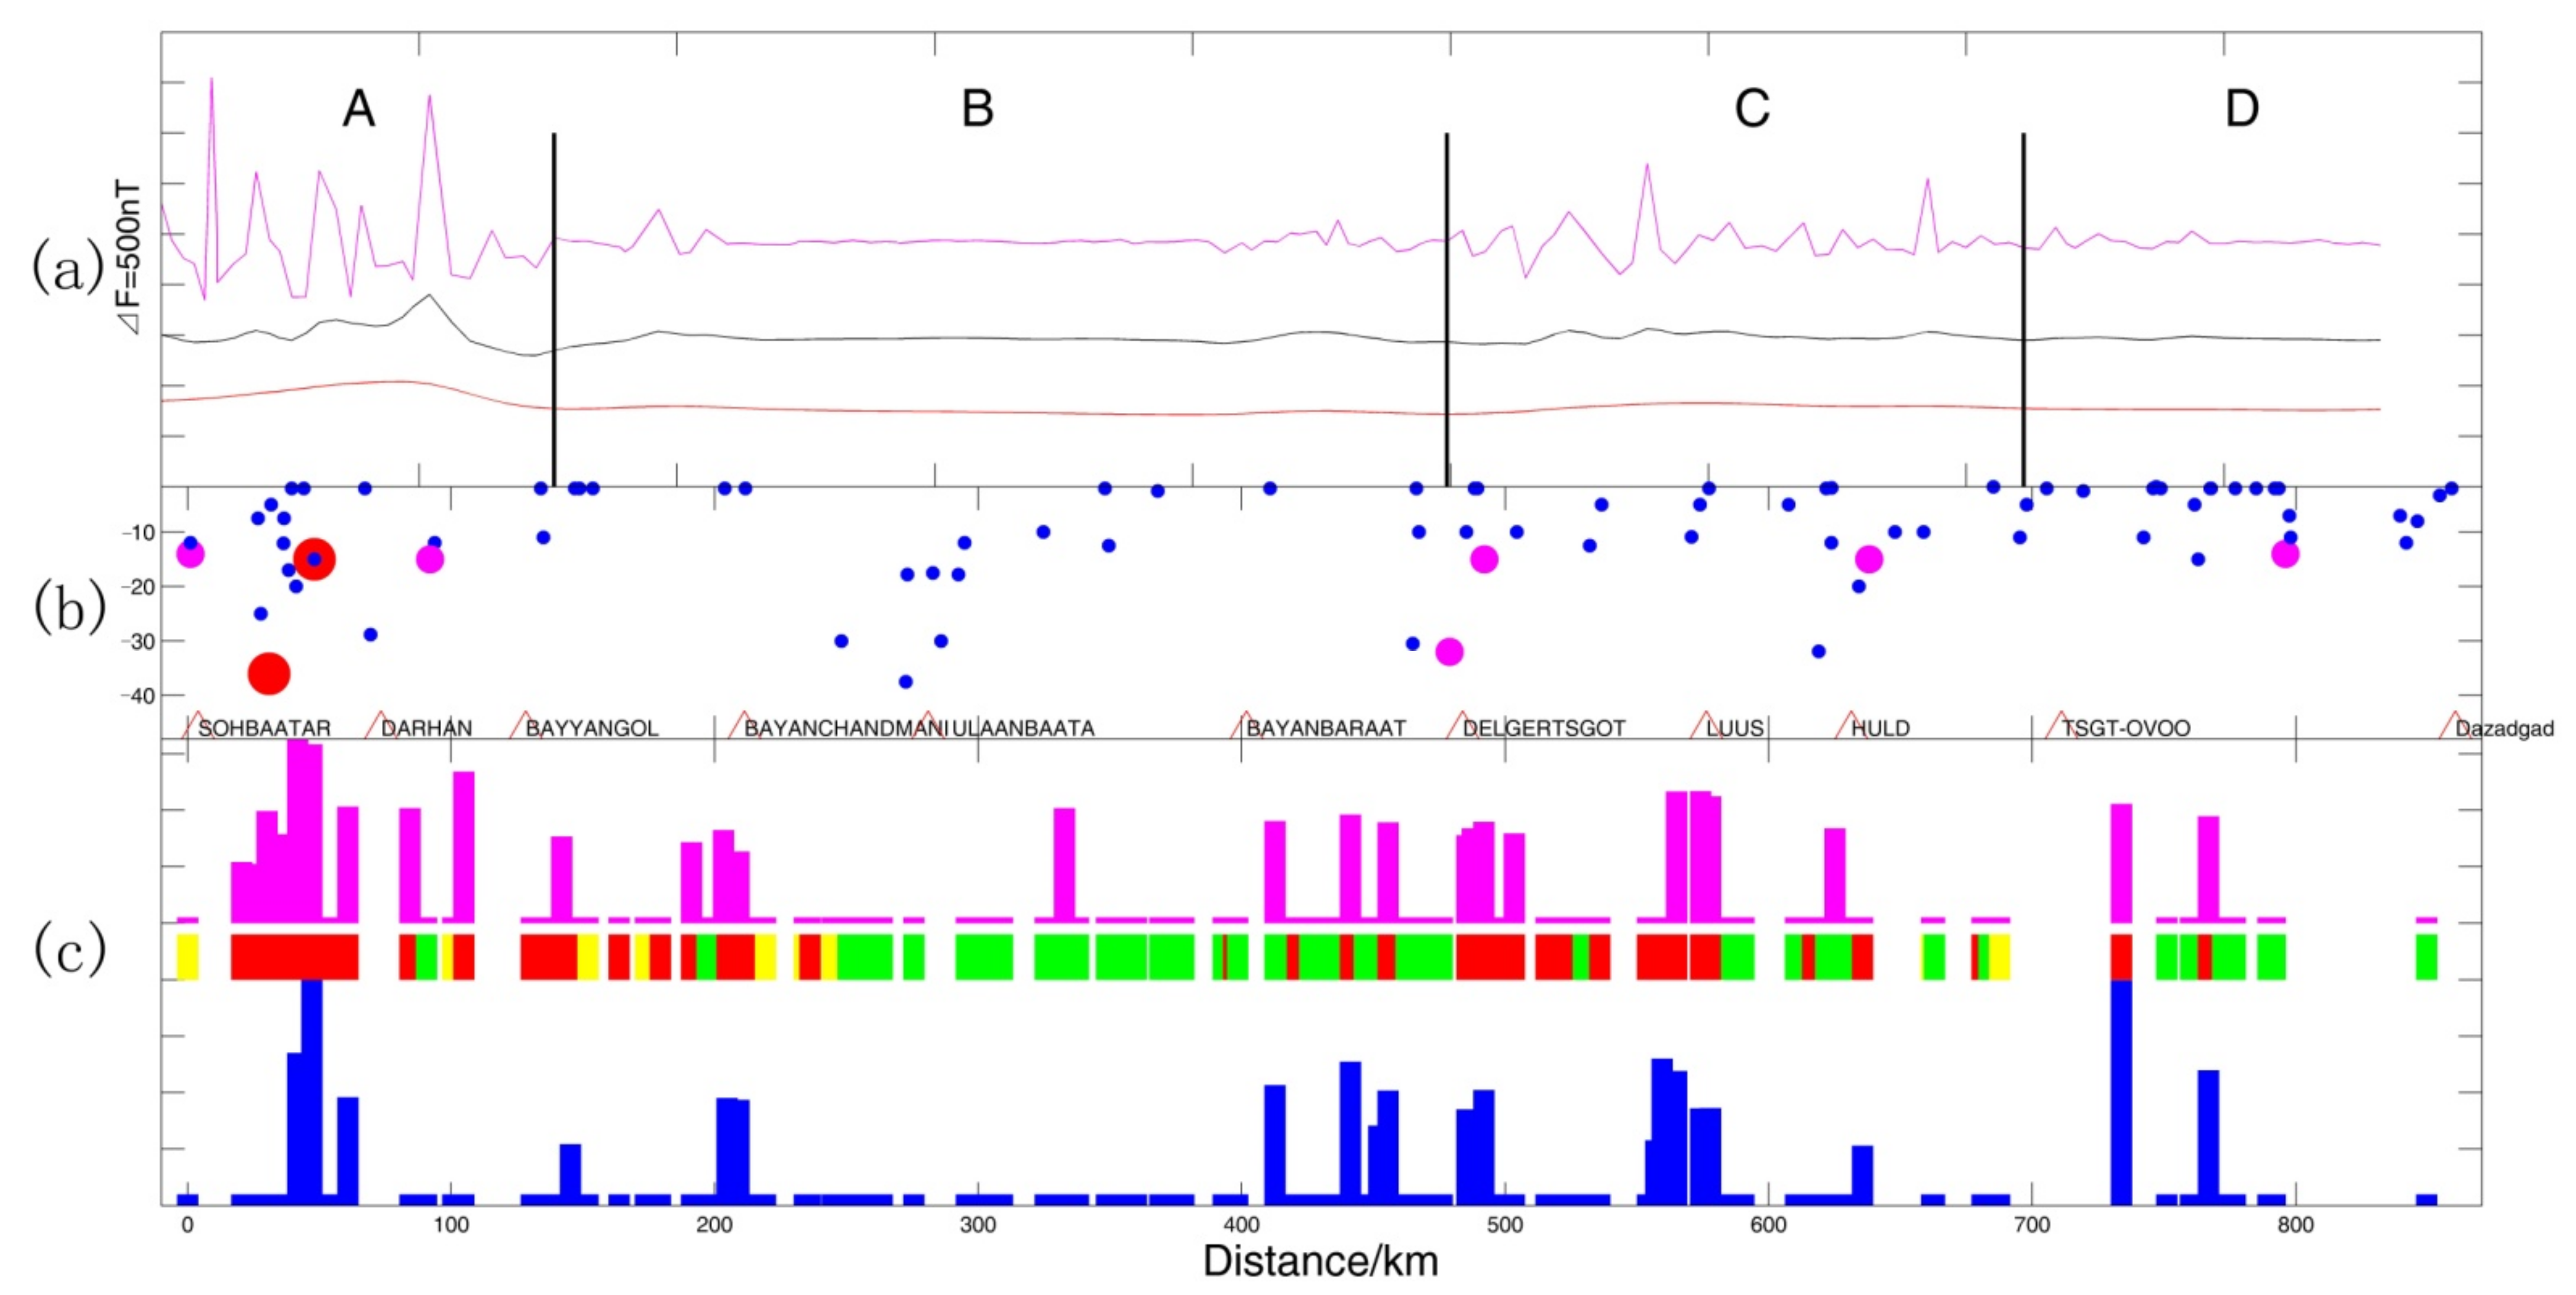
Figure 4.
Comparison of comprehensive information on geophysics, geological structure, and other aspects along the SD profile in Mongolia. (a) The decomposition characteristics of the lithospheric magnetic field. The pink curve, black curve, and red curve represent the superficial surface part fs, middle layer part fm, and basement part fb, respectively. (b) The solid circle displays the size and depth of earthquakes within 100 km of the SD profile: The solid red circles, solid pink circles, and solid blue circles represent earthquakes with magnitude 6 or higher, earthquakes with magnitude 5–6, and earthquakes with magnitude 3–5, respectively. The red triangles indicate cities. (c) The lithology, magnetic susceptibility, and remanent magnetization of rock samples. The pink and blue columns represent the magnetic susceptibility and remanent magnetization values of the rock samples, respectively. The red column, green column, and yellow column represent magmatic rocks, sedimentary rocks, and metamorphic rocks, respectively.
Figure 4 shows comprehensive information about the geophysics and geological structure of the SD profile, including the three parts (basement fb, middle layer fm, and superficial fs) derived from lithospheric magnetic field decomposition, as well as the lithology, magnetic susceptibility and remanent magnetization of rock samples, and the distribution of seismic activity. In Figure 4, the distribution of the lithospheric magnetic field decomposition parts, the seismic activity, and the magnetic susceptibility and remanent magnetization of rock samples along the SD profile are shown from top to bottom.
In area A, the most and strongest earthquakes occurred. There were two earthquakes with a magnitude of 6 or higher and two with a magnitude of 5–6. The magnetic susceptibility and remanent magnetization of the rock samples are generally relatively high. In contrast, in area B, small earthquakes with a magnitude of 3–5 have occurred, the magnetic susceptibility and remanent magnetization of the rock samples are generally low, and the lithologies are dominantly sedimentary. However, in area B near area A, where the lithospheric magnetic field changes are sharp, the magnetic susceptibility and remanent magnetization of the rock samples are also high, and the lithologies are igneous or metamorphic. In area B, near area C, the magnetic susceptibility and remanent magnetization of the rock samples are also high. The rock samples are igneous or sedimentary, and the variation in the lithospheric magnetic field is uneven. In area C, there are also a high number of earthquakes, with 3 earthquakes with magnitude 5–6, and the magnetic susceptibility and remanent magnetization of the rock samples are generally high. On the whole, in area C, magmatic rocks dominate in the north, while sedimentary rocks become more common in the south. Due to Quaternary coverage, the number of collected rocks is low. In area D, there were also numerous earthquakes with a magnitude of 3–5 and one with a magnitude of 5–6. Due to Quaternary coverage, the number of rock samples and the magnetic susceptibility and remanent magnetization of rock samples are generally low. The lithologies are mainly sedimentary.
For a more comprehensive analysis and comparison, detailed parameters in the divided areas of the SD profile in Mongolia are shown in Table 2, such as the lithospheric magnetic anomalies and structures, remanent magnetization and susceptibility, seismicity, and lithology. The structural names of the four regions, A, B, C, and D, are the orogenic belt of Vitrim, Erhotsk, Erguna, and Southern Mongolia, respectively. From A to D, the basement part fb variation ranges of the lithospheric magnetic field are 269.5 nT, 83.5 nT, 107.6 nT, and 15.1 nT, respectively. The middle layer part fm variation ranges of the lithospheric magnetic field are 603.4 nT, 153.5 nT, 151.3 nT, and 39.8 nT, respectively. The superficial part fs variation range of the lithospheric magnetic field is 2201.0 nT, 441.3 nT, 1134.5 nT, and 215.1 nT, respectively. The remanent magnetization variation range of rock samples are respectively 0.5~34,246, 0.4~1833.7, 0.8~4726.5, and 1.1~33.4, and the unit is 10−3 A/m. The magnetic susceptibility variation ranges of the rock samples are −1.0~11,762, −0.8~4378, −1.3~3275.7, and 10.4~37.6, respectively, and the unit is 10−5 SI. The seismicity and the dominant lithology also have qualitative descriptions.
Table 2.
Comparison of the lithospheric magnetic anomalies and factors such as the regional geological structure, rock remnant magnetization, susceptibility, earthquake activity, and rock properties among the four regions A, B, C, and D.
4. Discussion
The results of the analysis and comparison show that lithospheric magnetic anomalies of the SD profile have different degrees of correlation with the corresponding regional geological structure, lithology, seismic activity, remanent magnetization, and magnetic susceptibility. In area A, with the most earthquakes, the lithospheric magnetic field change is the most abrupt, and the lithologies are dominantly magmatic. In areas C and D, the seismicity is also intense. However, the variation in the lithospheric magnetic field in area D is gentle, and the seismic activity is high in the southernmost part, but the measuring points do not extend to that area. In the measured portion of area D, the Quaternary sedimentary cover is significant, which may explain why the variation in the lithospheric magnetic field is not higher.
Based on the characteristics of the superficial fs in combination with the location of metamorphic rocks among the rock samples, the superficial fs of the SD profile has large magnetic anomalies 60 km south of the dividing line between regions A and B and 50 km north of the dividing line between regions B and C. There are some metamorphic rocks present in this location. The magnetic susceptibility and remanent magnetization values of the samples are also high in this location. Therefore, we conclude that the dividing line between regions A and B should be moved approximately 50–60 km to the south, or that the depth of the associated deep fault should be moved by this distance to the south. Additionally, the dividing line between regions B and C should be moved approximately 50 km north, or the depth of the associated deep fault should be moved northwards by this distance. However, more information is needed to be certain of this viewpoint.
Seismicity has been observed in relation to lithospheric magnetic anomalies in seismically and tectonically active zones. A. I. Gorshkov et al. employed the morphostructural zoning missing space method in combination with the World Digital Magnetic Anomaly Map (WDMAM) International Scientific Project to obtain lithospheric magnetic anomaly data in the region of Altai-Sayan-Baikal [36]. Their results show that the locations of strong earthquakes are related to the geological structure and lithospheric magnetic anomalies in the region [37,38]. The Altai-Sayan-Baikal region is located on the northwest boundary of the SD profile. The results of this research have guiding significance for understanding the magnetic structure, geological structure, and seismicity of the SD profile. Therefore, it is necessary to analyze the relationship between the characteristics of lithospheric magnetic anomalies and their changes and earthquakes in seismomagnetic research.
The upward continuation data processing method is used here to decompose lithospheric magnetic anomalies into the basement fb, middle layer fm, and superficial fs portions as an approximation of the anomalies at different depths underground. The attenuation rate of shallow-source anomalies is faster than deep-source anomalies after upward continuation, but the data from upward continuation cannot perfectly reflect the anomalies at different depths. Notably, large surface anomalies undoubtedly affect the results of upward continuation. In the field survey process, we strictly measured the gradient around the site. The environmental magnetic field gradient at each site was small, greatly reducing the possibility of involving large superficial anomalies. The obtained results do not affect our approximate estimation of the magnetic properties of the deep rocks, and they facilitate the inversion of the magnetic susceptibility of underground media. The results are also based on the basic assumptions that the distribution characteristics of crustal rocks and the depth of the Curie interface are approximately 30 km. The effect of the equivalence principle is also disregarded in the upward continuation method here. It is very difficult to accurately separate the sources of lithospheric magnetic fields at different depths. To obtain the possible magnetic field distribution of sources at different depths, accurate ground surveys and aeromagnetic results at different heights should be combined with the characteristics of the geological structure. In addition, great efforts should be made to investigate further aspects of rock magnetism, such as the Curie temperatures and ferromagnetic materials obtained at high pressures. Such research would be very helpful for separating the sources at different depths and represents an important direction for future research.
5. Conclusions
The total geomagnetic intensity was measured in the SD profile of Mongolia. The absolute accuracy of the instrument used for the measurements is better than 0.5 nT. The mean standard deviation σ value of 160 geomagnetic measurement points after diurnal variation reduction is 0.12 nT. The spatial distribution and magnetic anomaly characteristics of the lithospheric magnetic field in the SD profile are calculated and analyzed. The lithospheric magnetic field is decomposed into three components, namely, the basement, middle layer, and shallow surface, by the upward continuation method. This information is combined with the regional geological structure, seismicity, and collected rock sample lithologies. It is found that the lithospheric magnetic field distribution of the SD profile has a certain relationship to the geological structure, rock lithology, seismic activity, natural remanent magnetization, and magnetic susceptibility. The results show that there are obvious zoning characteristics. The shallow rock lithology is mainly magmatic in the area where the lithospheric magnetic field anomalies change dramatically. The magnetic susceptibility and remanent magnetization of the collected rock samples in this area are high, the earthquake magnitude and number are high, and the geological structure is complex. This region corresponds to the Vitrim orogenic belt and Erguna orogenic belt. However, in the area with gentle variation in lithospheric magnetic field anomalies, the shallow rock lithology is mainly sedimentary rock, and the collected rock magnetic susceptibility and remanent magnetization values are low. This region corresponds to the Erhotsk orogenic belt and Southern Mongolia’s orogenic belt.
The spatial distribution of the lithospheric magnetic field is also related to the depth and position of faults. The lithospheric magnetic anomalies can be used as a reference for the location and depth of faults. The variation in the lithospheric magnetic field in the region of the Southern Mongolia orogenic belt is gentle. Still, the seismic activity is high, which is not consistent with the characteristics of other regions. This region is widely covered by Quaternary sedimentary rocks, which may explain the gentle variation in the lithospheric magnetic field. These issues are important directions for further research.
Author Contributions
Data curation, J.Y., Z.W. and C.W.; Formal analysis, J.Y. and C.S.; Funding acquisition, Z.G.; Investigation, J.Y. and C.X.; Methodology, J.Y., C.S. and B.C.; Project administration, J.Y.; Writing—original draft, J.Y. All authors have read and agreed to the published version of the manuscript.
Funding
This work was supported by the Special Fund of the Institute of Geophysics, China Earthquake Administration (grant number DQJB22B20, DQJB21X26) and the National International Science and Technology Cooperation project of China (grant number 2011DFB20210).
Institutional Review Board Statement
Not applicable.
Informed Consent Statement
Not applicable.
Data Availability Statement
The data presented in this study are available on request from the corresponding author.
Acknowledgments
We thank the researchers of the China Earthquake Administration and Institute of Astronomy and Geophysics, Mongolian Academy of Sciences, for collecting the geomagnetic observation data in the field.
Conflicts of Interest
The authors declare no conflict of interest.
References
- Dunlop, D.J.; Ozdemir, O. Rock Magnetism Fundamentals and Frontiers; Cambridge University Press: Cambridge, UK, 1997. [Google Scholar]
- Xu, W. Geomagnetism; Earthquake Press: Beijing, China, 2003. [Google Scholar]
- Guan, Z. Geomagnetic Field and Magnetic Force Search; Geological Press: Beijing, China, 2005. [Google Scholar]
- Mörner, N. The lithospheric geomagnetic field: Origin and dynamics of long wavelength anomalies. Phys. Earth Planet Int. 1986, 44, 366–372. [Google Scholar] [CrossRef]
- Langel, R.; Hinze, W. The Magnetic Field of the Earth’s Lithosphere; Cambridge University Press: New York, NY, USA, 1998. [Google Scholar]
- Xu, W. Thre-dimensional survey and comprehensive modeling of geomagnetic field. Prog. Geophys. 2007, 22, 1035–1039. [Google Scholar]
- Thébault, E.; Purucker, M.; Whaler, K.A.; Langlais, B.; Sabaka, T.J. The magnetic field of the Earth’s lithosphere. Space Sci. Rev. 2010, 155, 95–127. [Google Scholar] [CrossRef]
- Ferré, E.C.; Kupenko, I.; Martín-Hernández, F.; Ravat, D.; Sanchez-Valle, C. Magnetic sources in the Earth’s mantle. Nat. Rev. Earth Environ. 2021, 2, 59–69. [Google Scholar] [CrossRef]
- Ganiyu, S.A.; Badmus, B.S.; Awoyemi, M.O.; Akinyemi, O.D.; Olurin, O.T. Upward continuation and reduction to pole process on aeromagnetic data of Ibadan Area, South-Western Nigeria. Earth Sci. Res. 2013, 2, 66–73. [Google Scholar] [CrossRef]
- Aji, W.; Wahyudi, E.J.; Simanjuntak, S.D.; Belia, S. Simple forward calculation study for anomaly response simulation and geomagnetic data transformation in Karangsambung Area. J. Phys. Conf. Ser. 2022, 2243, 012030. [Google Scholar] [CrossRef]
- Xiong, G. Some problems concerning the transformation of gravity and magnetic anomalies in prognosis of ore resources II. The effect and problems of upward continuation. Geophys. Geochem. Explor. 1992, 16, 358–364. [Google Scholar]
- Xiong, G. Some problems concerning the transformation of gravity and magnetic anomalies in prognosis of ore resources III. The relationship between the height of upward continuation and the depth of investigation. Geophys. Geochem. Explor. 1992, 16, 452–455. [Google Scholar]
- Li, X.; Guo, H.; Han, S.; Liu, H.; Zheng, Q. The application of aeromagnetic three-component upward continuation to recognizing physical parameters of geological body. Geophys. Geochem. Explor. 2019, 43, 881–891. [Google Scholar]
- Badarch, D.; Tsermaa, B. Estimation of tectonic fault systems of mongolian territory using geomagnetic anomaly data. Conf. Proc. 2019, 2019, 1–5. [Google Scholar]
- Wang, Z.; Chen, B.; Yuan, J.; Yang, F.; Jia, L.; Wang, C. Localized geomagnetic field anomalies in an underground gas storage. Phys. Earth Planet. Inter. 2018, 283, 92–97. [Google Scholar] [CrossRef]
- Wang, Z.; Yuan, J.; Chen, B.; Chen, S.; Wang, C.; Mao, F. Local magnetic field changes during gas injection and extraction in an underground gas storage. Geophys. J. Int. 2019, 217, 271–279. [Google Scholar] [CrossRef]
- Zhang, Y.; Gu, Z.; Huang, Y.; Zhang, M.; Gu, C.; Wang, L.; Xu, R. Geomagnetic observation and analysis in the juncture region of the Jiangsu-Shandong-Henan-Anhui provinces and the south Yellow Sea region. Earthquake 2009, 29, 133–140. [Google Scholar]
- Ni, Z.; Chen, S.; Yuan, J.; Yi, W.; Wang, C. Research on anomalies variation of lithosphere magnetic field before and after Lushan MS7.0 earthquake. J. Seismol. Res. 2014, 37, 61–65. [Google Scholar]
- Gu, C.; Zhang, Y.; Xu, R.; Wang, L. Analysis of the variation characteristic in the lithospheric geomagnetic field before and after earthquakes. Prog. Geophys. 2010, 25, 472–477. [Google Scholar]
- Gu, C.; Zhang, Y.; Gu, Z.; Wang, X.; Wang, L.; Xu, R.; Zhu, Z. Relationship between zero-value-line of abnormal geomagnetic field in lithosphere and strong-moderate earth quake epicenters in north China seismic region. Northwest. Seismol. J. 2012, 34, 174–179. [Google Scholar]
- Lei, Y.; Jiao, L.; Chen, H. Possible correlation between the vertical component of lithospheric magnetic field and continental seismicity. Earth Planets Space 2018, 70, 179. [Google Scholar] [CrossRef]
- Taylor, P.T.; Kim, R.H.; Kutina, J.; Johnson, G.L. Geohazard assessment from satellite magnetic data modeling with examples from the Arctic Margin along the Canada Basin and the Korean Peninsula along 40 N (latitude) parallel. Earth Planets Space 2008, 60, 497–503. [Google Scholar] [CrossRef]
- Cunningham, D. Active intracontinental transpressional mountain building in the Mongolian Altai: Defining a new class of orogen. Earth Planet Sci. Lett. 2005, 240, 436–444. [Google Scholar] [CrossRef]
- Xiong, X.; Shan, B.; Wang, J.; Zheng, Y. Small-scale upper mantle convection beneath the Mongonia-Baikal rift zone and its geodynamic significance. Chin. J. Geophys. 2010, 53, 1594–1604. [Google Scholar] [CrossRef]
- Chen, W. Introduction of geological structures and distribution of gold metallogenetic zone in Mongolia. Gansu Geol. 2009, 18, 41–47. [Google Scholar]
- Wang, H.; He, G.; Zhang, S. The geology of China and Mongolia. Earth Sci. Front. 2006, 13, 1–13. [Google Scholar]
- Diao, F.; Xiong, X.; Zheng, Y.; Hsu, H.Z. Crustal strain field of the Mongolia-Baikal rift zone and its geodynamic implications. Prog. Geophys. 2009, 24, 1243–1251. [Google Scholar]
- Wang, S.; Pei, S.; Xu, G.; Gao, A. Pn velocity structure at the uppermost mantle of Mongolia and neighboring regions. Chin. J. Geophys. 2013, 56, 4106–4112. [Google Scholar]
- Chen, B.; Yuan, J.; Wang, L.; Xu, R.; Ni, Z.; Gu, Z.; Feng, L. Geomagnetic field over Mongolia for 2010.0 epoch using spherical cap harmonic method. Chin. J. Geophys. Sci. J. China Univ. Geosci. 2014, 39, 1927–1932. [Google Scholar]
- Chen, S.; Wang, Q. Gravity anomalies and distributions of inhomogeneous masses in the crust of Mongolia and its surrounding regions. Chin. J. Geophys. 2015, 58, 79–91. [Google Scholar]
- Zhang, F.; Wu, Q.; Grand, S.P.; Li, Y.; Gao, M.; Demberel, S.; Ulziibat, M.; Sukhbaatar, U. Seismic velocity variations beneath central Mongolia: Evidence for upper mantle plumes? Earth Planet. Sci. Lett. 2017, 459, 406–416. [Google Scholar] [CrossRef]
- Yang, T.; Gao, J.; Gu, Z.; Baatarkhuu, D.; Batsaihan, T. Basic petrophysical properties of rocks from the Suhbaatar-Ulaanbaatar-Dalandzadgad geophysical profile in Mongolia. Geophys. Geochem. Explor. 2014, 38, 943–948. [Google Scholar]
- Zhan, Z.; Gao, J.; Zhao, C.; Zhang, H.; Shen, W. G-856 proton precession magnetometer and its application in field seismomagnetic survey. Northwest. Seismol. J. 2000, 22, 74–78. [Google Scholar]
- Wang, Z.; Wang, C.; Dong, C. Analysis of changes in magnetic anomalies in the largest underground gas storage area in China. Geomagn. Aeron. 2021, 61, 1251–1262. [Google Scholar] [CrossRef]
- IAGA Working Group V-MOD. International geomagnetic reference field: The eleventh generation. Geophys. J. Int. 2010, 183, 1216–1230. [Google Scholar] [CrossRef]
- Lesur, V.; Hamoudi, M.; Choi, Y.; Dyment, J.; Thébault, E. Building the second version of the World Digital Magnetic Anomaly Map (WDMAM). Earth Planets Space 2016, 68, 1–13. [Google Scholar] [CrossRef]
- Soloviev, A.A.; Gorshkov, A.I.; Soloviev, A.A. Application of the data on the lithospheric magnetic anomalies in the problem of recognizing the earthquake prone areas. Fiz. Zemli 2016, 52, 30–36. [Google Scholar] [CrossRef]
- Gorshkov, A.I.; Soloviev, A.A. Recognition of earthquake-prone areas in the Altai-Sayan-Baikal region based on the morphostructural zoning. Russ. J. Earth Sci. 2021, 21, ES1005. [Google Scholar] [CrossRef]
Publisher’s Note: MDPI stays neutral with regard to jurisdictional claims in published maps and institutional affiliations. |
© 2022 by the authors. Licensee MDPI, Basel, Switzerland. This article is an open access article distributed under the terms and conditions of the Creative Commons Attribution (CC BY) license (https://creativecommons.org/licenses/by/4.0/).