
Study of an Atmospheric Refractivity Estimation from a Clutter Using Genetic Algorithm


Abstract
:Featured Application
Abstract
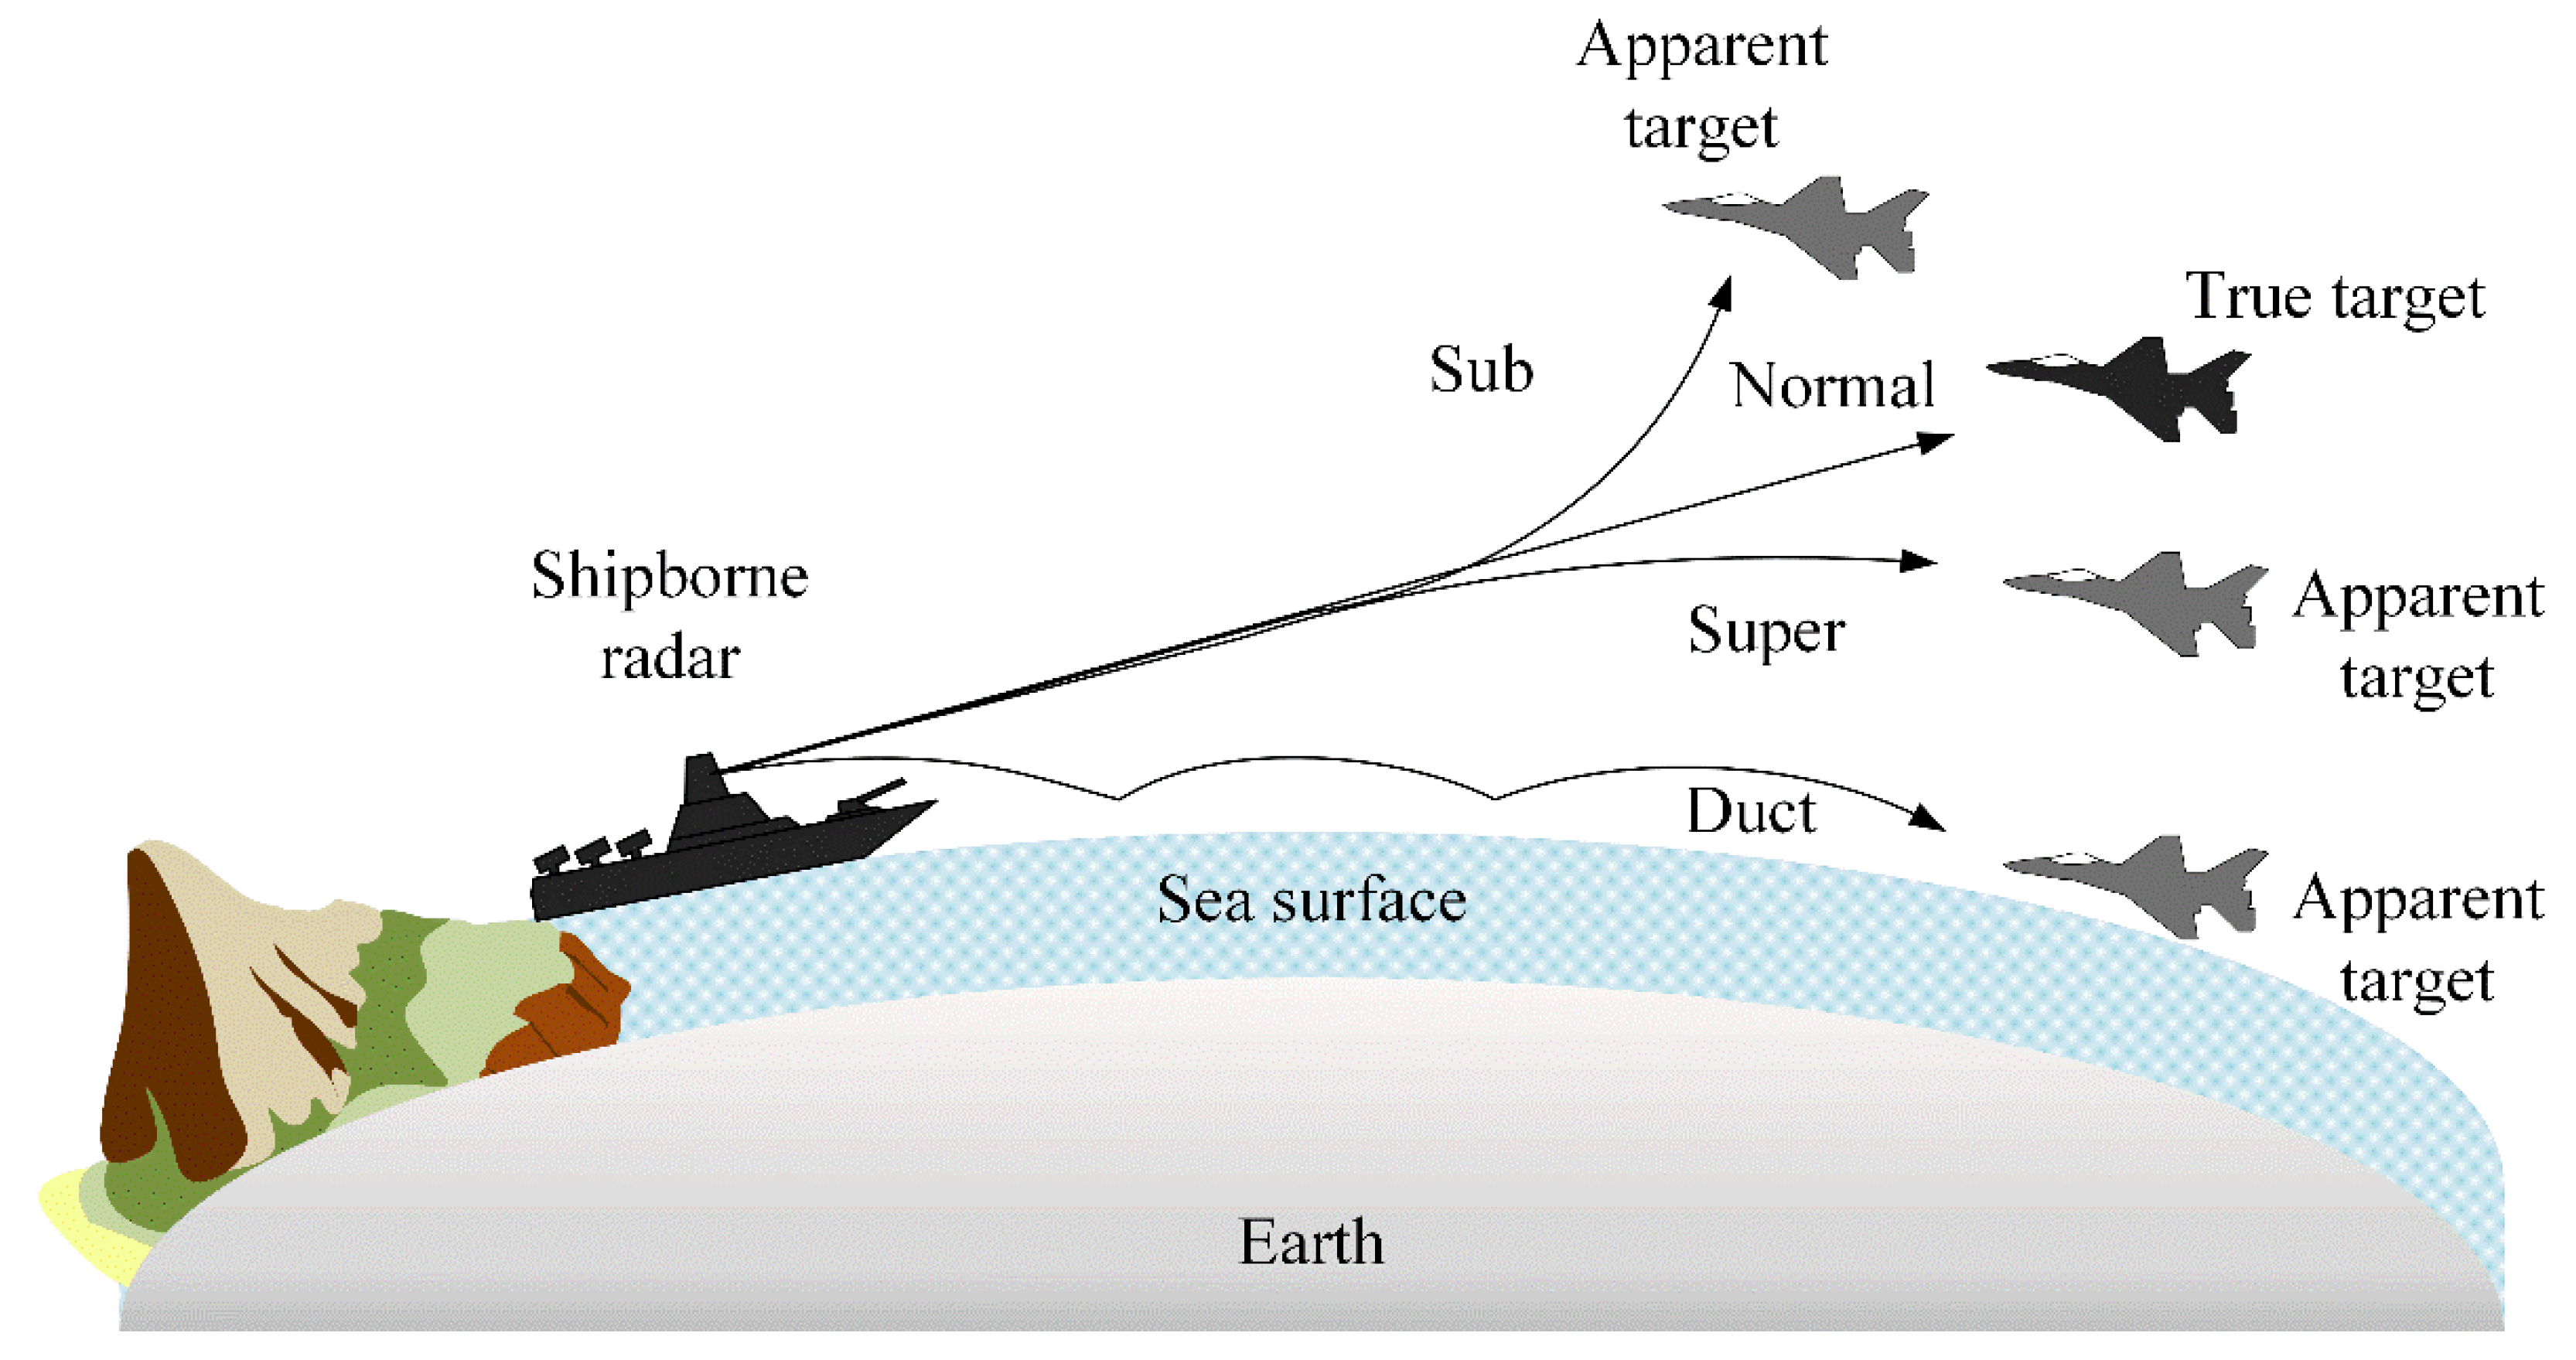
1. Introduction
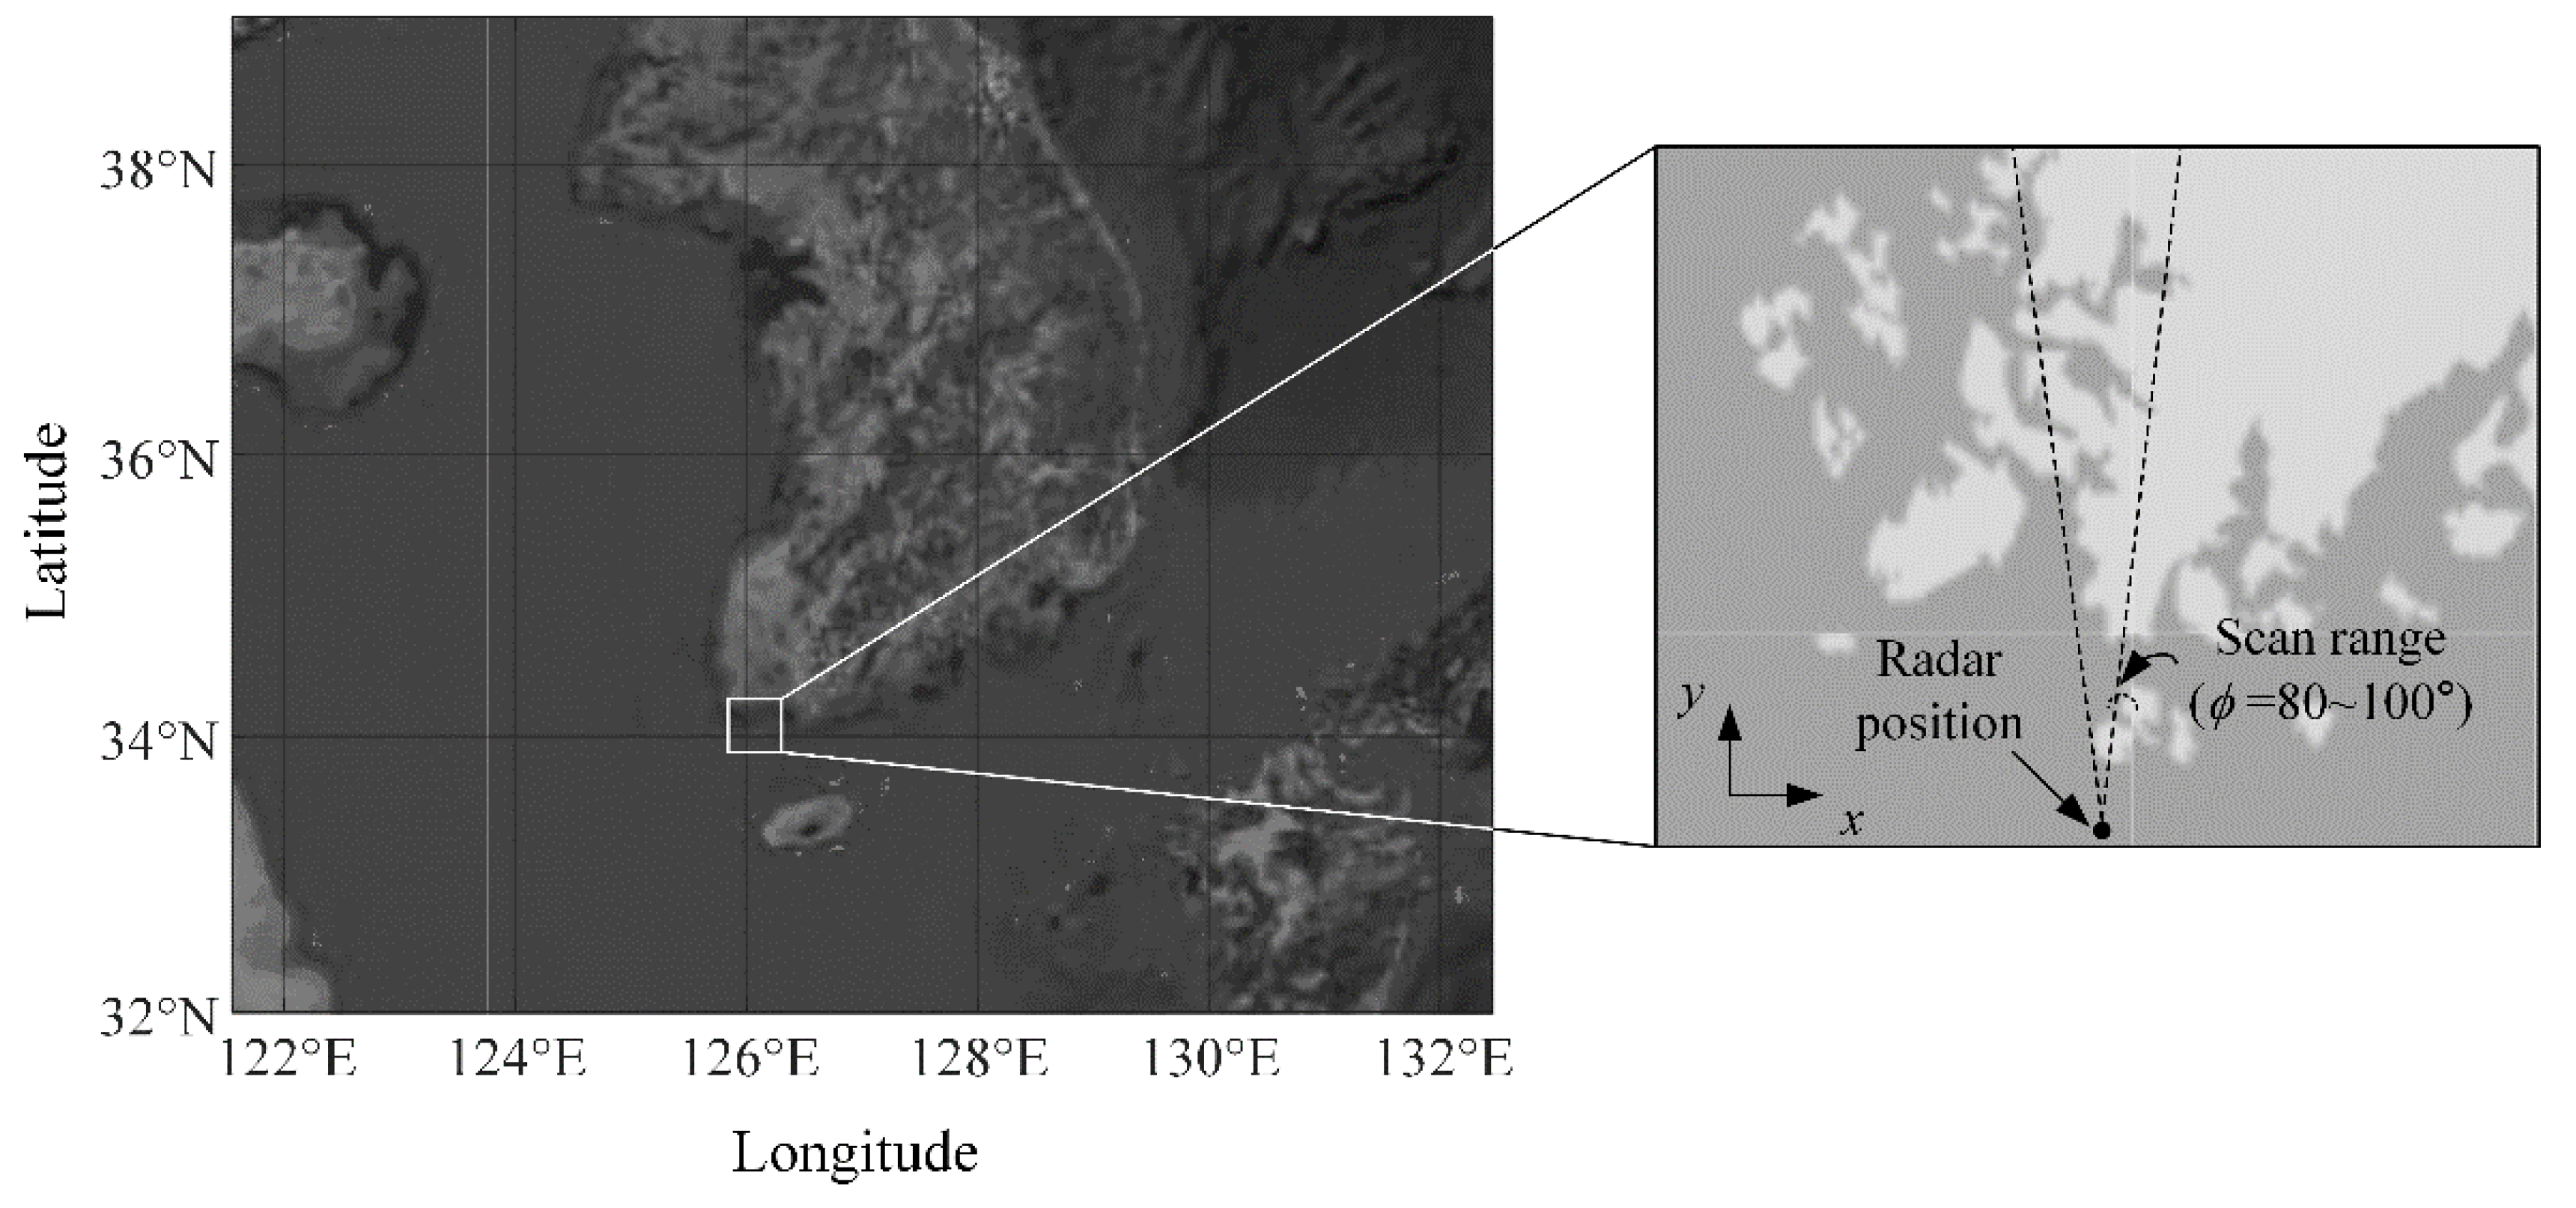
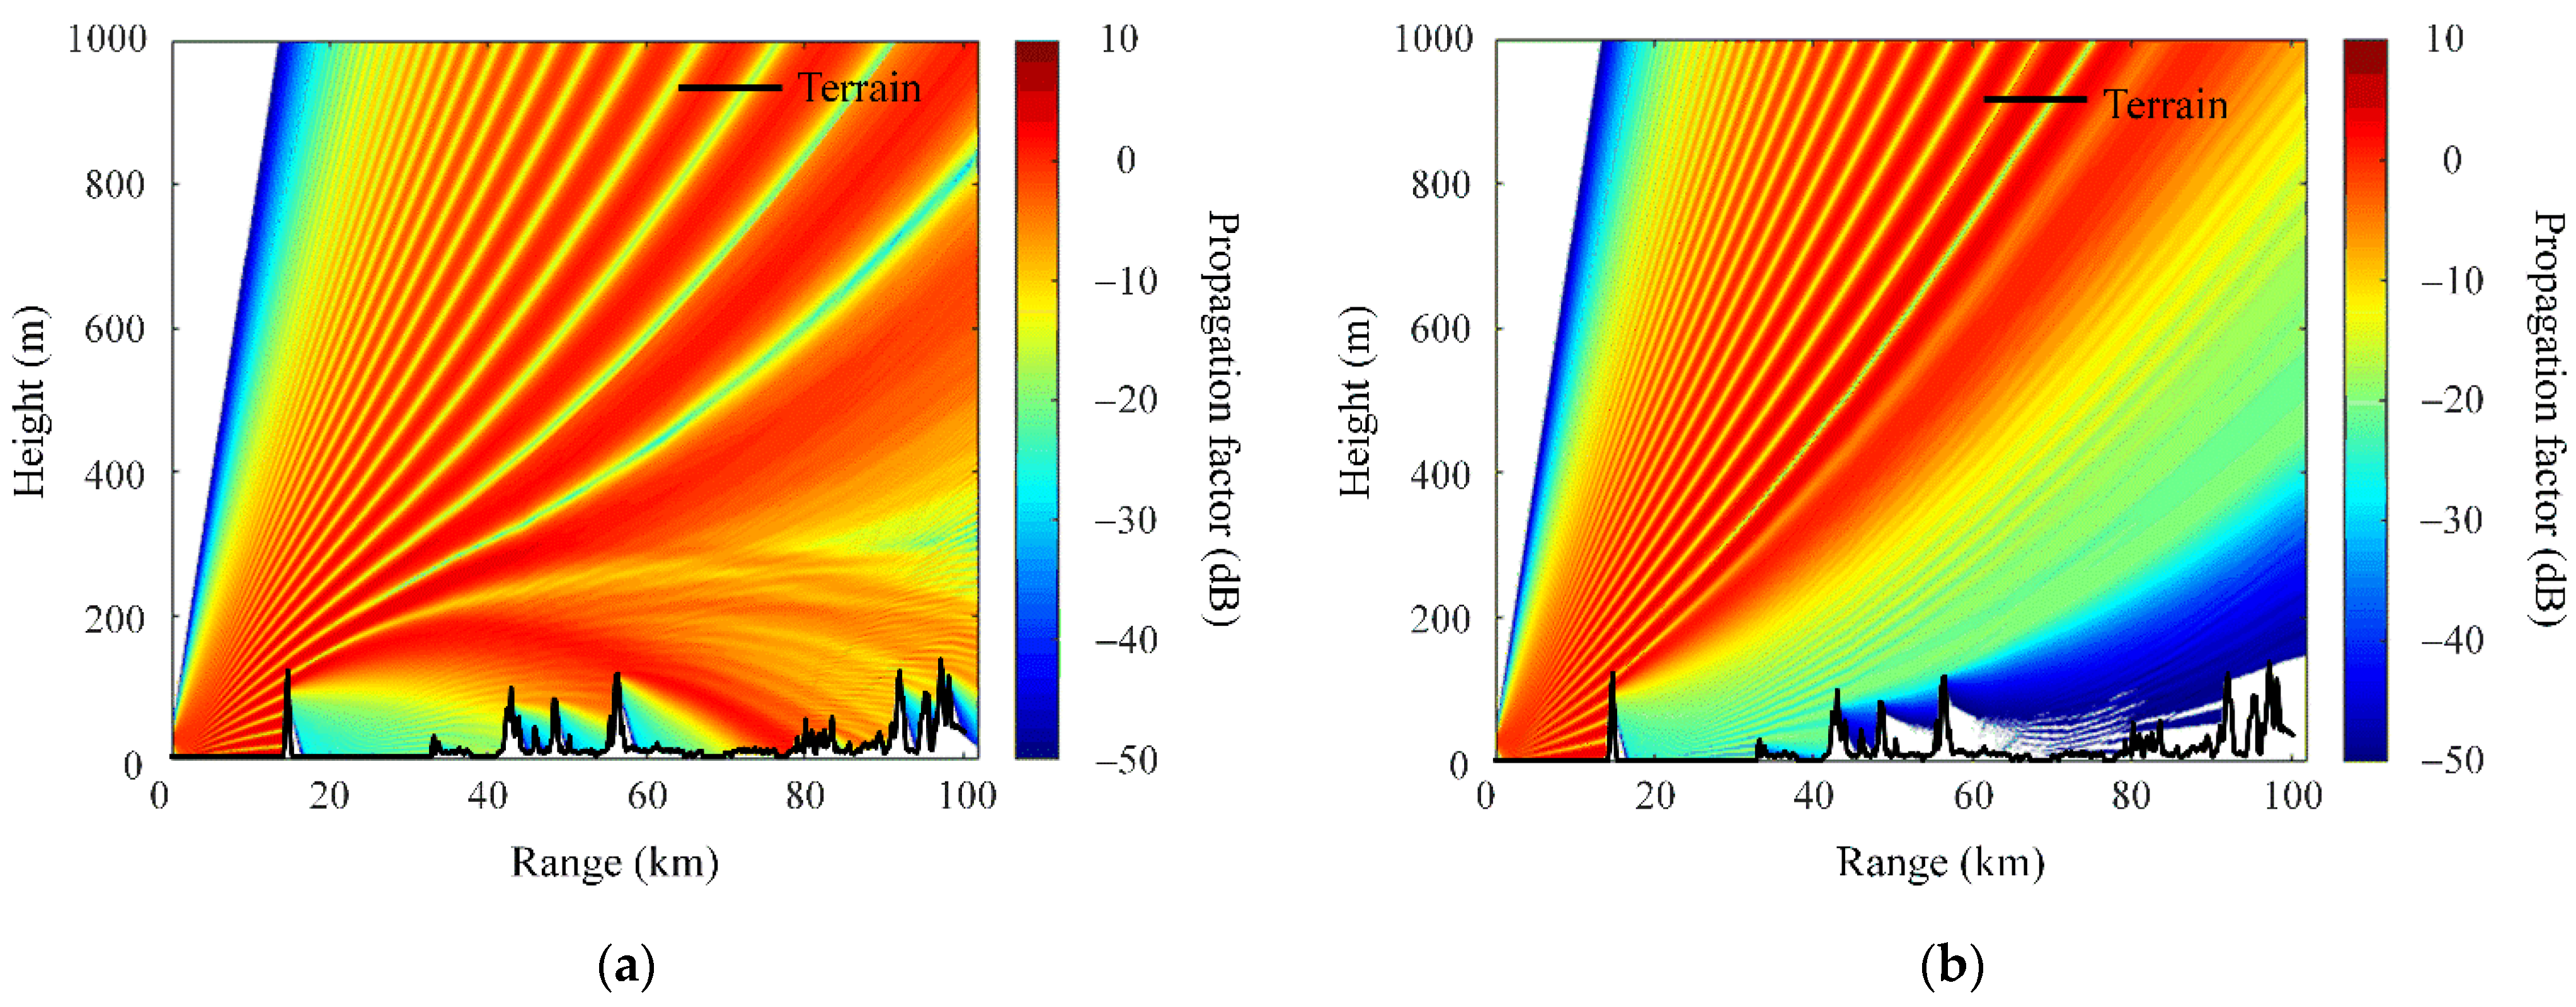
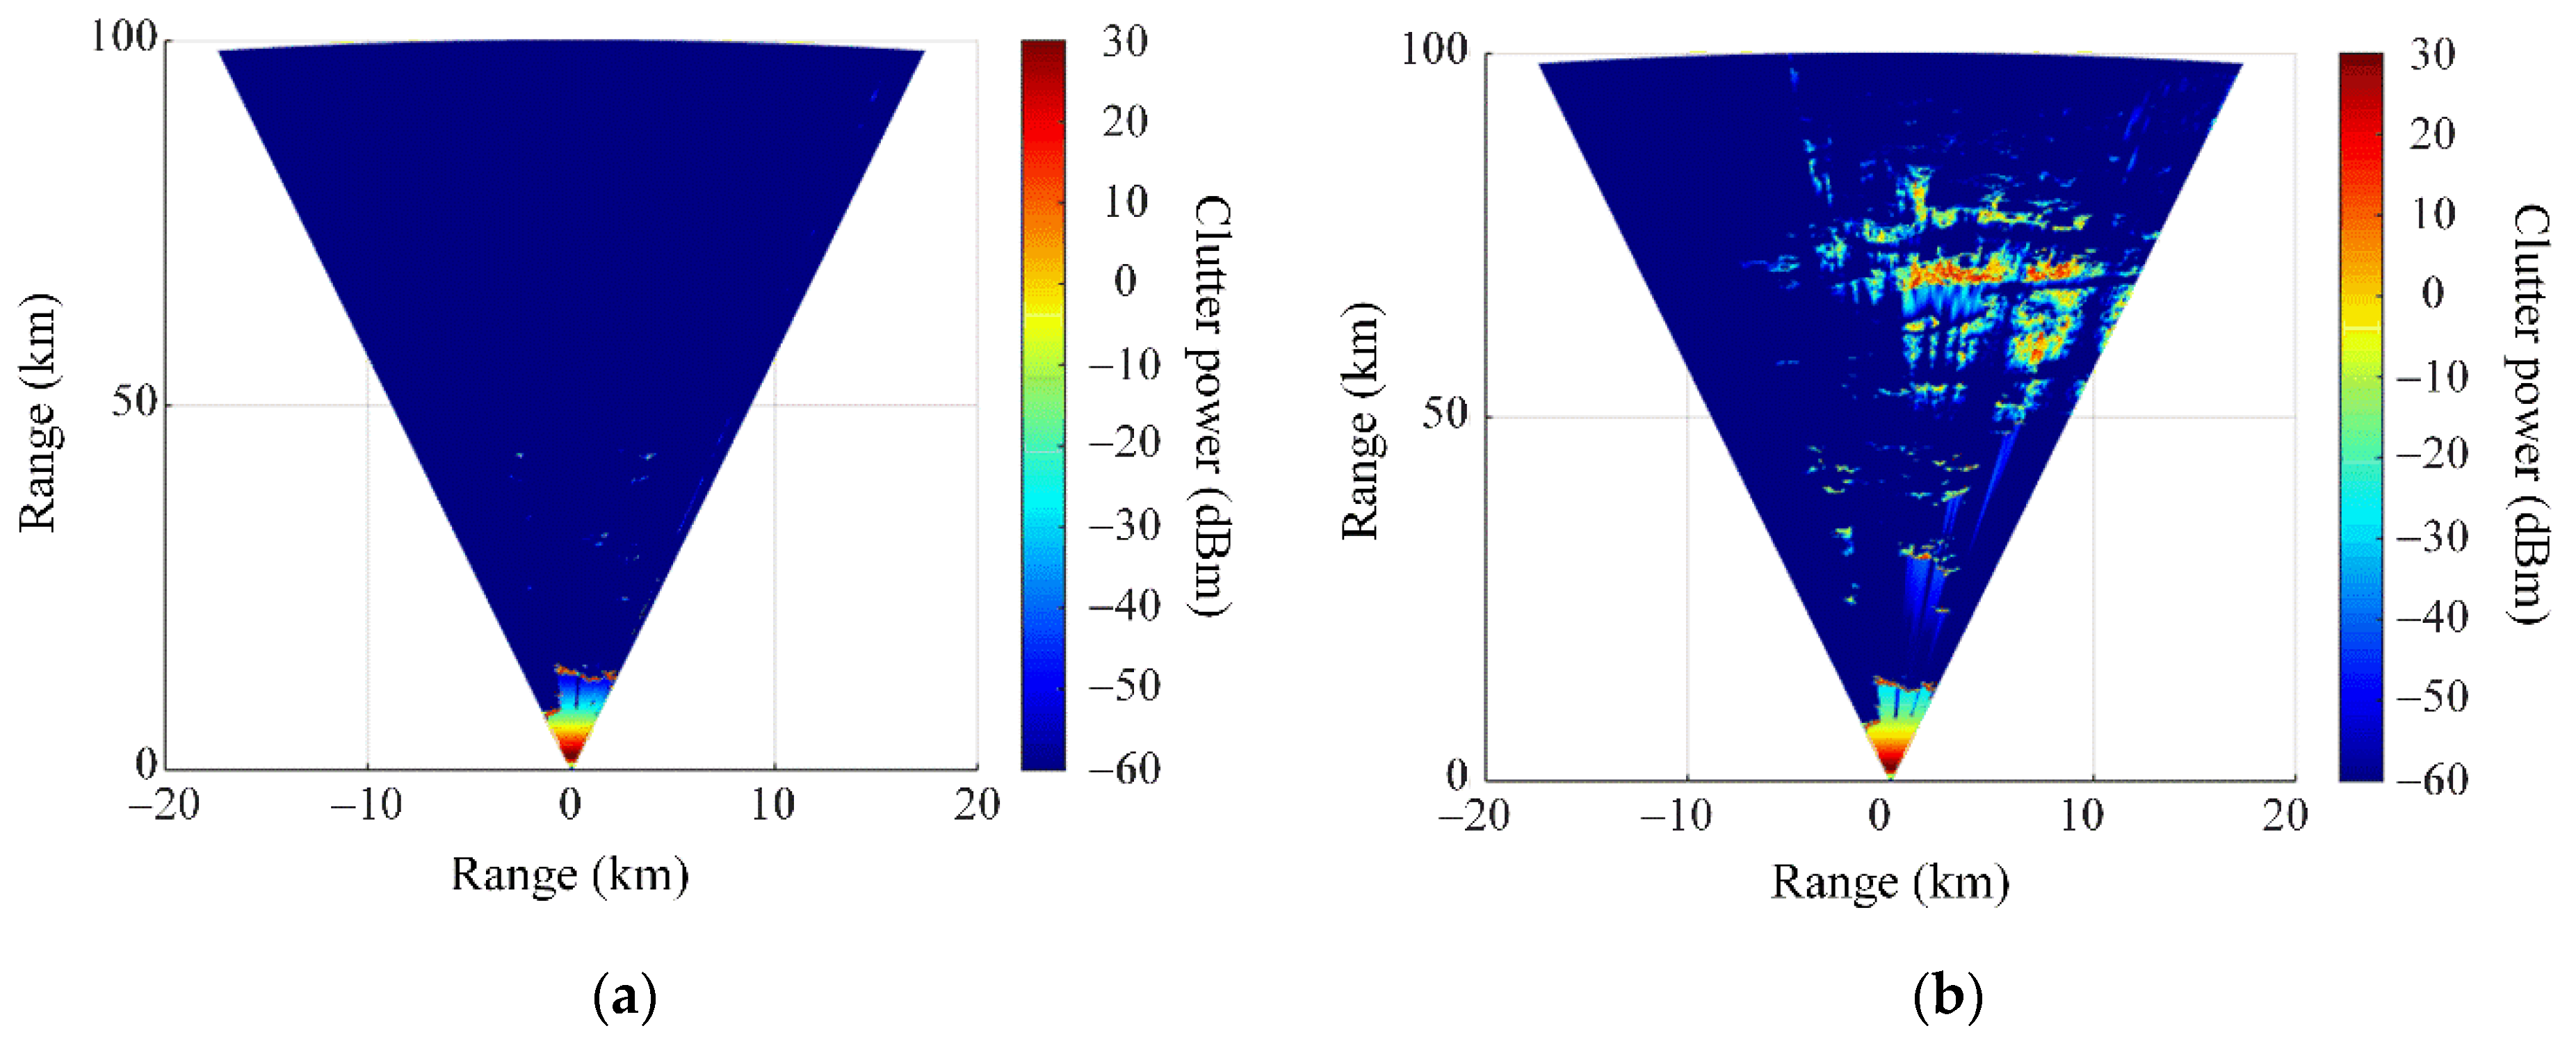
2. Calculation of Clutter Power Spectrums
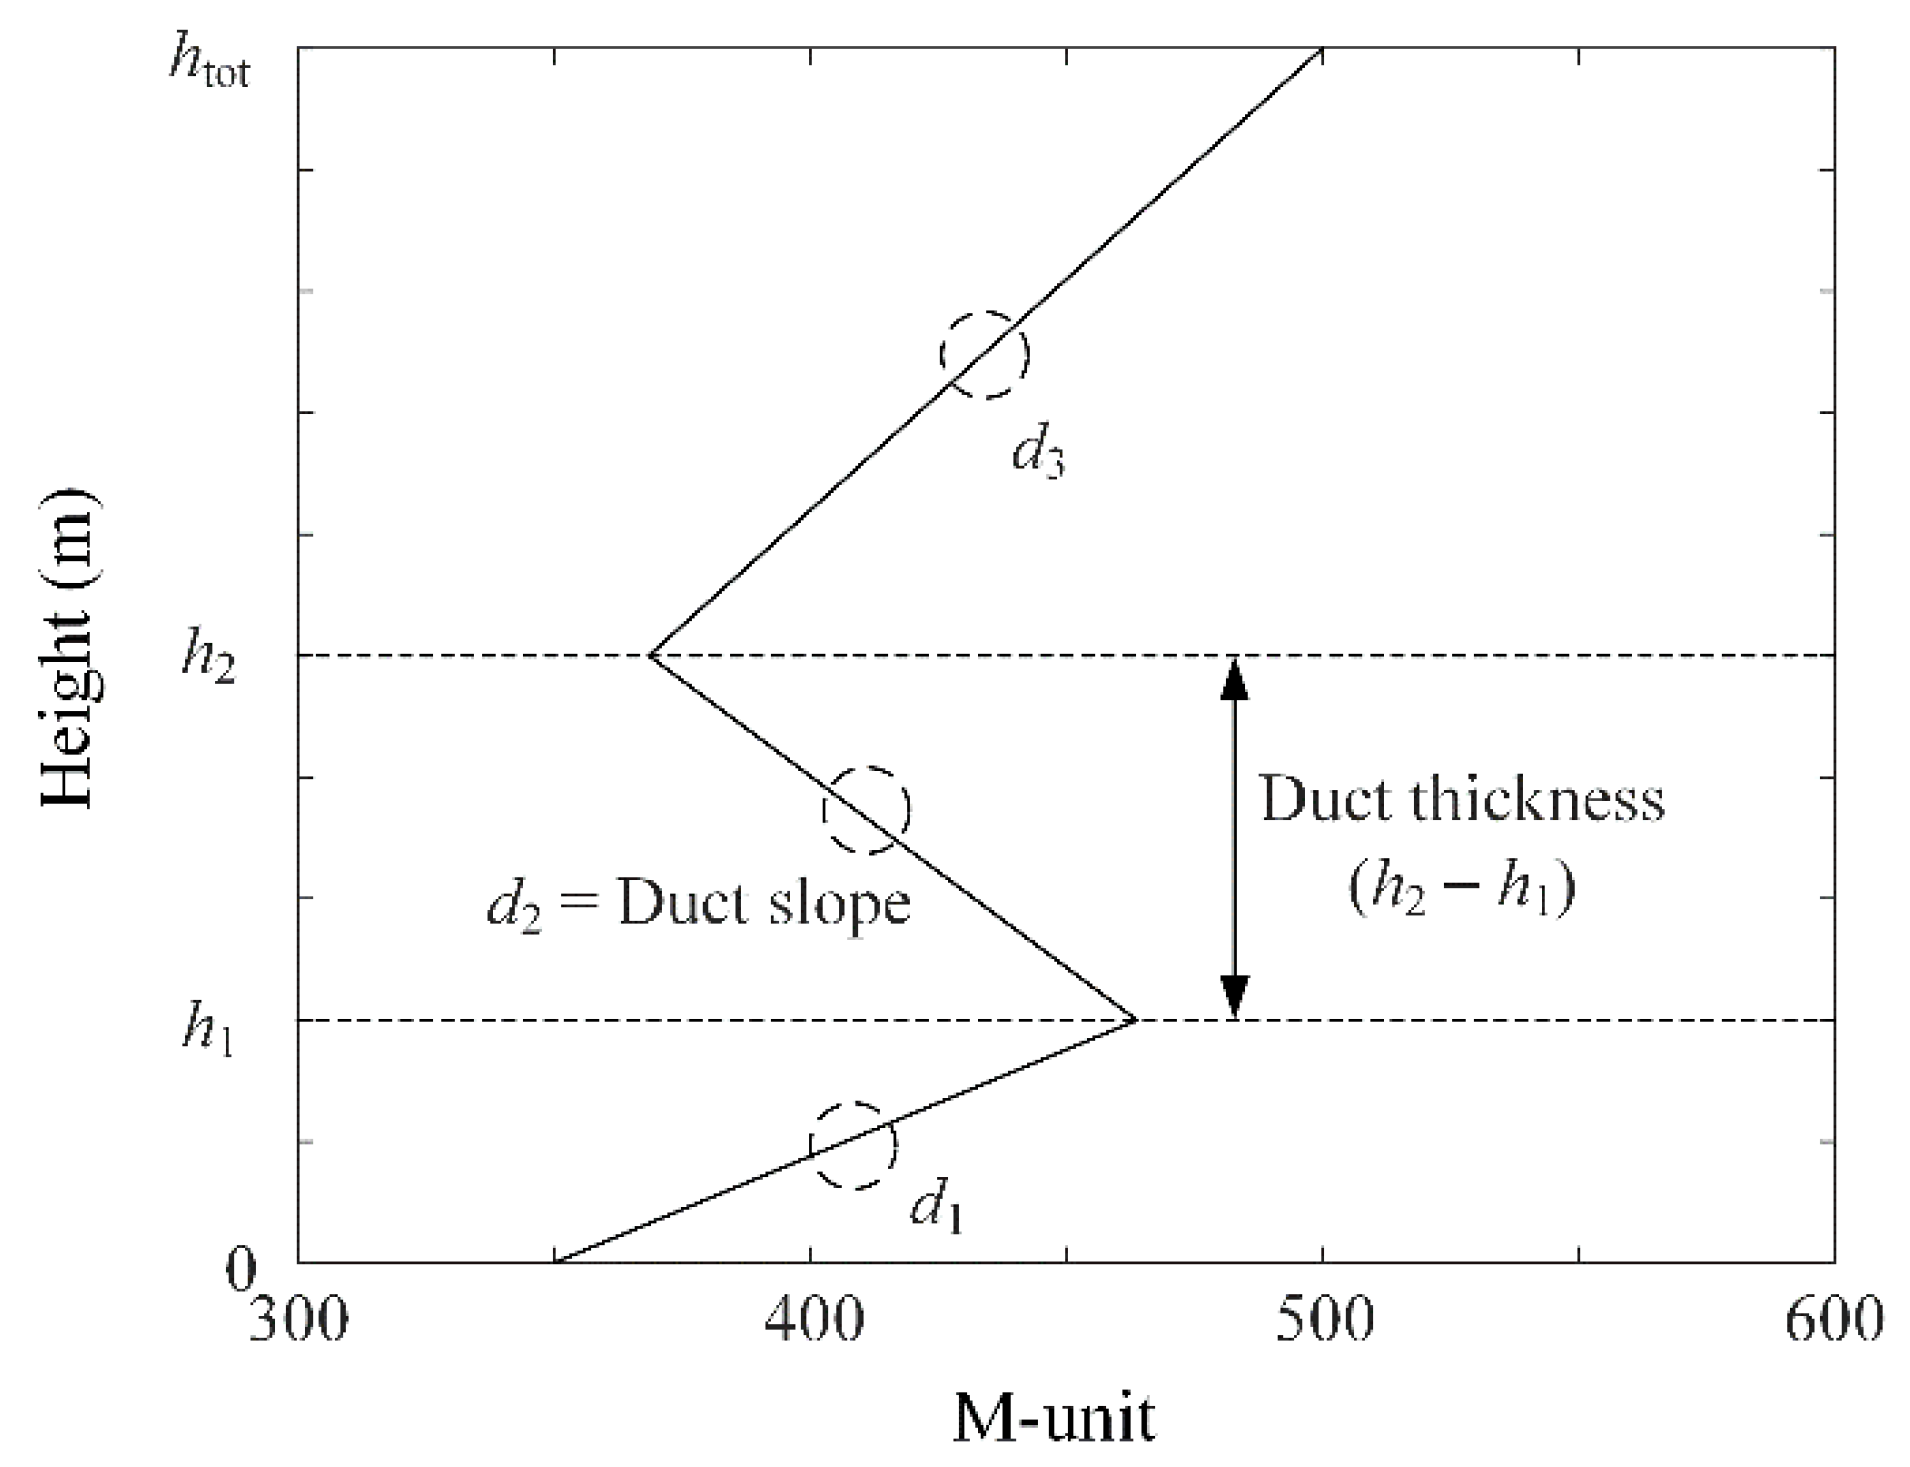
3. Estimation of an Atmospheric Refractivity
4. Conclusions
Author Contributions
Funding
Institutional Review Board Statement
Informed Consent Statement
Data Availability Statement
Acknowledgments
Conflicts of Interest
References
- Locker, C.; Vaupel, T.; Eibert, T.F. Radiation efficient unidirectional low-profile slot antenna elements for X-band application. IEEE Trans. Antennas Propag. 2005, 53, 2765–2768. [Google Scholar] [CrossRef]
- Dastkhosh, A.R.; Oskouei, H.D.; Khademevatan, G. Compact low weight high gain broadband antenna by polarization-rotation technique for X-band radar. Int. J. Antennas Propag. 2014, 2014, 743046. [Google Scholar] [CrossRef]
- Zhou, Y.; Wang, T.; Hu, R.; Su, H.; Liu, Y.; Liu, X.; Suo, J.; Snoussi, H. Multiple kernelized correlation filters (MKCF) for extended object tracking using X-band marine radar data. IEEE Trans. Signal Process. 2019, 67, 3676–3688. [Google Scholar] [CrossRef]
- Wang, A.; Krishnamurthy, V. Signal interpretation of multifunction radars: Modeling and statistical signal processing with Stochastic Context Free Grammar. IEEE Trans. Signal Process. 2008, 56, 1106–1119. [Google Scholar] [CrossRef]
- Wang, S.; Jang, D.; Kim, Y.; Choo, H. Design of S/X-Band dual-loop shared-aperture 2 × 2 array antenna. J. Electromagn. Eng. Sci. 2022, 22, 319–325. [Google Scholar] [CrossRef]
- Lim, T.H.; Go, M.; Seo, C.; Choo, H. Analysis of the target detection performance of Air-to-Air airborne radar using long-range propagation simulation in abnormal atmospheric conditions. Appl. Sci. 2020, 10, 6440. [Google Scholar] [CrossRef]
- Lim, T.; Choo, H. Prediction of target detection probability based on air-to-air long-range scenarios in anomalous atmospheric environments. Remote Sens. 2021, 13, 3943. [Google Scholar] [CrossRef]
- Sharma, V.; Kumar, L. Photonic-radar based multiple-target tracking under complex traffic-environments. IEEE Access 2020, 8, 225845–225856. [Google Scholar] [CrossRef]
- Kim, I.; Kim, H.; Lee, J.-H. Theoretical minimum detection range for a rapidly moving target and an experimental evaluation. J. Electromagn. Eng. Sci. 2021, 21, 161–164. [Google Scholar] [CrossRef]
- Tedesco, M.; Wang, J.R. Atmospheric correction of AMSR-E brightness temperatures for dry snow cover mapping. IEEE Geosci. Remote Sens. Lett. 2006, 3, 320–324. [Google Scholar] [CrossRef]
- Wang, J.R.; Racette, P.; Triesky, M.E.; Browell, E.V.; Ismail, S.; Chang, L.A. Profiling of atmospheric water vapor with MIR and LASE. IEEE Geosci. Remote Sens. Lett. 2002, 40, 1211–1219. [Google Scholar] [CrossRef]
- Birkemeier, W.P.; Duvosin, P.F.; Fontaine, A.B.; Thomson, D.W. Indirect atmospheric measurements utilizing rake tropospheric scatter techniques—Part II: Radiometeorological interpretation of rake channel-sounding observations. Proc. IEEE 1969, 57, 552–559. [Google Scholar] [CrossRef]
- Yardim, C.; Gerstoft, P.; Hodgkiss, W.S. Tracking refractivity from clutter using Kalman and Particle filters. IEEE Trans. Antennas Propag. 2008, 56, 1058–1070. [Google Scholar] [CrossRef]
- Yardim, C.; Gerstoft, P.; Hodgkiss, W.S. Estimation of radio refractivity from radar clutter using Bayesian Monte Carlo analysis. IEEE Trans. Antennas Propag. 2006, 54, 1318–1327. [Google Scholar] [CrossRef]
- Gerstoft, P.; Rogers, L.T.; Krolik, J.L.; Hodgkiss, W.S. Inversion for refractivity parameters from radar sea clutter. Radio Sci. 2003, 38, 8053. [Google Scholar] [CrossRef]
- Huang, S.-X.; Zhao, X.-F.; Sheng, Z. Refractivity estimation from radar sea clutter. Chin. Phys. B 2009, 18, 5084–5090. [Google Scholar]
- Cemil, T.; Isa, N. A novel hybrid model for inversion problem of atmospheric refractivity estimation. AEU Int. J. Electron. Commun. 2018, 84, 258–264. [Google Scholar]
- Penton, S.E.; Hackett, E.E. Rough ocean surface effects on evaporative duct atmospheric refractivity inversions using genetic algorithms. Radio Sci. 2018, 53, 804–819. [Google Scholar] [CrossRef]
- Karimian, A.; Yardim, C.; Gerstoft, P.; Hodgkiss, W.S.; Barrios, A.E. Refractivity estimation from sea clutter: An invited review. Radio Sci. 2011, 46, RS6013. [Google Scholar] [CrossRef]
- Nathanson, F.E.; Reilly, J.P.; Cohen, M. Radar Design Principles, 2nd ed.; McGraw-Hill: New York, NY, USA, 1991. [Google Scholar]
- Reilly, J.P.; Dockery, G.D. Influence of evaporation ducts on radar sea returns. IEEE Proc. 1990, 137, 80–88. [Google Scholar]
- Vilhelm, G.H.; Rashmi, M. An improved empirical model for radar sea clutter reflectivity. IEEE Trans. Aerosp. Electron. Syst. 2012, 49, 3512–3524. [Google Scholar]
- Ma, L.; Wu, J.; Zhang, J.; Wu, Z.; Jeon, G.; Zhang, Y.; Wu, T. Research on sea clutter reflectivity using deep learning model in industry 4.0. IEEE Trans. Ind. Inform. 2020, 16, 5929–5937. [Google Scholar] [CrossRef]
- Feng, S.; Chen, J. Low-angle reflectivity modeling of land clutter. IEEE Geosci. Remote Sens. Lett. 2006, 3, 254–258. [Google Scholar] [CrossRef]
- Advanced Refractive Prediction System (AREPS); version 3.6; The Space and Naval Warfare System: San Diego, CA, USA, 2005.
- ITU. The Radio Refractive Index: Its Formula and Refractivity Data. ITU-R P.453. 2019. Available online: https://www.itu.int/rec/R-REC-P.453/en (accessed on 8 September 2019).
- University of Wyoming, Department of Atmospheric Science. Available online: https://weather.uwyo.edu/upperair/sounding.html (accessed on 31 January 2022).
- NASA. NASA Earth Data Center. Available online: https://www.earthdata.nasa.gov/ (accessed on 1 January 2022).
- Compaleo, J.; Yardim, C.; Xu, L. Refractivity-from-clutter capable, software-defined, coherent-on-receive marine radar. Radio Sci. 2021, 56, 1–19. [Google Scholar] [CrossRef]


| Option | Value |
|---|---|
| Population size | 30 |
| Generations | 15 |
| Elite count | 6 |
| Crossover ratio | 40% |
| Mutation ratio | 10% |
| Case | Duct Slopes (Esti.) | Duct Slopes (Mea.) | Duct Thickness (Esti.) | Duct Thickness (Mea.) |
|---|---|---|---|---|
| Case 2 | −74.9 | −121 | 231 | 200 |
| Case 3 | −187.5 | −158.5 | 176 | 200 |
| Case 4 | −168.7 | −121 | 181.5 | 200 |
| Case 5 | −194.3 | −151 | 264 | 300 |
Publisher’s Note: MDPI stays neutral with regard to jurisdictional claims in published maps and institutional affiliations. |
© 2022 by the authors. Licensee MDPI, Basel, Switzerland. This article is an open access article distributed under the terms and conditions of the Creative Commons Attribution (CC BY) license (https://creativecommons.org/licenses/by/4.0/).
Share and Cite
Jang, D.; Kim, J.; Park, Y.B.; Choo, H. Study of an Atmospheric Refractivity Estimation from a Clutter Using Genetic Algorithm. Appl. Sci. 2022, 12, 8566. https://doi.org/10.3390/app12178566
Jang D, Kim J, Park YB, Choo H. Study of an Atmospheric Refractivity Estimation from a Clutter Using Genetic Algorithm. Applied Sciences. 2022; 12(17):8566. https://doi.org/10.3390/app12178566
Chicago/Turabian StyleJang, Doyoung, Jongmann Kim, Yong Bae Park, and Hosung Choo. 2022. "Study of an Atmospheric Refractivity Estimation from a Clutter Using Genetic Algorithm" Applied Sciences 12, no. 17: 8566. https://doi.org/10.3390/app12178566