Abstract
Recently, Telehealth connects patients to vital healthcare services via remote monitoring, wireless communications, videoconferencing, and electronic consults. By increasing access to specialists and physicians, telehealth assists in ensuring patients receive the proper care at the right time and right place. Teleophthalmology is a study of telemedicine that provides services for eye care using digital medical equipment and telecommunication technologies. Multimedia computing with Explainable Artificial Intelligence (XAI) for telehealth has the potential to revolutionize various aspects of our society, but several technical challenges should be resolved before this potential can be realized. Advances in artificial intelligence methods and tools reduce waste and wait times, provide service efficiency and better insights, and increase speed, the level of accuracy, and productivity in medicine and telehealth. Therefore, this study develops an XAI-enabled teleophthalmology for diabetic retinopathy grading and classification (XAITO-DRGC) model. The proposed XAITO-DRGC model utilizes OphthoAI IoMT headsets to enable remote monitoring of diabetic retinopathy (DR) disease. To accomplish this, the XAITO-DRGC model applies median filtering (MF) and contrast enhancement as a pre-processing step. In addition, the XAITO-DRGC model applies U-Net-based image segmentation and SqueezeNet-based feature extractor. Moreover, Archimedes optimization algorithm (AOA) with a bidirectional gated recurrent convolutional unit (BGRCU) is exploited for DR detection and classification. The experimental validation of the XAITO-DRGC method can be tested using a benchmark dataset and the outcomes are assessed under distinct prospects. Extensive comparison studies stated the enhancements of the XAITO-DRGC model over recent approaches.
1. Introduction
The term “telemedicine” was defined in the 1970s by Strehle and Shabde as “healing at a distance”. The World Health Organization (WHO) presented a standard meaning of telemedicine as “the delivery of health care services, where distance becomes a critical factor, by every healthcare expert by making use of information and communication technology (ICT) for interchanging validated data for prognosis, medication and preventing injuries and disease” []. Telemedicine depends on ICT, termed a “different set of technical tools and sources utilized for creating, transmitting, exchanging or sharing, storing, information []. Such resources and technological tools involve live broadcasting technology (television, webcasting, and radio), recorded broadcasting technology (podcasting, video and audio players, and memory gadgets), telephony (mobile or fixed, satellite, video-conferencing), and the internet (emails, websites, and blogs)”. A creative grouping of screening with the help of Optical Coherence Tomography (OCT), fundus cameras, and other gadgets with telemedicine escorted in the period of teleophthalmology can be implemented in non-eye care backgrounds and in ophthalmology offices, which include primary care workplaces []. This can be possible by appropriate follow-up eye care and remote grading. Developing global interest in the usage of telemedicine in screening for diabetic retinopathy (DR) caused the emergence of several journals during the past few years [].
Diabetes mellitus was a very expensive and pandemic chronic ailment. It affects nearly 4.15 billion people across the world, responsible for 12% of the global health expenses, and even so, 1 in 2 people were untreated and undiagnosed []. Subsequently, life-threatening complexities because of diabetes mellitus, namely cardiomyopathy, neuropathy, strokes, retinopathy, and nephropathy have hiked across many countries. Today, caregivers and patients will stay on a query relating to diabetes management []. For instance, frequent diagnoses and offering essential advice for patients in self-management were needed for the prevention of acute terrible complexities and to reduce the danger of life-long conditions []. The surge of a higher volume of real-world data collected at the time of medications has generated incredible enthusiasm in diabetic care. Among them, imagery reports present a great effect on developing new insights and disturb the present understanding of diabetic care. Currently, medical imaging is mostly utilized for diagnosing, prioritizing treatment, and evaluating replies to medications in modern medicine []. The main reason was the work pressure of a health care professional surges significantly because of a huge number of patients indulging in population screening and thus, patients are waiting in a lengthy queue []. Artificial intelligence (AI) was increasingly automating health care practices and provides high precision, satisfaction, and efficiency []. With the recent progression in digitalized data acquisition, machine learning (ML), and computer vision (CV), AI was diffusing into medical decision-making processes that are formerly scrutinized below the direct supervising of human professionals.
This study develops an XAI-enabled teleophthalmology for diabetic retinopathy grading and classification (XAITO-DRGC) model. The proposed XAITO-DRGC model uses median filtering (MF) and contrast enhancement as a pre-processing step. In addition, the XAITO-DRGC model applies U-Net-based image segmentation and SqueezeNet-based feature extractor. Moreover, Archimedes optimization algorithm (AOA) with a bidirectional gated recurrent convolutional unit (BGRCU) is exploited for DR detection and classification. The experimental validation of the XAITO-DRGC model is tested using a benchmark dataset and the results are assessed under distinct aspects.
2. Related Works
Wijesinghe et al. [] suggest a prototype that includes an independent system named Intelligent Diabetic Assistant (IDA), that determines the prognosis and the treatment prioritizing relies on the observation manifested on a screen. The IDA comprises a knowledge-related module for a severity level-related classifier, and clinical decision support. In [], an ensemble-based ML method containing ML techniques such as Logistic Regression (LR), Random Forest (RF), Adaboost, KNN, and Decision Tree (DT) can be tested on the DR dataset. In the initial step, normalization can be performed on the DR dataset by the min-max normalization technique. Hacisoftaoglu et al. [] introduced an automatic DR detection technique for smartphone-related retinal images by utilizing the DL technique with the ResNet50 network. This work primarily used familiar ResNet50, AlexNet, and GoogLeNet structures by making use of the transfer learning (TL) method. Secondly, such structures are retrained with retinal images from numerous datasets involving Messidor-2, EyePACS, IDRiD, and Messidor for investigating the impact of utilizing images from the cross, multiple, and single datasets. Thirdly, the suggested ResNet50 method can be implied to smartphone-related synthetic images for exploring the DR detection accuracy of smartphone-related retinal imaging systems.
In [], a method for automatic detection of DR was suggested with the help of a low complexity image processing approach and a modified Convolutional Neural Network (CNN) having superior precision for helping an ophthalmologist via identification of variation in retina features. Papon and Islam [] project a robust diagnostic mechanism via a compilation of state-of-the-art deep learning (DL) methods for automatic DR severity detection. The idea of deep CNNs was used and revolutionized various branches of CV such as medical imaging. Fayemiwo et al. [] provided an approach that directly classifies and identifies the DR severity in digitalized fundus images by employing CNN. The methods employed are CNN built and integrated with Keras. The dataset which is trained is divided into two kinds; they are categorical and binary datasets further trained with or without pre-processing and their results are compared.
Although diverse DR classification models exist in the literature, it is still required to boost the classifier results. Due to the incessant deepening of the model, the number of parameters of DL models gets raised quickly which leads to model overfitting. At the same time, different hyperparameters have a significant impact on the efficiency of the CNN model. Particularly, hyperparameters such as epoch count, batch size, and learning rate selection are essential to attain an effectual outcome. Since the trial and error method for hyperparameter tuning is a tedious and erroneous process, in this work, we employ the AOA algorithm for the parameter selection of the BGRCU model.
3. The Proposed Model
In this article, a novel XAITO-DRGC technique was devised for the detection and classification of DR. Initially, the XAITO-DRGC model applies MF and contrast enhancement as a pre-processing step. In addition, the XAITO-DRGC model applies U-Net-based image segmentation and SqueezeNet-based feature extractor. Finally, AOA with BGRCU is exploited for DR detection and classification where the AOA assist in optimal hyperparameter tuning of the BGRCU model. Figure 1 depicts the block diagram of the XAITO-DRGC algorithm.
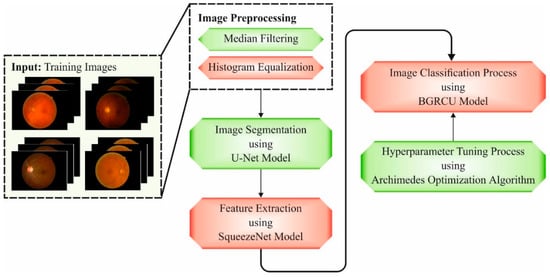
Figure 1.
Block diagram of the XAITO-DRGC approach.
The proposed architecture comprises three basic mechanisms to empower an ophthalmologist in the telemedicine environment while collaborating with AI-based healthcare assistive expertise:
- A wearable head-mounted camera OphthoAI Internet of Medical Things (IoMT) headset with DL applications for DR disease severity diagnosis. This application enables us to take fresh retinal fundus images of eyes that are later transferred through the internet to a centralized position protected behindhand a firewall. The headset assists inference in the cloud backend with AI and data analytics services or local inference with an embedded-AI technique. User information is locally stored with encryption.
- A cloud computing platform that serves and manages a connection to an AI engine for predicting disease progression, a single OphthoAI IoMT headset, secured patients cloud storage drive, metering and monitoring of computing resources, secured communication of fundus representations, etc. The service can be managed by a cloud IoT system manager and IoT-assisted healthcare service directory.
- An ophthalmologist dashboard with a secured multi-tenant cloud backend, providing privacy-aware role-based access control to resources and personal information. Secured multitenancy confirms users do not pose a risk to each other in terms of misuse, privacy violation, or data loss.
3.1. Image Pre-Processing
At the initial stage, the XAITO-DRGC model applies MF and contrast enhancement as a pre-processing step. The MF technique adopts a non-linear approach for noise exclusion from scaled input images []. It functions by sliding pixel by pixel, replacing every pixel value with a median value of adjacent pixels. The window pattern having a size of 3 × 3 can be utilized to slide pixel by pixel over the neighbors in a scaled input image. The calculation of the median is conducted by sorting every pixel value primarily in arithmetical order in the window paradigm and interchanging the pixel values with the central pixel value. The histogram equalization technique can be implied for enhancing the contrast of the scaled input image by making use of its histogram. The procedure is done through the distribution of pixel intensity values that were appearing frequently and thus, low contrast regions of an image obtain high contrast.
3.2. Image Segmentation
Next to image pre-processing, the XAITO-DRGC model applies U-Net-based image segmentation. U-Net is initially established for medicinal image understanding and segmentation []. It is a vast application from the area and is an important structure of the medicinal image automation society. The infrastructure of this network contains two important parts namely contractive and expansive. The contracting direction contains many patches of convolutional with a filter of size 3 × 33 × 3 and unity strides from both paths, then a rectified linear unit (ReLU) layer. This direction extracts the important features of input and outcomes from a feature vector of a particular length. The second direction pulls data in the contractive direction using copy and crop, and in the feature vector using up-convolution creates, with a succeeding function, a resultant segmentation map. An important element of this structure is the procedure connecting the 1st and 2nd directions composed. This connection permits the network for attaining extremely accurate data in the contractive path, creating the segmentation mask nearby the projected outcome.
3.3. Feature Extraction
At this stage, the segmented images are passed into the SqueezeNet model to produce feature vectors. Generally, the CNN comprises a pooling layer, full connection layer, and convolutional layer. At first, the feature is extracted using multiple convolutions and pooling layers. Next, the feature mapping from the final convolutional layers is transformed into a one-dimensional vector. At last, the output layer classifies the input image. The network reduces the square variance amongst the predictable output and classification outcomes and changes the weight variable by means of BP. The neuron in all the layers are well-arranged in three dimensions: depth, height, and width, whereby depth represents the amount of input feature mappings or channel amount of input image, and height and width refers to the size of a neuron. The convolution layer contains several convolutional filters and extracts features from the image through the convolutional technique. The convolutional filter of the existing layer convoluted the input feature mapping to extract local features and accomplishes the output feature mapping. Next, the nonlinear feature mapping is accomplished by the activation function. The pooling layer, or subsampling layer, was behind the convolution layers. It implements a down-sampling method and has a particular value as output in a certain region.
As the variable count for AlexNet and VGGNet increases, the SqueezeNet network architecture was introduced that has the lowest variable while maintaining accuracy []. The fire module becomes the essential module in SqueezeNet, as well as its architecture, as given in Figure 2. This module can be divided into Expand and Squeeze architecture. The convolution layer received considerable attention in the network architecture. The work explains from the perceptive of cross channel pooling whereas multilayer perceptron (MLP) was equivalent to the cascaded cross channel parametric pooling layer behind the traditional kernel, thus achieving data integration over the channel and linear incorporation of several feature maps. Once the amount of input and output channels were greater, the convolutional kernels become large. Then, adding 1 × 1 convolutions to every single inception mechanism reduces the number of input channels, as well as the complexity operation and convolution kernel variables are decreased. Lastly, add 1 × 1 convolutions to increase the feature extraction and the number of channels. Once the sampling reduction method can be delayed, a larger activation graph was provided to the convolution layer, whereby the larger activation graph preserves further data and provides better classification performance.
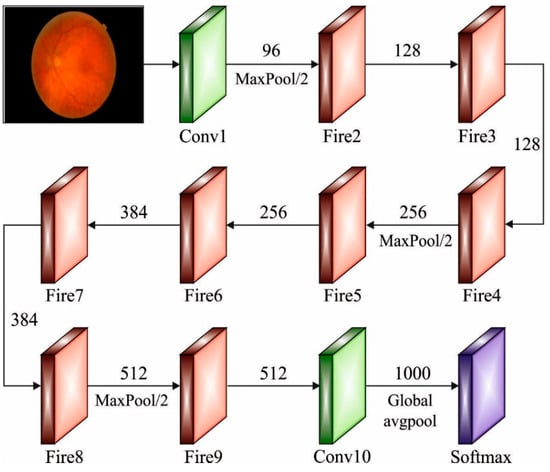
Figure 2.
Structure of SqueezeNet.
3.4. Image Classification
In the final stage, the BGRCU is exploited for DR detection and classification. Gated recurrent unit (GRU) is making all the recurrent units for adaptably capture dependency of distinct time scales. Like the long short term memory (LSTM), the GRU is a gate unit that modulates the flow of data inside the memory [], but without taking a discrete memory cell. The input to GRU in step is dimension vector . The hidden vector sequence was computed as iterating the subsequent formulas in :
The activation has been collected of the update gate , reset gate candidate gate , and resultant activation , , and represent the suitable sized matrix and bias. The symbol represents the sigmoid activation and denotes the elementwise multiplication. The BiGRU processes data from both directions with forward as well as backward hidden layers. Related to the unidirectional case the number of free parameters doubles. The outcome of both directions is then concatenated from the outcome.
Assume remain the forwarding outcome of BGRU with procedure the input order with and consider to be the equivalent backward outcome with processing the input order in the reverse direction with . The outcome of BGRU is the step-wise concatenation of forward as well as backward outputs .
An input to Gated Recurrent Convolutional Unit (GRCU) with channel and input dimensional is an order of vectors . The hidden vector order has been calculated by iterating the subsequent formulas in :
and are features map of length . The max-pooling functions also take length and are the bias. The GRCU utilizes a similar gating infrastructure as the BGRU, then every fully connected (FC) matrix multiplication was replaced with a convolutional matrix function afterward a -pooling function with a similar filter length. Integrating GRCU as well as bidirectional recurrent neural network (RNN) outcomes from the BGRCU that were determined analogously to BGRU.
In this study, the AOA assists in optimal hyperparameter tuning of the BGRCU model. AOA is a technique simulated by physics, in further detail Archimedes’ law. This technique was established by Fatma Hashim in 2020 and goes into the class of meta-heuristics []. In the procedure of AOA, the upgrade of density and volume has been recognized for changing the acceleration dependent upon the collision model amongst objects that play a vital role from determine a new place of present solutions. The common steps of AOA are explained as:
The initialized procedure purposes for initializing arbitrarily the real population which comprises objects utilized in Equation (1). Moreover, all the objects are considered as density , volume , and acceleration that are randomly determined by the subsequent equation:
Let be the object, and and refers to the maximum and minimum bounds of the searching space, correspondingly. , and denotes random vector lies between In the updating of volume and density, the values of density and volume for every object were upgraded by the control of the optimal density and volume as follows:
From the equation, refers to numbers lying within zero and one. Next, the collision between objects happened till attaining the equilibrium state. The key role of the transfer function is to shift from exploration to exploitation modes, determined as follows:
The exponentially increases over time until obtaining 1. refers to the existing iteration, whereas represents the maximal iteration count. Similarly, the reduction of the density scalar in AOA permits to discover an optimum solution []:
In the exploration phase, the collision between agents is appeared by randomly selecting material . Therefore, the update of the acceleration object is employed if the transfer function value was lesser or equivalent to 0.5.
In the exploitation, the collision between agents was not realized. Therefore, the update of the acceleration object can be employed if the transfer coefficient values are higher than 0.5.
In Equation (10), represents the acceleration of the optimum object During normalization, we normalize the acceleration to define the rate of change as follows:
In Equation (11), and are set as 0.9 and 0.1, correspondingly. illustrates the proportion of steps adapted by every agent. A low acceleration value specifies that the object was working under the exploitation mode; or else, the object was working under an exploration mode. For the exploration stage , the location of the object in the iteration is adapted using the following equation, where the object location is upgraded in the exploitation stage .
where is set as 2.
where is set as 6. is applied for flagging which controls search direction:
where
Lastly, the novel population is estimated via score index to define the best object and the best additive data involving , and
The AOA method makes a derivation of a fitness function for attaining advanced classifier performances. It sets a positive numeral for indicating the superior performance of the candidate solutions. In this article, the reduction of the classifier error rate can be assumed as the fitness function, as presented below in Equation (15).
4. Experimental Validation
The experimental validation of the XAITO-DRGC model is tested using two datasets. Table 1 depicts the detailed description of two datasets. The DDR dataset [] comprises 13,673 fundus images obtained at a 45° field of view (FOV). Among these, there were 1151 ungradable images, 6266 normal images, and 6256 DR images. The APTOS 2019 Kaggle dataset [] has 3662 retina images with various image sizes. The dataset can be classified into five DR stages. Moreover, 1805 of the images are normal and 1857 are DR images.

Table 1.
Dataset details.
Figure 3 illustrates the confusion matrices given by the XAITO-DRGC model on the APTOS 2019 dataset. On the entire dataset, the XAITO-DRGC model has identified 344 samples as normal, 59 samples as mild, 188 samples as moderate, 21 samples as severe, and 42 samples as proliferative. In addition, on 70% of training (TR) data, the XAITO-DRGC method has identified 243 samples as normal, 43 samples as mild, 132 samples as moderate, 12 samples as severe, and 26 samples as proliferative. Also, on 30% of testing (TS) data, the XAITO-DRGC technique has identified 101 samples as normal, 16 samples as mild, 56 samples as moderate, 9 samples as severe, and 16 samples as proliferative.
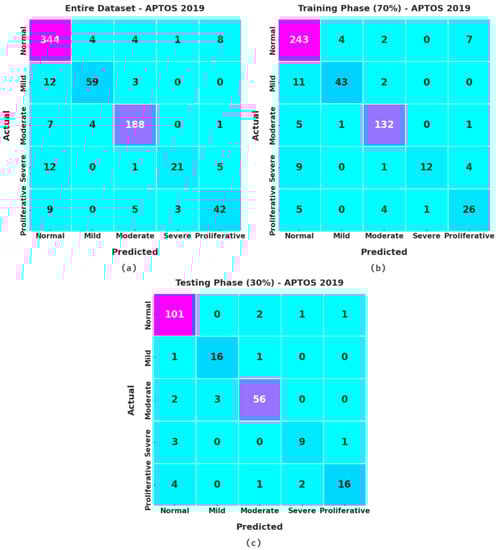
Figure 3.
Confusion matrices of the XAITO-DRGC approach under the APTOS 2019 dataset (a) entire dataset, (b) 70% of TR data, and (c) 30% of TS data.
Table 2 and Figure 4 provide an overall classification output of the XAITO-DRGC model on the APTOS 2019 dataset. The experimental values notified that the XAITO-DRGC model has shown enhanced results under distinct aspects. For instance, with the entire dataset, the XAITO-DRGC model has offered an average of 95.69%, of 86.04%, of 78.81%, of 96.59%, and of 81.69%. Meanwhile, with 70% of TR data, the XAITO-DRGC approach has provided an average of 95.56%, of 86.59%, of 77.01%, of 96.42%, and of 80.13%. Eventually, with 30% of TS data, the XAITO-DRGC algorithm has rendered an average of 96%, of 86.48%, of 83.14%, of 96.97%, and of 84.52%.
Table 2.
Result analysis of the XAITO-DRGC approach with various measures on the APTOS 2019 dataset.
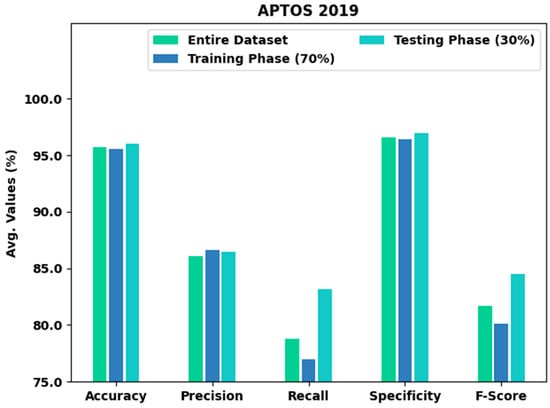
Figure 4.
Result analysis of the XAITO-DRGC approach under the APTOS 2019 dataset.
The training accuracy (TA) and validation accuracy (VA) acquired by the XAITO-DRGC method on the APTOS 2019 dataset is demonstrated in Figure 5. The experimental outcome denoted that the XAITO-DRGC algorithm has reached maximal values of TA and VA. In particular, the VA is greater than TA.
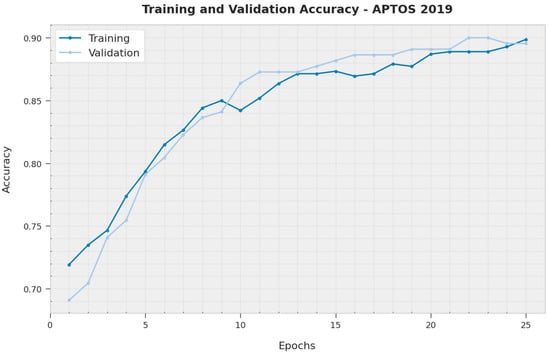
Figure 5.
TA and VA analysis of the XAITO-DRGC approach under the APTOS 2019 dataset.
The training loss (TL) and validation loss (VL) gained by the XAITO-DRGC methodology on the APTOS 2019 dataset are established in Figure 6. The experimental outcome implied that the XAITO-DRGC method has accomplished minimal values of TL and VL. Explicitly, the VL is lesser than TL.
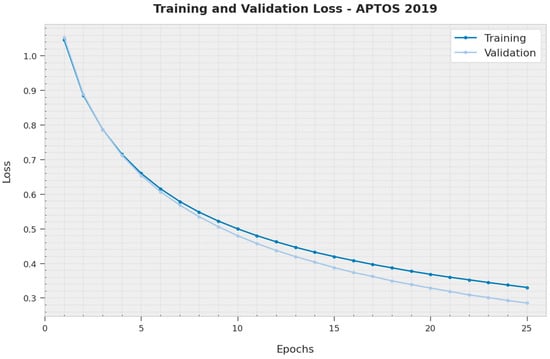
Figure 6.
TL and VL analysis of the XAITO-DRGC approach under the APTOS 2019 dataset.
To establish the enhanced performance of the XAITO-DRGC model, a comparison study is made on the APTOS 2019 dataset in Table 3 and Figure 7 []. The results implied that the CNN299 method has shown lower classification performance. At the same time, the CNN512, CN299-dropout, EfficientNetB0, and EfficientNetB0-dropout models have demonstrated moderately improved classifier results. Moreover, the CNN512-dropout model has reached reasonable performance with of 88.60%, of 81.56%, and of 95.10%. However, the XAITO-DRGC model has outperformed other models with a maximum of 96.00%, of 83.14%, and of 96.97%.
Table 3.
Comparative analysis of the XAITO-DRGC approach with recent methods on the APTOS 2019 dataset.
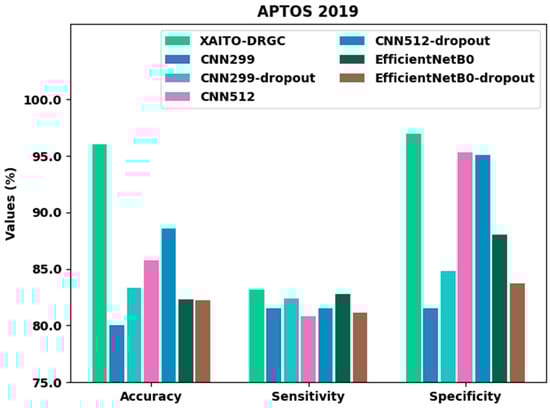
Figure 7.
Comparative analysis of the XAITO-DRGC approach under the APTOS 2019 dataset.
Figure 8 signifies the confusion matrices given by the XAITO-DRGC method on the DDR dataset. On the entire dataset, the XAITO-DRGC algorithm has identified 1225 samples as normal, 105 samples as mild, 867 samples as moderate, 31 samples as severe, and 159 samples as proliferative. Furthermore, on 70% of TR data, the XAITO-DRGC technique has identified 853 samples as normal, 76 samples as mild, 606 samples as moderate, 22 samples as severe, and 112 samples as proliferative. Additionally, on 30% of TS data, the XAITO-DRGC methodology has identified 372 samples as normal, 29 samples as mild, 261 samples as moderate, 9 samples as severe, and 47 samples as proliferative.
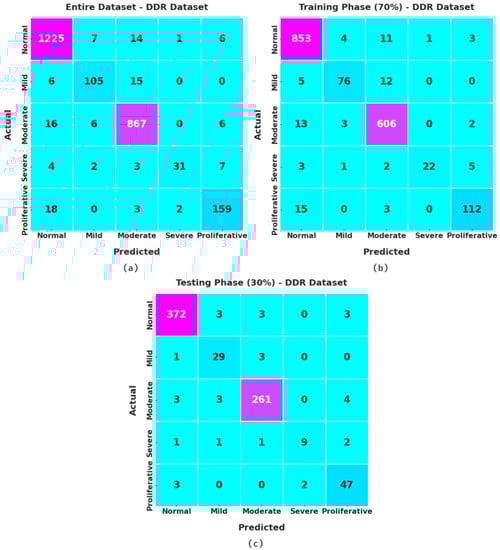
Figure 8.
Confusion matrices of the XAITO-DRGC approach under the DDR dataset (a) entire dataset, (b) 70% of TR data, and (c) 30% of TS data.
Table 4 and Figure 9 present an overall classification output of the XAITO-DRGC technique on the DDR dataset. The experimental values notified that the XAITO-DRGC method has shown enhanced results under distinct aspects. For example, with the entire dataset, the XAITO-DRGC method has rendered an average of 98.15%, of 92.13%, of 86.26%, of 98.55%, and of 88.78%. At the same time, with 70% of TR data, the XAITO-DRGC technique has offered an average of 98.11%, of 93.89%, of 85.90%, of 98.45%, and of 89.31%. Finally, with 30% of TS data, the XAITO-DRGC methodology has rendered an average of 98.24%, of 88.32%, of 87.30%, of 98.77%, and of 87.54%.
Table 4.
Result analysis of the XAITO-DRGC approach with various measures on the DDR dataset.
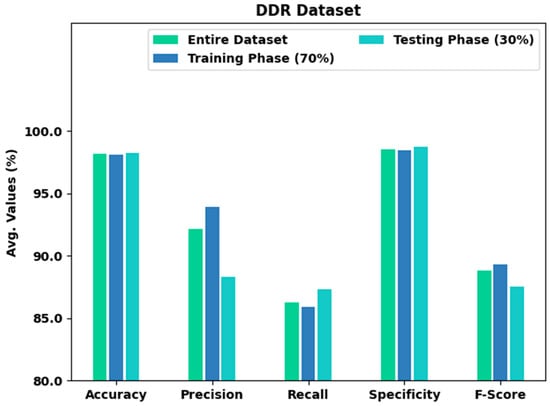
Figure 9.
Result analysis of the XAITO-DRGC approach under the DDR dataset.
The TA and VA acquired by the XAITO-DRGC technique on the DDR dataset are shown in Figure 10. The experimental outcome denoted the XAITO-DRGC algorithm has reached maximal values of TA and VA. In particular, the VA is greater than TA.
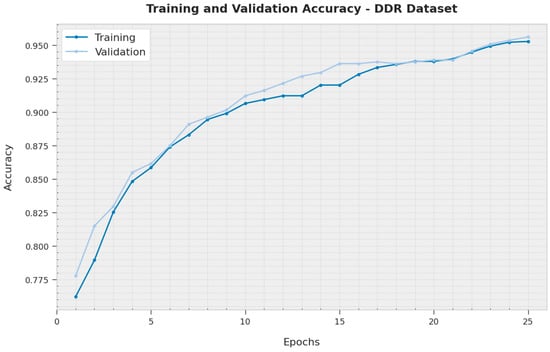
Figure 10.
TA and VA analysis of the XAITO-DRGC approach under the DDR dataset.
The TL and VL attained by the XAITO-DRGC method on the DDR dataset are established in Figure 11. The experimental outcome represented the XAITO-DRGC approach has accomplished minimal values of TL and VL. Specifically, the VL is lesser than TL.
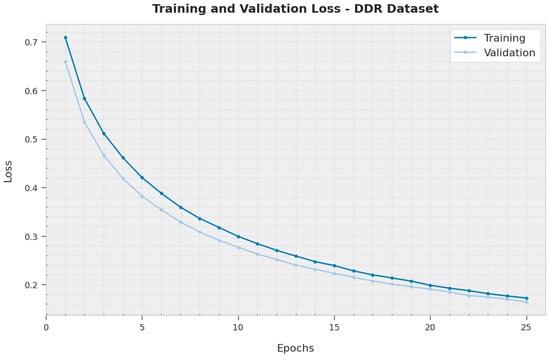
Figure 11.
TL and VL analysis of the XAITO-DRGC approach under the DDR dataset.
To establish the enhanced performance of the XAITO-DRGC method, a comparative study is made on the DDR dataset in Table 5 and Figure 12. The results represented that the CNN299 method displayed lower classification performance. Meanwhile, the CNN512, CN299-dropout, EfficientNetB0, and EfficientNetB0-dropout models have demonstrated moderately enhanced classifier results. Along with that, the CNN512-dropout approach has attained reasonable performance with of 84.10%, of 85.11%, and of 84.80%, however, the XAITO-DRGC technique has outperformed other models with a maximum of 98.24%, of 87.30%, and of 98.77%.
Table 5.
Comparative analysis of the XAITO-DRGC approach with recent methods on the DDR dataset.
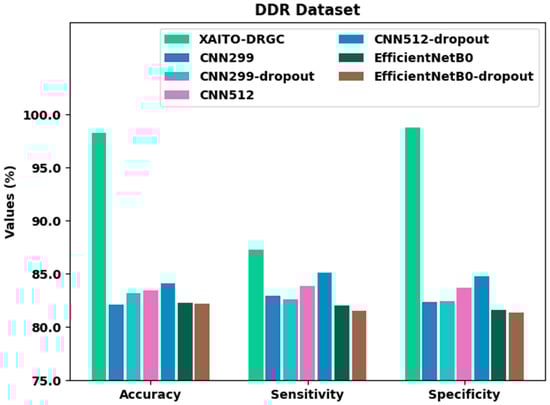
Figure 12.
Comparative analysis of the XAITO-DRGC approach under the DDR dataset.
From the above-mentioned tables and graphs, it is evident that the XAITO-DRGC method has shown enhanced performance over other models.
5. Conclusions
In this article, a new XAITO-DRGC technique was projected for the detection and classification of DR. The presented XAITO-DRGC model utilizes OphthoAI IoMT headsets to enable remote monitoring of DR disease. Initially, the XAITO-DRGC model applies MF and contrast enhancement as a pre-processing step. In addition, the XAITO-DRGC model applies U-Net-based image segmentation and SqueezeNet-based feature extractor. Finally, AOA with BGRCU is exploited for DR detection and classification where the AOA assist in optimal hyperparameter tuning of the BGRCU model. The experimental validation of the XAITO-DRGC technique can be tested using a benchmark dataset and the outcomes were assessed under distinct prospects. Extensive comparison studies stated the enhancements of the XAITO-DRGC model over recent approaches with maximum accuracy of 98.24% whereas the existing CNN512-dropout model has attained reduced accuracy of 84.10% on the DDR dataset. In the future, the presented method is extended to the design of fusion-based DL models.
Author Contributions
Conceptualization, M.O.; Data curation, N.N.; Formal analysis, N.N.; Funding acquisition, M.A.D.; Investigation, M.K.N.; Methodology, M.O.; Project administration, M.K.N. and M.A.D.; Resources, H.M.; Software, H.M. and M.R.; Supervision, M.R. and A.S.Z.; Validation, A.S.Z. and A.M.; Visualization, A.M.; Writing—original draft, M.O.; Writing—review & editing, M.A.D. All authors have read and agreed to the published version of the manuscript.
Funding
The authors extend their appreciation to the Deanship of Scientific Research at King Khalid University for funding this work through the Large Groups Project under grant number (71/43). Princess Nourah bint Abdulrahman University Researchers Supporting Project number (PNURSP2022R203), Princess Nourah bint Abdulrahman University, Riyadh, Saudi Arabia. The authors would like to thank the Deanship of Scientific Research at Umm Al-Qura University for supporting this work by Grant Code: 22UQU4310373DSR35.
Institutional Review Board Statement
Not applicable.
Informed Consent Statement
Not applicable.
Data Availability Statement
Data sharing is not applicable to this article as no datasets were generated during the current study.
Conflicts of Interest
The authors declare that they have no conflict of interest. The manuscript was written with the contributions of all authors. All authors have given approval for the final version of the manuscript.
References
- Horton, M.B.; Brady, C.J.; Cavallerano, J.; Abramoff, M.; Barker, G.; Chiang, M.F.; Crockett, C.H.; Garg, S.; Karth, P.; Liu, Y.; et al. Practice Guidelines for Ocular Telehealth-Diabetic Retinopathy. Telemed. e-Health 2020, 26, 495–543. [Google Scholar] [CrossRef] [PubMed]
- Pieczynski, J.; Kuklo, P.; Grzybowski, A. The Role of Telemedicine, In-Home Testing and Artificial Intelligence to Alleviate an Increasingly Burdened Healthcare System: Diabetic Retinopathy. Ophthalmol. Ther. 2021, 10, 445–464. [Google Scholar] [CrossRef]
- Ting, D.S.J.; Ang, M.; Mehta, J.S.; Ting, D.S.W. Artificial intelligence-assisted telemedicine platform for cataract screening and management: A potential model of care for global eye health. Br. J. Ophthalmol. 2019, 103, 1537–1538. [Google Scholar] [CrossRef]
- Agrawal, S.; Strzelec, B.; Poręba, R.; Agrawal, A.; Mazur, G. Clinical Characteristics, Preventive Care and Attitude to Telemedicine among Patients with Diabetic Retinopathy: A Cross-Sectional Study. J. Clin. Med. 2021, 10, 249. [Google Scholar] [CrossRef]
- Galiero, R.; Pafundi, P.C.; Nevola, R.; Rinaldi, L.; Acierno, C.; Caturano, A.; Salvatore, T.; Adinolfi, L.E.; Costagliola, C.; Sasso, F.C. The Importance of Telemedicine during COVID-19 Pandemic: A Focus on Diabetic Retinopathy. J. Diabetes Res. 2020, 2020, 1–8. [Google Scholar] [CrossRef] [PubMed]
- Mansberger, S.L.; Sheppler, C.; Barker, G.; Gardiner, S.K.; Demirel, S.; Wooten, K.; Becker, T.M. Long-term comparative effectiveness of telemedicine in providing diabetic retinopathy screening examinations: A randomized clinical trial. JAMA Ophthalmol. 2015, 133, 518–525. [Google Scholar] [CrossRef] [PubMed]
- Grauslund, J. Diabetic retinopathy screening in the emerging era of artificial intelligence. Diabetologia 2022, 65, 1415–1423. [Google Scholar] [CrossRef] [PubMed]
- Nakayama, L.F.; Ribeiro, L.Z.; Gonçalves, M.B.; Ferraz, D.A.; dos Santos, H.N.V.; Malerbi, F.K.; Morales, P.H.; Maia, M.; Regatieri, C.V.S.; Mattos, R.B. Diabetic retinopathy classification for supervised machine learning algorithms. Int. J. Retin. Vitr. 2022, 8, 1–5. [Google Scholar] [CrossRef] [PubMed]
- Salman, O.H.; Taha, Z.; Alsabah, M.Q.; Hussein, Y.S.; Mohammed, A.S.; Aal-Nouman, M. A review on utilizing machine learning technology in the fields of electronic emergency triage and patient priority systems in telemedicine: Coherent taxonomy, motivations, open research challenges and recommendations for intelligent future work. Comput. Methods Programs Biomed. 2021, 209, 106357. [Google Scholar] [CrossRef] [PubMed]
- Fonda, S.J.; Bursell, S.-E.; Lewis, D.G.; Clary, D.; Shahon, D.; Horton, M.B. The Indian Health Service Primary Care-Based Teleophthalmology Program for Diabetic Eye Disease Surveillance and Management. Telemed. e-Health 2020, 26, 1466–1474. [Google Scholar] [CrossRef] [PubMed] [Green Version]
- Wijesinghe, I.; Gamage, C.; Perera, I.; Chitraranjan, C. A Smart Telemedicine System with Deep Learning to Manage Diabetic Retinopathy and Foot Ulcers. In Proceedings of the IEEE 2019 Moratuwa Engineering Research Conference (MERCon), Moratuwa, Sri Lanka, 3–5 July 2019; pp. 686–691. [Google Scholar]
- Reddy, G.T.; Bhattacharya, S.; Ramakrishnan, S.S.; Chowdhary, C.L.; Hakak, S.; Kaluri, R.; Reddy, M.P.K. An ensemble based machine learning model for diabetic retinopathy classification. In Proceedings of the IEEE 2020 International Conference on Emerging Trends in Information Technology and Engineering (ic-ETITE), Vellore, India, 24–25 February 2020; pp. 1–6. [Google Scholar]
- Hacisoftaoglu, R.E.; Karakaya, M.; Sallam, A.B. Deep learning frameworks for diabetic retinopathy detection with smartphone-based retinal imaging systems. Pattern Recognit. Lett. 2020, 135, 409–417. [Google Scholar] [CrossRef] [PubMed]
- Choudhury, A.R.; Bhattacharya, D.; Debnath, A.; Biswas, A. An Integrated Image Processing and Deep Learning Approach for Diabetic Retinopathy Classification. In International Conference on Computational Intelligence, Security and Internet of Things; Springer: Singapore, 2020; pp. 3–15. [Google Scholar]
- Papon, M.; Islam, T. Design and Development of a Deep Learning Based Application for Detecting Diabetic Retinopathy. 2019. Available online: http://lib.buet.ac.bd:8080/xmlui/handle/123456789/5340 (accessed on 3 June 2022).
- Fayemiwo, M.A.; Akinboro, S.A.; Adepegba, O.A. Identification and Classification of Diabetic Retinopathy Using Machine Learning. Adeleke Univ. J. Eng. Technol. 2018, 1, 245–259. [Google Scholar]
- Kumar, S.; Yadav, J.S.; Kurmi, Y.; Baronia, A. An efficient image denoising approach to remove random valued impulse noise by truncating data inside sliding window. In Proceedings of the IEEE 2nd International Conference on Data, Engineering and Applications (IDEA), Bhopal, India, 28–29 February 2020; pp. 1–7. [Google Scholar]
- Saood, A.; Hatem, I. COVID-19 lung CT image segmentation using deep learning methods: U-Net versus SegNet. BMC Med. Imaging 2021, 21, 1–10. [Google Scholar] [CrossRef] [PubMed]
- Gysel, P.; Pimentel, J.; Motamedi, M.; Ghiasi, S. Ristretto: A Framework for Empirical Study of Resource-Efficient Inference in Convolutional Neural Networks. IEEE Trans. Neural Networks Learn. Syst. 2018, 29, 5784–5789. [Google Scholar] [CrossRef] [PubMed]
- Nussbaum-Thom, M.; Cui, J.; Ramabhadran, B.; Goel, V. Acoustic Modeling Using Bidirectional Gated Recurrent Convolutional Units. In Proceedings of the Interspeech 2016, San Francisco, CA, USA, 8–12 September 2016; pp. 390–394. [Google Scholar]
- Hashim, F.A.; Hussain, K.; Houssein, E.H.; Mabrouk, M.S.; Al-Atabany, W. Archimedes optimization algorithm: A new metaheuristic algorithm for solving optimization problems. Appl. Intell. 2020, 1–21. [Google Scholar] [CrossRef]
- Neggaz, I.; Fizazi, H. An Intelligent handcrafted feature selection using Archimedes optimization algorithm for facial analysis. Soft Comput. 2022, 1–30. [Google Scholar] [CrossRef] [PubMed]
- Li, T.; Gao, Y.; Wang, K.; Guo, S.; Liu, H.; Kang, H. Diagnostic assessment of deep learning algorithms for diabetic retinopathy screening. Inf. Sci. 2019, 501, 511–522. [Google Scholar] [CrossRef]
- APTOS 2019 Blindness Detection. Available online: https://www.kaggle.com/c/aptos2019-blindness-detection/overview/evaluation (accessed on 13 May 2022).
- Alyoubi, W.; Abulkhair, M.; Shalash, W. Diabetic Retinopathy Fundus Image Classification and Lesions Localization System Using Deep Learning. Sensors 2021, 21, 3704. [Google Scholar] [CrossRef] [PubMed]
Publisher’s Note: MDPI stays neutral with regard to jurisdictional claims in published maps and institutional affiliations. |
© 2022 by the authors. Licensee MDPI, Basel, Switzerland. This article is an open access article distributed under the terms and conditions of the Creative Commons Attribution (CC BY) license (https://creativecommons.org/licenses/by/4.0/).