Abstract
Formwork lateral pressures are critical with respect to engineering safety, and laboratory tests are often limited by time, height, etc. Formwork lateral pressures are related to early concrete fluid behavior (e.g., thixotropy). In this paper, we propose the use of ultra-deep underground diaphragm walls instead of formwork for conventional lateral pressure testing. During the construction process, three measurement points were set up in an ultra-deep diaphragm wall at −40 m, −80 m and −100 m. The concrete was divided into 22 casts, and the development of lateral pressure and the effect of time on lateral pressure were observed under each of the casts. We found that the characteristic height of all three measurement points was approximately 21 m. The average casting speed for this test was 16.846 m/h, with the fastest speed of 32.148 m/h. A time-dependent phenomenon of rapid rise and fall in lateral pressure with each casting was observed. This method provides a new way to conceptualize formwork lateral pressure, with the advantages of long testing time, high casting height and multiple tests, not only for formwork lateral pressure but also for early age thixotropy measurement of concrete.
1. Introduction
The lateral pressure of poured concrete is influenced by the water–cement ratio [1,2,3], cement type [2,4,5,6], casting speed [1,5], aggregate particle size [6], surface roughness of the formwork [7] and chemical admixtures [1,8]. In general, these influences change the lateral pressure by altering the flowability of the concrete. Lateral pressure maxima occur in concrete during placement, and the height at which the peak occurs is referred to as the characteristic height [9]. During pouring, the formwork is subjected to environmental, impact, static and other loads [10]. Understanding the lateral pressure of concrete fluids is essential to reduce economic costs and to design safe and strong formwork. Formwork for concrete structures is usually designed by field engineers based on their engineering experience to facilitate construction and reduce costs. This approach saves material during construction but also poses construction risks, such as formwork expansion or bursting. Therefore, there is an urgent need for accurate and practical formwork pressure calculation formulae in the relevant codes and guidelines.
Proske and Graubner [11] developed a new method to model the formwork pressure of highly fluid self-compacting concrete. However, their model only considers the casting rate and setting time and ignores other influencing factors, such as cement type. Teixeira et al. [12] added several parameters to the empirical model developed by Santilli and Puente [13], namely slump flow rate, concrete temperature, casting rate, cement type, the height of the casting, and minimum and maximum dimensions of the cross section. These factors were identified by regression analysis of measured and calculated pressures, treating each of these factors as a factor (K). They assumed a bilinear distribution; however, this is not always the case due to the thixotropic behavior of concrete. The model also ignores concrete behavior and structural construction. Another model that can be used for the design of self-compacting concrete formwork was included in the DIN 18218 standard [14]. This model describes the pressure measurement of vertical formwork for freshly placed concrete of varying strength classes. It assumes the use of internal vibrators during the casting process for casting heights <10 m, so the applicability of this model is very limited. In summary, the prediction equation for formwork pressure is incomplete, especially at high casting rates [15,16,17]. In this case, the full hydrostatic pressure applied by the “fluid” concrete [18] was used to set the upper limit as a result of the limitations of common test methods.
The lateral pressure of poured concrete is not only related to formwork safety but also closely related to early age properties of the concrete, such as thixotropy and setting time [4,5]. Normal field testing of formwork pressure is usually performed by pouring experimental columns and/or walls, although this method is subject to several limitations. First, the size of the test is limited by cost and site constraints. Laboratory tests are usually below 2.5 m [19,20,21], and the height of columns and walls is usually between 5 m and 10 m. Second, due to the limited height, the casting time is very short, usually within a few minutes. Therefore, there is no time to study the thixotropy of the concrete during the pouring process. There are two types of filling processes: filling from the top of the formwork and filling from the bottom of the formwork. The advantages and disadvantages of these two methods are summarized in [22]. Most importantly, due to thixotropy, the concrete in the lower part of the formwork starts to build a structure that can withstand the pressure of the concrete above. This process is continuously interrupted when the formwork is filled from the bottom up, leading to increased horizontal pressure on the formwork walls.
In the present study, lateral pressure tests were carried out during the construction of an ultra-deep underground diaphragm wall. The formwork pressure was obtained by monitoring the lateral pressure of the concrete during the placement of the diaphragm wall. Pressure gauges were mounted on reinforcement bars at the edges of the wall, which were close to the natural soil. The advantages of this method are as follows. First, the test can be performed during the construction of the diaphragm wall. There is no need to build additional test walls and columns. The height of the test depends on the depth of the underground diaphragm wall, which usually exceeds 40 m and sometimes extending to 100 m. This is much higher than test walls and test columns above ground. Secondly, the test time is longer—as many as several hours—offering the possibility of testing the thixotropy of the concrete [19,20,21,22,23]. Although no pump is used in this method and the concrete is pumped by gravity, the peak casting speed can be as fast as 32 m/h. Third, batch casting provides more viewing angles for observation of lateral pressures or other test parameters. Three test points were used for three sets of tests in the present study, and additional test points can be added if needed. This method can be used to vary the casting speed by changing the cross-sectional area of the ultra-deep ground connection wall as needed.
2. Materials and Methods
2.1. Materials
The cement used in this test was P.II 52.5 silicate cement with a specific surface area of 362 m2/kg, an overview of which is given in Table 1. The particle size of round aggregates was 30 mm. The admixture used in the test is the third generation of polycarboxylic acid water-reducing agent. The slump of the concrete was 240 mm. The chemical composition of the cement is listed in Table 2.

Table 1.
Concrete composition in kg/m3.
Table 2.
Chemical composition of cement.
2.2. Underground Diaphragm Wall Filling Test
The project is located in Shanghai, and the underground diaphragm wall reaches a depth of 120 m, crossing 9 layers of soil from top to bottom. The foundation soil of the site comprises Quaternary loose sediments within the scope of the survey depth, mainly composed of saturated clay soil, silty soil and sandy soil. The groundwater depth is 0.5 m. The foundation was first excavated with a trench-milling machine; then, the wall was protected with mud, and after completion, a reinforcement cage was placed, and finally, concrete was casted instead of mud. The site conditions are shown in Figure 1.
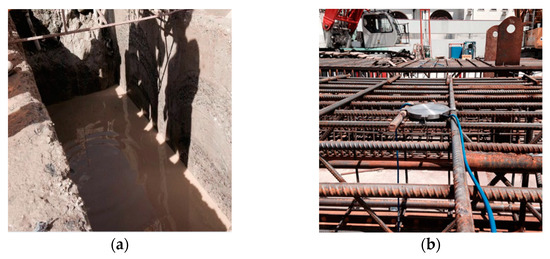
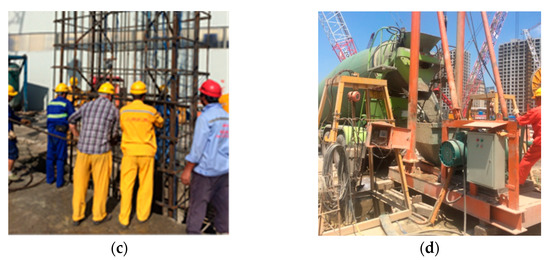
Figure 1.
Construction site pictures. (a) Notch of the underground diaphragm wall; (b) lateral pressure gauge on the reinforcement cage; (c) hoisting the reinforcement cage; (d) pouring concrete.
For the test, we used a fiber optic grating earth pressure meter (model MW12-BGK-4810) with a range of 5 MPa and a resolving power of 0.04% FS. The reinforcement cage was divided into three sections, each with a height of 40 m. In the actual installation process, premixed, quick-setting cement mortar or epoxy mortar was smoothed on the surface of the underground diaphragm wall; then, a manometer was pressed into the cement mortar so that the excess cement mortar was squeezed out. The manometer was held still until the cement mortar set, then mounted on the reinforcing cage by adding bolts and tightening or using steel nail side manometers with the sensing side of the side manometer facing inward. The sensor wires on each section of the cage were brought together at the end of the cage and extended along the outer side wall to the collection system as the cage was lifted into the tank.
The lateral pressure was monitored in situ by constructing an ultra-deep underground diaphragm wall at a depth of 120 m and a trench with dimensions of 2.8 × 1.2 m. Four fiber Bragg grating lateral pressure gauges were installed at −40 m, −80 m, −100 m and −120 m along the height direction. The diameter of its carrier plate was 230 mm, and its range was 5 MPa. The specific layout details are shown in Figure 2, where the black box represents the reinforcement cage, and the blue Y icon represents the side pressure gauge.
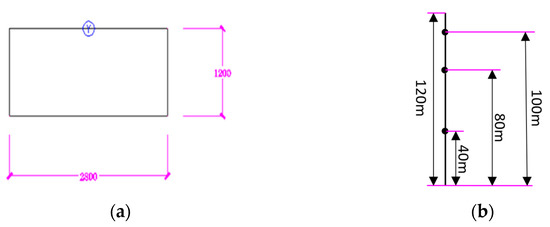
Figure 2.
Diagram of pressure sensor locations. (a) Placement of pressure sensors on the cross section; (b) placement of the measuring instrument in the vertical direction.
The submerged concrete used in the present study has a compressive strength of 40 MPa after 28 days. The percentage of longitudinal reinforcement in this underground diaphragm wall is 0.7%. The casting of this underground diaphragm wall lasted 16 h, with 375 m3 of concrete casted from the bottom up in 21 concrete mixer trucks, each containing 18 m3 of concrete, with an average casting speed of 16.846 m/h. The peak casting speed of one truck reached 32.148 m/h if the casting was easy.
3. Results
The time recorded on site was subject to the arrival of the concrete tanker at the site. When the concrete actually reached the designated position, it needed to pass through a pipeline of corresponding length. According to this theory, the time recorded on site needs to be deducted in some cases.
where t is the flow time of concrete in the pipe (s), ti is the concrete casting time for the i-th concrete tanker (s), r is the pipe inner diameter (0.15 m), l is the casting length of the same length as the instrument position(m), Q is the concrete capacity of the pipeline within flow length (m3), Qi is the capacity of the i-th concrete tanker (m3) and v is the average flow velocity of concrete according to the casting velocity when the location is submerged by concrete (m/s). For example, the 100 m location was submerged by the fourth concrete tanker, so this velocity is the casting velocity of the fourth concrete tanker. Because the vehicle models were the same, the capacity of each concrete tanker was 18 m3. Taking the 100 m position as an example, the flow length of the sensor concrete at −100 m is 100 m, and the concrete casting time for the fourth concrete tanker (t4) is 18 min, so the calculated time (t) is 7 min.
When the −100 m, −80 m and −40 m positions were submerged by concrete, they were the 4th, 7th, 14th and 15th loads, respectively, and the casting time was 18 min, 18 min, 25 min and 22 min, respectively, with the casting time at the 40 m position was taken as 23.5 min. According to the above formula, the delay times were 7 min, 5.6 min and 3.7 min, respectively. Considering the recording time as the vehicle approach time, and deducting a 5 min delay, the actual delay times corresponded to 12 min, 10.6 min and 8.7 min.
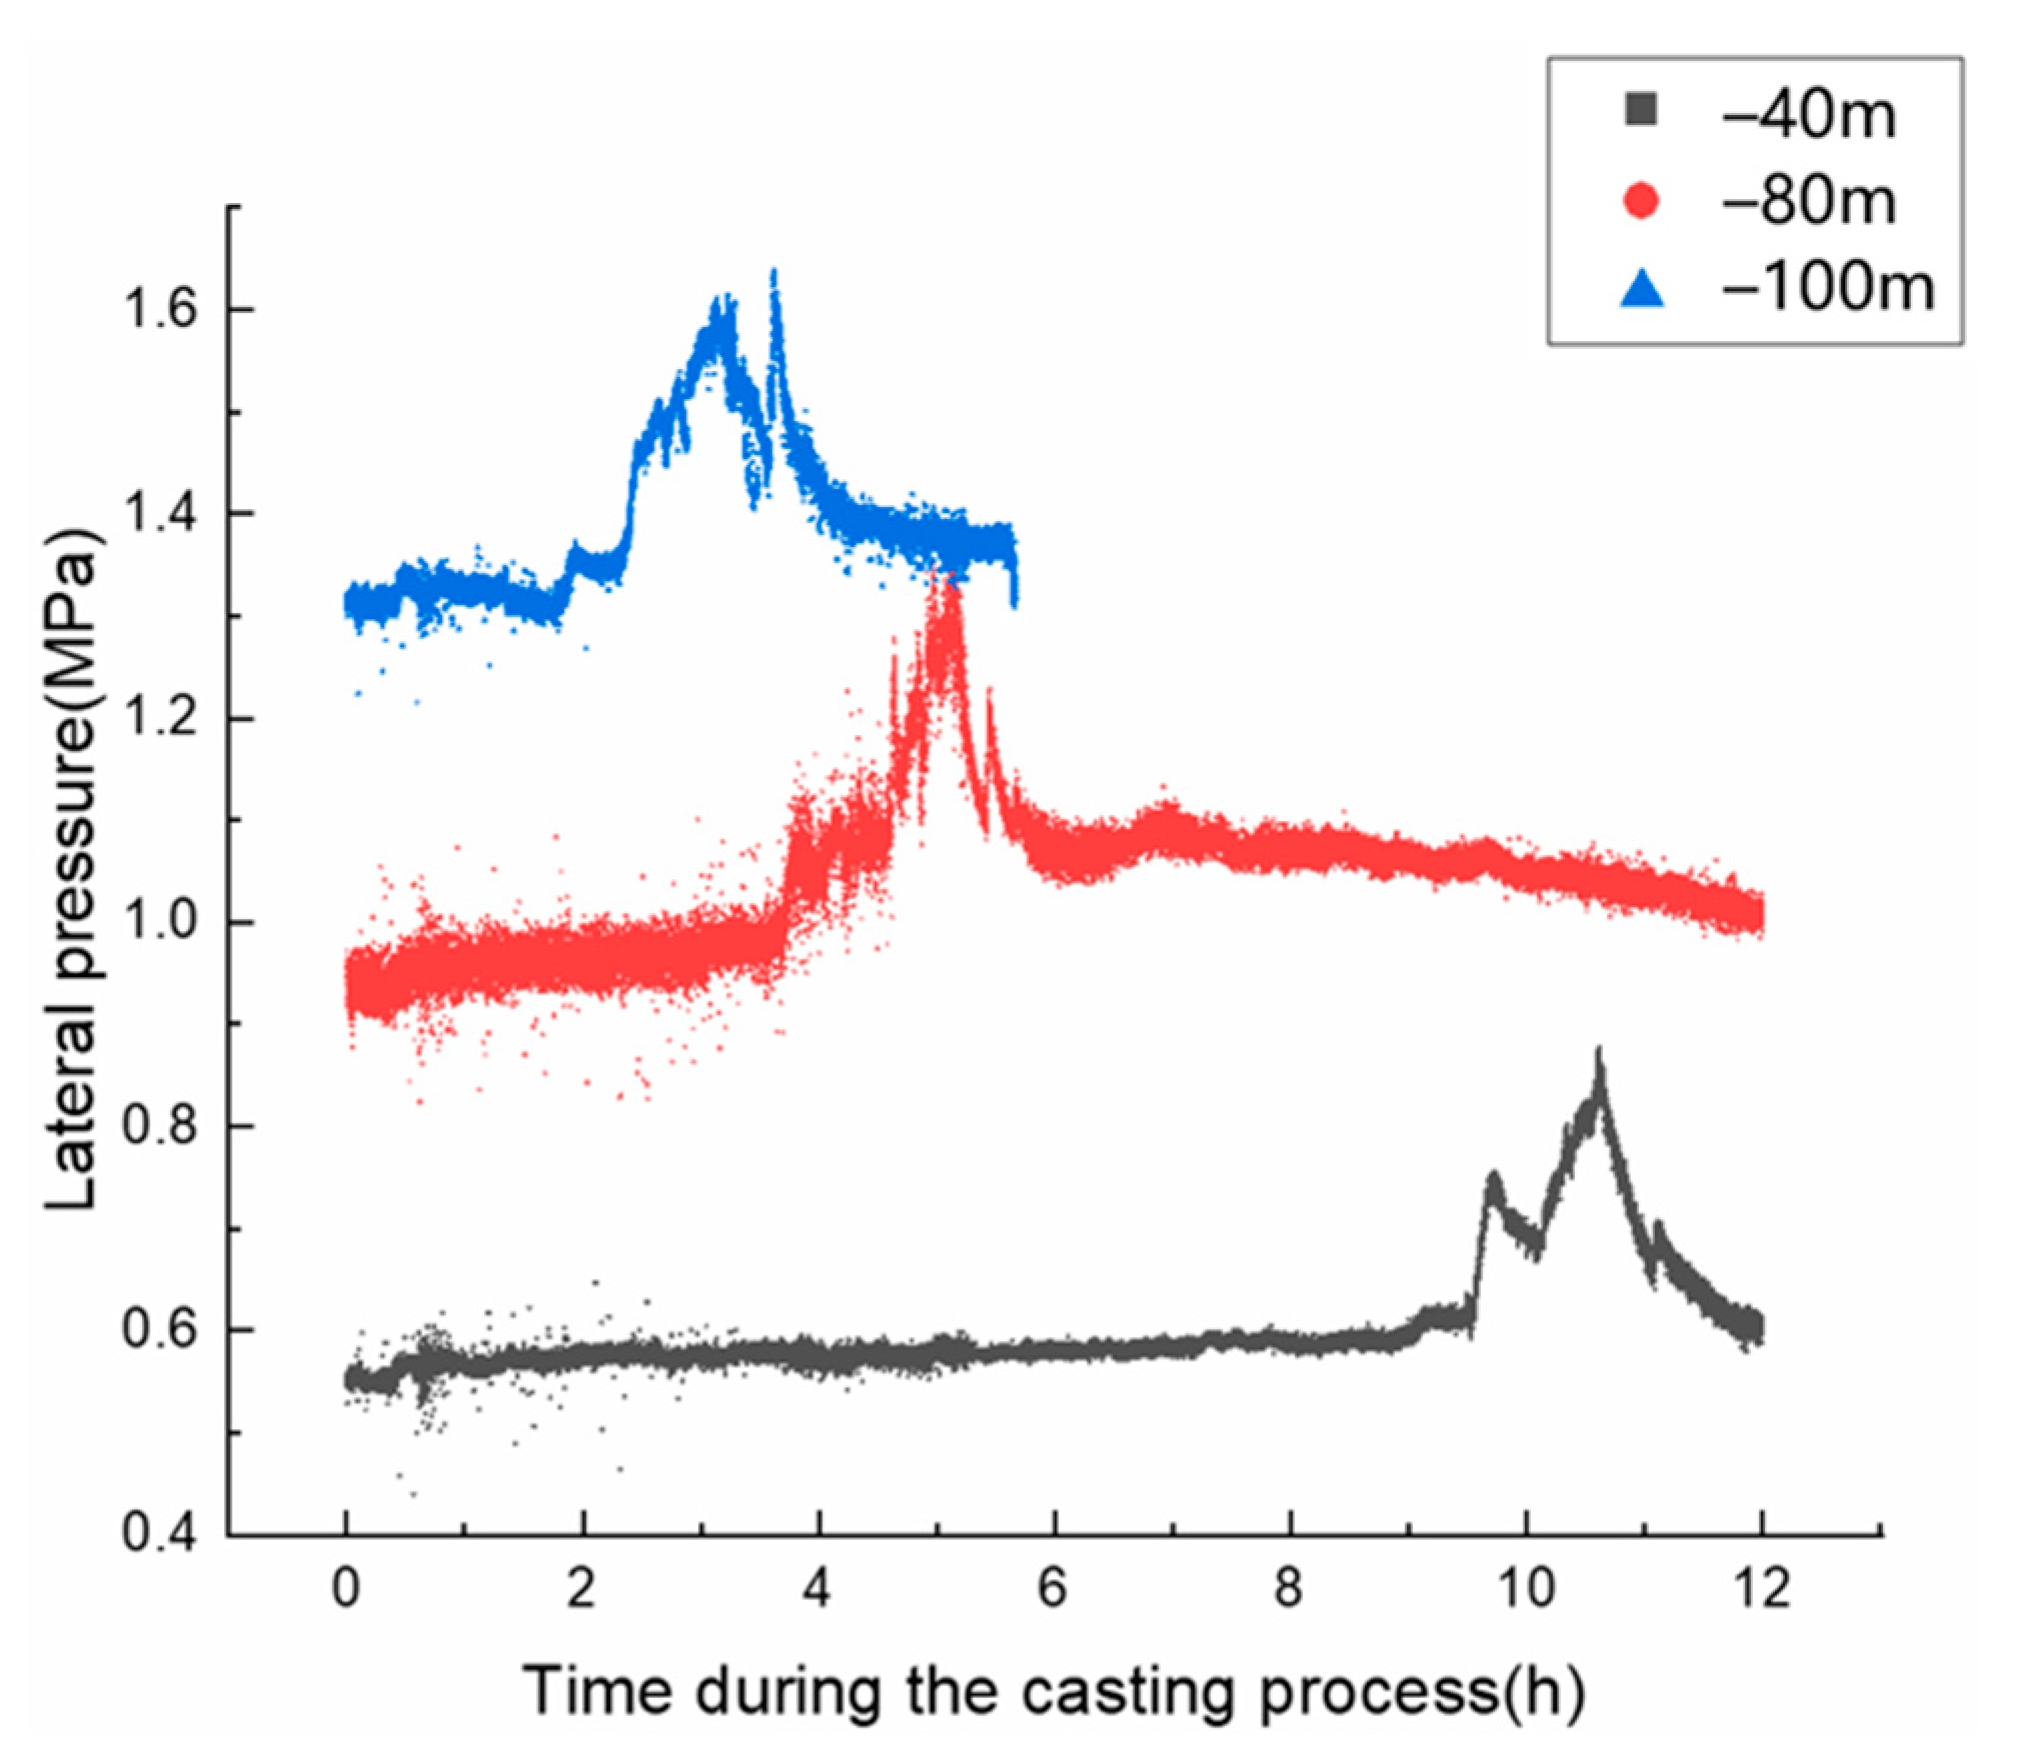
At the heights of −100 m, −80 m and −40 m, the initial mud pressure in the lateral direction before casting was 1.3 MPa, 1 MPa and 0.52 MPa, respectively, which was about 1.3 times higher than the hydrostatic pressure. According to monitoring data, the lateral pressure gradually increased and then decreased as concrete casting progressed. The peak pressures at the three measurement points were 1.6 MPa, 1.4 MPa and 0.9 MPa. In general, the results show that the lateral pressure increased by 30% to 50% relative to the initial slurry pressure during the casting process. When the concrete was finally set, the final value of the lateral pressure was almost the same as the initial value.
Figure 3 shows the development of the lateral pressure at the three measured points from the beginning of the cast. The lateral pressure meter at the −100 m measurement point was damaged six hours after casting. The monitoring meter data was lost after twelve hours of casting, and the monitoring ended. For each measurement point, time points four hours before and after the peak were selected for further analysis; the data are detailed in Figure 4 and Table 3.
Figure 3.
Development of lateral pressure during the filling process.
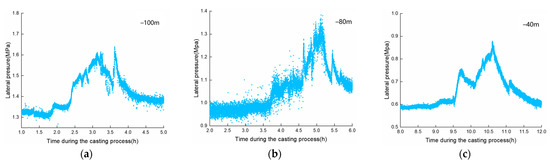
Figure 4.
Development of lateral pressure during the filling process (partial enlarged view). (a) The depth of the measurement point is 100 m; (b) the depth of the measurement point is 80 m; (c) the depth of the measurement point is 40 m.
Table 3.
Casting time per truck and effective lateral pressure before and after the peak at each monitoring point.
In Table 3, the negative value of the lateral pressure increments at the −100 m measurement point caused by the fourth car casting is the results of test errors and falls within the allowable error range. The lateral pressure at each measurement point is positive until it reaches its peak and then appears negative because each cast before reaching the peak affects the cohesion of the unconsolidated concrete, reducing it again and increasing the concrete fluidity. The lateral pressure at each measurement point reaches its maximum lateral pressure in approximately 1.5 hours above the hydrostatic pressure. During this process, the concrete in the vicinity of the measurement point gradually sets, and the cohesion is no longer affected by the new round of pouring. With time, the degree of setting increases, and the fluidity of the concrete decreases, so the lateral pressure increment appears negative. If the interval between two casts is short, there is also be a slightly positive value of the lateral pressure increment.
As shown in Figure 5a, the lateral pressure remains at roughly 1.325 MPa, i.e., the slurry hydrostatic pressure value, until the fourth cast. The fourth to seventh castings cause a rapid increase in the lateral pressure value, especially the fifth casting, followed by a gradual hardening of the concrete during the casting interval and a decrease in the lateral pressure value. The lateral pressure increases by 3.25 MPa, and the rise time lasts for 2 h. The lateral pressure stops increasing and gradually decreases from the after the eights cast. As shown in Figure 5b, the lateral pressure value increased significantly from the sixth to the ninth cast and decreased slightly during the interval between casts, with the increase time lasting for 2.5 h and lateral pressure increase of 0.4 MPa. After the ninth cast, the lateral pressure did not show a significant increasing trend and leveled off. The trend shown in Figure 5c is similar to that depicted the first two graphs, and the 14th to 17th casts all caused a change in lateral pressure, with a particularly obvious increase in the 15th cast. The lateral pressure decreased significantly after the 17th cast. Although the 18th and 19th casts caused a slight increase in lateral pressure, a decreasing trend still occurred at the end of the casting process.
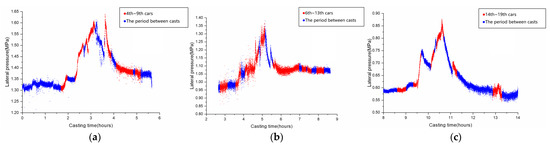
Figure 5.
Effect of the number of casts on lateral pressure at depths of 100 m, 80 m and 40 m. (a) The depth of the measurement point is 100 m; the red dots indicate the casting period (fourth to ninth cars), and the blue dots indicate the period between casts. (b) The depth of the measurement point is 80 m; the red dots indicate the casting period (6th to 13th cars), and the blue dots indicate the period between casts. (c) The depth of the measurement point is 40 m; the red dots indicate the casting period (14th to 19th cars), and the blue dots indicate the period between casts.
Figure 5 shows that all four casts before reaching the peak caused an increase in lateral pressure, which subsequently decreased due to hardening. The increase in lateral pressure at different heights lasted for about 2.5 h, whereas a decrease occurred rapidly for the next 0.5 h, after which the lateral pressure plateaued. The height corresponding to each cast can be calculated based on the volume of concrete loaded in each mixer truck and the area of the slot. If the height required for each measurement point from the beginning of the change in lateral pressure to the peak is defined as the characteristic height, the characteristic height can be calculated as approximately 21 m.
As shown in Figure 6, the lateral pressures at each of the three measured points were measured after the lateral pressure exceeded the respective hydrostatic pressure. Interestingly, the most prominent points all occurred at a relative template height of about 21 m; therefore, this was defined as the characteristic height. The lateral pressure tends to increase above the characteristic height and decrease almost linearly below this height. The main reason for the decrease in lateral pressure is the gradual hardening of the concrete, which limits its flowability.
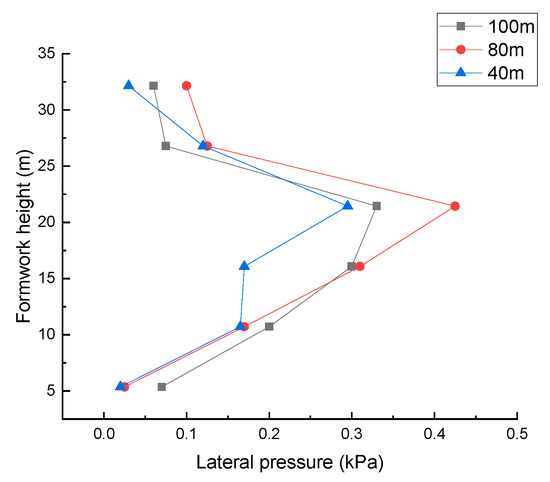
Figure 6.
Change in maximum lateral pressure relative to casting height.
Table 4 shows the speed of 22 concrete casts; the maximum casting speed was 32.148 m/h, the minimum casting speed was 3.78 m/h and the average speed of casting was about 16.846 m/h. This is far less than the casting speed of conventional site wall and column tests. The considerable difference between the maximum value and the minimum value of the speed is a result of the blockage of the pipe during the casting process. The unclogging of the pipes resulted in a non-uniform casting interval.
Table 4.
Casting speed per truck.
4. Discussion
4.1. Lateral Pressure
The formula for predicting lateral pressure recommended by some national codes is usually divided into two parts. The first part involves a more detailed formula that takes into account the initial casting temperature of the concrete, formwork shape, etc. This formula is generally used for slower casting rates. On the other hand, a simpler formula is used for faster casting rates, taking into account only the cast height of the concrete and its gravity. In the present study, the casting speed was very fast, and the casting height was very high. The theoretical maximum value of the transverse pressure was obtained using the latter equation. The hydrostatic pressure suggested by ACI 347 differs from that obtained with Equation (1) in that it underestimates the maximum lateral pressure. The lateral pressure data measured in this test are summarized in Table 5.
where F is the maximum lateral pressure (kN/m2), is the unit weight of concrete (kN/m3) and h is the casting height (m).
Table 5.
Summary of the lateral pressure during the filling process (MPa).
In summary, the casting of concrete for underground diaphragm walls is a slurry exchange job. According to monitoring data, the lateral pressure is inconsistent, and each curve exhibits several small peaks before reaching its maximum peak. Due to the discontinuity of the concrete placement, the impact loads are very characteristic. In the case of very deep underground diaphragm walls and high concrete volumes, the peak casting velocity can be much higher than the average casting velocity.
4.2. Feature Height
The experimental results show that the characteristic height was is 21 m, which is the height at which the concrete fluid increased from the beginning of the change in lateral pressure at each test point until it reached its peak. After the characteristic height, the lateral pressure at each test point decreases linearly for a period of time and then converges to a value 0–10% higher than the original lateral pressure. A similar phenomenon has been reported in the literature [20]. The feature height mentioned in the literature is roughly 600 mm, which is considerably different from the feature height obtained in the present study. The height at which the peak lateral pressure occurs also differs by an order of magnitude from the result obtained in the present test. This may be related to size of the structure and the cement type. The same template height was used to measure the characteristic height in the literature [20]. In the present study, the same height of lateral pressure data and hydrostatic pressure was used as the reference surface height, and the measurement points were the same height as the respective reference surface. Therefore, this method is in general agreement with the literature method.
4.3. Thixotropy
The thixotropic nature of concrete causes it to regain fluidity if it is stirred by external forces during the hardening process. As solidification occurs, the internal cohesion of the concrete gradually increases, and the lateral pressure decreases. If pouring is carried out again, the cohesion is destroyed, the fluidity increases again and the lateral pressure increases [24]. As shown in Figure 5, the casting of concrete leads to a significant rise in lateral pressure. The effect of thixotropy lasts for about 2.5 h at all heights, after which the effect disappears. It can be concluded that thixotropy is only affected below the characteristic height during the casting process.
4.4. Casting Speed
The main purpose of this project was to cast a ground connection wall, not for the test. Due to the large cross-sectional area of the wall, the casting speed was slow. The data in Table 3 and Table 4 show that the speed of 22 concrete casts did not have a significant effect on the increase in lateral pressure, which may have been caused by the low casting speed. This opens up the possibility of thixotropy tests. For a column or wall, a casting speed of 0.005 m3/s divided by a cross-sectional area of 0.03654 m2 equals 0.137 m/s. However, for the ultra-deep underground diaphragm wall in this test, even if the casting speed reaches 0.023 m3/s, after dividing by a cross-sectional area of 3.36 m2, the concrete rises at a rate of only 0.00687 m/s, which is 0.05 times the speed of wall or column casting. The cross-sectional area of the ultra-deep diaphragm wall in this test was a constant value and did not change during the pouring process. If the cross-sectional area suddenly decreases, the pouring speed increases abruptly, and the tendency of lateral pressure growth will be more obvious.
5. Conclusions
The purpose of this paper was to highlight that during the casting process of underground diaphragm walls, field test of formwork pressure can be replaced by a lateral pressure field, which is lasts for longer and is less expensive; therefore, the casting speed can be manipulated according to specific needs. In this study, the casting time was as long as 12 h, which offered the possibility of studying thixotropy. The average casting speed was 16.846 m/h, with a maximum speed of 32.148 m/h.
Furthermore, existing formwork pressure prediction equations are described in detail only at slower casting speeds. However, when the casting speed is fast, the equation simply calculates the lateral pressure as hydrostatic pressure or fluid lateral pressure, which is not accurate according to the results of the present study. Therefore, more research is needed on this approach to achieve more accurate predictions for future technical standards and regulations.
Author Contributions
W.J. conceived the study, edited the draft of the manuscript and analyzed the results. W.J., X.Z. and Z.H. conducted the literature review and wrote the first draft of the manuscript. All authors have read and agreed to the published version of the manuscript.
Funding
This research was financially supported by the National Natural Science Foundation of China (grant number 52178240) and the “Top Discipline Plan of Shanghai Universities—Class I”, which are gratefully acknowledged.
Institutional Review Board Statement
Not applicable.
Informed Consent Statement
Not applicable.
Data Availability Statement
All data generated or used during the study appear in the submitted article.
Conflicts of Interest
The authors declare that they have no known competing financial interests or personal relationships that could have appeared to influence the work reported in this paper.
References
- Assaad, J.J.; Khayat, K.H. Effect of casting rate and concrete temperature on formwork pressure of self-consolidating concrete. Mater. Struct. 2006, 39, 333–341. [Google Scholar] [CrossRef]
- Ghoddousi, P.; Javid, A.A.S.; Amiri, G.G.; Donyadideh, K. Predicting the Formwork Lateral Pressure of Self-consolidating Concrete Based on Experimental Thixotropy Values. Int. J. Civ. Eng. 2018, 17, 1131–1144. [Google Scholar] [CrossRef]
- Khayat, K.H.; Assaad, J.J. Effect of w/cm and High-Range Water-Reducing Admixture on Formwork Pressure and Thixotropy of Self-Consolidating Concrete. ACI Mater. J. 2006, 103, 186–193. [Google Scholar]
- Kim, J.H.; Noemi, N.; Shah, S.P. Effect of powder materials on the rheology and formwork pressure of self-consolidating concrete. Cem. Concr. Compos. 2012, 34, 746–753. [Google Scholar] [CrossRef]
- Cygan, G.; Golaszewski, J.; Drewniok, M.P. Influence of Type of Cement on the SCC Formwork Pressure During and After Casting. In IOP Conference Series: Materials Science and Engineering; IOP Publishing: Bristol, UK, 2019; Volume 471. [Google Scholar]
- Wu, W.; Li, X. Lateral Stress Characteristics of Steel Structure Wall Module Exerted by Self-Compacting Concrete. Iran. J. Sci. Technol. Trans. Civ. Eng. 2020, 44, 79–89. [Google Scholar] [CrossRef]
- Gamil, Y.; Nilimaa, J.; Emborg, M.; Cwirzen, A. Lateral Formwork Pressure for Self-Compacting Concrete—A Review of Prediction Models and Monitoring Technologies. Materials 2021, 14, 4767. [Google Scholar] [CrossRef] [PubMed]
- Proske, T.; Graubner, C.A. Formwork Pressure of Highly Workable Concrete—Experiments Focused on Setting, Vibration and Design Approach; Springer: Dordrecht, The Netherlands, 2010. [Google Scholar]
- Assaad, J.J.; Khayat, K.H. Formwork Pressure of Self-Consolidating Concrete Made with Various Binder Types and Contents. ACI Mater. J. 2005, 102, 215–223. [Google Scholar]
- Arslan, M.; Simsek, O.; Subasi, S. Effects of formwork surface materials on concrete lateral pressure. Constr. Build. Mater. 2005, 19, 319–325. [Google Scholar] [CrossRef]
- Teixeira, S.; Puente, I.; Santilli, A. Statistical model for predicting the maximum lateral pressure exerted by Self-Consolidating Concrete on vertical formwork. J. Build. Eng. 2017, 12, 77–86. [Google Scholar] [CrossRef]
- Santilli, A.; Puente, I. An empirical model to predict fresh concrete lateral pressure. Constr. Build. Mater. 2013, 47, 379–388. [Google Scholar] [CrossRef]
- DIN 18218; DIN Standard on Formwork Pressures Updated. American Concrete Institute: Farmington Hills, MI, USA, 2010; pp. 27–29.
- Billberg, P.H.; Roussel, N.; Amziane, S.; Beitzel, M.; Charitou, G.; Freund, B.; Gardner, J.N.; Grampeix, G.; Graubner, C.A.; Keller, L. Field validation of models for predicting lateral form pressure exerted by SCC. Cem. Concr. Compos. 2014, 54, 70–79. [Google Scholar] [CrossRef]
- Billberg, P. Form Pressure Generated by Self-Compacting Concrete—Influence of Thixotropy and Structural Behaviour at Rest; Royal Institute of Technology: Stockholm, Sweden, 2006. [Google Scholar]
- Khayat, K.H.; Bonen, D.; Shah, S.; Taylor, P. SCC Formwork pressure Task 1: Capturing Existing Knowledge on Formwork Pressure Exerted by SCC; National Ready-Mix Concrete Research Foundation—American Concrete Institute: Farmington Hills, MI, USA, 2007. [Google Scholar]
- Tichko, S.; Van De Maele, J.; Vanmassenhove, N.; De Schutter, G.; Vierendeels, J.; Verhoeven, R.; Troch, P. Numerical simulation of formwork pressure while pumping self-compacting concrete bottom-up. Eng. Struct. 2014, 70, 218–233. [Google Scholar] [CrossRef]
- Santilli, A.; Puente, I.; Tanco, M. A factorial design study to determine the significant parameters of fresh concrete lateral pressure and initial rate of pressure decay. Constr. Build. Mater. 2011, 25, 1946–1955. [Google Scholar] [CrossRef]
- Park, C.; Kim, J.H.; Han, S.H. A pore water pressure diffusion model to predict formwork pressure exerted by freshly mixed concrete. Cem. Concr. Compos. 2017, 75, 1–9. [Google Scholar] [CrossRef]
- Yang, Y.; Ding, X.; Liu, Y.; Deng, L.; Lv, F.; Zhao, S. Lateral Pressure Test of Vertical Joint Concrete and Formwork Optimization Design for Monolithic Precast Concrete Structure. Buildings 2022, 12, 261. [Google Scholar] [CrossRef]
- Schutter, G.D.; Feys, D.; Verhoeven, R. Ecological Profit for a Cocnrete Pipe Factory Due to Self-Compacting Concrete Technology. In Proceedings of the International Conference on Sustainable Construction Materials & Technologies, Ancona, Italy, 28–30 June 2010. [Google Scholar]
- Assaad, J.J.; Khayat, K.H.; Mesbah, H.A. Variation of formwork pressure with thixotropy of self-consolidating concrete. ACI Mater. J. 2014, 100, 29–37. [Google Scholar]
- Assaad, J.J.; Khayat, K.H. Effect of Viscosity-Enhancing Admixtures on Formwork Pressure and Thixotropy of Self-Consolidating Concrete. ACI Mater. J. 2006, 103, 280–287. [Google Scholar]
- Khayat, K.H.; Assaad, J.J. Influence of Internal Friction and Cohesion on Formwork Pressure of Self-Compacting Concrete. In Proceedings of the SCC’2005-China—1st International Symposium on Design, Performance and Use of Self-Consolidating Concrete, Hunan, China, 26–28 May 2005. [Google Scholar]


Publisher’s Note: MDPI stays neutral with regard to jurisdictional claims in published maps and institutional affiliations. |
© 2022 by the authors. Licensee MDPI, Basel, Switzerland. This article is an open access article distributed under the terms and conditions of the Creative Commons Attribution (CC BY) license (https://creativecommons.org/licenses/by/4.0/).