Article

Dynamic Response of Reinforced Recycled Aggregate Concrete Pavement under Impact Loading

1
Department of Civil and Airport Engineering, Nanjing University of Aeronautics and Astronautics, 29 Yudao St., Nanjing 210016, China
2
Taizhou Insititute of Science and Technology, Nanjing University of Science and Technology, 8 Meilan East St., Taizhou 225300, China
3
Department of Architectural Engineering, School of Civil and Architectural Engineering, Shandong University of Technology, Zibo 255000, China
4
Department of Architectural Engineering, School of Civil Engineering, Wuhan University, 8 Donghu South Rd., Wuhan 430072, China
5
China Railway 11 Bureau Group Co., Ltd., 277 Zhongshan Rd., Wuhan 430061, China
*
Author to whom correspondence should be addressed.
Appl. Sci. 2022, 12(17), 8804; https://doi.org/10.3390/app12178804
Submission received: 16 August 2022 / Revised: 28 August 2022 / Accepted: 30 August 2022 / Published: 1 September 2022
(This article belongs to the Special Issue Blast and Impact Engineering on Structures and Materials)

Abstract

:
Airport runway pavements often undergo the direct impact of aircraft landings. For the purposes of designing the structure, it is of great importance to know about the dynamic response of the pavement and its behavior under impact loading. However, the dynamics and failure mechanisms of reinforced recycled aggregate concrete pavements subjected to impact loading are seldom explored in the literature. For this purpose, four reinforced recycled aggregate concrete pavements with different thickness and ratios of reinforcement, and one reinforced normal concrete pavement, were manufactured and tested under impact loading using the drop-weight impact frame system. The impact force characteristics, crack patterns, deformation responses, and strain developments of reinforced concrete pavements subjected to impact loading were evaluated and compared. The above-mentioned study revealed that with an increase in the reinforcement ratio, both the deformation and the steel strain were reduced. Increasing the thickness would reduce the degree of damage and the impact force of reinforced concrete pavement (RCP) but increase the deformation. The results show that under the same compressive strength, the dynamic performance of the reinforced recycled aggregate concrete pavement was worse than that of the reinforced normal concrete pavement because of its lower elastic modulus and weaker interfacial transition zone. The dynamic performance of reinforced recycled aggregate concrete pavement could be improved by increasing the thickness and reinforcement ratio. The use of recycled aggregate concrete (RAC) in RCP is a technically feasible application of the material within the scope of this experimental study.

1. Introduction

With the development of national defense construction and civil aviation and the use of a large number of high-speed heavy aircraft, the safety and reliability of airport runway structures are highly sought after. The airport runway system does not only bear the direct impact caused by aircraft landing, but also may encounter large impact loading due to the hard landings of aircraft crashes [1]. Currently, the design specifications of airport pavement structure take the structure under static load as the research object, while impact effects due to hard landings have not been taken into consideration in the design of airport runway pavements [2,3]. It should be emphasized that airport pavements are constructed to provide adequate support for the loads imposed by airplanes, and produce a firm, stable, and smooth surface, and it should be strictly required that there will be no debris or other particles caused by landing, or they could be sucked into the engine and cause serious engineering accidents. In order to satisfactorily meet these requirements, the pavement must be of sufficiently good quality to ensure not failing under the applied load.
Reinforced concrete pavement (RCP) refers to a pavement with embedded steel reinforcing bars in the concrete for crack control. The bars keep the cracks tightly closed, thus allowing longer joint spacing, resulting in an intact and smooth surface that ensures structural integrity and improves the performance of the pavement [4,5]. Reinforced concrete pavement is widely used in airport runway landing areas due to its good performance and low maintenance needs.
The performance of RCP depends on critical stresses and deflections imposed by repeated traffic and environmental loading, and fatigue fracture caused by these stresses is considered to be the limit state in the design of pavement structure. Therefore, in the current design code provisions on pavements, the main task is to determine the thickness of each component of the pavement structure to ensure that it can provide a satisfactory structural life at design fatigue limits. At present, the widely available analysis method of wheel load stress is based on Hertz’s elastic thin plate theory [6], and Westergaard [7] has further proposed the solution of Winkler foundation under different load conditions. With the emergence of finite element software, the mechanical stresses are evaluated by a three-dimensional analysis and thermal stresses by two-dimensional analysis [8,9,10,11]. However, neither the Federal Aeronautics Administration (FAA) nor the Civil Aviation Administration of China (CAAC) considers impact effects due to hard landings of heavy aircraft in the design of airport runway pavements. The design code recommends that the dynamic effect be taken into account by multiplying the dynamic amplification factor.
A large amount of abandoned concrete is produced during the reconstruction and extension of airport runways, which has a substantial effect on the environment. Sustainability concerns are at the forefront of our society; unfortunately, the abandoned concrete is a non-renewable resource. The use of recycled waste concretes in construction application and pavement construction is one way to promote sustainable development. Consequently, many researchers have investigated the use of recycled concrete aggregate (RCA) in the production of new concrete, which is named recycled aggregate concrete (RAC). Most findings have indicated that the compressive strength, splitting tensile strength, flexural strength, and modulus of elasticity for RAC decrease with an increase in the content of RCA [12,13,14,15]. Furthermore, some pieces in the literature have studied RAC structural elements, such as columns, beams, slabs, and pavements; the results show that the incorporation of RAC has negative effects on the performance of these elements [16,17,18,19,20,21]. In general, the desired reduction caused by using RAC is limited, and further engineering research is encouraged, since satisfactory performance can still be achieved.
Dynamic response of reinforced concrete structural elements under impact loading has been investigated through experiments by many researchers [22,23,24,25,26,27,28,29]. Zineddin et al. [23,24] investigated the effects of different types of slab reinforcements and impact energy on the dynamic response and behavior of reinforced concrete slabs. The addition of steel reinforcement provided substantial strength enhancement to the slab, promoted crack formation on the top surface, and increased the stresses and strains that the concrete and steel materials could safely undergo, especially under higher impact energy. Othman et al. [25] conducted an experiment to investigate the effect of steel reinforcement distribution on the dynamic response of high strength concrete (HSC) plates, taking into account the effects of the main bottom steel reinforcement ratio (1.0, 2.0, and 3.0%) and the steel reinforcement arrangement (single or doubly reinforced plates). The results showed that the change of reinforcement ratio and/or reinforcement arrangement has no significant effect on impulse and absorbed energy values for same impact loading condition, while the impact duration decreased with the increase in reinforcement ratio. The reinforcement arrangement could affect the crack pattern; the HSC plates with single reinforcement typically failed by localized sudden punching, and the HSC plates doubly reinforced typically failed in a ductile punching mode.
Xiao et al. [26] studied the effects of loading rates on the performance of reinforced concrete (RC) slabs. From test results, the damage process, failure mode, strain rate, and energy absorption capacity of RC slabs were similar between the high-loading-rate test and the low-velocity impact test. Therefore, it was suggested that the high load rate test results could be used to analyze the performance of the RC slabs under low-velocity impacts. Both longitudinal and transverse reinforcements were effective in enhancing the maximum strength of specimens. However, the damage to the slab under both high-rate and impact loadings can be more efficiently reduced by adding shear stirrups. In another experimental program [27], five 1200 mm square RC slabs were tested with different nose shapes, diameters of impacted area, drop weights and drop heights in another experimental program; the punching shear failure mode was observed for all the specimens that failed during the test. The damage to the slabs increased with the increase in impact energy, and more impact energy was required to fail RC slabs when the diameter of the impacted area increased.
In order to better understand the effects of supporting conditions on the behavior of RC slabs subjected to impact load, some research has been undertaken. Özgür et al. [28] found that the number of drops until failure was lower for the specimens with four hinge supports than those for the specimens with four fixed supports, but higher than those for the specimens with two opposite hinge supports. The authors also reported that the acceleration, velocity, and displacement decreased due to an increase in the support stiffness. Chiaia et al. [29] studied two-way reinforced concrete slabs over different kinds of yielding supports and concluded that reducing the support rigidity could decrease the displacement and stress of the whole structure. Husem et al. [30] found that the energy-absorbing capacity was decreased by an increase of span size in both fixed and free supported RC slabs, and that the maximum midspan displacement values increased only in free supported RC slabs; however the span size has no considerable effect in fixed supported RC slabs.
Furthermore, some studies were made to improve the impact behavior of RC slabs by blending in other materials, such as steel fibers, carbon fabric, polypropylene fiber, etc. An experimental program by Hrynyk et al. [31] revealed that the increased addition of the steel fibers was effective in increasing slab capacity, reducing crack widths and spacings, and mitigating local damage under impact. The research by Beckmann et al. [32] investigated blending steel fibers; carbon fabric showed substantial advantages in the resistance to the impact load and to the penetration of the impactor but had only a minor influence on concrete strain. AlRousan et al. [33] studied the impact resistance of RC slabs blending with polypropylene fiber; the result showed that the proper quantity of polypropylene fiber could significantly improve the impact resistance of RC slabs, and that a suitable content of polypropylene fiber was 0.90%. Ong et al. [34] studied the impact resistance of concrete slabs blending with four substances (polyolefin, polyvinyl, alcohol, and steel); the result showed that hooked-end steel fiber concrete slabs had the best cracking and energy absorption characteristics compared to other slabs.
However, there are a limited number of studies that comprehensively explore the impact dynamics and failure mechanisms of reinforced recycled aggregate concrete pavement. Wu [35] studied the damage and failure model of rigid concrete pavement under drop weight impact, and obtained the extent of damage, failure mode, deformation, and acceleration. The test results show that the concrete pavement without steel reinforcement was fragmented into three segments and showed brittle failure mode. Cai et al. [36] analyzed the dynamic deflection and velocity response of airport concrete pavement under impact loading and drew the conclusion that the velocity response amplitude decreased with the increase of slab thickness, and that the deflection at the center of the slab decreased with the decrease of pavement slab size.
Most of the studies conducted under impact loading were focused on natural aggregate concrete (NAC) structural elements. Recently, a few studies have been performed on the dynamic response of RAC structural elements under drop weight impact loading [37,38,39,40]. Vali et al. [38] studied the behavior of RAC slabs under impact loading with different replacement ratios of RCA and found that the stiffness of RAC slabs decreased with an increasing replacement ratio of RCA, which led to decreases in the punching shear strength at first crack stage and in the ultimate punching shear strength.
In order to design the airport pavement scientifically and to ensure its service life and safe operation, it is necessary to conduct experimental research on the performance of reinforced recycled aggregate concrete pavement under likely impacts. In fact, the excessive pavement damage due to the impact load of hard landings is extremely difficult to measure. Therefore, in order to better understand the behavior of reinforced recycled aggregate concrete pavement subjected to impact loading, an experimental program has been designed and conducted in this paper. The structural dynamic responses are measured during the drop-weight impact tests, and together with the cracking mechanisms, can provide a basis for investigating the impact behavior of reinforced recycled aggregate concrete pavement with different thickness and reinforcement ratios. In the meantime, the drop-weight impact test is also done on the reinforced normal concrete pavement, and the impact force characteristics, crack patterns, deformation responses, and strain developments are compared with those of reinforced recycled aggregate concrete pavement.
This paper presents the details of a well-organized and well-equipped experimental investigation with two main research objectives:
(1)
To investigate the effect of steel reinforcement distribution and slab thickness on the impact force characteristics and impact behaviors of RCP;
(2)
To evaluate the applicability of reinforced recycled aggregate concrete pavement under impact loads compared to the reinforced natural aggregate concrete pavement.

2. Experimental Methods

2.1. Materials

(1)
Cement and Water
The cement used throughout this study was Portland cement (P.O 42.5) conforming to standard GB175-2020 and obtained from Conch Cement Group. The detailed properties of the cement are shown in Table 1. Clean and fresh water was used for casting and curing of the samples and RCP specimens.
(2)
Fine Aggregate
The fine aggregate used in the mixes was locally-sourced river sand with a maximum particle size of 4.75 mm and a fineness modulus of 2.60, which met the requirements for a Class II gradation medium sand.
(3)
Coarse Aggregate
The coarse aggregate involved two types of natural coarse aggregate (NCA) and recycled coarse aggregate (RCA). The NCA was crushed calcareous limestone from the stone quarries which had continuous gradation with a particle size of 5~20 mm. The RAC was supplied by the local plant from the demolition of twenty- to thirty-year-old concrete pavements, the original strength grade of which was unknown. Prior to the experiment, the aggregates larger than 20 mm were screened, and impurities such as bricks and wood were removed.
Tests were conducted on the NCA and RCA according to the Code of GB/T 25177-2010 and GB/T 14685-2011; the physical properties of the coarse aggregates are shown in Table 2, and Figure 1 shows the sieve analysis of the coarse aggregates. Both NCA and RCA met the specification that ensured the appropriate properties of the fresh and hardened concrete.
(4)
Steel reinforcement
The diameter of the longitudinal reinforcing bars in the RCP specimens was 8 mm, and the relevant properties were tested by using a tensile test machine. The bar response showed an obvious yield plateau, and the measured yield strength (fyk), ultimate strength (fuk) and elongation after fracture were 426 Mpa, 600 Mpa, and 18.2%, respectively.

2.2. Concrete Mix Design

Two types of concrete were designed in this experiment: Natural Aggregate Concrete (NAC) with natural fine and coarse aggregate, and Recycled Aggregate Concrete (RAC) using natural fine aggregate and RCA of 100% mass replacement. The mix proportion of NAC and RAC were designed to have a similar compressive strength of 45 Mpa, and the concrete mixture proportions for the NAC and RAC are listed in Table 3.
Three cube samples of 100 mm and 150 mm size were cast for compressive strength and tensile splitting strength tests, respectively, and three prism samples with 450mm× 150 mm × 150mm length were made for the purpose of testing the flexural strength. The mechanical properties of NAC and RAC were measured at 28 days under the standard curing condition according to GB/T 50081-2002, as shown in Table 4 based on average values for three tested samples.

2.3. Description of RCP Specimens

Five types of 1000 mm square RCP slab specimens with different longitudinal reinforcement spacing (100 and 150 mm), thickness (60, 70, and 80 mm), and RAC replacement ratio (0 and 100%) were designed for the experimental program. The RCP specimens were named by thickness (cm), type of concrete, the location of the impacting load, and additional information (1 meant the longitudinal reinforcement spacing was 100). For example, two types of concrete were used in the experimental program: NAC was named N, and RAC was named R. M represents that the RCP specimen was subjected to impact load at its mid-point. The details of all RCP specimens are summarized in Table 5, and their reinforcement layouts are shown in Figure 2.
All RCP specimens adopted the single-layer reinforcement scheme with equal amounts of reinforcement in both planar directions, resulting in two layers of bars. The diameter of reinforcement bars was 8 mm, and the rebar spacing within the RCP specimens ranged from 100 mm to 150 mm. For slab thicknesses of 60 mm, 70 mm, and 80 mm, the thicknesses of concrete protective cover from the bottom surface were 25 mm, 30 mm, and 35 mm to ensure that the steel bars were located in the middle of the slab. According to MT/T 5004-2010, the single-layer steel bars should be located in the lower 1/3~1/2 thickness of the slab [2]. The transverse and longitudinal steel pieces were bundled by steel wires to create a continuous mesh, and those steel meshes were fixed on the cement cushion block during vibration to achieve an accurate positioning in the slab. Short bars of 20 mm length and 8mm diameter were welded at both ends of all reinforcement bars to enhance anchoring capacity and ensure sufficient reinforcement (Figure 3).
To ensure consistency and good quality of each RCP specimen, the concrete was mixed and cured in-house using a 60 L single horizontal-axis forced mixer in the Concrete Materials Laboratory. In addition to the RCP specimens, three 100 mm× 100mm × 100 mm cube samples were cast from the same batch to characterize the compressive strength of the concrete material. The cube samples and RCP specimens were cured in natural environment conservation, and watered in the first 7 days to ensure the strength of concrete and prevent cracks. The average compressive strength of cube specimens was measured synchronously after the impact experiment, which is listed in Table 5.

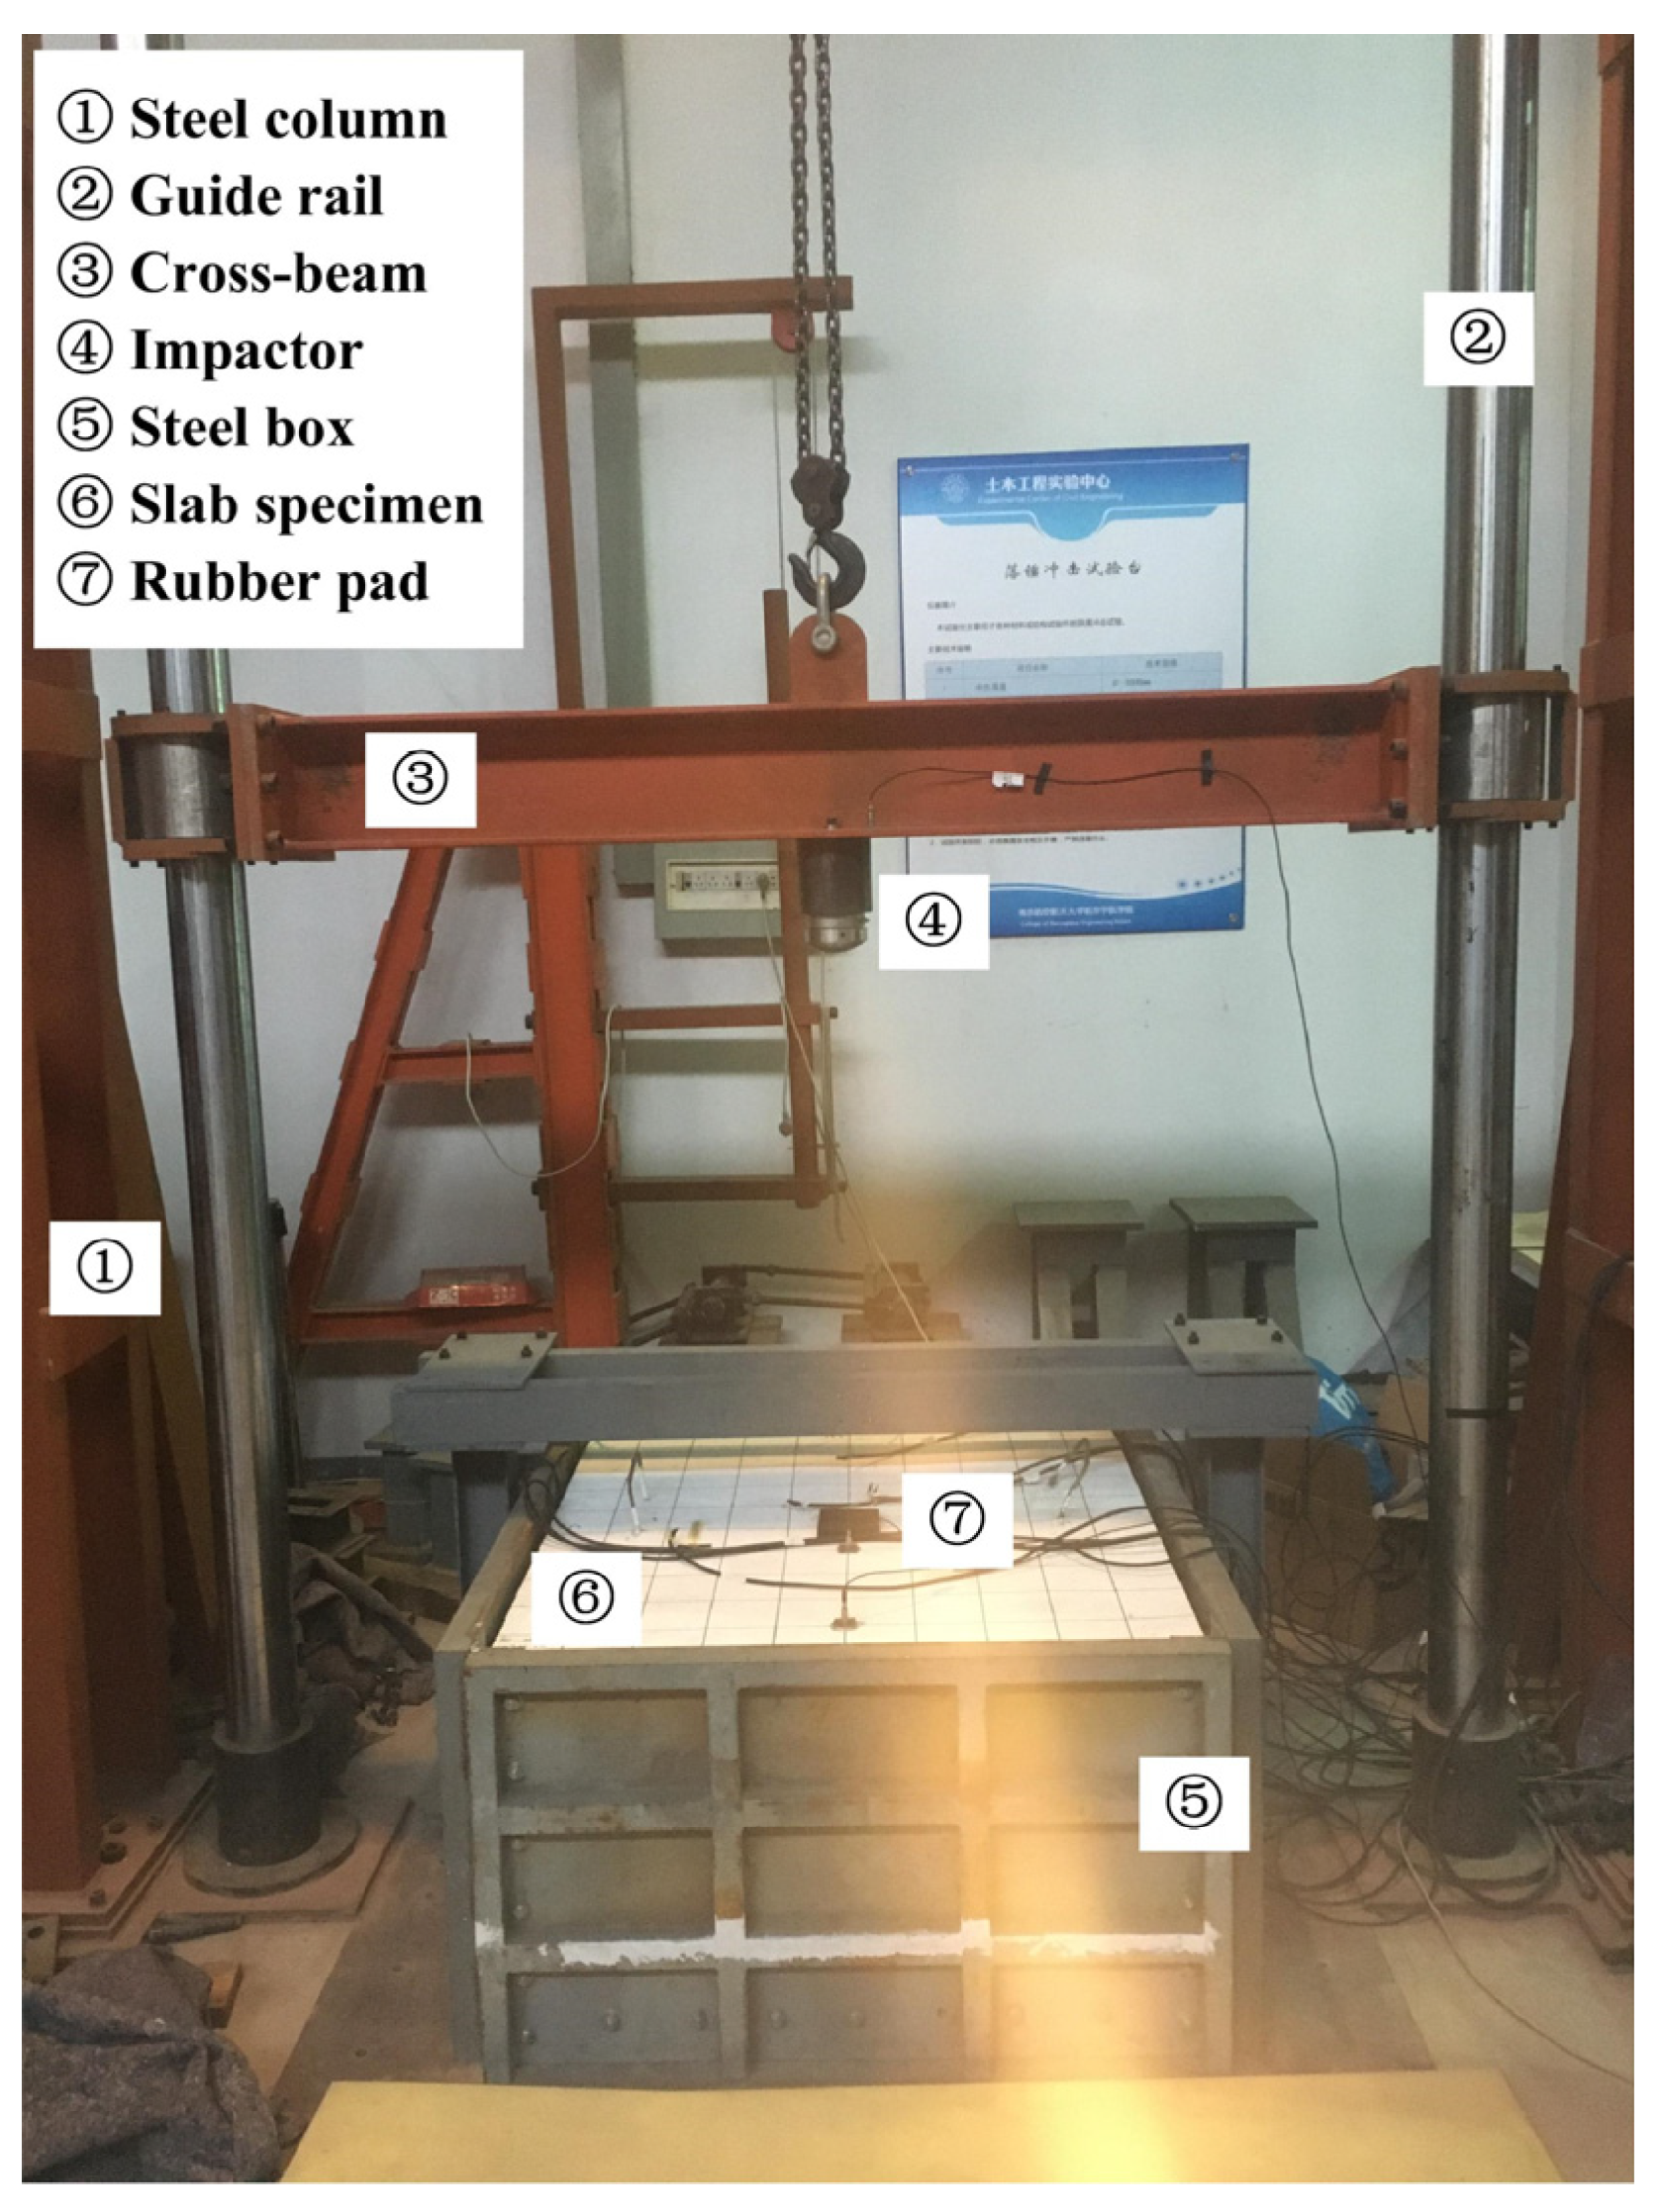
2.4. Instrumentation

To fully document the dynamic response of the RCP specimens, various kinds of sensors were installed to monitor specimen displacements, accelerations, concrete strains, and reinforcing bar strains during the test.
Two laser-type displacement sensors were installed to capture the vertical displacement distribution of the RCP specimens; this kind of sensor is generally capable of capturing higher response frequencies than is the linear variable differential transformer, making it more suitable for impact testing applications. Two accelerometers were mounted on the top surface to capture the acceleration distribution of the RCP specimens, and one accelerometer was attached to the drop-weight to estimate the impact force. These accelerometers had the capacity of measuring accelerations within the range of ±5000 g and were used to measure accelerations along the vertical axis of motion. Moreover, three strain gauges with 5 mm gauge lengths were glued to the bottom surface of reinforcement bar prior to concrete pouring, and a total of five strain gauges with 50 mm gauge lengths were arranged on the top and bottom surfaces of the RCP specimens. The range of the magnitude and rate of strain were detected by eight strain gauges applied to the concrete and the reinforcement bar. The arrangement and designation of these sensors are given in Figure 4.

2.5. Test Program

The RCP specimens were placed on the top of a compacted sand-and-gravel layer in a steel strongbox. The net internal size of the steel box was 1020 mm × 1020 mm × 650 mm, which was slightly larger than the size of the RCP specimens; all four edges of the RCP specimens were free edges without constraints. The sand-and-gravel layer was composed of sand and gravel in a mixing ratio of 1:2, and with no clods, roots, or other sundries inside. The maximum size of gravel aggregate was limited to 26 mm, and particle size distributions of the sand-and-gravel layer conformed to the requirements of continuous gradation [41]. The sand-and-gravel layer was compacted to a degree of 0.97, in order to enhance its strength and provide a high-quality subbase.
The drop-weight test frame consisted of two columns, the drop-weight, and two vertical guide rails; the rails were used to guide the drop-weight during the fall. The drop-weight in the experimental program was comprised of a cross-beam with a span of approximately 2.5 m and an impactor with a striking surface of a 20 cm diameter hemispherical nose. The total mass of the drop-weight was 200 kg, and the drop-height of the drop-weight was set at 1.0 m above the top surface. A rubber pad with dimensions of 100 mm × 100 mm × 10 mm was placed on the RCP specimen exactly in the contact zone, which simulated the impact cushioning effect of the landing gear. Prior to performing a test, the drop-weight was lifted up along the guide rail to the desired height and secured to an electric clamping style release mechanism. After debugging all related devices and instrumentation, the drop-weight was released in a free-fall condition to generate the impact loads, and all digital data were recorded synchronously. The schematic diagram of the setup and the test configuration is illustrated in Figure 5.

3. Experimental Results and Discussion

3.1. Impact Force Characteristics

According to the test program described above, the acceleration-time history of the drop-weight was obtained from the measurement data of the A3 accelerometer, as shown in Figure 6. The acceleration-time history was used to calculate the impact force-time history. The formula is F(t) = ma(t), where m is the mass of the drop-weight that remained at 200 kg consistently in all tests. The impact force-time histories of different tests were similar in shape, showing a high magnitude peak followed by few small magnitude shocks, which were caused by the rebounding of the drop-weight after impacting the RCP specimens. Compared with other subsequent peaks, the magnitude of first impact was very high, and therefore, the impact response under first impact is the most central issue for this research [22,23].
To assess the inertial force during the impact test, a simple integration approach is proposed; that is, to use the recorded A1 and A2 acceleration data to estimate the inertial force of the RCP specimen [26]. The acceleration-time histories of the A1 and A2 accelerometer are shown in Figure 6. The accelerometer A2 was placed further away from the impact area than was the accelerometer A1, and it was thought that the phase diversity of the acceleration between A1 and A2 reflected the lag in response, owing to the force propagating from the point of impact to the edge [42]. The RCP specimen gained significant downward acceleration immediately after impact and upward inertial force was induced. The RCP specimen was divided into three tributary integration areas according to the positions of accelerometers, as shown in Figure 7. For Area 1, the acceleration was assumed to be uniformly distributed and its value was equal to the value of the A1 sensor. The acceleration was assumed to have a linear distribution for both Area 2 and Area 3. For Area 2, the values of the inner and outer boundaries of acceleration were the values of the A1 and A2 sensors, respectively. For Area 3, since the size of the RCP specimen was much larger than that of the impact area, it could be considered that the acceleration at the far edge of the specimen was sufficiently weak to be ignored. Accordingly, the values of the inner and outer boundaries of the acceleration were the value of the A1 sensor and zero, respectively. The inertial force of the RCP specimen could be calculated by summing up the inertial forces of the three tributary areas.
For all the specimens, impact force and inertial force rose immediately and reached their peak values shortly after the impact began. The impact force suddenly dropped due to the deformation and cracking of the RCP specimen. As the impact force decreased, the inertia force decreased and dissipated. The peak impact force was detected after circa 7–8.5 ms following the first contact between the drop-weight and the RCP specimen, and the result is summarized in Table 6. There was a time lag of circa 1–3 ms between the peak impact force and the peak inertia force, which was due to the stress wave propagation travelling gradually from the impact area to the far edge [25,31,43]. This stress wave traveled at varying speeds within the speed of sound, depending on the mass, the density and the elastic modulus of the concrete type used [44]. Comparing the impact force with the inertia force, it is obvious that the peak amplitude of impact force is greater than that of the inertia force. The reason is that most of the impact force was converted into inertia force, while a portion of impact force was balanced by ground reaction force during impact.
All RCP specimens were impacted by a free fall of 200 kg drop-weight from a constant height of 1.0 m, so in the case of ignoring friction and air resistance, when the drop-weight impacted the RCP specimen, the instantaneous impact velocity vim was about 4.4 m/s and the maximum impact energy Eim was 1.96 kJ. The reported impulse Ip is the time integration of impact force. The impulse–momentum theorem states that the impulse is equal to the change of momentum [23,24,25]. Thus, it is expected that the rebound velocity vr of the drop-weight can be calculated by the formula Ip= m × vim-m× vr. Once the rebound velocity vr is known, the residue kinetic energy of the drop-weight can be calculated. In calculating the energies for the impact test, the current study neglected the energy dissipated in the following mechanisms: the free vibration of the RCP specimen and steel strongbox, and the energy losses due to heat and noise [37,45]. Thus, the energy absorbed by the RCP specimen can be calculated via subtracting the residue kinetic energy of drop-weight from the impact energy [27]. The calculated rebound velocities vr, absorbed energies Eab, and its ratio over impact energies of different tests are listed in Table 6.
It can be seen from Table 6 that the characteristic value of impact force varies in accordance with the longitudinal reinforcement spacing, the concrete type, and the thickness. Comparing 7MR with 7MN, the peak impact force of 7MR is 13.8% smaller than that of 7MN. According to the contact theory proposed by Hertz [46], the force between two objects in contact is proportional to the relative elastic modulus. The 7MR specimen showed a lower impact force, which can be attributed to a lower modulus of elasticity of the RCA mix compared with the NAC mix. The peak inertial force of 7MN is very similar to that of 7MR, and the difference between the two is less than 5%. This is likely due to the fact that the steel reinforcement contributed more to the stiffness of the RCP specimen in this state, thus reducing the relative influence of concrete on the overall stiffness.
A tendency is observed that the peak impact force increased with the increase in reinforcement ratio. As can be seen from Figure 8, the peak impact force of 7M1R is 25.3% higher than that of 7MR, which is the maximum value among all RCP specimens. Therefore, increasing the reinforcement ratio could improve the stiffness of the RCP specimen and have a significant effect on the impact force [22,23]. In addition, it was observed that the peak inertial force slightly increased as the reinforcement ratio increased.
Compared with 7MR, the peak impact force of 6MR increased by 17.1%, while the peak impact force of 8MR decreased by 14.2%. According to the research results of Xiao [26], the thickness could increase the impact resistance and stiffness of the RCP specimens; therefore, an increase in the peak impact load should be also observed. The reason for this is that, although 6MR, 7MR and 8MR specimens had the same reinforcement layout scheme of D8@150, the reinforcement ratio decreased with the increase in thickness. When considering the peak impact load, the influence of the thicknesses was relatively lower compared with the effect of the reinforcement ratio, which has paramount relevance. In addition, it was observed that the impact force duration slightly decreased as the reinforcement ratio increased in the 8MR, 7MR, 6MR and 7M1R specimens. As can be seen from Figure 8, the peak inertia force variation rules of the RCP specimen were different. The peak inertia force of the 8MR specimen with the largest thickness was maximum, while the peak inertia force of the 6MR specimen with the lowest thickness was minimum.
Except for 7M1R, the energy dissipation ratio Eab/Eim of all RCP specimens exceeds 90%, implying that the RCP specimens dissipate most impact energies through deformation and cracking. The energy dissipation ratio Eab/Eim of 7MR specimen was similar to that of 7MN specimen. For 7M1R specimen, as shown in Figure 9, there was slight damage on the surface after impact, and approximately 87.4% of the impact energy was imparted to the specimen. For the less damaged specimen, more impact energy could be stored through the temporary elastic deformation of the specimen [27]. This stored energy would return to the drop-weight when the elastic deformation recovered, resulting in greater rebound speed vr. On the contrary, severely damaged specimens had already entered their plastic stage and more impact energy was dissipated in the form of permanent deformation or crack damage. The 6MR specimen was severely damaged and the energy consumption ratio Eab/Eim reached 91.5%. As seen in Figure 9, the damage characteristics and crack patterns after the impact also confirmed this phenomenon.

3.2. Damage Characteristics and Crack Patterns

Prior to the test, the surfaces of the PCP specimen were painted white and then meshed with spacing of 100 mm grids in order to observe damage characteristics and crack patterns. The “E/S/W/N” symbols were marked at top, bottom and side surfaces of the RCP specimen, and the RCP specimen was divided into four regions according to direction. The cracks that developed after each test were marked, and the crack widths were measured manually by HC-CK101 Concrete Crack Width Meter. For impacting at the mid-point, the sketched cracks profiles of the RCP specimen are shown in Figure 9.
The type of damage and crack development mode on the bottom surface of all RCP specimens are similar. The crack patterns mainly appeared as the radial crack and diagonal crack, indicating that the deformation of the specimen was a global flexural deformation. The major radial crossing cracks and the failure took place simultaneously. The concrete scabbing was quite limited and mainly centralized in the region of 200 mm × 200 mm beneath the impacting point. The maximum residual width of the crack was also found in this region, which reached up to 1.46 mm~1.8 mm. For all RCP specimens, the widths of radial cracks were larger than those of diagonal cracks. This is because the radial crack developed prior to the diagonal crack, and the radial crack could dissipate more impact energy, thus reducing the crack width [27]. There were two different crack patterns on the top surface of the RCP specimen: one was the radial crack propagating from the bottom surface towards the top surface, and the other was the circumferential crack with the impact point as the center. No obvious penetration was observed on the surface of the RCP specimen that was found in Refences [47,48]. The final crack properties of all tested specimens are presented in Table 7.
The final damage status of the 7MR specimen is similar to that of the 7MN specimen. In the E-W direction, radial cracks were fully developed, and their widths were in the range of 1.2–1.4 mm for both 7MR and 7MN. While, in the N-S direction, the cracks generated in 7MR are slightly more than those in 7MN, this could be attributed to the character of RCA, whose adhesive mortar and cracks caused by procession have an adverse effect on the behavior of the concrete matrix. Furthermore, due to the high brittleness of RAC, the radial crack propagation was normally unstable [49]. As shown in Figure 10, the radial cracks extending from the bottom to the top run along the W-E direction toward the impact point, simultaneously with the crack widths being gradually reduced. The radial crack widths of 7MR on the top surface were larger than those of 7MN. Furthermore, the radial crack of 7MR extended to the impact point, while the radial crack of 7MN extended only a quarter of the slab span. With the same thickness, reinforcement ratio and concrete grade, RAC has little influence on damage characteristics and crack patterns of RCP specimens; however, the crack resistance of 7MR is slightly lower than that of 7MN.
The number of cracks on the bottom surface decreased with the increase in the thickness of the slab. With the reduction of the thickness from 70 mm to 60 mm, multiple tightly spaced hairline cracks formed on the bottom surface, while as the thickness increased from 70 mm to 80 mm, the development of cracks was strongly limited. The crack width widened as the number of cracks decreased. These results suggest that there is an association between crack resistance and slab thickness. The crack patterns on the top surface varied with the change of the thickness of the slab. The radial cracks extending from the bottom to the top were found in the 6MR, 7MR, and 8MR specimens, and the circumferential cracks around the impact area were detected only in the 8MR specimen. These circumferential cracks with a hairline width less than 0.06 mm did not close and developed in the range of a half-circle. The circumferential cracks indicated that localized damage in the form of limited concrete penetration on the impact surface had occurred in the 8MR specimen. The change in crack patterns was due to the stiffness of the specimen increasing as a result of the increase in the slab’s thickness, and partial impact energy needing to be dissipated through local damage deformation during the impact [48,50]. Except for the cracks mentioned above, the remaining area on top surface of 8MR specimen was nearly undamaged.
Both circumferential cracks similar to those in 8MR and radial cracks similar to those in 7MR were found on the top surface of 7M1R specimen. In comparison with 8MR, the circumferential cracks of 7M1R had further distributed distance, thinner width, and smaller range. The development of the radial cracks on the top surface of 7M1R was limited when compared to that of 7MR. Based on the observed damage and crack development in tested specimens, it was found that the crack pattern was more affected by the thickness than by the reinforcement ratio. More steel reinforcement would induce a localized failure of concrete [23].

3.3. Displacement Response

The displacement-time histories of D1 and D2 are shown in Figure 11, and it is found that the displacement-time history shapes of all RCP specimens are similar in terms of magnitude, time response, and residual displacement. With each impact event performed, the RCP specimen exhibited progressively increasing peak displacements, and then decreased to a stable residual displacement, followed by few small displacements due to rebounding of the drop-weight after impacting the RCP specimen. It should be recalled that the magnitude of first impact was very high compared with other subsequent peaks; therefore, the peak displacement and residual displacement due to the first impact were recorded in Table 8. The final cumulated residual displacement would affect the performance of the RCP specimen; it was also recorded in Table 8. It can be seen that the displacement at D1 point was larger than that at D2 point for all RCP specimens from Figure 11. This is because when the drop-weight impacted the top surface, due to the limited impact area, sufficient impulse should be provided in this area to prevent the drop-weight from falling until it stopped. Therefore, compared with other areas, the stress around the impact area was greater, the damage was more serious, and the deformation was more obvious.
As can be seen from Table 8, the peak and residual displacements at D1 point of 7MN specimen were lower than that of 7MR specimen, reduced by 11.0% and 5.3%, respectively. According to the literature [51,52], the elasticity modulus of concrete decreased with the increase in RCA replacement ratio. In addition, the micro cracks in adhesive mortar of RCA had a detrimental effect on crack development, which would reduce the stiffness of the specimen. With increased distance from the impact area, both the peak displacement and the residual displacement showed an opposite trend to that of before. The peak and residual displacements at D2 point of 7MN specimen were higher than that of 7MR specimen, increased by 8.2% and 12.9%, respectively. This meant that the difference between D1 and D2 was decreasing, indicating that the deformation on the front surface of 7MN specimen became gentle, and showed more flexural response.
The reinforcement ratio plays an important role in peak deflection and residual displacement [47]. As the reinforcement ratio was increased from 0.48% to 0.72%, the peak and residual displacements at D1 point decreased by 7.0% and 12.2%, respectively. The reason for such behavior may be attributed to the fact that more steel bars could effectively arrest the propagation of cracks inside the concrete, thus improving the stiffness of RCP specimens. Compared with the 7MR specimen, the 7M1R specimen exhibited smaller displacement amplitudes under same impacts and was expected to be able to undergo larger displacement amplitudes before failure. The variation trend of the displacement at D2 point of 7M1R specimen was similar to that of 7MN specimen, and the peak value and residual displacement at D2 point of 7M1R specimen are 18.3% and 12.1% higher than that of 7MR specimen, respectively.
At D1 point, compared with the peak and residual displacements of the 7MR specimen, those of the 6MR specimen had undergone approximately 3.2% and 1.11% decrease, respectively, while those of the 8MR specimen had undergone approximately 4.3% and 12.3% increase, respectively. The peak and residual displacements of 6MR specimen and 7MR specimen at D2 point were not significantly different. In this case, it is thought that before the overall deformation occurred, the impact energy of 6MR specimen would have been dissipated through the development of the dense radial cracks on the bottom surface. The 8MR specimen always maintained a large displacement value at D1 and D2, indicating that when the drop-weight impacted against the 8MR specimen, almost all the impact energy was dissipated through global deformations. As described in Section 3.2, the 8MR specimen had the fewest number of radial cracks on the bottom surface among all RCP specimens. At the same time, as the velocity of drop-weight progressively slowed down with the increase of displacement, the circumferential cracks were formed on the top surface near the impact area.
As can be seen from Figure 11, under first impact, the RCP specimen reached the peak downward displacement and then rebounded upward. The amplitude of D1 and D2 rebound displacement changed differently between specimens. For 7MR, 6MR, and 7MN, the peak upward displacement at D2 point were −2.53 mm, −1.79 mm, and −1.49 mm respectively (downward is positive), while the peak upward displacement at D1 point remained positive. The specimen showed a trend of reverse bending deformation, and the stress wave bounced back from the base to the surface to form tensile stress, which could further explain the radial cracks which appeared on the top surface of these specimens. For 8MR and 7M1R specimens, the upward displacements of D2 point were relatively small, and the radial crack development was limited due to the higher stiffness.
The 8MR specimen with the minimum reinforcement ratio had the maximum final cumulative residual displacement, while the 7M1R specimen with the maximum reinforcement ratio had the minimum final cumulative residual displacement. The final cumulative residual displacement of the RCP specimen was found to correlate with the reinforcement ratio more than with other factors.
Research addressing the displacement shapes of the RCP specimens could provide more information regarding the impact response, which was difficult to directly observe in the displacement analysis at D1 and D2 points. Therefore, the displacement shapes of the RCP specimens were addressed in this paper, which provides a quantitative index for comparing the global impact responses of the RCP specimens. Accelerometers A1 and A2 were arranged along the same axis as displacement sensors D1 and D2, which were 50 mm away from the left and right sides of D1 and D2, respectively, as shown in Figure 4. As described in Section 3.1, the acceleration-time history a(t) at A1 point and A2 point of the RCP specimens were recorded by A1 and A2 accelerometers, respectively. The corresponding velocity v(t) and displacement d(t) responses can be calculated by numerical integration of the acceleration time histories using the Newmark Beta method [22,53]:
v i + 1 ( t + Δ t ) = v i ( t ) + [ ( 1 α ) a i ( t ) + α a i + 1 ( t + Δ t ) ] Δ t
d i + 1 ( t + Δ t ) = d i ( t ) + v i ( t ) Δ t + [ ( 1 / 2 β ) a i ( t ) + β a i + 1 ( t + Δ t ) ] Δ t 2
The acceleration was assumed to vary linearly between two instants of time in this study; α and β were chosen as 1/2 and 1/6, respectively [22]. Before impact, the initial velocity and initial displacement of the surface were considered to be zero. By assuming symmetric displacement response of the RCP specimen, the deflected shape along the midline of the top surface was plotted by linking the measured displacement data at D1 and D2 points and the calculated displacement data at A1 and A2 points. Uniform displacement with the value calculated by A1 was assumed in the impact area. The deflected shape of all the specimens is plotted at an interval of 2.0 ms and shown in Figure 12.
The value of deformation of the 7MR specimen was small in the initial 4 ms, and then increased rapidly. A global deformation on the top surface could be observed during the impact process, showing elastic flexural behavior. The deflection of the impacted area increased more rapidly than did the deflection of unloaded area, as shown in Figure 12. After reaching its peak displacement at about 14 ms, the impacted area began to rebound, while the unloaded area continued its downward movement for another few millimeters, and then rebounded at 18.5 ms. In the end, the displacement shape of the 7MR specimen flattened out again. In this case, the previously discussion of development of radial cracks observed on the bottom surface are believed to be attributable to the flexural displacements developed in the 7MR specimen. The similar behaviors were also observed in the displacement shapes of other specimens.
The punching shear behavior was observed in the 8MR specimen, indicating that the deflection of the impacted area increased much more rapidly than did the deflection of the unloaded area during 10ms to 16ms. Under the impact events, a slight development of localized displacements was observed to occur on one side of the impact region; however, no significant punching region was observed, and few instances of mass penetration had occurred. By comparing all displacement shapes shown in Figure 12, it can be seen that the displacement shapes of all RCP specimens were uniformly distributed, indicating that the failure of the specimen was mainly caused by the flexural deformation.

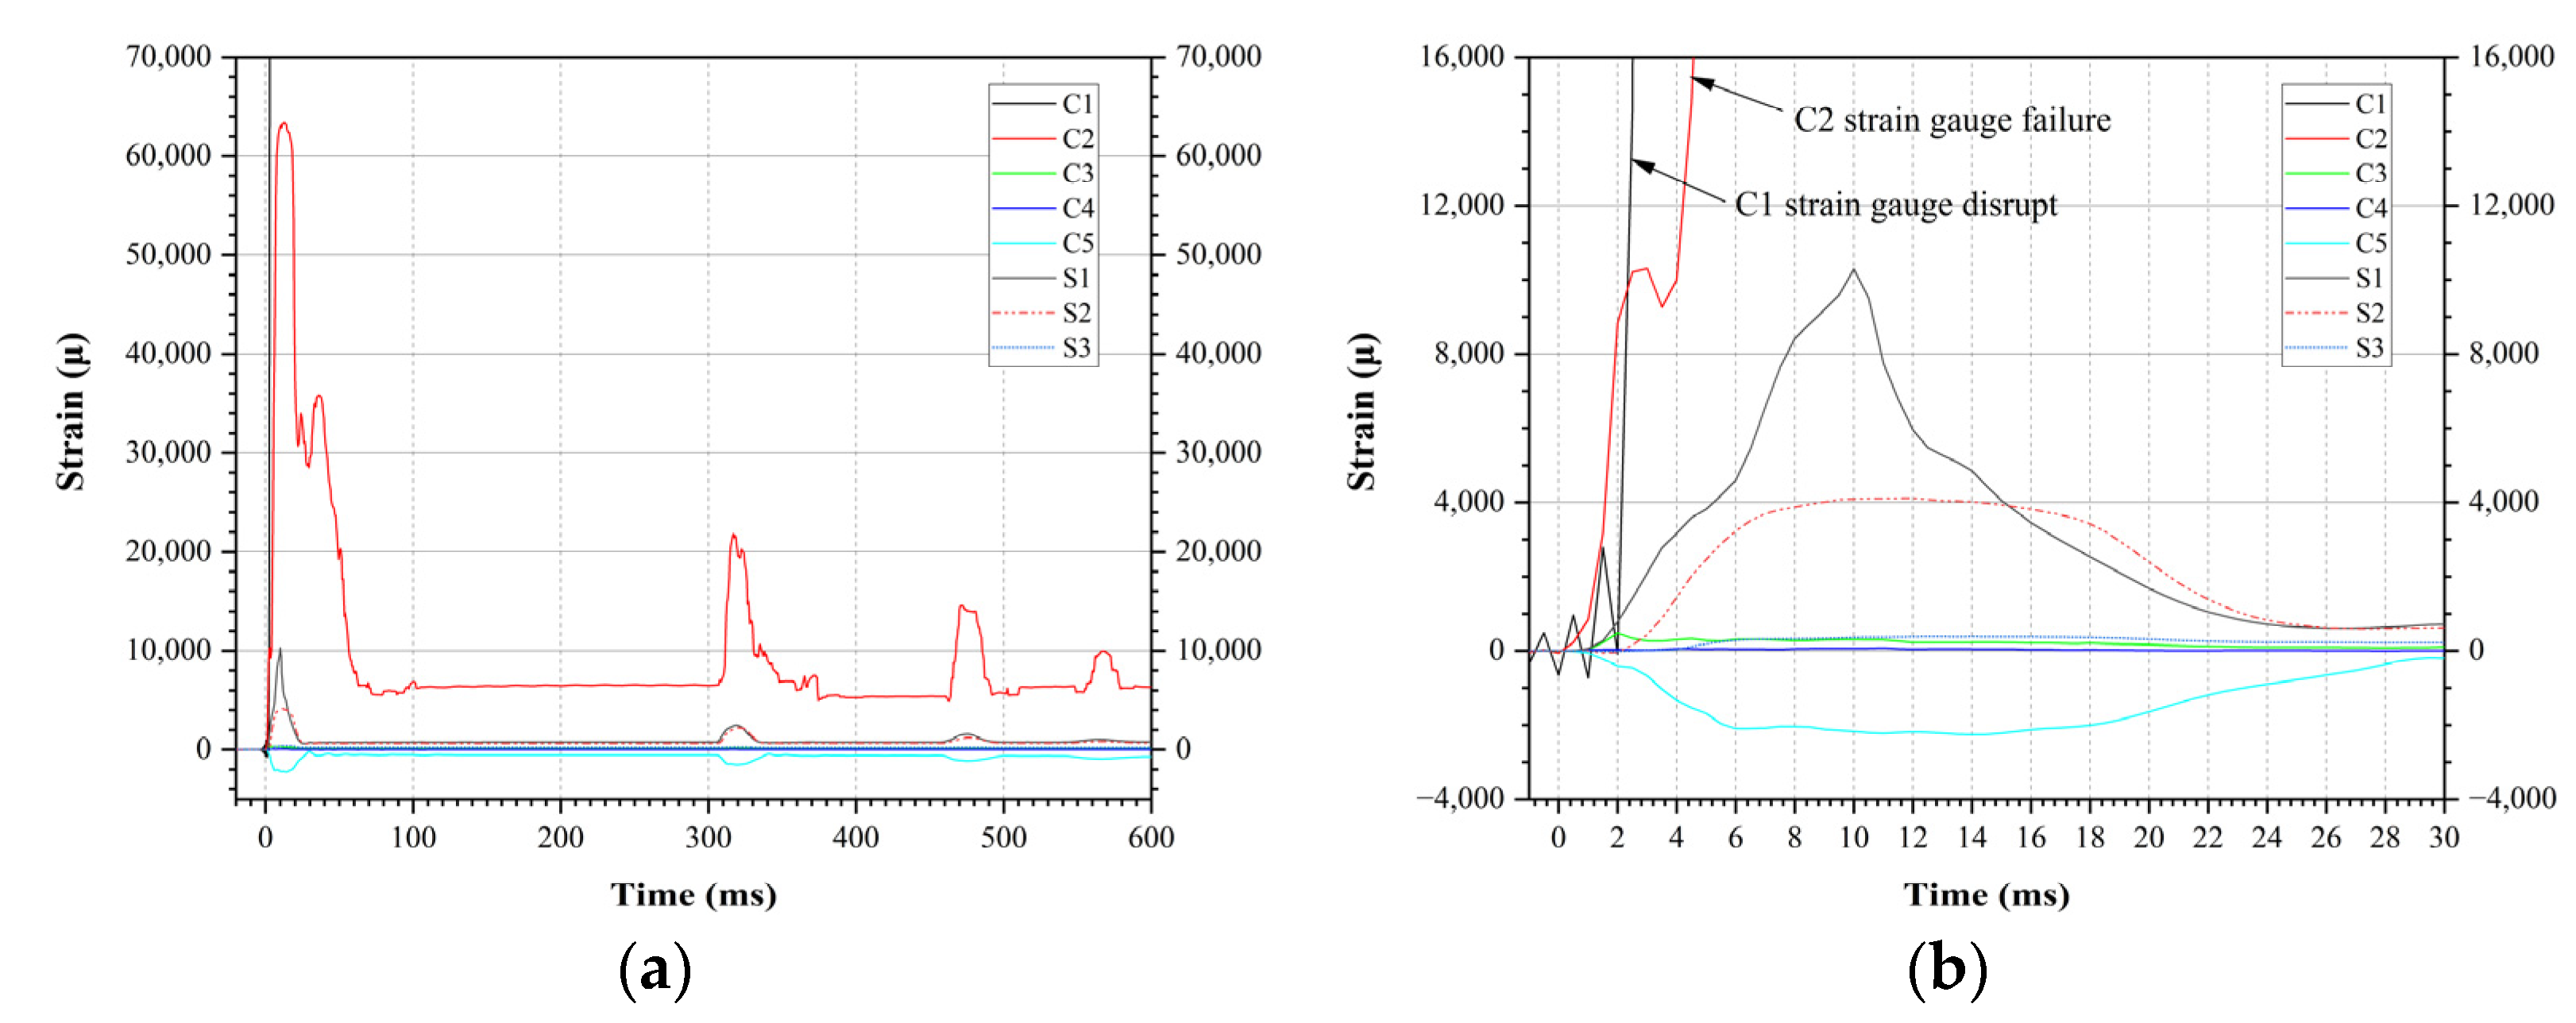
3.4. Strain Due to Impact Load

The material strain was detected by five strain gauges applied to the concrete and by three strain gauges applied directly to the reinforcement steel. Figure 13a shows the strain evolution of the 7MR specimen, used as the reference specimen in comparison with all other specimens. Figure 13b shows a zoomed detail of the graphs under first impact. After the impact, a compressive strain of the concrete on the top can be seen, while a tensile strain of the concrete on the bottom can be observed. The C1 strain gauge was placed in central impact region and was disrupted about 2.0 ms after the first contact of the drop-weight. The failure of the C2 strain gauge could be determined from the horizontal plateau of strain-time history in Figure 13a. The C4 strain on the bottom was very small, indicating that, for the specimen with four free edges, the strain in the corner area of the RCP specimen could be ignored during the impact process, something which could be confirmed by the sketched cracks profiles in Figure 9. The compression strain of C5 on the top lasted for about 30 ms. At 14 ms, the maximum compressive strain of C5 reached about −2248 μ. Corresponding to the compression strain of the concrete mentioned above, the peak value of the tensile strain of S1 was measured 10292 μ. Regarding the strain of the reinforcement steel, the tensile strain decreased with the increase in distance from the impact area.
In this paper the steel strain of different RCP specimens was compared by means of the strain of the S1, as shown in Figure 14. For 6MR, 7MR and 8MR specimens, the strain values of the S1 strain showed a similar behavior, a rapidly increasing tensile strain followed by a very sharp drop. It can be observed that, with the increase in thickness, the peak S1 strain decreased, and the duration of the tensile strain shortened. For 7MN, the strain-time history showed a slower and smoother strain evolution than did the other specimens. In terms of peak strain values, the difference between the 7MR and the 7MN was 41.5%, while the difference between the 8MR and the 7MN was fairly small. It can be seen from Figure 14 that the steel strain of the 7M1R specimen was a compressive strain in the first 2.5 ms after the impact. This effect is indicative of the local material behaviors due to the impact, which is also described in Refences [32]. After a short duration of 4.0 ms, the S1 strain changes from compressive strain into tensile strain, indicating the transition from local deformation to global flexural behaviors. The more longitudinal reinforcement, the greater the decrease of tensile strain and the smoother the curve shape.

4. Conclusions

The experimental investigation of five RCP specimens under impact load is presented in this paper. The acceleration, the displacement, and the strain time histories were recorded under constant impact energy in order to determine dynamic response of RCP under impact loading. The following conclusions can be drawn from the experimental study that was conducted:
(1)
The peak impact force increased with the increase in reinforcement ratio. The impact force reached its peak value immediately after the impact, but the displacement, concrete strain and steel strain reached their peak value a few microseconds later. Therefore, the peak impact force cannot be directly considered the true impact resistance capacity.
(2)
The increase in slab thickness resulted in an increase in the peak inertia force, but it decreased the peak impact force. Moreover, the energy consumption ratio reached 91.5% in 6MR specimen, which been severely damaged.
(3)
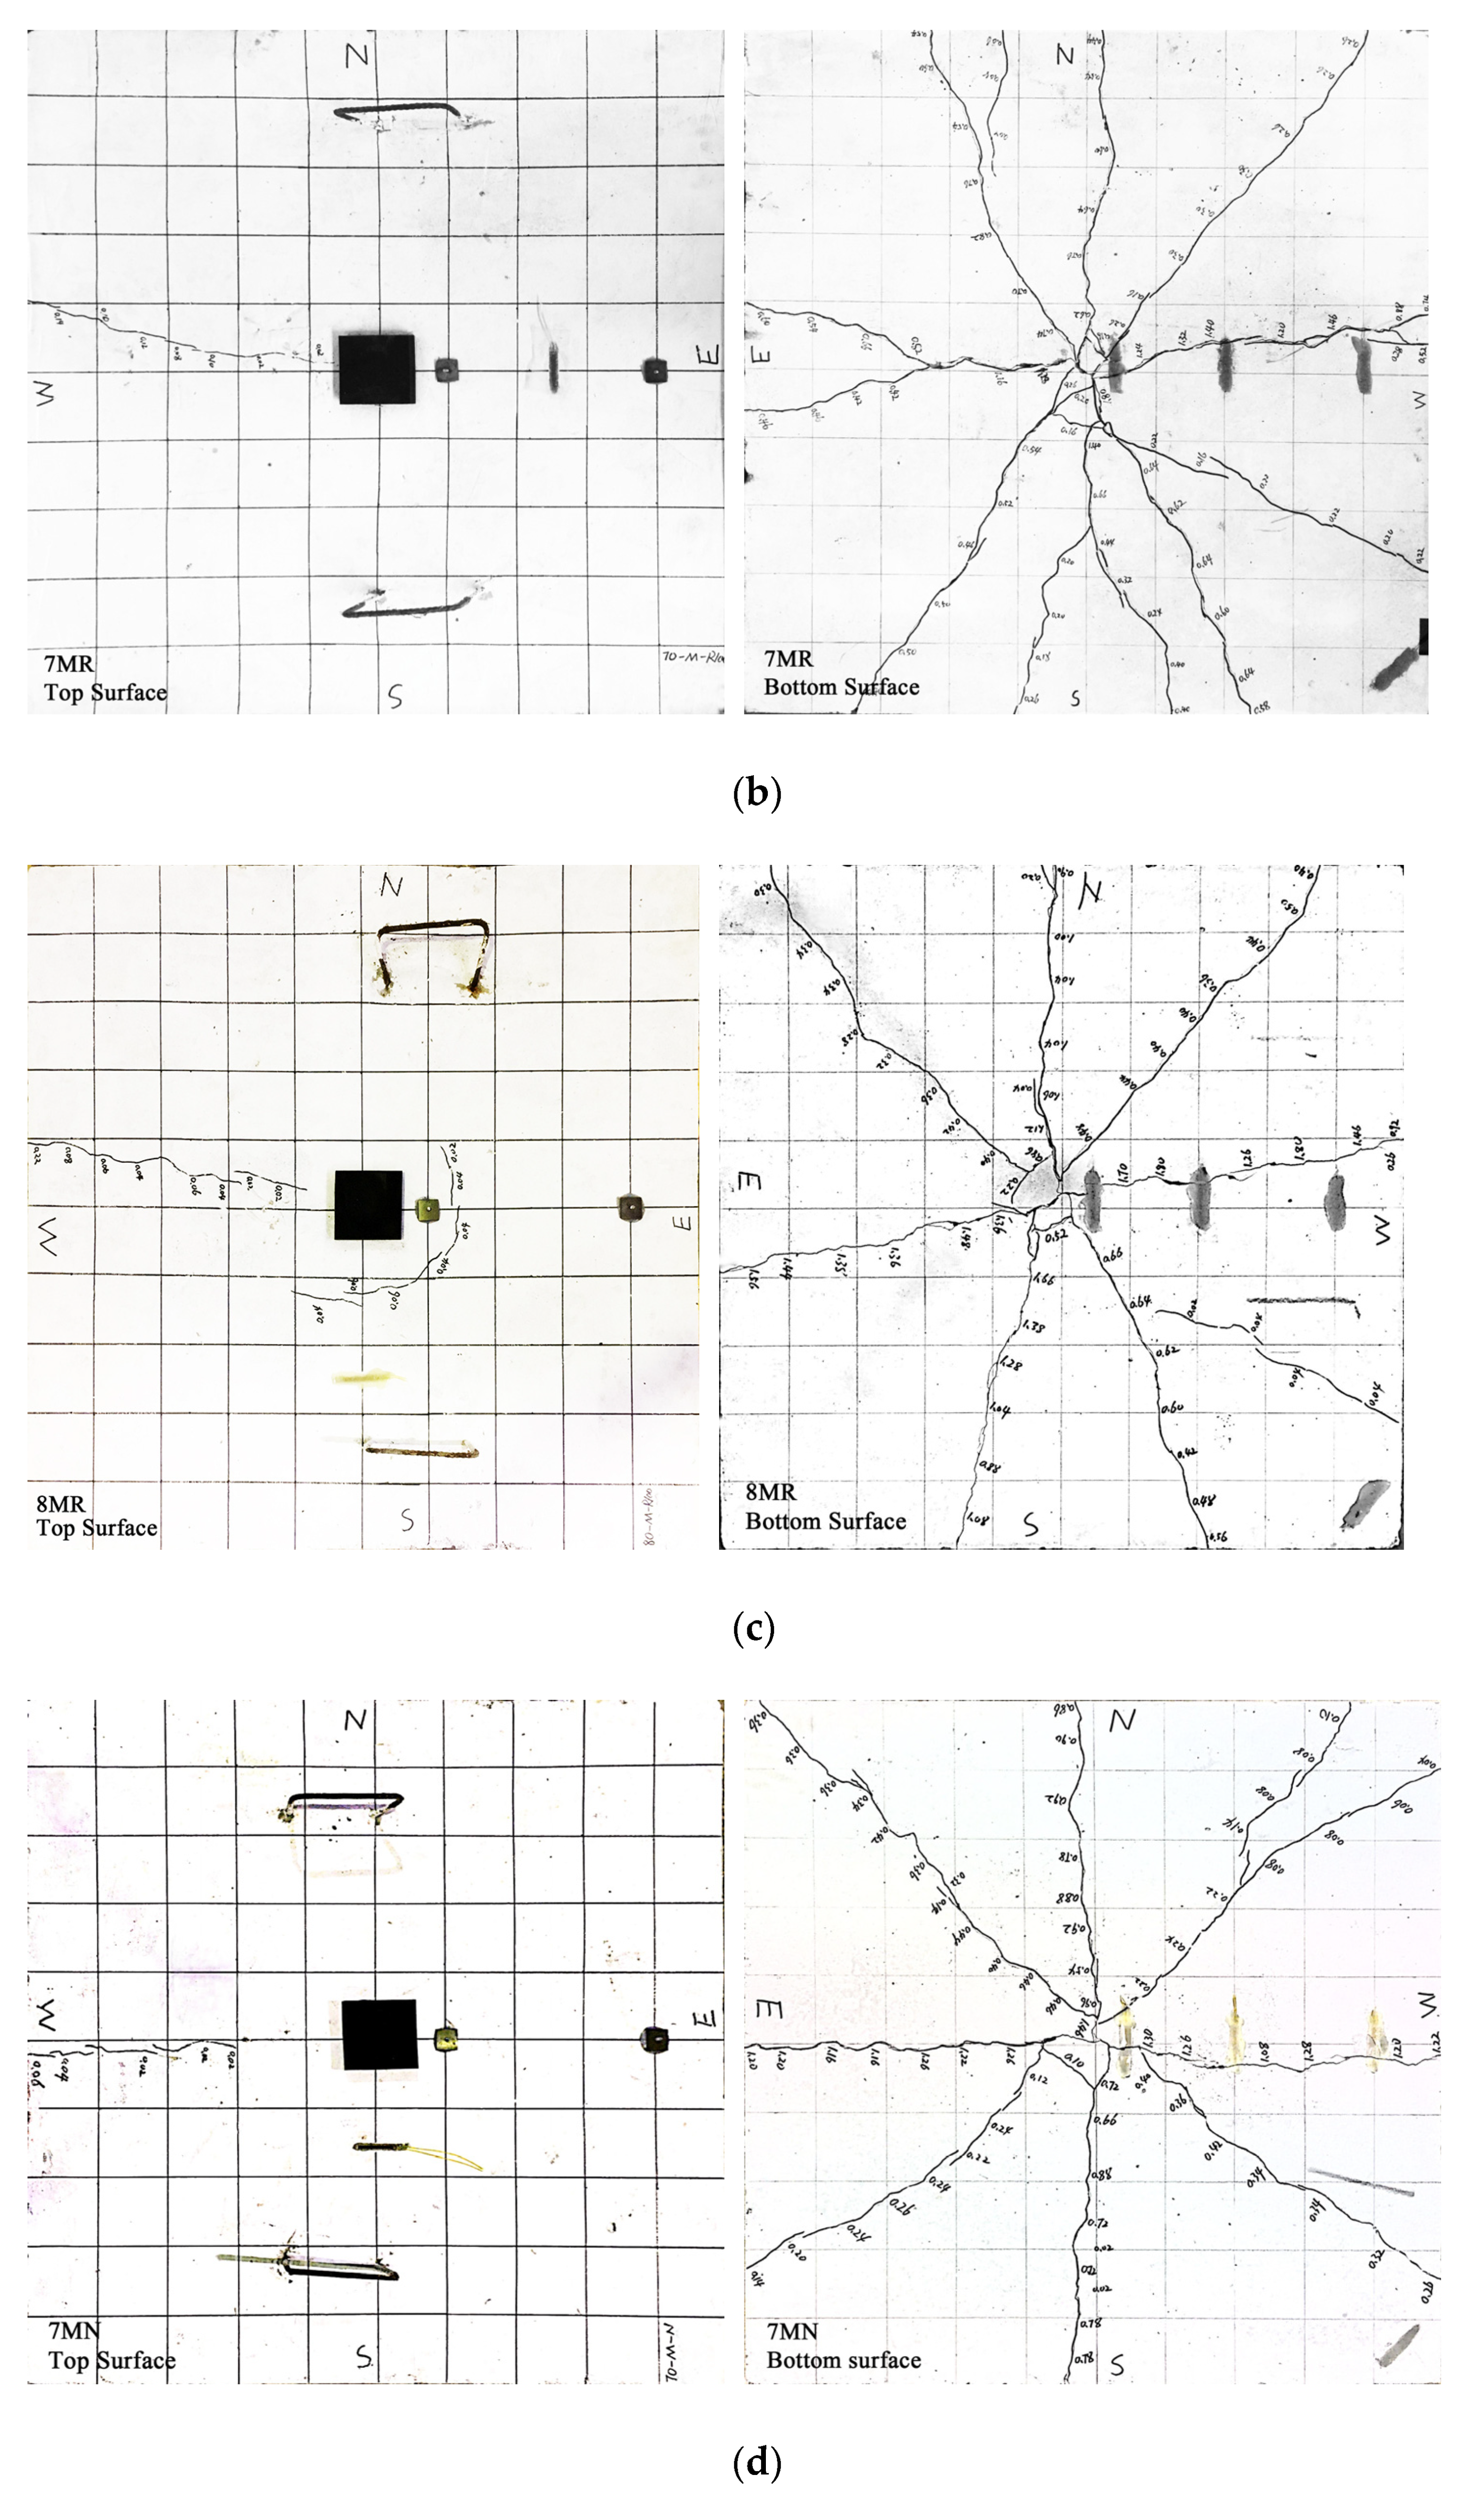
All RCP specimens had similar crack patterns on the bottom surface, and the number of cracks decreased with the increase in the slab thickness. The reinforcement arrangement could affect the crack pattern; circumferential cracks on the top surface appeared in the 7M1R slab with 100 mm reinforced spacing, and similar cracks were not found in the 7MR slab with 150 mm reinforced spacing.
(4)
The reinforcement ratio played an important role in peak deflection and residual displacement. As the reinforcement ratio increased from 0.48% to 0.72%, the peak and residual displacements at D1 point decreased by 7.0% and 12.2%, respectively. The global flexural response could be observed in the RCP specimens. Microscopic punching shear failure modes were observed only in the 8MR and 7M1R specimens.
(5)
The 7MN specimen showed lower peak and residual displacement and higher peak impact force compared to the 7MR specimen, but no significant difference was observed between damage characteristics and crack patterns in the 7MR and 7MN specimens.
(6)
The influence of using RAC in RCP was relatively small, even at 100% RCA replacement ratio, and the impact of using RCA was diminished for RCP made with 100 mm longitudinal reinforcement spacing.
However, due to the limited investigation conducted here, further research is being recommended to increase the database of test results for the RCP. This study was designed so that the RCP impact occurred at the center of the slab; however, in the real world, the impact can take place at other locations as well, and the response of the slabs under such conditions may be significantly different.

Author Contributions

J.Y. and J.W. collected scientific articles to ascertain the state of the art. J.Y. performed the analyses, analyzed the results, and contributed to the writing of the paper. J.W. organized the work and contributed to the analyses of the results. T.S. and D.L. revised the paper for overall consistency and scope. All authors have read and agreed to the published version of the manuscript.

Funding

This research was funded by the National Key R&D Plan for 13th Five-year Plan of China (2018YFD1101001).

Institutional Review Board Statement

Not applicable.

Informed Consent Statement

Not applicable.

Data Availability Statement

The data presented in this study are available on request from the corresponding author. The data are not publicly available due to privacy reasons.

Acknowledgments

This work was supported by the sub-project of the “13th Five-Year Plan” National Key R & D Plan in China (2018YFD1101001-2), 2018–2022.

Conflicts of Interest

The authors declare no conflict of interest.

References

  1. Modarres, A.; Shabani, H. Investigating the effect of aircraft impact loading on the longitudinal top-down crack propagation parameters in asphalt runway pavement using fracture mechanics. Eng. Fract. Mech. 2015, 150, 28–46. [Google Scholar] [CrossRef]
  2. MH/T5004; Specifications for Airport Cement Concrete Pavement Design. CAAC (Civil Aviation Administration of China): Beijing, China, 2010.
  3. AC 150/5320-6E; Airport Pavement Design and Evaluation. FAA (Federal Aviation Administrator): Washington, DC, USA, 2009.
  4. Choi, P.; Kim, D.; Lee, B.; Won, M. Evaluation of structural responses of continuously reinforced concrete pavement (CRCP) using falling weight deflectometer. Can. J. Civ. Eng. 2016, 43, 28–39. [Google Scholar] [CrossRef]
  5. Salles, L.; Khazanovich, L.; Balbo, J. Structural analysis of transverse cracks in short continuously reinforced concrete pavements. Int. J. Pavement Eng. 2020, 21, 1853–1863. [Google Scholar] [CrossRef]
  6. Hertz, H. Uber das Gleichgewicht Schwinnender elastischer platten. Wiedermann’s Ann. Cler Phys. Und Chem. 1884, 22, 449–455. [Google Scholar]
  7. Westergaard, H.M. Stresses in concrete pavements computed by theoretical analysis. Public Roads 1921, 8, 54–60. [Google Scholar]
  8. Khazanovich, L.; Selezneva, O.; Yu, H.T.; Darter, M.I. Development of Rapid Solutions for Prediction of Critical Continuously Reinforced Concrete Pavement Stresses. Transp. Res. Rec. J. Transp. Res. Board 2001, 1778, 64–72. [Google Scholar] [CrossRef]
  9. William, G.W.; Shoukry, S.N. 3D Finite Element Analysis of Temperature-Induced Stresses in Dowel Jointed Concrete Pavements. Int. J. Geomech. 2001, 3, 291–308. [Google Scholar] [CrossRef]
  10. Davids, W.; Wang, Z.; Turkiyyah, G.; Mahoney, J.P.; Bush, D. Three-Dimensional finite element analysis of jointed plain concrete pavement with everfe2.2. Transp. Res. Rec. J. Transp. Res. Board 2003, 1853, 92–99. [Google Scholar] [CrossRef]
  11. Yang, G.; Bradford, M.A. A refined modelling for thermal-induced upheaval buckling of continuously reinforced concrete pavements. Eng. Struct. 2017, 150, 256–270. [Google Scholar] [CrossRef]
  12. Rahal, K. Mechanical properties of concrete with recycled coarse aggregate. Build. Environ. 2007, 42, 407–415. [Google Scholar] [CrossRef]
  13. Li, J.; Xiao, H.; Zhou, Y. Influence of coating RA surface with pozzolanic powder on properties of RAC. Build. Environ. 2009, 23, 1287–1291. [Google Scholar] [CrossRef]
  14. Chen, Y.; Chen, Z.; Xu, J.; Lui, E.M.; Wu, B. Performance evaluation of recycled aggregate concrete under multiaxial compression. Constr. Build. Mater. 2019, 229, 116935. [Google Scholar] [CrossRef]
  15. Mas, B.; Cladera, A.; Olmo, T.; Pitarch, F. Influence of the amount of mixed RAs on the properties of concrete for non-structural use. Constr. Build. Mater. 2017, 27, 612–622. [Google Scholar] [CrossRef]
  16. Francesconi, L.; Pani, L.; Stochino, F. Punching shear strength of reinforced recycled concrete slabs. Constr. Build. Mater. 2016, 127, 248–263. [Google Scholar] [CrossRef]
  17. Rahal, K.; Alrefaei, Y. Shear strength of longitudinally reinforced recycled aggregate concrete beams. Eng. Struct. 2017, 145, 273–282. [Google Scholar] [CrossRef]
  18. Arezoumandi, M.; Drury, J.; Volz, J.S.; Khayat, K.H. Effect of recycled concrete aggregate replacement level on shear strength of reinforced concrete beams. Mater. J. 2015, 112, 559–567. [Google Scholar] [CrossRef]
  19. Schubert, S.; Hoffmann, C.; Leemann, A.; Moser, K.; Motavalli, M. Recycled aggregate concrete: Experimental shear resistance of slabs without shear reinforcement. Eng. Struct. 2012, 41, 490–497. [Google Scholar] [CrossRef]
  20. Brandes, M.R.; Kurama, Y.C. Behavior of shear-critical prestressed concrete beams with recycled concrete aggregates under ultimate loads. Eng. Struct. 2018, 165, 237–246. [Google Scholar] [CrossRef]
  21. Alnahhal, W.; Aljidda, O. Flexural behavior of basalt fiber reinforced concrete beams with recycled concrete coarse aggregates. Constr. Build. Mater. 2018, 169, 165–178. [Google Scholar] [CrossRef]
  22. Kantar, E.; Yuen, T.; Kobya, V.; Kuang, J. Impact dynamics and energy dissipation capacity of fibre-reinforced self-compacting concrete plates. Constr. Build. Mater. 2017, 138, 383–397. [Google Scholar] [CrossRef]
  23. Zineddin, M.; Krauthammer, T. Dynamic response and behavior of reinforced concrete slabs under impact loading. Int. J. Impact Eng. 2007, 34, 1517–1534. [Google Scholar] [CrossRef]
  24. Zineddin, M. Behavior of Structural Concrete Slabs under Localized Impact. Ph.D. Thesis, The Pennsylvania State University, State College, PA, USA, 2002. [Google Scholar]
  25. Othman, H.; Marzouk, H. An experimental investigation on the effect of steel reinforcement on impact response of reinforced concrete plates. Int. J. Impact Eng. 2016, 88, 12–21. [Google Scholar] [CrossRef]
  26. Xiao, Y.; Li, B.; Fujikake, K. Experimental Study of Reinforced Concrete Slabs under Different Loading Rates. ACI Struct. J. 2016, 113, 157–168. [Google Scholar] [CrossRef]
  27. Xiao, Y.; Li, B.; Fujikake, K. Behavior of Reinforced Concrete Slabs under Low-Velocity Impact. ACI Struct. J. 2017, 114, 643–658. [Google Scholar] [CrossRef]
  28. Özgür Anil Kantar, E.; Yilmaz, M.C. Low velocity impact behavior of RC slabs with different support types. Constr. Build. Mater. 2015, 93, 1078–1088. [Google Scholar] [CrossRef]
  29. Chiaia, B.; Kumpyak, O.; Placidi, L.; Maksimov, V. Experimental analysis and modeling of two-way reinforced concrete slabs over different kinds of yielding supports under short-term dynamic loading. Eng. Struct. 2015, 96, 88–99. [Google Scholar] [CrossRef]
  30. Husem, M.; Cosgun, S.I. Behavior of reinforced concrete plates under impact loading: Different support conditions and sizes. Comput. Concrete. 2016, 18, 389–404. [Google Scholar] [CrossRef]
  31. Hrynyk, T.; Vecchio, F. Behavior of steel fiber-reinforced concrete slabs under impact load. ACI Struct. J. 2014, 111, 1213–1223. [Google Scholar] [CrossRef]
  32. Beckmann, B.; Hummeltenberg, A.; Weber, T.; Curbach, M. Strain Behaviour of Concrete Slabs under Impact Load. Struct. Eng. Int. 2018, 22, 562–568. [Google Scholar] [CrossRef]
  33. Al-Rousan, R.Z.; Alhassan, M.A.; Al-Salman, H. Impact resistance of polypropylene fiber reinforced concrete two-way slabs. Struct. Eng. Mech. 2017, 62, 373–380. [Google Scholar] [CrossRef]
  34. Ong, K.C.G.; Basheerkhan, M.; Paramasivam, P. Resistance of fibre concrete slabs to low velocity projectile impact. Cem. Concr. Compos. 1999, 21, 391–401. [Google Scholar] [CrossRef]
  35. Wu, J. Development of Advanced Pavement Materials System for Blast Load. Ph.D. Thesis, National University of Singapore, Singapore, 2012. [Google Scholar]
  36. Cai, J.; Wong, L.N.Y.; Hua, W.Y. Dynamic response of airport concrete pavement to impact loading. Adv. Mater. Res. 2012, 594, 1395–1401. [Google Scholar] [CrossRef]
  37. Guo, J. Research on Dynamic Response of Recycled Aggregate Concrete Beam under Impact Action. Ph.D. Thesis, South China University of Technology, Guangzhou, China, 2016. [Google Scholar]
  38. Vali, N.M.; Babu, B.M. Impact strength assessment of recycle aggregate concrete slabs. Int. J. Sci. Res. Dev. 2016, 9, 225–228. [Google Scholar]
  39. Ramana NVSubbareddy, Y.V.; Sashidhar, C. Impact resistance of steel fiber reinforced recycle aggregate concrete beams. Int. J. Res. Appl. Sci. Eng. Technol. 2017, 5, 1919–1927. [Google Scholar]
  40. Zhou, C.; He, W.C.; Kong, X.Q.; Zheng, Z.Y.; Wang, X.Z. Study on impact behavior of steel fiber recycled concrete. Concrete 2021, 379, 36–41. [Google Scholar]
  41. Weng, X.H. Design of Airport Pavement; Communications Press Co. Ltd.: Beijing, China, 2017. [Google Scholar]
  42. Isaac, P.; Darby, A.; Ibell, T.; Evernden, M. Experimental investigation into the force propagation velocity due to hard impacts on reinforced concrete members. Int. J. Impact Eng. 2017, 100, 131–138. [Google Scholar] [CrossRef]
  43. Soleimani, S.; Banthia, N. A novel drop weight impact setup for testing reinforced concrete beams. Exp. Tech. 2014, 38, 72–79. [Google Scholar] [CrossRef]
  44. Christoforou, A.; Yigit, A. Effect of flexibility on low velocity impact response. J. Sound Vibration 1998, 217, 563–578. [Google Scholar] [CrossRef]
  45. Wang, Y.; Qian, X.; Liew, J.; Zhang, M. Impact of cement composite filled steel tubes: An experimental, numerical and theoretical treatise. Thin-Walled Struct. 2015, 87, 76–88. [Google Scholar] [CrossRef]
  46. Johnson, K.L. Contact Mechanics; Cambridge University Press: Cambridge, UK, 1985; pp. 119–124. [Google Scholar]
  47. Othman, H.; Marzouk, H. Impact response of Ultra-High-Performance reinforced concrete plates. ACI Struct. J. 2016, 113, 1–10. [Google Scholar] [CrossRef]
  48. Micallef, K.; Sagaseta, J.; Ruiz, M.F.; Muttoni, A. Assessing punching shear failure in reinforced concrete flat slabs subjected to localised impact loading. Int. J. Impact Eng. 2014, 71, 17–33. [Google Scholar] [CrossRef]
  49. Martín-Morales, M.; Zamorano, M.; Ruiz-Moyano, A.; Valverde-Espinosa, A. Characterization of recycled aggregates construction and demolition waste for concrete production following the Spanish Structural Concrete Code EHE-08. Constr. Build. Mater. 2011, 25, 742–748. [Google Scholar] [CrossRef]
  50. Chen, Y.; May, I. Reinforced concrete members under drop-weight impacts. Proc. Inst. Civ. Eng. Struct. Build. 2009, 162, 45–56. [Google Scholar] [CrossRef]
  51. Fonseca, N.; de Brito, J.; Evangelista, L. The influence of curing conditions on the mechanical performance of concrete made with recycled concrete waste. Cem. Concr. Compos. 2011, 33, 637–643. [Google Scholar] [CrossRef]
  52. Kou, S.; Poon, C. Long-term mechanical and durability properties of RAC prepared with the incorporation of fly ash. Cem. Concr. Compos. 2012, 37, 12–19. [Google Scholar] [CrossRef]
  53. Clough, R.; Penzien, J. Dynamics of Structures, 2nd ed.; McGraw-Hill: New York, NY, USA, 1995. [Google Scholar]
Figure 1. Grading of coarse aggregates.
Applsci 12 08804 g001
Figure 2. Size and reinforcement layout of RCP specimen (mm).
Applsci 12 08804 g002
Figure 3. Casting of RCP specimen.
Applsci 12 08804 g003
Figure 4. Casting of RCP specimen.
Applsci 12 08804 g004
Figure 5. Experimental setup.
Applsci 12 08804 g005
Figure 6. Acceleration-time histories of the (a) 6MR specimen, (b) 7MR specimen, (c) 8MR specimen, (d) 7MN specimen, and (e) 7M1R specimen.
Applsci 12 08804 g006aApplsci 12 08804 g006b
Figure 7. Integration areas of the inertial force.
Applsci 12 08804 g007
Figure 8. Peak impact load and peak inertial force.
Applsci 12 08804 g008
Figure 9. Sketched cracks profiles of the (a) 6MR specimen, (b) 7MR specimen, (c) 8MR specimen, (d) 7MN specimen, and (e) 7M1R specimen.
Applsci 12 08804 g009aApplsci 12 08804 g009bApplsci 12 08804 g009c
Figure 10. Radial cracks extending from the bottom to the top.
Applsci 12 08804 g010
Figure 11. Displacement -time histories of the (a) 6MR specimen, (b) 7MR specimen, (c) 8MR specimen, (d) 7MN specimen, and (e) 7M1R specimen.
Applsci 12 08804 g011aApplsci 12 08804 g011b
Figure 12. Deflected shapes of the (a) 6MR specimen, (b) 7MR specimen, (c) 8MR specimen, (d) 7MN specimen, and (e) 7M1R specimen.
Applsci 12 08804 g012
Figure 13. Concrete strain and steel strain of 7MR specimen (a) overall, and (b) in detail.
Applsci 12 08804 g013
Figure 14. S1 steel strain under first impact.
Applsci 12 08804 g014
Table 1. Properties of cement.
Loss on
Ignition
(%)
Initial Setting Time
(min)
Final Setting Time
(min)
Specific
Surface Area
(m2/kg)
Compressive Strength (Mpa)Flexural Strength
(Mpa)
7 Days28 Days7 Days28 Days
2.3517029033727.345.65.68.2
Table 2. Physical properties of coarse aggregate.
Type of Coarse
Aggregate
Apparent Density (g/m3)Clay Content (%)Water Absorption (%)Crushing Value Index (%)
NCA26440.60.98.2
RCA25671.23.414.5
Table 3. Matrix proportions of different mixes.
Type of
Concrete
Cement
(kg/m3)
Fine Aggregate
(kg/m3)
Coarse
Aggregate(kg/m3)
Water (kg/m3)Water-Cement RatioSand Rate (%)
NAC18.5722.1046.967.800.4232
RAC22.2921.0344.697.800.3532
Table 4. Mechanical properties of concrete.
Type of
Concrete
Compressive Strength, 28 DaysSplit Tensile Strength, 28 DaysFlexural Strength, 28 Days
Mean
(Mpa)
Standard
Deviation
Mean
(Mpa)
Standard
Deviation
Mean
(Mpa)
Standard
Deviation
NAC46.801.6943.550.1415.640.303
RAC48.281.2363.210.1725.440.376
Table 5. Summary of RCP specimen.
RCP SpecimenThickness
(mm)
Type of ConcreteBar Spacing (mm)Average Compressive Strength (Mpa)Maturing Age
6MR60RAC15048.671 year, 11 days
7MR70RAC15048.731 year, 8 days
8MR80RAC15047.781 year, 9 days
7MN70NAC15047.211 year, 11 days
7M1R70RAC10049.431 year, 11 days
Table 6. Impact force characteristics of RCP specimen.
RCP
Specimen
Fim,p
(kN)
Fin,p
(kN)
Ip
(kN.s)
Vr
(m/s)
Eim
(J)
Eab
(J)
Eab/Eim
(%)
6MR206.185.91143.41.2921960.01793.091.5
7MR175.9110.71148.51.3151960.01787.091.2
8MR150.9116.11153.01.3381960.01781.090.9
7MN200.2105.11151.11.3281960.01783.591.0
7M1R220.5111.71198.51.5651960.01715.087.5
Fim,p: peak impact force; Fin,p: peak inertial force; Ip: impulse; vr: rebound velocity; Eim: impact energy; Eab: absorbed energy.
Table 7. Final crack properties of all RCP specimens.
RCP
Specimen
Bottom SurfaceTop Surface
Crack PatternNum of CrackMaximum Crack WidthsCrack PatternNum of CackMaximum Crack Widths
6MRradial crack, diagonal crack211.60radial crack10.08
7MRradial crack, diagonal crack91.80radial crack10.12
8MRradial crack, diagonal crack71.80circumferential crack
radial crack
20.08
7MNradial crack, diagonal crack81.46radial crack20.06
7M1Rradial crack, diagonal crack141.50circumferential crack
radial crack
20.04
Table 8. Displacement response of all tested specimens.
RCP SpecimenD1D2
ωp1ωr1ωfr1ωp2ωr2ωfr2
6MR15.877.469.249.805.046.83
7MR16.407.549.679.754.675.83
8MR17.108.4710.4211.615.917.89
7MN14.606.848.5010.555.276.23
7M1R15.256.638.1611.535.346.66
ωp1 and ωp2: the peak displacement at D1 point and D2 point, respectively; ωr1 and ωr2: the residual displacement under first impact at D1 point and D2 point, respectively; ωfr1 and ωfr2: the final cumulated residual displacement at D1 point and D2 point, respectively.
Publisher’s Note: MDPI stays neutral with regard to jurisdictional claims in published maps and institutional affiliations.

